

Abstract
Severity stratification and prognostic prediction at early stage is crucial for reducing the rates of mortality of patients with acute pancreatitis (AP). We aim to investigate the predicting performance of neutrophil-lymphocyte ratio (NLR), platelet-lymphocyte ratio (PLR), and red-cell distribution width (RDW) combined with severity scores (sequential organ failure assessment [SOFA], bed-side index for severity of AP [BISAP], Ranson criteria, and acute physiology and chronic health evaluation II [APACHE II]) for severe AP (SAP) and mortality.
A total of 406 patients diagnosed with AP admitted in a tertiary teaching hospital were enrolled. Demographic information and clinical parameters were retrospectively collected and analyzed. NLR, PLR, RDW, blood urea nitrogen (BUN), and AP severity scores (SOFA, BISAP, Ranson, and APACHE II) were compared between different severity groups and the survival and death group. Receiver-operating characteristic (ROC) curves for SAP and 28-day mortality were calculated for each predictor using cut-off values. Area under the curve (AUC) analysis and logistic regression models were performed to compare the performance of laboratory biomarkers and severity scores.
Our results showed that NLR, PLR, RDW, glucose, and BUN level of the SAP group were significantly increased compared to the mild acute pancreatitis (MAP) group on admission (P < .001). The severity of AP increased as the NLR, SOFA, BISAP, and Ranson increased (P < .01). The AUC values of NLR, PLR, RDW, BUN, SOFA, BISAP, Ranson, and APACHE II to predict SAP were 0.722, 0.621, 0.787, 0.677, 0.806, 0.841, 0.806, and 0.752, respectively, while their AUC values to predict 28-day mortality were 0.851, 0.693, 0.885, 0.765, 0.968, 0.929, 0.812, and 0.867, respectively. BISAP achieved the highest AUC, sensitivity and NPV in predicting SAP, while SOFA is the most superior in predicting mortality. The combination of BISAP + RDW achieved the highest AUC (0.872) in predicting SAP and the combination of SOFA + RDW achieved the highest AUC (0.976) in predicting mortality. RDW (OR = 1.739), SOFA (OR = 1.554), BISAP (OR = 2.145), and Ranson (OR = 1.434) were all independent risk factors for predicting SAP, while RDW (OR = 7.361) and hematocrit (OR = 0.329) were independent risk factors for predicting mortality by logistic regression model.
NLR, PLR, RDW, and BUN indicated good predictive value for SAP and mortality, while RDW had the highest discriminatory capacity. RDW is a convenient and reliable indicator for prediction not only SAP, but also mortality.
Keywords: acute pancreatitis, prognosis, red-cell distribution width, severity
1. Introduction
Acute pancreatitis (AP), one of the most common diseases of the gastrointestinal tract, is a rapidly developed inflammatory process of the pancreas that varies in terms of clinical presentation and severity. The incidence of AP varies between 4.9 and 73.4 cases per 100,000 individuals worldwide.[1] Although in the majority of patients the disease is mild and associated with good prognosis, 15% to 20% of patients with AP develop into severe clinical course with higher morbidity and mortality rates. Two peaks of mortality have been recognized and reported in patients presenting with severe acute pancreatitis (SAP).[2] Early death usually happens as a result of multiple organ dysfunction syndrome (MODS) due to systemic inflammatory response syndrome (SIRS) caused by the release of various of cytokines in the first 2 weeks, while about half of patients die 2 weeks later owing to peripancreatic necrosis, infection, and secondary MODS.[2–4]
It is of vital significance to recognize patients at risk of developing SAP at early phase to initiate timely treatment and optimize therapy. Nowadays, a serious of severity scoring systems have been proposed and accepted to assess and stratify the severity of AP.[2] Among them, acute physiology and chronic health evaluation II (APACHE II) system, Ranson criteria, and bedside index for severity in acute pancreatitis (BISAP) score are the most widely utilized in routine clinical practice. Moreover, researches in recent years proved that sequential organ failure assessment (SOFA) score was easier to apply and was a reliable predictor for mortality in AP.[2,5] However, the Ranson criteria can only be determined after 48 hours of inpatient observation, while the APACHE II scoring system uses a point score based upon initial values of 12 routine physiologic measurements and is very complex to use.[6] The BISAP predicts severity, organ failure and death in AP very well and is as good as APACHE II,[7] but it is also reported to have a suboptimal sensitivity for mortality as well as SAP.[8] Regrettably, universally adopted criteria does not exist owing to their more parameters, low sensitivity, and the complex for quick evaluation.[8] Therefore, novel and uncomplicated predictors are needed to complement scoring systems.
There has been considerable interest in the development of rapid biomarkers for reliable prognosis prediction for AP. Many direct or combined markers of systemic inflammation are based on routine, inexpensive and readily available laboratory tests, including the neutrophil-lymphocyte ratio (NLR), platelet-lymphocyte ratio (PLR), and red-cell distribution width (RDW). Elevation of the NLR during the first 48 hours of admission is significantly associated with SAP and is an independent negative prognostic indicator in AP.[9] NLR represents an inexpensive, readily available test with a promising value to predict disease severity in hypertriglyceridemia-induced AP. Moreover, previous study indicated that both NLR and PLR can predict the severity of gallstone AP.[10] RDW reflects the variability of the size of the circulating erythrocytes. Preliminary study demonstrates that RDW is positively associated with AP severity, and is likely a useful predictive parameter of AP severity.[11] However, previous studies are inconsistent in regard to their discriminatory ability in predicting prognosis of patients with AP.
The purpose of this study is to investigate the risk stratification and prognostic prediction value of NLR, PLR, RDW, and a serious of severity scoring systems for AP (Ranson, BISAP, APACHE II, and SOFA) at early phase of disease.
2. Methods
Adult patients diagnosed with AP admitted to the Emergency Department of Beijing Chao-yang Hospital between January 2014 and December 2017 were enrolled. AP was diagnosed and stratified according to the 2012 revision of the Atlanta classification and definitions by the international consensus.[12] The diagnosis of AP requires 2 of the following three features: abdominal pain consistent with AP (acute onset of a persistent, severe, epigastric pain often radiating to the back); serum lipase activity (or amylase activity) at least 3 times greater than the upper limit of normal; characteristic findings of AP on contrast-enhanced computed tomography and less commonly magnetic resonance imaging or trans-abdominal ultrasonography.[12] Patients were divided into mild AP (MAP), moderately severe AP (MSAP), and SAP. MAP was defined as an absence of organ failure and an absence of local or systemic complications. MSAP was defined as no evidence of persistent organ failure, but the presence of local or systemic complications and/or organ failure resolved within 48 hours. SAP was defined as persistent organ failure (>48 hours).[12] Patients with recurrent pancreatitis were enrolled only at 1st admission. The following patients were excluded from this study: age <18 years old, patients with metastatic tumor, acquired immunodeficiency syndrome, uremia, late stage of liver cirrhosis, active tuberculosis, refractory heart failure, previous transplantation, immunosuppressive therapy and pregnancy, patients with chronic pancreatitis or pancreas carcinoma, patients from hospice or patients with do-not-resuscitate request.
Demographics information of all enrolled patients were collected and recorded on admission. Clinical (blood pressure, respiratory rate, pulse rate) and laboratory parameters (white blood cell count, neutrophil count, lymphocyte count, hemoglobin level, platelet level, RDW level, hematocrit (HCT), renal function, hepatic function, electrolytes, arterial blood gas) were assessed and recorded. NLR, PLR, SOFA score, BISAP score, APACHE II score at admission, and Ranson score at 48 hour after admission were all calculated according to international criteria and analyzed. The SOFA score, BISAP score, and APACHE II score were evaluated at admission using the worst parameters available in the first 24 hours. Patients with AP were followed up for 28 days and the 28-day mortality were recorded. All patients were divided into survival group and death group according to their prognosis.
Continuous variables were presented as the mean ± standard deviation and compared using 1-way analysis of variance for the normally distributed data. For skewed distributions, the data are presented as the median (interquartile range) and compared using Mann-Whitney U nonparametric test. The categorical variables were described as percentages and compared using the Chi-squared test or Fisher exact test. Multivariate logistic regression analyses were performed to assess the potential determinants for severity stratification and prognostic prediction of AP by unadjusted and adjusted models successively. All analyses were performed using SPSS 22.0 statistical software package (SPSS Inc, Chicago, IL). Receiver operating characteristic (ROC) analysis was carried out and area under the curve (AUC) was compared using MedCalc 15.0 Software (Acacialaan, Ostend, Belgium) to evaluate the predicting ability of NLR, PLR, RDW, and AP severity scores. Based on the cut-off values, sensitivity, specificity, positive predictive value (PPV), and negative predictive value (NPV) were also calculated. A Z test was used for comparing the AUCs between different curves. The Bonferroni method was used adjust for multiple comparisons. A 2-tailed value of P < .05 was considered statistically significant.
3. Ethics
This study was approved by the Institutional Review Board and Medical Ethics Committee of Beijing Chao-yang Hospital, Capital Medical University, which is an urban university hospital with approximately 250,000 ED admissions every year. The requirement for written informed consent was waived because of the retrospective design of this study.
4. Results
A total of 472 patients with AP were evaluated at recruitment. Sixty-six patients were excluded, of which three were pregnant, 2 were diagnosed with pancreatic carcinoma, 10 had recurrent pancreatitis, and 51 were with incomplete medical information or were lost for follow-up. A total of 406 patients with AP were included finally who met all inclusion criteria of our study. Of them, 56 patients were classified as SAP and 14 patients died after 28-day follow-up (Tables 1 and 2). The total mortality rate was 3.45% (14/406). The overall mean age of patients with AP was 57 (44–71) years old and the male to female ratio was 1.48:1 (242/164). Etiology of AP included biliary (212 cases), alcoholic (16 cases), hyper-triglyceridemic (128 cases), and others (50 cases). Comorbidities of patients with AP included biliary tract disease, cerebral vascular diseases, cardiovascular diseases, chronic renal diseases and diabetes. There was no statistical significance between different severity groups or death and survival group in age and male to female ratio (Tables 1 and 2).
Table 1.
Baseline characteristics of patients with acute pancreatitis in different severity groups.

Table 2.
Baseline characteristics of patients with acute pancreatitis between the survival group and death group.

Regarding a variety of laboratory parameters, the NLR, PLR, RDW, glucose, and blood urea nitrogen (BUN) level of the SAP group were significantly increased compared to the MAP group on admission (P < .001) (Table 1). The severity of AP increased as the NLR, SOFA, BISAP, and Ranson increased (P < .01). There was no significant difference in APACHE II score between the MAP group and MSAP group (P = .123), while significant difference was found either between MAP and SAP group (P < .001) or between MSAP and SAP group (P < .001). The SAP group had significant lower calcium, HCT, and albumin level compared to MAP group (P < .001). No difference was detected between MAP group and MSAP group in PLR (P = .084), RDW (P = 1.000), BUN (P = .264), and ALB (P = 1.000).
There were significant differences between the survival group and death group in all laboratory parameters and severity scores studied (P < .05) (Table 2). The NLR, PLR, RDW, glucose, BUN, SOFA, BISAP, Ranson, and APACHE II in the death group were significantly higher than that in the survival group, while the calcium, HCT, and albumin level in the survival group were significantly lower than that in the death group.
The ROC curve analyses were used to evaluate the values of NLR, PLR, RDW, BUN, SOFA, BISAP, Ranson, and APACHE II to predict both SAP and death (Tables 3 and 4, and Figs. 1 and 2). The AUC values of NLR, PLR, RDW, BUN, SOFA, BISAP, Ranson, and APACHE II to predict SAP were 0.722, 0.621, 0.787, 0.677, 0.806, 0.841, 0.806, and 0.752, respectively (Table 3). The optimal cut-off values for parameters above were 10.310, 169.285, 13.350, 5.945, 2.5, 1.5, 3.5, and 6.5, respectively. BISAP achieved the highest AUC, sensitivity, and NPV in predicting SAP among single parameters. However, there was no significant difference between pairwise comparisons among BISAP, SOFA, and Ranson (BISAP vs SOFA, Z = 0.956, P = .339; BISAP vs Ranson, Z = 1.072, P = .284; SOFA vs Ranson, Z = 0.000, P = 1.000). BISAP, Ranson, and SOFA were all superior to RDW (P < .05). There was no significant difference between pairwise comparisons between SOFA and APACHE II (Z = 1.404, P = .160), Ranson and APACHE II (Z = 1.615, P = .106). Among the combinations of severity scores and RDW, the combination of BISAP + RDW achieved the highest AUC (0.872) (Fig. 3), while no difference was found between pairwise comparisons between BISAP + RDW, SOFA + RDW and Ranson + RDW. All 3 combinations were superior to single RDW (P < .0001). No obvious difference was found between RDW and NLR in predicting SAP (Z = 1.485, P = 0.137), while both of them were superior to PLR (P < .01).
Table 3.
Statistical data of receiver-operating characteristics curve comparisons of different parameters in predicting SAP.

Table 4.
Statistical data of receiver-operating characteristics curve comparisons of different parameters in predicting 28-day mortality of patients with AP.

Figure 1.
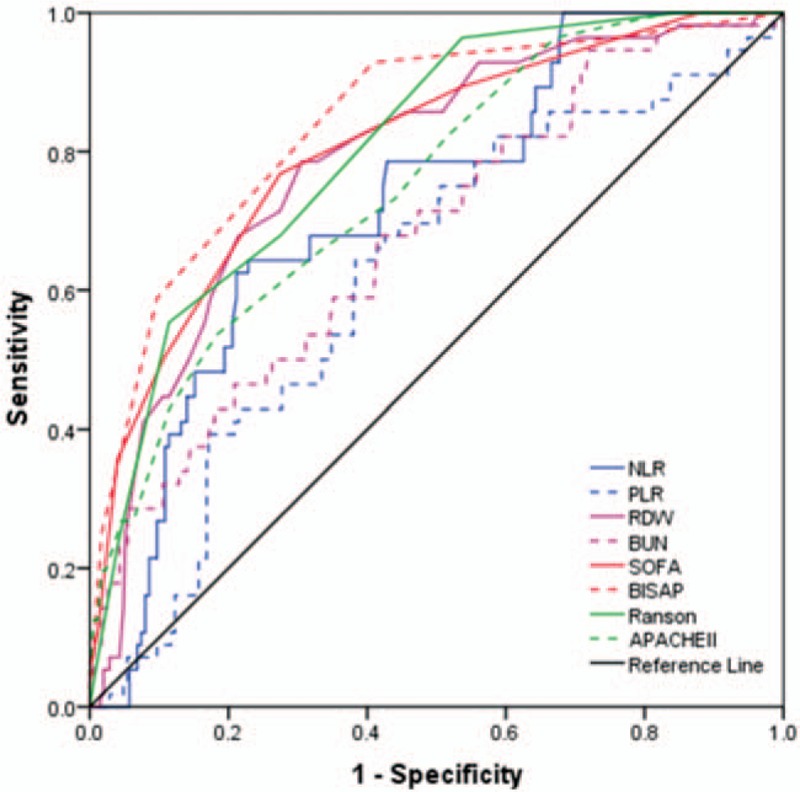
Receiver-operating characteristics curve comparisons of different parameters in predicting severe acute pancreatitis (AP). APACHE II = acute physiology and chronic health evaluation II, BISAP = bed-side index for severity of AP, BUN = blood urea nitrogen, NLR = neutrophil-lymphocyte ratio, PLR = platelet-lymphocyte ratio, RDW = red-cell distribution width, SOFA = sequential organ failure assessment.
Figure 2.
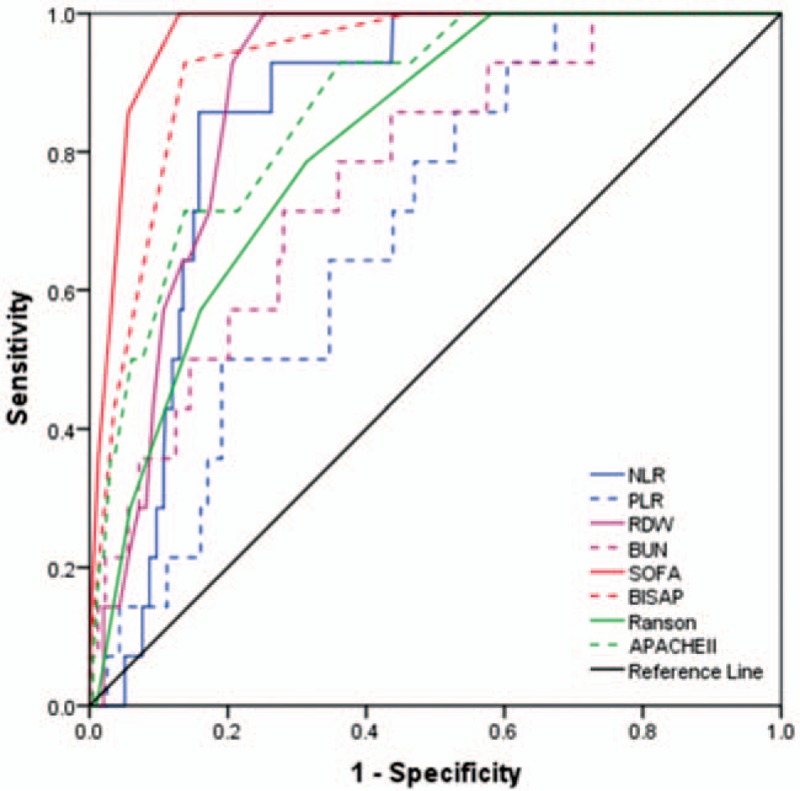
Receiver-operating characteristics curve comparisons of different parameters in predicting 28-day mortality of patients with acute pancreatitis (AP). APACHE II = acute physiology and chronic health evaluation II, BISAP = bed-side index for severity of AP, BUN = blood urea nitrogen, NLR = neutrophil-lymphocyte ratio, PLR = platelet-lymphocyte ratio, RDW = red-cell distribution width, SOFA = sequential organ failure assessment.
Figure 3.
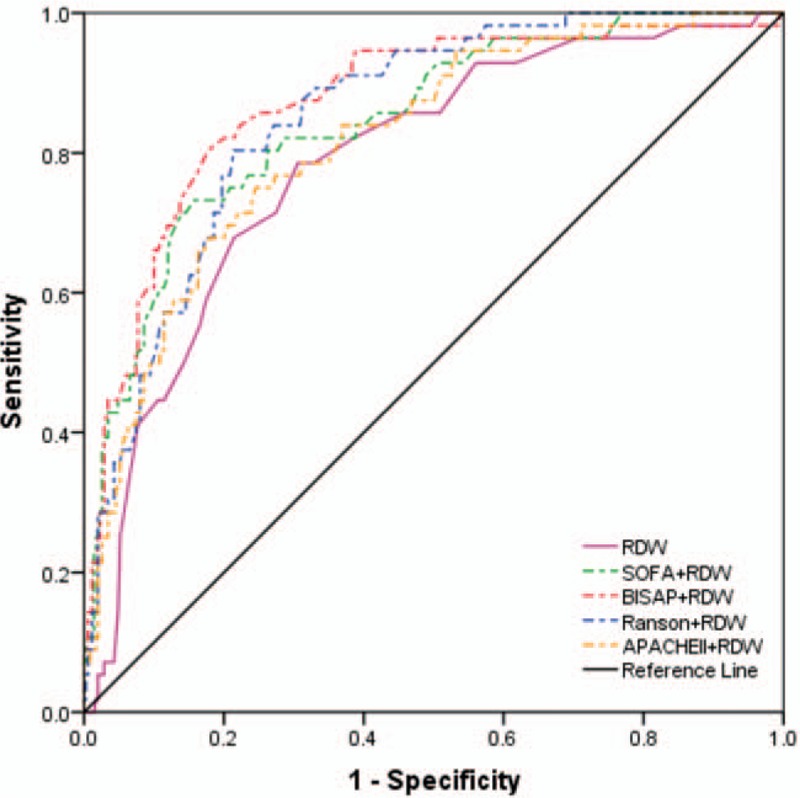
Receiver-operating characteristics curve comparisons of different combinations of red-cell distribution width and severity scores in predicting severe acute pancreatitis (AP). APACHE II = acute physiology and chronic health evaluation II, BISAP = bed-side index for severity of AP, BUN = blood urea nitrogen, NLR = neutrophil-lymphocyte ratio, PLR = platelet-lymphocyte ratio, RDW = red-cell distribution width, SOFA = sequential organ failure assessment.
The AUC values of NLR, PLR, RDW, BUN, SOFA, BISAP, Ranson, and APACHE II to predict 28-day mortality were 0.851, 0.693, 0.885, 0.765, 0.968, 0.929, 0.812, and 0.867, respectively (Table 4). The optimal cut-off values for parameters above were 12.195, 148.855, 13.550, 6.750, 3.5, 2.5, 2.5, and 7.5, respectively. SOFA achieved the highest AUC, sensitivity, and NPV among single parameters (0.968). Among the combinations of severity scores and RDW (Table 4, Fig. 4), SOFA + RDW achieved the highest AUC, sensitivity, and NPV, while no significant difference was found between SOFA + RDW and BISAP + RDW (Z = 1.684, P = .092). Either SOFA + RDW or BISAP + RDW showed superiority to single SOFA or RDW. Among single laboratory predictors, RDW and NLR achieved similar AUC (Z = 0.991, P = .322), while RDW was superior to PLR (Z = 3.270, P = 0.001) and BUN (Z = 2.001, P = .045).
Figure 4.
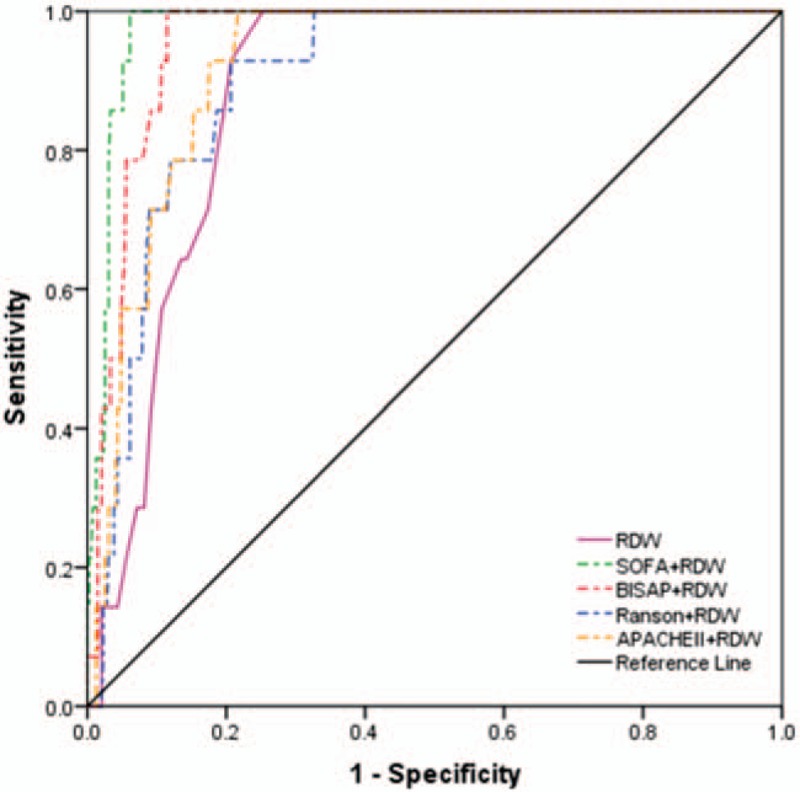
Receiver-operating characteristics curve comparisons of different combinations of red-cell distribution width and severity scores in predicting 28-day mortality. APACHE II = acute physiology and chronic health evaluation II, BISAP = bed-side index for severity of acute pancreatitis, RDW = red-cell distribution width, SOFA = sequential organ failure assessment.
All predictors were explored through multivariate logistic regression analyses, which revealed that RDW, SOFA, BISAP, and Ranson were all independent risk factors for predicting SAP. The odd ratios were 1.739, 1.554, 2.145, and 1.434, respectively. RDW and HCT entered logistic regression model and they were independent risk factors for predicting 28-day mortality of patients with AP, the odds ratios were 7.361 and 0.329, respectively (Table 5).
Table 5.
Independent predictive variables analyses by multivariate logistic regression.

5. Discussion
The results of our study revealed that the severity of AP increased as the SOFA, BISAP, and Ranson increased, while as to APACHE II score, differences were found between either MAP and SAP group or MSAP and SAP group. SOFA, BISAP, Ranson, and APACHE II in the death group were significantly higher than that in the survival group, these results demonstrated the discriminatory ability of these scores. ROC curve analyses demonstrated that BISAP score achieved the highest AUC among single predictors in predicting SAP, while SOFA score and Ranson criteria achieved similar results. The combination of severity scores and RDW improved their performance in predicting SAP, while BISAP + RDW, SOFA + RDW, and Ranson + RDW were all superior to single RDW. In predicting 28-day mortality, SOFA achieved the highest AUC among single predictors, while the combination of SOFA and RDW had the highest AUC among combinations of severity scores and RDW. SOFA + RDW and BISAP + RDW had similar ability in predicting 28-day mortality. Both the combinations above were superior to single SOFA or RDW. Similar to previous study,[2] Ranson score in our research had the lowest AUC in predicting mortality. Compared with other laboratory parameters studied, RDW showed overwhelming advantages in predicting mortality, which can be demonstrated by multivariate logistic regression models. These results indicated that RDW is a convenient, economic, and reliable biomarker in prediction not only SAP, but also 28-day mortality. Moreover, the combination of RDW and severity scores could achieve better performance. These results parallel conclusions from previous studies.[9,11]
The AP was the most common discharge diagnosis of gastrointestinal disorder that places a substantial burden on the healthcare system, with approximately an annual cost of 2.6 billon dollars in the United States.[13] The clinical course of most patient with AP is often mild and it often resolves without sequelae. Nonetheless, although guidelines have evolved, improvements have been made in the diagnostic and management interventions, about 10% to 20% patients experience SAP, which results in intense inflammatory responses and a series of local and systemic complications. Early death of patients with AP usually occurs as a result of SIRS leading to MODS, while late mortality occurs due to sepsis and its complications.[14] Risk assessment should be performed to stratify patients into higher or lower risk categories to assist triage, such as admission to an intensive care setting, and patients with organ dysfunction should be admitted to an intensive care unit (ICU) or intermediary care setting whenever possible.[1]
The BISAP score, the Ranson criteria, and the APACHE II score are the most widely used severity assessment scores for AP, while the SOFA score is most widely used in evaluation of patients with sepsis. These scoring systems are initially designed for mortality prediction of critically ill patients in the first 48 hours. Regrettably, Ranson score and APACHE II score are cumbersome, typically require 48 hours to become accurate, and when the score demonstrates severe disease, the patient's condition is obvious regardless of the score.[1,15,16] Previous studies reported that BISAP was as good as APACHE II score and outperformed Ranson criteria in predicting severity and death of AP,[7,17,18] but its accuracy in HLAP still needs to be improved in the future.[19] Compared with APACHE II score, SOFA provides an easier system for evaluating organ dysfunction using six reproducible variables measuring disease severity.[2] Previous research demonstrated that higher SOFA scores predict higher ICU or hospital mortality, and SOFA showed superiority to Ranson score and APACHE II score in determining prognosis.[20] Moreover, serial SOFA scores showed reliability for predicting mortality and hospital day 7 is a reasonable time for SOFA assessment to predict late mortality in SAP.[2] However, there has been limited number of studies concerning the application of SOFA in AP, and more further studies are needed.
Apart from severity scores, there have been advancements and researches to evaluate the relationship between laboratory parameters and severity and mortality of patients with AP before. RDW, calculated by dividing the standard deviation of red blood cell volume by mean corpuscular volume and multiply it by 100 to express the results as percentages, is an easily obtained, inexpensive, and routinely reported parameter as a part of the complete blood count test.[21] RDW has been traditionally utilized as a tool to explore the etiology of anemia, while researches in recent years showed that RDW is a strong prognostic marker in various diseases such as cardiovascular diseases, renal failure, viral hepatitis, etc.[21–23] Preliminary studies revealed that RDW is positively associated with AP severity, and is likely a useful predictive parameter of AP severity.[11,24] Inflammatory status could change the RDW values. However, the mechanism between RDW and severity of AP are yet unknown, but previous researches indicated that it may be attributed to the following reasons.[11] Inflammation promotes the death of red blood cells (RBC) or inhibits maturation of RBC, thus decreasing RBC lifespan.[24] Shortage of RBC synthetic materials (including iron, vitamin B12, and folic acid) promote the RBC cannot get enough iron.[25] Inflammatory cytokines can desensitize bone marrow erythroid progenitors to erythropoietic, blocking its antiapoptotic and promoting maturation effects.[26] More other studies also concluded that RDW is positively correlated with AP severity, and can be utilized as one of the predictors of AP severity and mortality.[27,28]
The NLR was 1st introduced as an easily measurable parameter evaluating systemic inflammation and stress in critically ill patients,[29] while PLR was also proved to be an inflammatory marker and the role of platelet as a crucial link between inflammation and microvascular dysfunction has been investigated.[10,30] A few of researches have explored the relationship between NLR, PLR, and AP.[9,10,31] Wang et al demonstrated that NLR had the highest discriminatory capacity for severe hypertriglyceridemia-induced AP.[31] Jeon and Park proved that elevated baseline NLR correlates with SAP and organ failure.[32] Study by Li et al enrolled 359 patients and concluded that NLR had the largest AUC compared with RDW, CRP, lymphocyte-monocyte ratio, and prognostic nutritional index.[33] İlhan et al investigated 14 patients who developed AP in ongoing pregnancy and 30 healthy pregnant controls, an results indicated that NLR elevated significantly in AP group compared with controls, but there was no significant difference in terms of PLR.[34]
The BUN is also an important prognostic marker for the assessment of SAP. An international validation study demonstrated that a BUN level of 20 mg/dL or a higher one was associated with increased incidence of mortality.[35] There is no consensus on the timing of measurement of BUN for prediction of SAP and in-hospital mortality during the first 24 hours hospitalization,[36] while Lin et al concluded that BUN determination after 24 hours of hospital admission had high accuracy for prediction of SAP and BUN at admission has high accuracy for prediction of in-hospital mortality.[36] Talukdar et al showed that rising BUN with 48 hours of admission can be used to predict development of primary infected pancreatic necrosis.[37] Koutroumpakis et al enrolled 1612 patients with AP, and found that rise in BUN at 24 hours and admission HCT ≥44% were the most accurate in predicting persist organ failure and pancreatic necrosis, outperforming APACHE II score.[38] Study by Chen et al enrolled 215 patients with AP, and results revealed that the maximum levels of PCT, CRP, HCT, and BUN within 48 hours of admission are independent risk factors of infected pancreatic necrosis (IPN) and their combinations might accurately predict the occurrence of IPN secondary to necrotizing pancreatitis.[39]
To the best of our knowledge, our research is among the very few that had utilized the NLR, PLR, RDW, BUN, and a serial of severity scores of AP (SOFA, BISAP, Ranson, APACHE II) at the same time to assess their predicting performance for SAP and 28-day mortality. There are some limitations of this study. First, the observation of our study was set to the first 48 hours of admission and we only studied the NLR, PLR, and RDW at admission. We did not study the serial measurement of NLR, PLR, RDW, BUN, and severity scores during patients’ admission, thus we could not infer a long-term association between laboratory parameters above and AP severity and mortality. Second, retrospective, nonrandomized and single-center design of our study may result in selection bias. Moreover, a proportion of patients with incomplete clinical data were not enrolled in our study, which could lead to incomplete analysis of data from all patients. More multicenter studies with larger sample size are warranted to further validate our study.
6. Conclusion
In conclusion, we investigated severity stratification and prognostic prediction value of NLR, PLR, RDW, BUN, SOFA, BISAP, Ranson, and APACHE II in patients with AP admitted in ED at early stage of disease. The results in our research suggested that NLR, PLR, RDW, BUN, SOFA, BISAP, Ranson, and APACHE II were associated with severity and mortality of AP. BISAP is a single valuable predictor for SAP, and SOFA is superior in prediction of mortality of patients with AP. RDW is superior to other laboratory predictors in prediction of not only SAP, but also mortality of AP. Combination of SOFA and RDW or BISAP and RDW could improve predicting performance of single SOFA, BISAP, or RDW. Among the laboratory parameters studied, RDW had the highest discriminatory capacity and it is a convenient, economic and reliable marker for both SAP and mortality. More multicenter studies with larger sample size are warranted to validate our results.
Author contributions
Conceptualization: Haijiang Zhou, Tianfei Lan, Shubin Guo.
Data curation: Xue Mei, Xin-hua He, Tianfei Lan, Haijiang Zhou.
Formal analysis: Hai-jiang Zhou, Xue Mei, Xin-hua He, Shubin Guo, Tianfei Lan.
Investigation: Hai-jiang Zhou, Xin-hua He, Shubin Guo.
Methodology: Xue Mei, Xin-hua He, Tianfei Lan, Shubin Guo, Haijiang Zhou.
Supervision: Shubin Guo.
Writing – original draft: Haijiang Zhou, Tianfei Lan.
Writing – review & editing: Haijiang Zhou, Xue Mei, Xinhua He, Tianfei Lan.
Footnotes
Abbreviations: AP = acute pancreatitis, APACHE II = acute physiology and chronic health evaluation II, AUC = area under the curve, BISAP = bed-side index for severity of AP, HCT = hematocrit, IPN = infected pancreatic necrosis, MAP = mild acute pancreatitis, MODS = multiorgan dysfunction syndrome, MSAP = mild severe acute pancreatitis, NLR = neutrophil-lymphocyte ratio, NPV = negative prediction value, OR = odds ratio, PLR = platelet-lymphocyte ratio, PPV = positive prediction value, RDW = red-cell distribution width, ROC = receiver-operating characteristics, SAP = severe acute pancreatitis, SOFA = sequential organ failure assessment.
The authors have no funding and conflicts of interest to disclose.
References
- [1].Tenner S, Baillie J, DeWitt J, et al. American College of Gastroenterology guideline: management of acute pancreatitis. Am J Gastroenterol 2013;108:1400–15. 1416. [DOI] [PubMed] [Google Scholar]
- [2].Tee YS, Fang HY, Kuo IM, et al. Serial evaluation of the SOFA score is reliable for predicting mortality in acute severe pancreatitis. Medicine (Baltimore) 2018;97:e9654. [DOI] [PMC free article] [PubMed] [Google Scholar]
- [3].Renner IG, Savage WT, 3rd, Pantoja JL, et al. Death due to acute pancreatitis. A retrospective analysis of 405 autopsy cases. Dig Dis Sci 1985;30:1005–18. [DOI] [PubMed] [Google Scholar]
- [4].Gloor B, Müller CA, Worni M, et al. Late mortality in patients with severe acute pancreatitis. Br J Surg 2001;88:975–9. [DOI] [PubMed] [Google Scholar]
- [5].Juneja D, Gopal PB, Ravula M. Scoring systems in acute pancreatitis: which one to use in intensive care units? J Crit Care 2010;25:358.e9–15. [DOI] [PubMed] [Google Scholar]
- [6].Zhang W, Hu J, Yao B, et al. Evaluation of early prognostic factors of mortality in patients with acute pancreatitis: a retrospective study. Gastroenterol Res Pract 2017;2017:8363561. [DOI] [PMC free article] [PubMed] [Google Scholar]
- [7].Hagjer S, Kumar N. Evaluation of the BISAP scoring system in prognostication of acute pancreatitis - a prospective observational study. Int J Surg 2018;54(Pt A):76–81. [DOI] [PubMed] [Google Scholar]
- [8].Gao W, Yang HX, Ma CE. The value of BISAP score for predicting mortality and severity in acute pancreatitis: a systematic review and meta-analysis. PLoS One 2015;10:e0130412. [DOI] [PMC free article] [PubMed] [Google Scholar]
- [9].Suppiah A, Malde D, Arab T, et al. The prognostic value of the neutrophil-lymphocyte ratio (NLR) in acute pancreatitis: identification of an optimal NLR. J Gastrointest Surg 2013;17:675–81. [DOI] [PubMed] [Google Scholar]
- [10].Cho SK, Jung S, Lee KJ, et al. Neutrophil to lymphocyte ratio and platelet to lymphocyte ratio can predict the severity of gallstone pancreatitis. BMC Gastroenterol 2018;18:18. [DOI] [PMC free article] [PubMed] [Google Scholar]
- [11].Zhang T, Liu H, Wang D, et al. Predicting the severity of acute pancreatitis with red cell distribution width at early admission stage. Shock 2018;49:551–5. [DOI] [PubMed] [Google Scholar]
- [12].Banks PA, Bollen TL, Dervenis C, et al. Classification of acute pancreatitis--2012: revision of the Atlanta classification and definitions by international consensus. Gut 2013;62:102–11. [DOI] [PubMed] [Google Scholar]
- [13].Fagenholz PJ, Fernández-del Castillo C, Harris NS, et al. Direct medical costs of acute pancreatitis hospitalizations in the United States. Pancreas 2007;35:302–7. [DOI] [PubMed] [Google Scholar]
- [14].Mutinga M, Rosenbluth A, Tenner SM, et al. Does mortality occur early or late in acute pancreatitis? Int J Pancreatol 2000;28:91–5. [DOI] [PubMed] [Google Scholar]
- [15].Ranson JH, Pasternack BS. Statistical methods for quantifying the severity of clinical acute pancreatitis. J Surg Res 1977;22:79–91. [DOI] [PubMed] [Google Scholar]
- [16].Knaus WA, Draper EA, Wagner DP, et al. APACHE II: a severity of disease classification system. Crit Care Med 1985;13:818–29. [PubMed] [Google Scholar]
- [17].Vasudevan S, Goswami P, Sonika U, et al. Comparison of various scoring systems and biochemical markers in predicting the outcome in acute pancreatitis. Pancreas 2018;47:65–71. [DOI] [PubMed] [Google Scholar]
- [18].Chandra S, Murali A, Bansal R, et al. The bedside index for severity in acute pancreatitis: a systematic review of prospective studies to determine predictive performance. J Community Hosp Intern Med Perspect 2017;7:208–13. [DOI] [PMC free article] [PubMed] [Google Scholar]
- [19].Yang L, Liu J, Xing Y, et al. Comparison of BISAP, Ranson, MCTSI, and APACHE II in predicting severity and prognoses of hyperlipidemic acute pancreatitis in Chinese patients. Gastroentero Res Pract 2016;2016:1834256. [DOI] [PMC free article] [PubMed] [Google Scholar]
- [20].Adam F, Bor C, Uyar M, et al. Severe acute pancreatitis admitted to intensive care unit: SOFA is superior to Ranson's criteria and APACHE II in determining prognosis. Turk J Gastroenterol 2013;24:430–5. [DOI] [PubMed] [Google Scholar]
- [21].Goyal H, Awad H, Hu ZD. Prognostic value of admission red blood cell distribution width in acute pancreatitis: a systematic review. Ann Transl Med 2017;5:342. [DOI] [PMC free article] [PubMed] [Google Scholar]
- [22].Kurt M, Tanboga IH, Buyukkaya E, et al. Relation of red cell distribution width with CHA2DS2-VASc score in patients with nonvalvular atrial fibrillation. Clin Appl Thromb Hemost 2014;20:687–92. [DOI] [PubMed] [Google Scholar]
- [23].Solak Y, Yilmaz MI, Saglam M, et al. Red cell distribution width is independently related to endothelial dysfunction in patients with chronic kidney disease. Am J Med Sci 2014;347:118–24. [DOI] [PubMed] [Google Scholar]
- [24].Yalçin MS, Tas A, Kara B, et al. New predictor of acute necrotizing necrotizing pancreatitis: red cell distribution width. Adv Clin Exp Med 2018;27:225–8. [DOI] [PubMed] [Google Scholar]
- [25].Lippi G, Targher G, Montagnana M, et al. Relation between red blood cell distribution width and inflammatory biomarkers in a large cohort of unselected outpatients. Arch Pathol Lab Med 2009;133:628–32. [DOI] [PubMed] [Google Scholar]
- [26].Förhécz Z, Gombos T, Borgulya G, et al. Red cell distribution width in heart failure: prediction of clinical events and relationship with markers of ineffective erythropoiesis, inflammation, renal function, and nutritional state. Am Heart J 2009;158:659–66. [DOI] [PubMed] [Google Scholar]
- [27].Yao J, Lv G. Association between red cell distribution width and acute pancreatitis: a cross-sectional study. BMJ Open 2014;4:e004721. [DOI] [PMC free article] [PubMed] [Google Scholar]
- [28].Hu ZD, Wei TT, Zhong RQ. Red blood cell distribution: an index without additional cost in estimating the prognosis of acutepancreatitis. Clin Chem Lab Med 2016;54:e389–90. [DOI] [PubMed] [Google Scholar]
- [29].Zahorec R. Ratio of neutrophil to lymphocyte counts—rapid and simple parameter of systemic inflammation and stress in critically ill. Bratisl Lek Listy 2001;102:5–14. [PubMed] [Google Scholar]
- [30].Stokes KY, Granger DN. Platelets: a critical link between inflammation and microvascular dysfunction. J Physiol 2012;590:1023–34. [DOI] [PMC free article] [PubMed] [Google Scholar]
- [31].Wang Y, Fuentes HE, Attar BM, et al. Evaluation of the prognostic value of neutrophil to lymphocyte ratio in patients with hypertriglyceridemia-induced acute pancreatitis. Pancreatology 2017;17:893–7. [DOI] [PubMed] [Google Scholar]
- [32].Jeon TJ, Park JY. Clinical significance of the neutrophil-lymphocyte ratio as an early predictive marker for adverse outcomes in patients with acute pancreatitis. World J Gastroenterol 2017;23:3883–9. [DOI] [PMC free article] [PubMed] [Google Scholar]
- [33].Li Y, Zhao Y, Feng L, et al. Comparison of the prognostic values of inflammation markers in patients with acute pancreatitis: a retrospective cohort study. BMJ Open 2017;7:e013206. [DOI] [PMC free article] [PubMed] [Google Scholar]
- [34].İlhan M, İlhan G, Gök AF, et al. Evaluation of neutrophil-lymphocyte ratio, platelet-lymphocyte ratio and red blood cell distribution width-platelet ratio as early predictor of acute pancreatitis in pregnancy. J Matern Fetal Neonatal Med 2016;29:1476–80. [DOI] [PubMed] [Google Scholar]
- [35].Wu BU, Bakker OJ, Papachristou GI, et al. Blood urea nitrogen in the early assessment of acute pancreatitis: an international validation study. Arch Intern Med 2011;171:669–76. [DOI] [PubMed] [Google Scholar]
- [36].Lin S, Hong W, Basharat Z, et al. Blood urea nitrogen as a predictor of severe acute pancreatitis based on the revised atlanta criteria: timing of measurement and cutoff points. Can J Gastroenterol Hepatol 2017;2017:9592831. [DOI] [PMC free article] [PubMed] [Google Scholar]
- [37].Talukdar R, Nechutova H, Clemens M, et al. Could rising BUN predict the future development of infected pancreatic necrosis? Pancreatology 2013;13:355–9. [DOI] [PubMed] [Google Scholar]
- [38].Koutroumpakis E, Wu BU, Bakker OJ, et al. Admission hematocrit and rise in blood urea nitrogen at 24 h outperform other laboratory markers in predicting persistent organ failure and pancreatic necrosis in acute pancreatitis: a post hoc analysis of three large prospective databases. Am J Gastroenterol 2015;110:1707–16. [DOI] [PubMed] [Google Scholar]
- [39].Chen HZ, Ji L, Li L, et al. Early prediction of infected pancreatic necrosis secondary to necrotizing pancreatitis. Medicine (Baltimore) 2017;96:e7487. [DOI] [PMC free article] [PubMed] [Google Scholar]