Abstract
Background
Biochemical MRI of hip cartilage such as delayed gadolinium-enhanced MRI of cartilage (dGEMRIC) and T2 mapping is increasingly used to judge cartilage quality in the assessment of femoroacetabular impingement (FAI). The current evidence is sparse about which of these techniques yields a stronger correlation with histologic cartilage degeneration because of the difficulty in validating biochemical MRI techniques against histology in the clinical setting. Recently, an experimental ovine FAI model was established that induces chondrolabral damage and offers a validated platform to address these limitations.
Questions/purposes
In a sheep model, we asked: (1) Do dGEMRIC and/or T2 values of acetabular and femoral cartilage correlate with histologic cartilage degeneration as assessed with the Mankin score? (2) Do simultaneously measured dGEMRIC and T2 values correlate in an experimental ovine FAI model?
Methods
We performed an experimental pilot study on five female Swiss Alpine sheep (10 hips) that underwent postmortem MRI, including biochemical cartilage sequences, after a staged FAI correction had been performed on one side. No surgery was performed on the contralateral side, which served as a healthy control. In these sheep, an extraarticular intertrochanteric varus osteotomy was performed to rotate the naturally aspherical ovine femoral head into the acetabulum to induce cam-type FAI and chondrolabral damage comparable to human beings. After a 70-day ambulation period, femoral osteochondroplasty was performed and all sheep were euthanized after a total observation period of 210 days. Before they were euthanized, the sheep received a contrast agent and roamed and walked for at least 45 minutes. Hips were prepared to fit in a knee coil and MRI was performed at 3 T including a three-dimensional (3-D) dGEMRIC sequence, a two-dimensional (2-D) radial T2 mapping sequence, and a 2-D radial proton density-weighted sequence for morphologic cartilage assessment. Using specifically developed software, the 3-D dGEMRIC images and T2 maps were coregistered on the 2-D morphologic radial images. This enabled us to simultaneously measure dGEMRIC and T2 values using the identical regions of interest. dGEMRIC and T2 values of the acetabular and femoral cartilage were measured circumferentially using anatomic landmarks. After MRI, bone-cartilage samples were taken from the acetabulum and the femur and stained with toluidine blue for assessment of the histologic cartilage degeneration using the Mankin score, which was assessed in consensus by two observers. Spearman’s rank correlation coefficient was used to (1) correlate dGEMRIC values and T2 values with the histologic Mankin score of femoroacetabular cartilage; and to (2) correlate dGEMRIC values and T2 values of femoroacetabular cartilage.
Results
A moderate to fair correlation between overall dGEMRIC values of the acetabular cartilage (R = -0.430; p = 0.003) and the femoral cartilage (R = -0.334; p = 0.003) versus the histologic Mankin score was found. A moderate correlation (R = -0.515; p = 0.010) was found among peripheral dGEMRIC values of the acetabulum, the superior femoral cartilage (R = -0.500; p = 0.034), and the histologic Mankin score, respectively. No correlation between overall and regional femoroacetabular T2 values and the histologic Mankin scores was found. No correlation between overall and regional femoroacetabular dGEMRIC values and T2 values was found.
Conclusions
In this recently established sheep model, we found dGEMRIC values correlated well with histologic evidence of cartilage degeneration in the hip. This combination of a robust animal model and an accurate imaging technique appears to offer a noninvasive means to study the natural course of FAI and to compare the effectiveness of potential surgical options to treat it.
Clinical Relevance
This translational study supports the continuing use of dGEMRIC as a biomarker for prearthritic cartilage degeneration with the ultimate goal to identify patients who will benefit most from corrective FAI surgery. The value of T2 imaging of hip cartilage warrants further investigation.
Introduction
Cartilage damage at the time of surgery is a major prognostic factor for long-term success of corrective surgery for femoroacetabular impingement (FAI) [10, 11, 38]. Although conventional radiographic and morphologic MR imaging do not visualize early signs of cartilage degeneration, newer biochemical MR sequences are sensitive to molecular changes in cartilage composition [44]. A variety of biochemical MRI techniques have been developed to study cartilage composition. Although some techniques such as delayed gadolinium-enhanced MRI of cartilage (dGEMRIC) [19] require the administration of a contrast agent, others such as T2 [16], T2* [2], and T1rho [1] imaging are noncontrast techniques. However, validation of biochemical MRI protocols in patients undergoing joint-preserving hip surgery has been limited by the lack of a histologic gold standard.
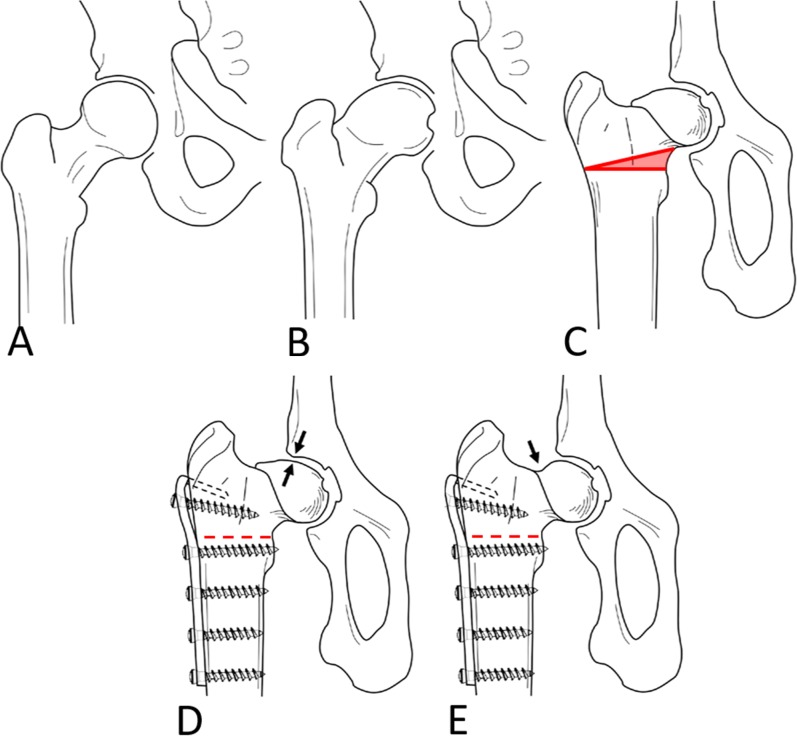
Recently, an experimental sheep model was established to study the effect of FAI and corrective surgery [36] (Fig. 1). Unlike humans, sheep have a naturally aspherical head that resembles the cam deformity in patients with FAI (Fig. 1A-C). In sheep, an osseous cam-type impingement mechanism and subsequent chondrolabral damage can be induced surgically within months through varization of the femoral head [36] (Fig. 1D). Like with FAI in human beings, a cam resection can be performed without impairing the mechanical stability [24, 33] and the blood supply [33, 40] to the femoral head (Fig. 1E). In this experimental setting, the use of biochemical MRI offers the advantage of monitoring different stages of cartilage disease and validates them against histology. Furthermore, it can be used to study the effect of cartilage-protective agents. Thus, this model has great potential to answer crucial questions in human FAI research such as: Which imaging technique should be used to identify patients who will benefit most from surgical FAI correction based on their preoperative status of cartilage integrity? In a previous feasibility study, we reported that T2 mapping can be used to predict cartilage damage in ovine FAI [37]. However, given the long acquisition time of that imaging protocol, its translational use in clinical routine is restricted [37]. In addition, the inherent sensitivity of T2 mapping of cartilage to changes in water content and collagen fiber orientation could make interpretation of T2 values in a clinical setting more difficult compared with other techniques such as dGEMRIC, which estimate a single cartilage substrate only [44]. dGEMRIC measures the gradual decrease in glycosaminoglycan content, which occurs early in osteoarthritis and has been widely used to study FAI. In dysplastic hips, it is a valuable tool for surgical decision-making, because it reliably identifies patients at risk for conversion to THA, radiographic osteoarthritis progression, or postoperative pain after periacetabular osteotomy [5, 18]. Currently, we do not know which of the most commonly used compositional MR techniques (specifically, dGEMRIC or T2 mapping) yields a stronger correlation with the histologic cartilage degeneration. Furthermore, it is unclear whether cartilage composition as estimated with dGEMRIC and T2 are correlated with each other.
Fig. 1 A-E.
The concept of the experimental, ovine FAI model is shown. (A) A normal femoral head with a spherical shape. (B) The femoral head is aspherical in patients with a cam deformity similar to the (C) physiological shape of the ovine femoral head. (D) A cam-type FAI can be experimentally induced through an extraarticular closed-wedge osteotomy. (E) To simulate corrective surgery similar to FAI in humans, an offset correction can be performed. Reprinted from Osteoarthritis Cartilage, volume 26/edition 1, Schmaranzer F, Arendt L, Lerch TD, Steppacher SD, Nuss K, Wolfer N, Dawson HE, von Rechenberg B, Kircher PR, Tannast M. Femoral osteochondroplasty can be performed effectively without the risk of avascular necrosis or femoral neck fractures in an experimental ovine FAI model, pages 128–137, Copyright 2018, with permission from Elsevier.
Therefore, we asked: (1) Do dGEMRIC and/or T2 values of acetabular and femoral cartilage correlate with histologic cartilage degeneration as assessed with the Mankin score? (2) Do simultaneously measured dGEMRIC and T2 values correlate in an experimental ovine FAI model?
Materials and Methods
Study Design and Experimental Animals
We performed an experimental study on five female Swiss Alpine sheep (10 hips) that underwent postmortem MRI, including biochemical cartilage sequences after a staged FAI correction had been performed on one side. This study was performed according to Swiss laws for animal welfare and approved by the local governmental authorities (Kantonales Veterinäramt Zürich, Switzerland, No. 05/2017). In brief, each sheep underwent surgical induction of FAI on one side (five hips) and a staged femoral osteochondroplasty for FAI correction according to the following time interval: 70 days elapsed between the first (FAI induction surgery) and the second surgeries (FAI correction or femoral osteochondroplasty) followed by an observation period of 140 days after osteochondroplasty until euthanasia, which occurred 210 days after FAI induction surgery. The healthy contralateral side served as the control.
The inclusion criterion was a complete set of biochemical cartilage MR images of the hip, including sequences for dGEMRIC and T2 mapping. Three hips were excluded as a result of incomplete scans owing to a software upgrade for the scanner that allowed more precise calculations; to have a consistent data set using the same software throughout, these first three hips were excluded. This left seven hips (four hips with staged FAI correction, three healthy control hips) of four sheep in the final study cohort. All sheep were 2.5 years old, corresponding to a mean age of approximately 22 human years [7, 42]. The mean body weight was 67 ± 6 kg (range, 63–75 kg).
Description of Experiment
The surgical procedure and anesthesia were performed according to the institutional routine protocol for surgery in sheep [33, 36]. Anesthesia was induced through a jugular catheter and via an intravenous, constant-rate infusion of propofol plus a maximum 5% isoflurane (Minrad Inc, Buffalo, NY, USA) inhalation. Four days before the surgery, intravenous penicillin (35,000 IU/kg; Streuli Pharma, Uznach, Switzerland), gentamycin (4 mg/kg; Vetagent, MSD Animal Health Care, Lucerne, Switzerland), and a subcutaneous injection of tetanus serum (3 mL; MSD Animal Health Care) were administered as antibiotic prophylaxis. Epidural anesthesia was applied and analgesics were administered peri- and postoperatively for 3 days. A nondepolarizing muscle relaxant, rocuronium (50 mg/mL; Rocuronium, Fresesnius Kabi, Oberdorf, Switzerland), was used. Induction of FAI was performed with sheep in the lateral decubitus position on the contralateral side. A slightly curved 15- to 20-cm incision was made on the lateral thigh at the level of the palpable interval between the vastus lateralis and the gluteobiceps muscles, that is, the Gibson interval in humans. We performed a subvastus approach with elevation of the vastus lateralis and intermedius muscles to expose the intertrochanteric region. A 15° medially based wedge was cut above the lesser trochanter with a specifically developed cutting jig. After checking for accurate rotational alignment using the linea aspera as an anatomic reference, we used a slightly contoured 3.5-mm double hook plate originally designed for dogs (DePuy Synthes, Warsaw, IN, USA). Screws were drilled eccentrically to achieve compression of the osteotomy. The fascia of the vastus lateralis muscle was reattached to the lateral intermuscular septum and the wound was closed in layers. Postoperatively, the animals were kept in a suspension system for 4 weeks, which allows full weightbearing but prevents the animals from lying down and getting up. After that, sheep were kept in small three-sheep pens for 2 weeks. Six weeks postoperatively, sheep were permitted to roam freely. Seventy days after the first surgery, all sheep underwent a second surgery for femoral osteochondroplasty on the unilateral side. Using the same incision, we performed an intermuscular, anterior approach (interval between the gluteus medius and the minimus muscle) for exposure of the joint capsule. After an H-shaped capsulotomy, we performed the femoral osteochondroplasty with curved chisels and a high-speed burr (Air Pen Drive; DePuy Synthes) until impingement-free ROM was established [33]. This approach reportedly prevents laceration of the retinacular vessels, which ensure the vascular supply to the femoral head [33, 40]. After the second surgery, the sheep were kept in the suspension device for only 2 weeks. After a total of 210 days, all sheep were euthanized.
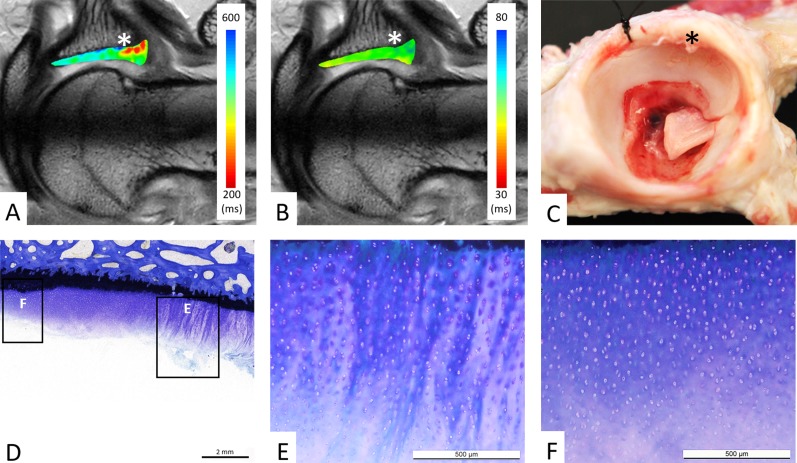
For the MRI, all sheep received gadodiamide intravenously (0.2 mmol/kg Omniscan; GE Healthcare, Opfikon, Switzerland). The sheep were put on a leash and walked for at least 45 minutes to facilitate diffusion of the contrast agent into the cartilage. After that, the sheep were euthanized via an intravenous injection of 30 to 40 mL pentobarbital (300 mg/mL; Esconarkon, Streuli Pharma AG, Uznach, Switzerland) through a jugular catheter. To improve image quality, we removed the hardware and dissected the hip and the adjacent soft tissue out of the osseous hemipelvis. The adjacent muscles were draped to ensure a constantly thick soft tissue sheath around the joint to prevent artefacts. Dissected hips and the surrounding soft tissue were wrapped in transparent plastic foil and stored in a portable temperature-regulated box at 37° C to maintain in vivo conditions regarding temperature and wetness. MRI was performed at 3 T (Ingenia; Philipps Medical Systems AG, Zürich, Switzerland) using a 16-channel transmit-receive knee coil (Philipps Medical Systems AG). In both operated and control hips, we acquired the same protocol, including localizers. The protocol was as follows: coronal, three-dimensional (3-D) T1-weighted turbo field echo sequence for dGEMRIC (repetition time/echo time 4.6/1.59 ms, five inversion delays 200-/300-/400-/800-/1200 ms, flip angle 15°, matrix 260 x 198, field of view 13 cm, slice thickness 1.5 mm, bandwidth 478.9 Hz/Px, acquisition time 23:50 minutes, 79 slices); a radial, two-dimensional (2-D) multiecho spin-echo sequence for T2 mapping of cartilage (repetition time 2000 ms, six echo times 13-/26-/39-/52-/65-/78 ms, flip angle 90°, matrix 240 x 194, field of view 10 cm, slice thickness 2 mm, bandwidth 291 Hz/Px, acquisition time 16:32 minutes, 30 slices); and a morphologic radial, 2-D proton density-weighted turbo spin-echo sequence without fat suppression (repetition time/echo time 3085/30 ms, flip angle 90°, matrix 304 x 299, field of view 7 cm, slice thickness 2 mm, bandwidth 198.6 Hz/Px, acquisition time 9:25 minutes, 30 slices). For acquisition of radial images, the center of the ovine femoral neck was used as the axis of rotation, similar to the planning of radial slices for assessment of patients with cam FAI [20, 35]. The 2-D morphologic sequence was used for coregistration of dGEMRIC values (Fig. 2A) and of T2 values (Fig. 2B) because they provide a good distinction between cartilage layers and the subchondral bone.
Fig. 2 A-F.
(A) dGEMRIC values and (B) T2 values of acetabular cartilage are color-coded on a radial cut at the level of the posterosuperior acetabulum (sector A). (A) The focal decline in dGEMRIC values is visible (red color) at the chondrolabral transition zone (asterisk), which indicates glycosaminoglycan depletion corresponding to early biochemical cartilage damage. (B) By contrast, T2 values show a homogenous distribution (green color) of T2 values, including the chondrolabral transition zone (asterisk). (C) Macroscopic inspection confirms the chondrolabral lesion in the transition zone (asterisk). (D) Corresponding histologic section with toluidine blue staining confirms the lesion in the chondrolabral transition zone with adjacent peripheral (E) and central (F) acetabular cartilage degeneration. (D-E) Total Mankin score of 7 points for the peripheral cartilage lesion: clefts extending into the transitional zone (3 points), diffuse cell proliferation (1 point), moderate discoloration (2 points), and disrupted tidemark (1 points). (D, F) Total Mankin score of 4 points for the central cartilage: surface fibrillation (2 points), diffuse cell proliferation (1 point), minor discoloration (1 points), and intact tidemark (0 points).
After MR imaging, we disarticulated the hips and macroscopically inspected the cartilage layers (Fig. 2C). Using an oscillating saw, we acquired three bone-cartilage samples (1.5 x 3.5 cm) from the acetabulum and from the femur. Acetabular samples included a posterior (sector A), midcoronal (sector B), and anterior (sector C) cuts. Each of the samples was obtained in a fashion that ensured that the acetabular fossa, the weightbearing acetabular cartilage with the subchondral bone, and the peripheral rim with the labrum were included [37]. Femoral samples included a central, horizontal cut through the fovea capitis aligned with the tip of the greater trochanter. Perpendicular to that, anterior and posterior cuts were made vertically through the femoral head to obtain samples of the anterior and posterior circumference of the cartilage for histologic analysis [33]. Samples were fixed in 4% paraformaldehyde for 14 days. After a three-time washout with an ascending alcohol series, the samples were kept in xylene for 4 days for degreasing. Samples were then embedded in methylmethacrylate and 300-µm thick sections were prepared and stained with toluidine blue (Fig. 2D).
Outcome Measures
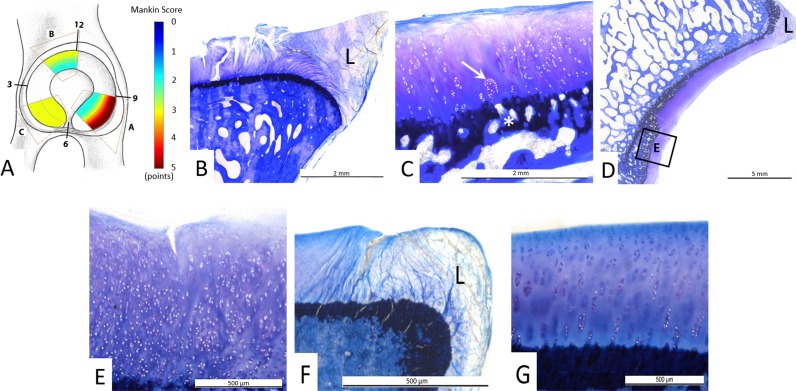
An author (FS) with 5 years of experience in MR imaging of the hip using specifically developed software (GTOne Map; Gyrotools LCC, Zürich, Switzerland) manually measured dGEMRIC and T2 values. This software allows coregistration of the volumetric 3-D dGEMRIC maps and the 2-D radial T2 maps on the morphologic 2-D radial proton density-weighted. Regions of interest (ROIs) were placed on the 2-D radial proton density-weighted images, which, as a result of the coregistration process, enabled simultaneous measurement of dGEMRIC and T2 values at identical locations. This excluded observer-based variations of the definitions of the ROIs (Fig. 3). For correlation with histology, ROIs were then placed on MR images at each “full-hour” position for the acetabular clockface (Fig. 2) and at each “full-hour” position of the femoral clockface (Fig. 4). Each ROI was further bisected into a peripheral and central ROI [34]. ROI placement was comparable to human hips and was based on anatomic landmarks. The acetabular teardrop was used as the acetabular landmark for the 6 o’clock and 12 o’clock positions. The most prominent appearance of the greater trochanter was used as a landmark for the femoral 6 o’clock and 12 o’clock positions [20, 35]. To be comparable with the histologic analysis, the dGEMRIC and T2 values were averaged for the three different sectors: sector A posterosuperior (7–9 o’clock), sector B cranial (12–2 o’clock), and sector C anteroinferior (4–6 o’clock) [37]. To assess reliability and reproducibility, two observers (FS, MT) measured dGEMRIC and T2 values independently at two different points on a random sample of 30 clockface positions and then calculated intraclass correlation coefficients (ICCs). We found an interobserver reproducibility of 0.952 (95% confidence interval [CI], ICC, 0.899%–0.977%; p < 0.001) for measurement of dGEMRIC values and 0.846 (95% CI, ICC 0.679%–0.926%; p < 0.001) for measurement of T2 values of hip cartilage. The intraobserver reliability was 0.935 (95% CI, 0.865%–0.969%) for reader 1 and 0.942 (95% CI, 0.877%–0.972%) for reader 2 for measuring dGEMRIC values. The intraobserver reliability was 0.875 (95% CI, 0.738%–0.940%) for reader 1 and 0.838 (95% CI, 0.664%–0.923%) for reader 2 for measuring T2 values of hip cartilage. The Mankin score was used for grading of histologic cartilage degeneration and served as the gold standard [22, 23]. The Mankin score is a semiquantitative score ranging from 0 (normal) to 14 (severe osteoarthritis) points and allows reliable and reproducible grading of cartilage degeneration [3, 30, 41]. Grading was performed blinded to the MR images and by two readers in consensus (FS, MT) under supervision of one author (BvR) with extensive experience of > 30 years in the histopathologic evaluation of human and animal musculoskeletal tissue samples including articular cartilage. On the acetabular side, each of the three regions was further divided into a peripheral and central part of acetabular cartilage, resulting in six acetabular ROIs for each hip (Fig. 5) [37]. On the femoral side, the superior cut through the femoral head (corresponding to the 12 o’clock position) was divided into a peripheral and a central part. The two perpendicular cuts, one anterior and one posterior, were further divided into four equally sized regions corresponding to four clockface positions (Fig. 6) [33]. This resulted in a total of 10 femoral ROIs for each hip.
Fig. 3.
The biochemical MRI protocol included a 3-D dGEMRIC sequence and a 2-D radial T2 sequence for qualitative assessment of hip cartilage. A 2-D radial proton density (PD)-weighted morphologic sequence that enables good differentiation of the cartilage layers was acquired for placement of ROIs. To eliminate variations of repeated measurements, dGEMRIC and T2 images were coregistered on the morphologic images. Thus, placement of ROIs on the morphologic images enabled us to measure dGEMRIC and T2 values of identical cartilage areas.
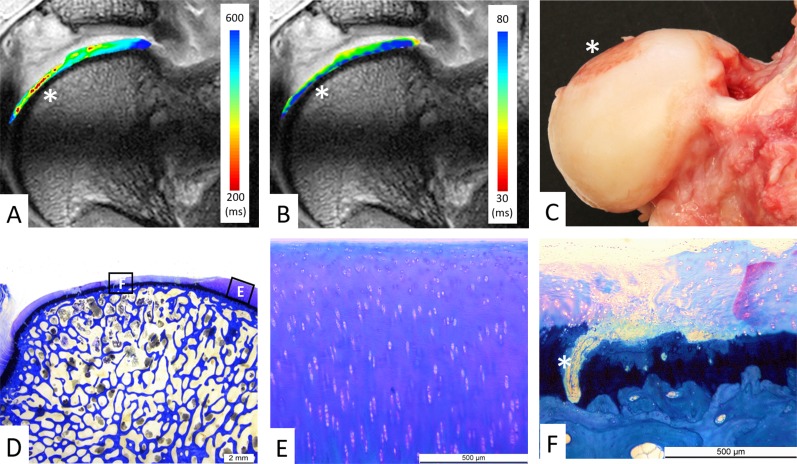
Fig. 4 A-F.
(A) dGEMRIC values and (B) T2 values of femoral cartilage are color-coded on a radial cut through the superior femoral head (12 o’clock position). (A) The focal decline in dGEMRIC values is visible (red color) in the thinned-out central cartilage region (asterisk), which indicates glycosaminoglycan depletion corresponding to early biochemical cartilage damage. (B) By contrast, T2 values do not indicate a focal damage pattern. (C) Macroscopic inspection confirms the central femoral cartilage lesion (asterisk). (D) Corresponding histologic section with toluidine blue staining shows intact (E) peripheral cartilage and (F) central cartilage degeneration. (D-E) No histologic signs of cartilage degeneration (0 points). (D, F) Total Mankin score of 12 points for the central cartilage: cleft into the calcified cartilage (5 points), cell loss (3 points), severe discoloration (3 points), and disrupted tidemark (1 point, asterisk).
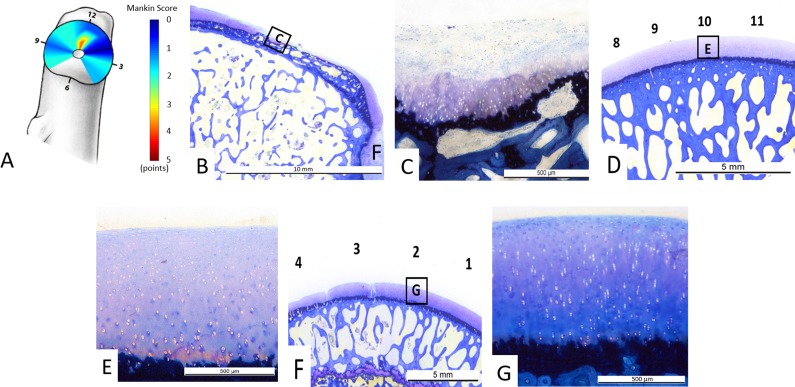
Fig. 5 A-G.
(A) Overall distribution of Mankin scores and (B–G) illustrative examples for grading of Mankin scores from the three different acetabular sectors. (A) Overall the most severe histologic cartilage lesions were observed in the peripheral posterosuperior acetabulum (sector A) as indicated by the red color. (B) Histologic sample from sector A shows a typical lesion in the chondrolabral transition zone adjacent to the labrum and (C) a Mankin score of 7 points: surface fibrillation (2 points), cartilage clusters (2 points, arrow), moderate discoloration (2 points), and a disrupted tidemark (1 point, asterisk). (D-E) Histologic samples from sector B show central cartilage degeneration with a Mankin score of 5: (E) clefts extending into the transitional zone (3 points), diffuse cell proliferation (1 point), uniform staining (0 points), and disrupted tidemark (1 point). (F-G) Histologic samples from sector C show no central cartilage degeneration with a Mankin score of 0. The labrum is marked as L.
Fig. 6 A-G.
(A) Overall distribution of Mankin scores and (B–G) illustrative examples for grading of Mankin scores from different femoral clockface positions. (A) Overall the most severe histologic cartilage lesions were observed in the central superior (12 o’clock position) region as indicated by the red color. (B) Histologic sample from the 12 o’clock face position shows a typical lesion adjacent to the fovea capitis with (C) a Mankin score of 11 points: clefts extending into the radial zone (4 points), cell loss (3 points), severe discoloration (3 points), and a disrupted tidemark (1 point). (D-E) Histologic samples at the 10 o’clock position show no cartilage degeneration with a Mankin score of 0. (F-G) Histologic samples at the 2 o’clock position show no central cartilage degeneration with a Mankin score of 0.
To answer the first question, we correlated the histologic Mankin scores of the femoroacetabular cartilage with the corresponding dGEMRIC and T2 values. To answer the second question, we correlated the simultaneously measured dGEMRIC and T2 values of the femoroacetabular cartilage.
Statistical Analysis
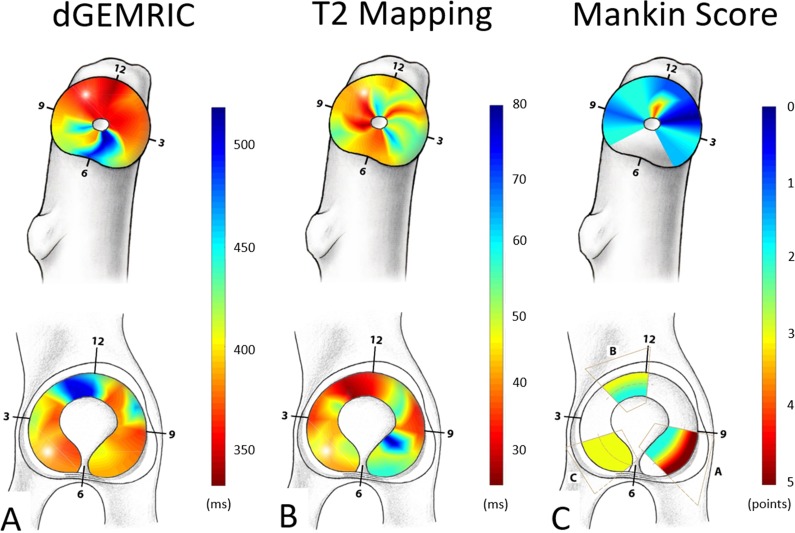
Descriptive statistics (median and range) were calculated. Spearman’s rank correlation coefficients were used to measure pairwise correlation among histologic Mankin scores and the dGEMRIC and T2 values of hip cartilage. The Spearman’s rank correlation coefficient was graded as: R < 0.2, weak; 0.20 to 0.39, fair; 0.40 to 0.59, moderate; 0.60 to 0.79, strong; and ≥ 0.8, very strong correlation [8]. ICCs and 95% CIs were calculated for assessment of interobserver reproducibility and intraobserver reliability. The ICC was graded as follows: < 0.20, slight; 0.21 to 0.40, fair; 0.41 to 0.60, moderate; 0.61 to 0.80, substantial; and > 0.80, almost perfect agreement [27]. A p value < 0.05 indicated statistical significance. We used WinSTAT (R. Fitch Software, Bad Krozingen, Germany) for Microsoft Excel 2016 (Microsoft Corp, Redmond, WA, USA). For a more intuitive visualization of dGEMRIC, T2 values, and histologic Mankin scores, the regional distributions were illustrated using surface color plots. Color plots were interpolated in a bilinear fashion using MATLAB software (The Math Works Inc, Natick, MA, USA) (Fig. 7).
Fig. 7 A-C.
Regional distribution of (A) dGEMRIC values, (B) T2 values, and (C) histologic Mankin scores of the femur and the acetabulum are shown. Blue color indicates good cartilage quality on biochemical MR images (A-B) and for the histologic gold standard (C). Conversely, the red color indicates cartilage damage for both MRI techniques (A-B) and for the histologic gold standard (C).
Results
Do dGEMRIC- and/or T2 Values of Acetabular and Femoral Cartilage Correlate With Histologic Cartilage Degeneration as Assessed With the Mankin Score?
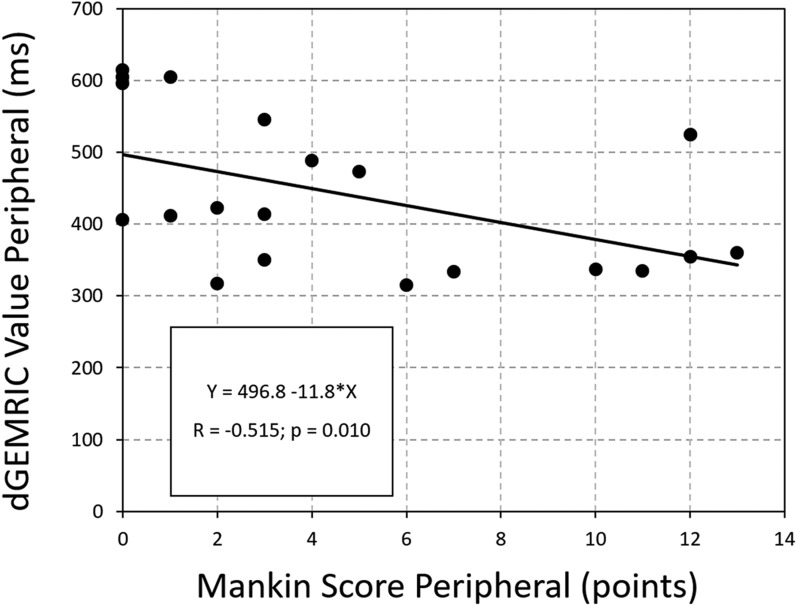
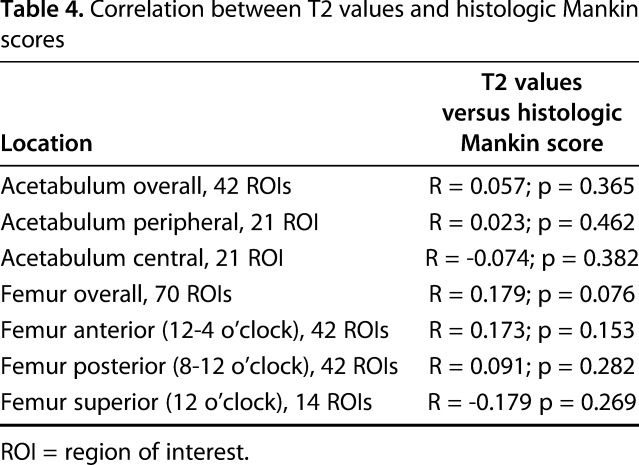
A moderate correlation between overall dGEMRIC values of the acetabular cartilage (R = -0.430; p = 0.003) and a fair correlation for the femoral cartilage (R = -0.334; p = 0.003) versus the histologic Mankin score was found (Table 1). For the acetabulum, the strongest correlation (R = -0.515; p = 0.01) was found between peripheral dGEMRIC values of the acetabulum and the histologic Mankin score (Fig. 8). The lowest dGEMRIC scores and the highest Mankin scores were found in the peripheral acetabulum (Table 2). For the femur, the strongest correlation (R = -0.500; p = 0.034) was found between the dGEMRIC values of the superior femoral cartilage and the histologic Mankin score (Table 1). The lowest dGEMRIC scores and the highest Mankin scores were found at the superior femur (Table 3). We found no correlation between overall and regional femoroacetabular T2 values and the histologic Mankin score (Table 4).
Table 1.
Correlation between dGEMRIC values and histologic Mankin scores
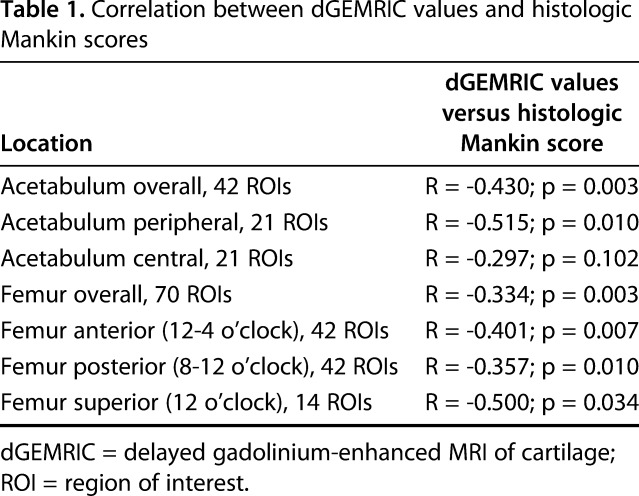
Fig. 8.
Scatterplot of the dGEMRIC values and the Mankin score of the peripheral acetabular cartilage shows decreasing dGEMRIC indices with progressive histologic cartilage damage (R = -0.515; p = 0.010).
Table 2.
Mankin scores and dGEMRIC and T2 values of the six acetabular locations
Table 3.
Mankin scores, dGEMRIC indices, and T2 values for the 10 femoral locations
Table 4.
Correlation between T2 values and histologic Mankin scores
Do Simultaneously Measured dGEMRIC and T2 Values Correlate in an Experimental, Ovine FAI Model?
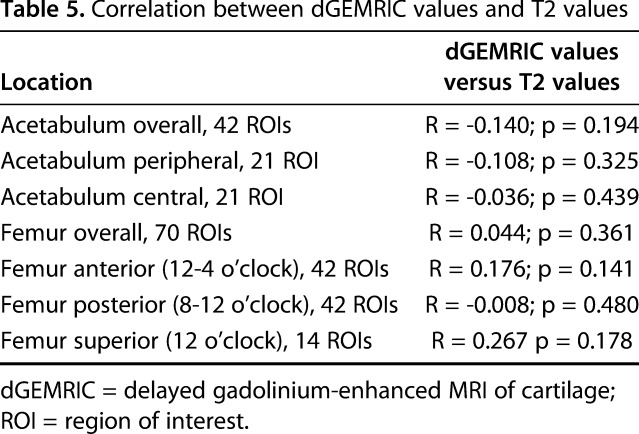
We found no correlation between overall and regional femoroacetabular dGEMRIC values and T2 values (Table 5).
Table 5.
Correlation between dGEMRIC values and T2 values
Discussion
The potential to identify those patients who would benefit most from surgical correction of FAI has led to an increasing use of biochemical cartilage MRI for a more objective assessment of cartilage quality. Compositional MR techniques such as dGEMRIC and T2 mapping of cartilage target different substrates in the cartilage tissue, but it is unknown which technique enables a better estimation of actual histologic cartilage damage [44]. Furthermore, it is currently unclear to which degree dGEMRIC and T2 mapping visualize distinct or complimentary patterns in the degenerative cascade of FAI [12]. Using a recently established ovine FAI model, we identified a moderate correlation between dGEMRIC values and histologic Mankin scores of femoroacetabular cartilage. We saw no such correlation for T2 imaging in this pilot study. With the numbers available, we did not observe a correlation between overall and regional dGEMRIC values and T2 values, although both techniques were measured simultaneously at the exact same locations. The dGEMRIC technique can therefore be used to monitor the cartilage status in this ovine FAI model.
This study has a number of limitations. First, the size of the pilot study group was small and thus no further comparison was undertaken between healthy control hips and hips undergoing a staged FAI correction. Therefore, this study cannot answer the question whether FAI correction can halt or delay the course of cartilage degeneration. One of the challenges when using a new, experimental model in translational research is the fact that the estimated effect of surgical interventions is difficult to predict. Therefore, it was necessary to perform a study to determine the number of hips needed to establish a correlation between biochemical MRI and histology for planning future studies using this animal model. Although we could establish such a correlation for dGEMRIC, the sample size could have been too small to detect a correlation between histologic cartilage degeneration and T2 values in this setup. Therefore, no definite statement can be made until the potential correlation between T2 values and the histologic gold standard is revisited with a larger sample. Additionally, the injection of gadolinium could have biased our resultant T2 values of hip cartilage. However, no relevant changes in T2 [32] and T2* [28] values of hip cartilage were observed in studies investigating the effect of intraarticular gadolinium on T2 and T2 relaxation. Second, at the time of the assigned euthanasia, no negatively charged gadolinium-based contrast agent was available for animal use; we had to use a nonionic MR contrast agent. dGEMRIC is based on the replacement of the negatively charged glycosaminoglycans through a negatively charged gadolinium contrast agent that can be measured on MRI. In a porcine model, it has been shown that anionic gadolinium contrast agents enable better differentiation between healthy cartilage samples and samples without glycosaminoglycans than nonionic gadolinium contrast agents [17]. Therefore, the use of a more selective, negatively charged contrast agent can potentially further improve the observed correlation between dGEMRIC and histology in future studies using this experimental animal model. Another limitation of this experimental setup is related to the nature of this sheep model in which a surgical intervention triggers the FAI syndrome. By contrast, a cam deformity is a pathologic bone formation in humans that develops over time and can be associated with the FAI syndrome [36]. Accordingly, induction of FAI in sheep resembles the situation of symptomatic patients with cam-type FAI. Therefore, it can be used to monitor the natural course of the FAI syndrome and the effect of hip preservation surgery [33]. However, it is important to state that the results of this sheep model may not be applicable to the setting of asymptomatic individuals with a cam deformity in whom biochemical MRI is increasingly used to monitor early cartilage degeneration [1].
Studies validating commonly used compositional MR techniques such as dGEMRIC and T2 mapping to assess cartilage quality in the hip against a histologic gold standard are sparse. By using this experimental ovine FAI model, we showed a moderate correlation between dGEMRIC indices and Mankin scores of the acetabular cartilage (Table 1). Although we found no correlation between the dGEMRIC index and cartilage degeneration in the central acetabular cartilage areas, we found a moderate correlation between dGEMRIC and histology for the peripheral cartilage (Fig. 8). The peripheral cartilage showed the most severe degenerative changes, which is in line with previous studies in this sheep model and further supports the validity of the experimental, animal model (Fig. 7) [36, 37]. On the femoral side, we observed a fair-to-moderate correlation between the dGEMRIC values and the Mankin scores (Table 1). The highest correlation was observed superiorly at the aspherical portion of the head (Table 1), where cartilage damage is reportedly most pronounced after FAI induction (Fig. 8) [36]. Our correlation was lower than previously reported values (R = -0.658; p < 0.001) using retrieved femoral heads in patients undergoing THA [43]. The stronger correlation observed in that study may be related to the fact that a more selective MR contrast agent was used and that MRI and histology were compared slice per slice for the cartilage-bone blocks using a sequence with very high resolution [43]. Instead, we imaged the entire joint at once to more closely reflect a clinical setting. Given the concerns regarding gadolinium deposition in the body after intravenous contrast injection [26], efforts have been made to further develop noncontrast techniques such as T2 or T2* mapping of hip cartilage [13]. In contrast to a previous study using this experimental ovine FAI model, we could not reproduce the observed strong correlation between T2 mapping of hip cartilage and histology (R = -0.79; p < 0.001) [37] (Fig. 7). In fact, we did not observe any correlation between femoral nor acetabular T2 values of cartilage and the corresponding Mankin scores (Table 4). Compared with the initial proof-of-concept study in which the T2 protocol lasted 55:09 minutes for maximizing image resolution, we chose a different MR sequence for faster acquisition (16:32 minutes) [37]. This was done to more closely reflect the compositional T2 imaging protocols used in clinical settings [9, 12, 39]. However, it is well known that calculated T2 values of cartilage differ considerably among different acquisition techniques, which is why a new validation was necessary [25, 29].
Recently, T2 mapping of the hip was compared against cartilage samples taken from visually intact and damaged areas during arthroscopy. Interestingly, no correlation between T2 values and corresponding histologic grading was observed when combining visually intact and degenerated cartilage [16]. Unlike dGEMRIC, which is sensitive to glycosaminoglycan content only, T2 mapping is affected by zonal and topographic variations in collagen fiber orientation/content and water content that are present in asymptomatic subjects and patients alike [9, 15]. This may explain the nonlinear pattern of T2 values among different stages of histologic degeneration that have been described for knees and hips [6, 16]. Although diagnostic and prognostic cutoff values have been described for dGEMRIC for the detection of severe cartilage damage [31] and for predicting outcomes after joint-preserving surgery [4, 5, 18], such reference values are currently lacking for T2 mapping [21]. By contrast, a careful interpretation of T2* maps in patients undergoing hip arthroscopy with respect to the reported T2* heterogeneity among asymptomatic individuals enabled detection of cartilage damage with a sensitivity and specificity of 83.5% and 67.7%, respectively [14]. Although T2 and T2* differ in acquisition technique and interpretation of resulting values, this highlights the potential of noncontrast techniques if a more thorough analysis with external or internal reference is used.
To the best of our knowledge, this is the first study to directly compare simultaneously measured dGEMRIC and T2 values of hip cartilage using specifically developed software for registration of both compositional MR techniques. Thus, the used approach enabled us to measure dGEMRIC and T2 values at the exact same ROI and thereby rule out variations in ROI placement, which are inevitable when performing repeated imaging analysis. Despite that, we did not find any overall or regional correlation between both measurement techniques (Table 5). This is in line with a recent study on symptomatic patients with FAI, in which no correlation between dGEMRIC and T2 images was observed [12]. This further underlines the complexity of interpreting T2 values of hip cartilage.
To conclude, we were able to establish a moderate correlation between dGEMRIC values of femoroacetabular cartilage with an experimental FAI model in sheep, although we observed no such correlation for T2 imaging. We did not detect a correlation between overall and regional dGEMRIC values and T2 values, although both techniques were measured simultaneously at the identical locations using a specific approach for coregistration of these images. We will continue to use the dGEMRIC technique in this experimental FAI animal model to monitor the cartilage degeneration to describe the natural history of the disease, to assess the effect of osteochondroplasty on the cartilage status and cartilage regeneration, and to evaluate the effectiveness of potential chondroprotective and regenerative therapies. This translational study supports the continuing use of dGEMRIC as a biomarker for prearthritic cartilage degeneration with the ultimate goal to identify patients who will benefit most from corrective FAI surgery. The value of T2 imaging of hip cartilage warrants further investigation.
Footnotes
The institution of one or more of the authors (BvR) has received, during the study period, funding from the Swiss National Science Foundation. One of the authors certifies that he (FS), or a member of his immediate family, has received or may receive grants, during the study period, in an amount of USD 10,000 to USD 100,000 from the Swiss National Science Foundation (Bern, Switzerland), outside the submitted work. One of the authors certifies that he (MT), or a member of his immediate family, has received or may receive grants, during the study period, in an amount of more than USD 1,000,001 from the Swiss National Science Foundation for the conduct of this work.
All ICMJE Conflict of Interest Forms for authors and Clinical Orthopaedics and Related Research® editors and board members are on file with the publication and can be viewed on request.
Clinical Orthopaedics and Related Research® neither advocates nor endorses the use of any treatment, drug, or device. Readers are encouraged to always seek additional information, including FDA approval status, of any drug or device before clinical use.
Each author certifies that his or her institution approved the animal protocol for this investigation and that all investigations were conducted in conformity with ethical principles of research.
This work was performed at the Musculoskeletal Research Unit (MSRU), Equine Hospital, Vetsuisse Faculty, University of Zürich, Zürich, Switzerland.
References
- 1.Anwander H, Melkus G, Rakhra KS, Beaulé PE. T1ρ MRI detects cartilage damage in asymptomatic individuals with a cam deformity. J Orthop Res. 2016;34:1004–1009. [DOI] [PubMed] [Google Scholar]
- 2.Bittersohl B, Miese FR, Hosalkar HS, Herten M, Antoch G, Krauspe R, Zilkens C. T2* mapping of hip joint cartilage in various histological grades of degeneration. Osteoarthritis Cartilage. 2012;20:653–660. [DOI] [PubMed] [Google Scholar]
- 3.Bonasia DE, Marmotti A, Massa ADF, Ferro A, Blonna D, Castoldi F, Rossi R. Intra- and inter-observer reliability of ten major histological scoring systems used for the evaluation of in vivo cartilage repair. Knee Surg Sports Traumatol Arthrosc. 2015;23:2484–2493. [DOI] [PubMed] [Google Scholar]
- 4.Chandrasekaran S, Vemula SP, Lindner D, Lodhia P, Suarez-Ahedo C, Domb BG. Preoperative delayed gadolinium-enhanced magnetic resonance imaging of cartilage (dGEMRIC) for patients undergoing hip arthroscopy: indices are predictive of magnitude of improvement in two-year patient-reported outcomes. J Bone Joint Surg Am. 2015;97:1305–1315. [DOI] [PubMed] [Google Scholar]
- 5.Cunningham T, Jessel R, Zurakowski D, Millis MB, Kim Y-J. Delayed gadolinium-enhanced magnetic resonance imaging of cartilage to predict early failure of Bernese periacetabular osteotomy for hip dysplasia. J Bone Joint Surg Am. 2006;88:1540–1548. [DOI] [PubMed] [Google Scholar]
- 6.David-Vaudey E, Ghosh S, Ries M, Majumdar S. T2 relaxation time measurements in osteoarthritis. Magn Reson Imaging. 2004;22:673–682. [DOI] [PubMed] [Google Scholar]
- 7.Else RW. Tumours. In: Aitken I, ed. Diseases of Sheep. Chichester, UK: John Wiley & Sons; 2007:443–448. [Google Scholar]
- 8.Evans J. Straightforward Statistics for the Behavioral Sciences . 1st ed. Pacific Grove, CA, USA: Brooks/Cole Publishing; 1996. [Google Scholar]
- 9.Ferro FP, Ho CP, Dornan GJ, Surowiec RK, Philippon MJ. Comparison of T2 values in the lateral and medial portions of the weight-bearing cartilage of the hip for patients with symptomatic femoroacetabular impingement and asymptomatic volunteers. Arthroscopy. 2015;31:1497–1506. [DOI] [PubMed] [Google Scholar]
- 10.Haefeli P, Albers C, Steppacher S, Tannast M, Büchler L. What are the risk factors for revision surgery after hip arthroscopy for femoroacetabular impingement at 7-year followup? Clin Orthop Relat Res. 2017;475:1169–1177. [DOI] [PMC free article] [PubMed] [Google Scholar]
- 11.Hanke MS, Steppacher SD, Zurmühle CA, Siebenrock KA, Tannast M. Hips with protrusio acetabuli are at increased risk for failure after femoroacetabular impingement surgery: a 10-year followup. Clin Orthop Relat Res. 2016;474:2168-2180. Erratum in Clin Orthop Relat Res. 2016;474:2319. [DOI] [PMC free article] [PubMed] [Google Scholar]
- 12.Hesper T, Bulat E, Bixby S, Akhondi-Asl A, Afacan O, Miller P, Bowen G, Warfield S, Kim Y-J. Both 3-T dGEMRIC and acetabular-femoral T2 difference may detect cartilage damage at the chondrolabral junction. Clin Orthop Relat Res. 2017;475:1058–1065. [DOI] [PMC free article] [PubMed] [Google Scholar]
- 13.Hesper T, Hosalkar HS, Bittersohl D, Welsch GH, Krauspe R, Zilkens C, Bittersohl B. T2* mapping for articular cartilage assessment: principles, current applications, and future prospects. Skeletal Radiol . 2014;43:1429–1445. [DOI] [PubMed] [Google Scholar]
- 14.Hesper T, Neugroda C, Schleich C, Antoch G, Hosalkar H, Krauspe R, Zilkens C, Bittersohl B. T2*-mapping of acetabular cartilage in patients with femoroacetabular impingement at 3 Tesla: comparative analysis with arthroscopic findings. Cartilage. 2018;9:118–126. [DOI] [PMC free article] [PubMed] [Google Scholar]
- 15.Ho CP, Surowiec RK, Ferro FP, Lucas EP, Saroki AJ, Dornan GJ, Fitzcharles EK, Anz AW, Smith WS, Wilson KJ, Philippon MJ. Subregional anatomical distribution of T2 values of articular cartilage in asymptomatic hips. Cartilage. 2014;5:154–164. [DOI] [PMC free article] [PubMed] [Google Scholar]
- 16.Ho CP, Surowiec RK, Frisbie DD, Ferro FP, Wilson KJ, Saroki AJ, Fitzcharles EK, Dornan GJ, Philippon MJ. Prospective in vivo comparison of damaged and healthy-appearing articular cartilage specimens in patients with femoroacetabular impingement: comparison of T2 mapping, histologic endpoints, and arthroscopic grading. Arthroscopy. 2016;32:1601–1611. [DOI] [PubMed] [Google Scholar]
- 17.Kang Y, Choi J-Y, Yoo HJ, Hong SH, Kang HS. Delayed gadolinium-enhanced MR imaging of cartilage: a comparative analysis of different gadolinium-based contrast agents in an ex vivo porcine model. Radiology. 2017;282:734–742. [DOI] [PubMed] [Google Scholar]
- 18.Kim SD, Jessel R, Zurakowski D, Millis MB, Kim Y-J. Anterior delayed gadolinium-enhanced MRI of cartilage values predict joint failure after periacetabular osteotomy. Clin Orthop Relat Res. 2012;470:3332–3341. [DOI] [PMC free article] [PubMed] [Google Scholar]
- 19.Kim Y-J, Jaramillo D, Millis MB, Gray ML, Burstein D. Assessment of early osteoarthritis in hip dysplasia with delayed gadolinium-enhanced magnetic resonance imaging of cartilage. J Bone Joint Surg Am. 2003;85:1987–1992. [DOI] [PubMed] [Google Scholar]
- 20.Klenke F, Hoffmann D, Cross B, Siebenrock K. Validation of a standardized mapping system of the hip joint for radial MRA sequencing. Skeletal Radiol. 2015;44:339–343. [DOI] [PubMed] [Google Scholar]
- 21.Link TM, Neumann J, Li X. Prestructural cartilage assessment using MRI. J Magn Reson Imaging. 2017;45:949–965. [DOI] [PubMed] [Google Scholar]
- 22.Mankin HJ. The reaction of articular cartilage to injury and osteoarthritis (first of two parts). N Engl J Med. 1974;291:1285–1292. [DOI] [PubMed] [Google Scholar]
- 23.Mankin HJ. The reaction of articular cartilage to injury and osteoarthritis (second of two parts). N Engl J Med. 1974;291:1335–1340. [DOI] [PubMed] [Google Scholar]
- 24.Maquer G, Bürki A, Nuss K, Zysset PK, Tannast M. Head-neck osteoplasty has minor effect on the strength of an ovine cam-FAI model: In vitro and finite element analyses. Clin Orthop Relat Res. 2016;474:2633–2640. [DOI] [PMC free article] [PubMed] [Google Scholar]
- 25.Matzat SJ, McWalter EJ, Kogan F, Chen W, Gold GE. T2 Relaxation time quantitation differs between pulse sequences in articular cartilage. J Magn Reson Imaging. 2015;42:105–113. [DOI] [PMC free article] [PubMed] [Google Scholar]
- 26.McDonald RJ, McDonald JS, Kallmes DF, Jentoft ME, Murray DL, Thielen KR, Williamson EE, Eckel LJ. Intracranial gadolinium deposition after contrast-enhanced MR imaging. Radiology. 2015;275:772–782. [DOI] [PubMed] [Google Scholar]
- 27.Montgomery AA, Graham A, Evans PH, Fahey T. Inter-rater agreement in the scoring of abstracts submitted to a primary care research conference. BMC Health Serv Res. 2002;2:8. [DOI] [PMC free article] [PubMed] [Google Scholar]
- 28.Nissi MJ, Mortazavi S, Hughes J, Morgan P, Ellermann J. T2* relaxation time of acetabular and femoral cartilage with and without intraarticular gadopentetate dimeglumine in patients with femoroacetabular impingement. AJR Am J Roentgenol. 2015;204:W695-700. [DOI] [PMC free article] [PubMed] [Google Scholar]
- 29.Pai A, Li X, Majumdar S. A comparative study at 3 T of sequence dependence of T2 quantitation in the knee. Magn Reson Imaging. 2008;26:1215–1220. [DOI] [PMC free article] [PubMed] [Google Scholar]
- 30.Pearson RG, Kurien T, Shu KSS, Scammell BE. Histopathology grading systems for characterisation of human knee osteoarthritis--reproducibility, variability, reliability, correlation, and validity. Osteoarthritis Cartilage. 2011;19:324–331. [DOI] [PubMed] [Google Scholar]
- 31.Perets I, Chaharbakhshi EO, Hartigan DE, Ortiz-Declet V, Mu B, Domb BG. The correlation between arthroscopically defined acetabular cartilage defects and a proposed preoperative delayed gadolinium-enhanced magnetic resonance imaging of cartilage index in hips of patients with femoroacetabular impingement syndrome. Arthroscopy. 2018;34:1202–1212. [DOI] [PubMed] [Google Scholar]
- 32.Samaan MA, Zhang AL, Gallo MC, Schwaiger BJ, Link TM, Souza RB, Majumdar S. Quantitative magnetic resonance arthrography in patients with femoroacetabular impingement. J Magn Reson Imaging. 2016;44:1539–1545. [DOI] [PMC free article] [PubMed] [Google Scholar]
- 33.Schmaranzer F, Arendt L, Lerch TD, Steppacher SD, Nuss K, Wolfer N, Dawson HE, von Rechenberg B, Kircher PR, Tannast M. Femoral osteochondroplasty can be performed effectively without the risk of avascular necrosis or femoral neck fractures in an experimental ovine FAI model. Osteoarthrtis Cartilage. 2018;26:128–137. [DOI] [PubMed] [Google Scholar]
- 34.Schmaranzer F, Haefeli P, Hanke M, Liechti E, Werlen S, Siebenrock K, Tannast M. How does the dGEMRIC index change after surgical treatment for FAI? A prospective controlled study: preliminary results. Clin Orthop Relat Res. 2017;475:1080–1099. [DOI] [PMC free article] [PubMed] [Google Scholar]
- 35.Schmaranzer F, Todorski IAS, Lerch TD, Schwab J, Cullmann-Bastian J, Tannast M. Intra-articular lesions: imaging and surgical correlation. Semin Musculoskelet Radiol. 2017;21:487–506. [DOI] [PubMed] [Google Scholar]
- 36.Siebenrock K, Fiechter R, Tannast M, Mamisch T, von Rechenberg B. Experimentally induced cam impingement in the sheep hip. J Orthop Res. 2013;31:580–587. [DOI] [PubMed] [Google Scholar]
- 37.Siebenrock K, Kienle K, Steppacher S, Tannast M, Mamisch T, von Rechenberg B. Biochemical MRI predicts hip osteoarthritis in an experimental ovine femoroacetabular impingement model. Clin Orthop Relat Res. 2015;473:1318–1324. [DOI] [PMC free article] [PubMed] [Google Scholar]
- 38.Steppacher S, Anwander H, Zurmühle C, Tannast M, Siebenrock K. Eighty percent of patients with surgical hip dislocation for femoroacetabular impingement have a good clinical result without osteoarthritis progression at 10 years. Clin Orthop Relat Res. 2015;473:1333–1341. [DOI] [PMC free article] [PubMed] [Google Scholar]
- 39.Surowiec RK, Lucas EP, Wilson KJ, Saroki AJ, Ho CP. Clinically relevant subregions of articular cartilage of the hip for analysis and reporting quantitative magnetic resonance imaging: a technical note. Cartilage. 2014;5:11–15. [DOI] [PMC free article] [PubMed] [Google Scholar]
- 40.Tannast M, Wolfer N, Ryan MK, Nuss KM, von Rechenberg B, Steppacher SD. Vascular supply of the femoral head in sheep--implications for the ovine femoroacetabular impingement model. J Orthop Res. 2018;36:2340–2348. [DOI] [PubMed] [Google Scholar]
- 41.Van der Sluijs JA, Geesink RG, van der Linden AJ, Bulstra SK, Kuyer R, Drukker J. The reliability of the Mankin score for osteoarthritis. J Orthop Res. 1992;10:58–61. [DOI] [PubMed] [Google Scholar]
- 42.World Health Organization Life Expectancy Europe. . WHO Global Health Observatory Data Repositiory. 2017. Available at: http://apps.who.int/gho/data/view.main.SDG2016LEXv?lang=en. Accessed October 24, 2017.
- 43.Zilkens C, Miese F, Herten M, Kurzidem S, Jäger M, König D, Antoch G, Krauspe R, Bittersohl B. Validity of gradient-echo three-dimensional delayed gadolinium-enhanced magnetic resonance imaging of hip joint cartilage: a histologically controlled study. Eur J Radiol. 2013;82:e81-86. [DOI] [PubMed] [Google Scholar]
- 44.Zilkens C, Tiderius CJ, Krauspe R, Bittersohl B. Current knowledge and importance of dGEMRIC techniques in diagnosis of hip joint diseases. Skeletal Radiol. 2015;44:1073–1083. [DOI] [PubMed] [Google Scholar]


