


Abstract
Background
The effectiveness of interventions to increase influenza vaccination uptake in people aged 60 years and older varies by country and participant characteristics. This review updates versions published in 2010 and 2014.
Objectives
To assess access, provider, system, and societal interventions to increase the uptake of influenza vaccination in people aged 60 years and older in the community.
Search methods
We searched CENTRAL, which includes the Cochrane Acute Respiratory Infections Group's Specialised Register, MEDLINE, Embase, CINAHL, and ERIC for this update, as well as WHO ICTRP and ClinicalTrials.gov for ongoing studies to 7 December 2017. We also searched reference lists of included studies.
Selection criteria
Randomised controlled trials (RCTs) and cluster‐RCTs of interventions to increase influenza vaccination in people aged 60 years or older in the community.
Data collection and analysis
We used standard methodological procedures as specified by Cochrane.
Main results
We included 3 new RCTs for this update (total 61 RCTs; 1,055,337 participants). Trials involved people aged 60 years and older living in the community in high‐income countries. Heterogeneity limited some meta‐analyses. We assessed studies as at low risk of bias for randomisation (38%), allocation concealment (11%), blinding (44%), and selective reporting (100%). Half (51%) had missing data. We assessed the evidence as low‐quality. We identified three levels of intervention intensity: low (e.g. postcards), medium (e.g. personalised phone calls), and high (e.g. home visits, facilitators).
Increasing community demand (12 strategies, 41 trials, 53 study arms, 767,460 participants)
One successful intervention that could be meta‐analysed was client reminders or recalls by letter plus leaflet or postcard compared to reminder (odds ratio (OR) 1.11, 95% confidence interval (CI) 1.07 to 1.15; 3 studies; 64,200 participants). Successful interventions tested by single studies were patient outreach by retired teachers (OR 3.33, 95% CI 1.79 to 6.22); invitations by clinic receptionists (OR 2.72, 95% CI 1.55 to 4.76); nurses or pharmacists educating and nurses vaccinating patients (OR 152.95, 95% CI 9.39 to 2490.67); medical students counselling patients (OR 1.62, 95% CI 1.11 to 2.35); and multiple recall questionnaires (OR 1.13, 95% CI 1.03 to 1.24).
Some interventions could not be meta‐analysed due to significant heterogeneity: 17 studies tested simple reminders (the 95% CI was entirely above unity in 11 trials implying all 11 interventions increased vaccination rates); 16 tested personalised reminders (the 95% CI was entirely above unity in 12 trials implying all 12 interventions increased vaccination rates ); 2 investigated customised compared to form letters (the 95% CI was above unity in both trials implying both interventions increased vaccination rates); and 4 studies examined the impact of health risk appraisals (the 95% CI was above unity in all 4 trials implying all 4 interventions increased vaccination rates). One study of a lottery for free groceries was not effective.
Enhancing vaccination access (6 strategies, 8 trials, 10 arms, 9353 participants)
We meta‐analysed results from 2 studies of home visits (OR 1.30, 95% CI 1.05 to 1.61), and 2 studies that tested free vaccine compared to patient payment for vaccine (OR 2.36, 95% CI 1.98 to 2.82). We were unable to conduct meta‐analyses of 2 studies of home visits by nurses plus a physician care plan (the 95% CI was entirely above unity in both trials implying both interventions increased vaccination rates) and 2 studies of free vaccine compared to no intervention (the 95% CI was entirely above unity in both trials implying both interventions increased vaccination rates). One study of group visits (OR 27.2, 95% CI 1.60 to 463.3) was effective, and 1 study of home visits compared to safety interventions was not.
Provider‐ or system‐based interventions (11 strategies, 15 trials, 17 arms, 278,524 participants)
One successful intervention that could be meta‐analysed focused on payments to physicians (OR 2.22, 95% CI 1.77 to 2.77). Successful interventions tested by individual studies were: reminding physicians to vaccinate all patients (OR 2.47, 95% CI 1.53 to 3.99); posters in clinics presenting vaccination rates and encouraging competition between doctors (OR 2.03, 95% CI 1.86 to 2.22); and chart reviews and benchmarking to the rates achieved by the top 10% of physicians (OR 3.43, 95% CI 2.37 to 4.97).
We were unable to meta‐analyse 4 studies that looked at physician reminders (the 95% CI was entirely above unity in 3 trials implying all 3 interventions increased vaccination rates) and 3 studies of facilitator encouragement of vaccination (the 95% CI was entirely above unity in 2 trials implying both interventions increased vaccination rates). Interventions that were not effective were: comparing letters on discharge from hospital to letters to general practitioners; posters plus postcards versus posters alone; educational reminders, academic detailing, and peer comparisons compared to mailed educational materials; educational outreach plus feedback to teams versus written feedback; and an intervention to increase staff vaccination rates.
Interventions at the societal level
No studies reported on societal‐level interventions.
Study funding sources
Studies were funded by government health organisations (n = 33), foundations (n = 9), organisations that provided healthcare services in the studies (n = 3), and a pharmaceutical company offering free vaccines (n = 1). Fifteen studies did not report study funding sources.
Authors' conclusions
We identified interventions that demonstrated significant positive effects of low (postcards), medium (personalised phone calls), and high (home visits, facilitators) intensity that increase community demand for vaccination, enhance access, and improve provider/system response. The overall GRADE assessment of the evidence was moderate quality. Conclusions are unchanged from the 2014 review.
Plain language summary
Interventions to increase influenza vaccination rates of those 60 years and older living in the community
Review question
Does increasing demand, vaccination access, and provider activity increase influenza vaccination rates in people aged 60 years and older living in the community?
Background
Vaccination rates vary across countries and socioeconomic and health risk groups.
Search date
The evidence is current to 7 December 2017.
Study characteristics
We included three new trials (15,993 participants) for this update; the review now includes a total of 61 trials with 1,055,337 participants. All participants were aged 60 years or older, living in the community.
Study funding sources
Government health organisations funded 33 studies; foundations funded 9 studies; organisations that provided healthcare services in the studies funded 3 studies; and a pharmaceutical company offering free vaccines funded 1 study. Fifteen studies did not report any funding source.
Key results
Increasing community demand for vaccination (12 strategies, 41 trials, 767,460 participants)
Effective interventions consisted of reminders/recalls using letters and leaflets, and nurses or pharmacists educating and nurses vaccinating patients. Individual effective studies consisted of client outreach by retired teachers, receptionists, nurses, and medical students.
It was not possible to combine some interventions for analysis as they were too varied: 17 studies of simple reminders (11 with significant results); 16 studies of personalised reminders (12 with significant results); two studies of customised letters versus form letters (both with significant results); and four studies of health risk appraisals plus vaccination recommendations (all with significant results).
Improving vaccination access (6 strategies, 8 trials, 9353 participants)
Effective interventions consisted of home visits, client group clinic visits, and free vaccine offers.
Improving provision by providers or the healthcare system (11 strategies, 15 trials, 278,524 participants)
Effective interventions that could be combined for analysis included physician payment, physician reminders, clinic posters encouraging physician competition, and chart reviews plus benchmarking to rates of the top 10% of physicians. We could not analyse some groups of interventions: physician reminders (four studies, two of which were effective) and facilitator vaccination encouragement (three studies, two of which were effective).
Individual studies that were not effective consisted of posters plus postcards versus posters alone, educational reminders to physicians compared to mailed educational materials, educational outreach plus feedback to teams versus written feedback, and increasing staff vaccination rates.
No studies measured if interventions reduced illness or hospital admissions or reported societal‐level interventions.
Quality of the evidence
Overall, we assessed the included studies as at moderate risk of bias. The overall GRADE assessment of the evidence was high to moderate quality.
Summary of findings
Background
Description of the condition
The key issue is whether influenza vaccination in people aged 60 years and older is effective.
A 2018 Cochrane Review of vaccines to prevent influenza in older adults concluded that there was insufficient high‐quality evidence of the effectiveness of vaccines in this population (Demicheli 2018). One randomised controlled trial (RCT) showed benefits against influenza symptoms but was underpowered to detect effects on complications (1348 participants). Other data sets were not randomised and were deemed likely to contain biases. A 2017 systematic review compared high‐dose influenza vaccine (60 μg haemagglutinin/strain) to standard‐dose influenza vaccine (15 μg haemagglutinin/strain). In two trials, those who received the high‐dose vaccine had higher geometric mean titres and seroprotection rates after vaccination and significantly less risk of developing laboratory‐confirmed influenza infections (risk ratio 0.76, 95% confidence interval 0.65 to 0.90; 41,141 participants; I² statistic 0%). There were no serious adverse events in either group (Wilkinson 2017). A Cochrane Review that explored the extent to which vaccinating healthcare workers reduced instances of influenza among older adults living in institutions concluded that there was insufficient evidence of the effectiveness of this intervention (Thomas 2016).
There were two purposes in updating this review: (1) when influenza vaccines likely to be more effective than the current ones are tested, our assessment of the literature on maximising vaccine uptake can be used to optimise those RCTs; and (2) when more effective vaccines become available, our review provides assessments of a wide range of methods to increase vaccine uptake for those aged 60 years and older.
Globally, there is a very wide range of influenza vaccine uptake in people aged 60 years and older.
The Organisation for Economic Co‐operation and Development (OECD) estimated influenza vaccination rates for those aged 65 years and older in 25 OECD member countries for 2015 (range 82% to 2%) (OECD 2016). Only seven countries had rates above 60%: South Korea (82%), the UK (71%), the USA (69%), New Zealand (68%), the Netherlands (67%), Israel (66%), and Canada (62%). Rates were surprisingly low for Scandinavia and Germany: Sweden (49%), Finland (43%), Denmark (42%), Iceland (40%), Germany (37%), Norway (28%). Rates were very low for Eastern Europe: Hungary (21%), Lithuania (20%), Slovak Republic (13%), Slovenia (10%), Latvia (3%), and Estonia (2%) (OECD 2016). The Centers for Disease Control and Prevention (CDC) estimated the rate for 2016 to 2017 for the USA at 65% (CDC 2017). While these rates appear low, studies have shown that self reports of vaccination status are inherently unreliable. Zimmerman 2003a investigated the reliability of self report by comparing the self reported vaccination status of 919 individuals aged 66 years or older against medical records. While 80% reported receiving influenza vaccination, an audit of medical records found that receipt of vaccination was only documented in 51% of participants' medical records. MacDonald 1999 surveyed 500 randomly selected outpatients in Veterans Affairs clinics in Minneapolis, USA. These researchers reported that in 92% of cases, self report of vaccination status in people aged 65 years or older mirrored chart documentation.
A variety of factors may determine the likelihood of older adults receiving influenza vaccination (Kamal 2003). In a retrospective, random national sample of the data from the 1999 Behavioral Risk Factor Surveillance System survey of the CDC (USA) the average influenza vaccination rate was 66.7%. Variations were found among Caucasian (understood to be white) (68.3%) and African‐American (52.9%), unemployed (61.8%), employed (57.4%), and retired (68.3%) people; those with annual household income less than USD 15,000 (58.4%); and those earning USD 50,000 or more (69.6%). Not surprisingly, the greatest difference was between those with health insurance (67.1%) and those without (46.4%).
Regardless, the Advisory Committee on Immunization Practices of the US Public Health Service recommended vaccination of people aged 65 years and older (Grohskopf 2014). In light of declining antibody levels in this age group, the Committee stated: "Although delaying vaccination might permit greater immunity later in the season, deferral might result in missed opportunities to vaccinate and difficulties in vaccinating a population within a limited time" (Grohskopf 2014). "The Committee concluded that vaccination programs should balance maximizing likelihood of persistence of vaccine‐induced protection through the season with avoiding missed opportunities to vaccinate or vaccinating after influenza virus circulation begins" (Grohskopf 2014).
Description of the intervention
There is a need to determine which interventions are most effective at increasing vaccine uptake in adults aged 60 years and older. Studies have identified patient, administrative, healthcare worker, and societal factors that affect influenza vaccination uptake in older people. The Community Preventive Services Task Force in the USA has classified interventions to increase vaccination uptake into three types: increasing community demand, enhancing access, and provider or system based (CDC 2018). To make this review more relevant for readers, we adopted this classification model, amending the model to also include societal interventions.
Interventions to increase community demand
Interventions to increase community demand include increasing perceptions among people aged 60 years and older that they are susceptible to influenza; increasing belief that vaccination is effective; and appropriately decreasing concern about side effects. Methods of contacting people aged 60 years and older have included postcards, letters, tailored letters, pamphlets, patient education (Herman 1994), telephone campaigns (Hull 2002), financial incentives (Moran 1996), and recruiting people aged 60 years and older to advocate for vaccination of peers (Krieger 2000). Other studies have explored the cost‐effectiveness of different ways of encouraging vaccination, such as reminder letters followed by phone calls (Frank 1985). While some studies have concluded that there is a need to overcome perceived barriers to vaccination by physicians and healthcare consumers (De Wals 1996), others have queried whether there is a ceiling effect with respect to the number of individuals who will respond to such cues (Ganguly 1995).
Interventions to enhance access
Interventions to enhance access include providing more clinics, better clinic hours, offering vaccination during existing home visits (Dalby 2000; Fabacher 1994), arranging home visits specifically to provide vaccination (Dixon‐Woods 2004), and decreasing economic barriers by making vaccinations freely available, or at a low cost. Other initiatives may include decreasing administrative barriers for staff such as enabling annual standing vaccine orders (Lawson 2000), and transferring responsibility for administering vaccines to other staff (e.g. from physicians to nurses).
Provider‐ or system‐based interventions
Some studies have demonstrated that recommendations from healthcare workers can promote vaccine acceptance among older adults (Ashby‐Hughes 1999; Nichol 1996; Nichol 2001; Shefer 1999). Other studies have reported on the positive impact of patient educational campaigns delivered by healthcare workers such as pharmacists (Ginson 2000; Grabenstein 1992).
Interventions that can specifically target healthcare workers include providing information to alter personal beliefs and attitudes about the susceptibility of their patients and themselves to influenza; informing healthcare workers of the effectiveness and safety of vaccines; and implementing strategies to increase motivation and willingness to vaccinate patients (Ballada 1994). Other interventions that can alter behaviour include promoting vaccination history taking and documentation (Buffington 1991); identifying high‐risk patients (Wrenn 1994); generating physician reminders (Baker 1998; Chambers 1991; Chan 2002; Clayton 1999; Cowan 1992; Dexter 2001; Kelterman 2000); and organising and participating in educational campaigns targeting healthcare workers (Calkins 1995; Herman 1994; Karuza 1995).
Societal interventions
We added a fourth category to the three CDC categories: interventions on a societal level, or administrative frameworks and campaigns that target specific communities or societies (Bennett 1994; Hak 2000; Nichol 1990; Remmen 2002). These include government policies and mandated programmes, such as moving from risk‐based to age‐based targeting for vaccination programmes (De Wals 1996), remuneration to healthcare workers for increasing vaccination uptake, or meeting specific targets (Ives 1994). Currently, the USA, in addition to recommending immunisation for people at high risk of complications from influenza, or those who live with people at high risk of complications, explicitly recommends vaccination for people aged 50 years or older (Fiore 2009). Germany, Austria, Hungary, and the Spanish autonomous region of Catalonia recommend vaccination for those aged 60 years and older (ECDC 2017).
How the intervention might work
Each of the four types of interventions is designed to change predisposing or enabling factors at the level of patient, provider, or system.
Why it is important to do this review
Cochrane Reviews have been published that assess the effects of influenza vaccines for healthy adults (Demicheli 2014), people affected by chronic obstructive pulmonary disease, Poole 2006, and asthma, Cates 2013; and to prevent cardiovascular disease (Clar 2015). However, there had been no Cochrane Review assessing interventions to increase influenza vaccination in older people in the community before the publication of this review (Thomas 2010; Thomas 2014). The systematic review by Kohlhammer 2007 of surveys to ascertain vaccination rates among those aged 65 years and older combined data from surveys of small areas with some national telephone surveys. The review by Shojania 2010 was limited to point‐of‐care computer reminders to physicians and identified six studies on vaccination. While Lau 2012 made an extensive search of English language studies and used the Downs‐Black measure of study quality, the validity and reliability of this tool has not been demonstrated (Downs 1998). Furthermore, Lau 2012 pooled RCTs and studies of other designs together, and pooled some studies with high I² statistic measures of heterogeneity.
An accurate assessment of the effectiveness of interventions to increase influenza vaccination uptake in those aged 60 years and older in the community, and the costs and benefits of these interventions, is essential to inform rational choice regarding the evidence for universal recommendations to vaccinate older people in the community. A separate review needs to be undertaken of those living in institutions or temporarily accommodated in institutions (such as emergency departments or hospitals).
Objectives
To assess access, provider, system, and societal interventions to increase the uptake of influenza vaccination in people aged 60 years and older in the community.
Methods
Criteria for considering studies for this review
Types of studies
Randomised controlled trials (RCTs) or cluster‐RCTs of interventions to increase influenza vaccination uptake in those aged 60 years and older in the community, with recording of influenza vaccination status either through clinic records or billing data, or local or national vaccination registers were eligible for inclusion. We included studies with either individual or group data.
We excluded studies without a case definition, retrospective designs based only on individual recall of disease, or studies comparing different types of vaccines or different schedules or doses without a control group.
Types of participants
Those aged 60 years or older living in the community. We also included studies focused on interventions targeting healthcare workers involved in the provision of vaccination to this population; these include physicians, nurses, pharmacists, and administrators. To ensure comparability with other Cochrane Reviews on influenza vaccination, we used the same age groupings (up to 60 years and aged 60 years and older). We used data for those aged 65 years or older if they were the only data presented in a study and we were unable to obtain data for those aged 60 years or older from the authors.
Types of interventions
Any intervention to increase uptake of influenza vaccination in those aged 60 years or older, in any dose, preparation, or time schedule, compared to another intervention or no intervention. We assessed the following types of interventions separately.
To increase community demand, e.g. interventions to increase people's perceptions of their susceptibility to influenza, the effectiveness of vaccination, and decrease concerns about side effects, using postcards, letters, brochures, telephone calls, computer reminders, educational campaigns, media campaigns, vaccination campaigns, incentives for patients or client‐held records.
To enhance access, e.g. more clinics, more available clinic hours, home visits, fewer administrative barriers, standing annual vaccine orders, free vaccine or vaccine at reduced out‐of‐pocket cost in the administrative area studied, or transfer of responsibility to other staff groups (e.g. from physicians to nurses), home visits, or increasing the effectiveness of vaccination activities through quality improvement activities.
Provider or system based, e.g. to increase healthcare workers' beliefs that older people are susceptible to influenza and that vaccination is effective and safe for themselves and their patients; to increase healthcare worker professional behaviours such as the frequency of taking a vaccination history, documenting vaccination, and identifying high‐risk patients; organising reminders, reminders during annual physical examinations, and organising and participating in educational campaigns or meetings for healthcare workers.
Societal interventions, e.g. administrative frameworks or decisions that differ between societies or regions of societies and that affect vaccination uptake, such as increased remuneration to healthcare workers for increasing vaccination uptake.
Types of outcome measures
We evaluated the effects of interventions on both immediate and long‐term changes in influenza vaccination uptake. The most important predictor of being vaccinated against influenza is being vaccinated the previous year; therefore we ascertained baseline rates in the year prior to the intervention. We excluded studies reporting only serological outcomes if they did not include and report on an intervention to increase vaccination uptake as well as an outcome of actual vaccination uptake. We excluded studies that ascertained outcomes only by self report.
Primary outcomes
Uptake of vaccination against influenza in those aged 60 years or older.
Secondary outcomes
None.
Search methods for identification of studies
Electronic searches
We searched the Cochrane Central Register of Controlled Trials (CENTRAL; 2017, Issue 11) (accessed 7 December 2017), which includes the Cochrane Acute Respiratory Infections Group's Specialised Register, MEDLINE (Ovid), Embase (Elsevier), CINAHL (Cumulative Index to Nursing and Allied Health Literature) (EBSCO), and ERIC (Educational Resources Information Center) (ProQuest) all from June 2014 to 7 December 2017 for this update.
We searched MEDLINE and CENTRAL using the search strategy described in Appendix 1. We combined the MEDLINE search with the Cochrane Highly Sensitive Search Strategy for identifying randomised trials in MEDLINE: sensitivity‐maximising version (2008 revision); Ovid format (Lefebvre 2011). We adapted the MEDLINE search strategy to search Embase (Appendix 2), CINAHL (Appendix 3), and ERIC (Appendix 4). See Appendix 5 for previous search details. We applied no language or publication restrictions.
Searching other resources
We searched the World Health Organization (WHO) International Clinical Trials Registry Platform (ICTRP) (www.who.int/ictrp) (Appendix 6) and ClinicalTrials.gov (clinicaltrials.gov) (Appendix 7) for completed and ongoing trials (latest search 7 December 2017). We also scanned the reference lists of included studies, followed up every reference in the reviews and systematic reviews, and contacted first or corresponding authors of relevant studies to identify further published or unpublished trials.
Data collection and analysis
Selection of studies
Two review authors (RET, DLL) independently assessed all abstracts for study design, reporting of influenza vaccination uptake for those aged 60 years or older in the community and an intervention to increase vaccination uptake. Two review authors (RET, DLL) then independently assessed the full text of studies that appeared eligible for inclusion.
Data extraction and management
Two review authors (RET, DLL) independently entered the following data on data abstraction sheets.
Methods (purpose, design, duration of study, interval between intervention and when outcome was measured, power computation, statistics).
Participants (country, setting, eligible participants and health status, age, gender).
Interventions (intervention 1, intervention 2, control).
Outcomes (outcome measured, time points from the study that are considered in the review or measured or reported in the study, percentage vaccinated).
Funding.
Assessment of risk of bias in included studies
Two review authors (RET, DLL) independently assessed risk of bias for each study using the criteria outlined in the Cochrane Handbook for Systematic Reviews of Interventions (Higgins 2011). We resolved any disagreements by discussion. We assessed the risk of bias according to the following domains.
Random sequence generation.
Allocation concealment.
Blinding of participants and personnel.
Blinding of outcome assessment.
Incomplete outcome data.
Selective outcome reporting.
Other bias.
We graded each potential source of bias as high, low, or unclear and provided quotes from the study report together with a justification for our judgement in the 'Risk of bias' table. We summarised the 'Risk of bias' judgements across different studies for each of the domains listed. Where necessary, we considered blinding separately for different key outcomes. Where information on risk of bias related to unpublished data or correspondence with a trialist, we noted this in the 'Risk of bias' table.
When considering treatment effects, we took into account the risk of bias for studies that contributed to that outcome.
Assessment of bias in conducting the systematic review
We conducted this review update according to the published protocol and reported deviations from it in the Differences between protocol and review section.
Measures of treatment effect
We entered outcome data for each study into data tables in Review Manager 5 to calculate treatment effects (Review Manager 2014). We used odds ratios for dichotomous outcomes.
We conducted meta‐analyses only where this was meaningful, that is where the treatments, participants, and the underlying clinical question were sufficiently similar for pooling.
Unit of analysis issues
The Cochrane Handbook for Systematic Reviews of Interventions identifies five particular biases to consider in cluster‐randomised trials (Higgins 2011):
recruitment bias when individuals are recruited to the trial after the clusters have been randomised;
"chance baseline imbalance between the randomized groups, in terms of either the clusters or the individuals. Although not a form of bias as such, the risk of baseline differences can be reduced by using stratified or pair‐matched randomization of clusters. Reporting of the baseline comparability of clusters, or statistical adjustment for baseline characteristics, can help reduce concern about the effects of baseline imbalance.";
loss of clusters and missing outcomes for individuals within clusters;
"not taking the clustering into account ... Such analyses create a 'unit of analysis error' and produce over‐precise results (the standard error of the estimated intervention effect is too small) and P values that are too small. They do not lead to biased estimates of effect. However, if they remain uncorrected, they will receive too much weight in a meta‐analysis"; and
if there is "a herd effect in the cluster‐randomized trials ... such contamination would lead to underestimates of effect. Thus, if an intervention effect is still demonstrated despite contamination in those trials that were not cluster‐randomized, a confident conclusion about the presence of an effect can be drawn. However, the size of the effect is likely to be underestimated. Contamination and herd effects may be different for different types of cluster."
The solution is to correct each cluster‐randomised trial by its intraclass correlation coefficient (ICC), but the Cochrane Handbook for Systematic Reviews of Interventions comments that "In fact this is seldom available in published reports. A common approach is to use external estimates obtained from similar studies." We searched for relevant ICCs in similar studies and planned to correct for clustering effects if possible (Higgins 2011).
Dealing with missing data
We contacted investigators or study sponsors to verify key study characteristics and to obtain missing numerical outcome and 'Risk of bias' data (e.g. when a study was available only as an abstract). Where requested data were not forthcoming, and missing data could introduce bias, we explored the impact of excluding these studies from the overall assessment of results by a sensitivity analysis.
Where numerical outcome data were missing, such as standard deviations or correlation coefficients, and we were unable to obtain these data from the study authors, we calculated these data from other available statistics such as P values according to the methods described in the Cochrane Handbook for Systematic Reviews of Interventions (Higgins 2011).
Assessment of heterogeneity
We assessed data for heterogeneity in each intervention category and used the Chi² test to examine heterogeneity between studies and the I² statistic to assess variability in estimates of effect due to heterogeneity. We planned to perform a meta‐analysis if the I² statistic was less than 70% for groups of studies with a similar intervention. We planned to use strategies for meta‐regression (by quality and by sample size) for the interventions that had more than five RCTs.
Assessment of reporting biases
We constructed funnel plots (plots of the effect estimate from each study against the sample size or effect standard error) to assess the potential for bias related to the size of the trials, which could indicate possible publication bias. We constructed funnel plots for interventions with five or more RCTs because plots for fewer RCTs would be hard to interpret.
Data synthesis
We used the numbers of vaccinated and unvaccinated individuals from all included RCTs and cluster‐randomised trials to synthesise the data as odds ratios (ORs) employing the random‐effects model. We performed meta‐analysis on groups of RCTs where exposure, populations, and outcomes were homogenous, and where the I² statistic was less than 70%. We classified interventions according to CDC norms as: (1) interventions designed to increase community demand for vaccinations; (2) enhance access to vaccination services; (3) provider‐ or system‐level interventions, or (4) societal interventions (CDC 2018).
GRADE and 'Summary of findings' table
We created three 'Summary of findings' tables for three comparisons: interventions to increase community demand, interventions to enhance access, and provider‐ or system‐based interventions, using the outcome of an increased influenza vaccination rate compared to the previous year. We used the five GRADE considerations (study limitations, consistency of effect, imprecision, indirectness, and publication bias) to assess the certainty of evidence as it related to the studies that contributed data to the meta‐analyses for the prespecified outcomes (Atkins 2004). We used methods and recommendations described in Section 8.5 and Chapter 12 of the Cochrane Handbook for Systematic Reviews of Interventions (Higgins 2011), employing GRADEpro GDT software (GRADEpro GDT 2014). We justified all decisions to downgrade the quality of studies in footnotes, and made comments to aid readers’ understanding of the review where necessary.
Subgroup analysis and investigation of heterogeneity
We analysed the included studies according to the three different strategies used by study authors: increasing community demand, enhancing vaccination access, and provider‐ or system‐based interventions. We pooled studies with similar interventions for each of these three groups.
Sensitivity analysis
We carried out sensitivity analyses if interventions were tested by five or more trials. We removed studies with the highest risk of bias, serially, and then examined whether the heterogeneity decreased to a level to permit meta‐analysis (less than 70%). If heterogeneity remained above 70%, we removed the smallest studies, serially, and then examined whether the heterogeneity decreased to a level to permit meta‐analysis (less than 70%).
Results
Description of studies
Results of the search
The searches for this update identified 1497 records. After de‐duplication of records and assessment of titles and abstracts, we obtained six full‐text studies for assessment. We included three new studies for this update. This updated review includes a total of 61 study reports involving 1,055,337 participants. See Figure 1.
1.

Study flow diagram.
Included studies
We included three new trials for a total of 61 included RCTs (Conner 2017; Leung 2017; Stuck 2015). Studies were conducted in 12 countries: the USA (n = 36), Canada (n = 7), Australia (n = 4), the UK (n = 4), Spain (n = 3), and one each in Denmark, Germany, Hong Kong, Israel, New Zealand, Puerto Rico, and Switzerland. See Characteristics of included studies.
Design
Of the 61 included studies, 36 were RCTs and 25 were cluster‐randomised trials.
Sample sizes
There was a wide range of study sizes: the smallest study involved 45 participants (Buffington 1991), and the three largest each involved more than 100,000 participants (Berg 2008; CDC 1995b (Montana); Maglione 2002b).
Setting
All included studies were conducted in primary care settings (one assessed preparations for discharge back to the community and compared reminders to hospital staff to a letter to the general practitioner (GP) on patient discharge back to the community).
Participants
All participants lived in the community and were aged 60 years and older. All healthcare workers were from primary care settings (with the exception of MacIntyre 2003, in which hospital workers either reminded hospital staff or sent a reminder letter to the GP).
Interventions
The 61 included studies had 80 intervention arms. Of these, 53 arms tested interventions to encourage participants to obtain influenza vaccination (n = 767,460); 10 arms aimed to improve health system access for participants to obtain vaccine (n = 9353); and 17 arms encouraged physicians or health systems to increase vaccination rates for participants (n = 278,524). Fifty‐three intervention arms encouraged participants to obtain vaccination; of these, 45 arms used reminder and recall methods, and eight used education techniques for participants. The studies included 10 intervention arms that encouraged improved health system access: one tested group visits to clinics; five investigated home visits; and four offered free vaccines. Of the studies that encouraged improved physician or health systems to increase vaccination rates, 11 arms used reminders, three used education, two paid physicians, and one encouraged health clinic staff to be vaccinated.
Outcomes
Influenza vaccination rates. No studies reported adverse effects.
Funding
Studies were funded by government health organisations (n = 33), foundations (n = 9), organisations that provided healthcare services in the studies (n = 3), and a pharmaceutical company offering free vaccines (n = 1). Fifteen studies did not report study funding sources.
Excluded studies
We excluded a total of 352 studies from this review, three in this most recent update. We excluded studies for the following reasons: not RCT or cluster‐randomised trial (n = 286; two new studies excluded in this update); did not report separate outcome data for people aged 60 years or older (n = 27; one new excluded study in this update); did not report influenza outcomes data (n = 20); or the population of interest did not include people aged 60 years or older (n = 19). We independently reviewed all non‐randomised studies and determined that insufficient data were available to enable an evaluation of the potential effects of known and unknown confounders on risk of bias. We did not include the data from these studies in our analysis. See Characteristics of excluded studies and Table 4.
1. Cohort, case‐control, and time series studies and reasons for exclusion.
| Author and date | Ref ID | Description of groups | Reason for exclusion |
| Historically controlled studies | |||
| Barton 1990 | 1647 | 1983‐84 baseline rates 1984 postcard reminders 1985 postcard reminders + feedback to service chiefs 1986 postcard reminders + feedback to service chiefs + feedback to physicians |
Excluded. Could not assess secular trends for increase in rest of population |
| Chodroff 1990 | Unknown | 1986 historical baseline 1986‐90 residents given preventive checklists |
Excluded. Could not assess secular trends for increase in rest of population |
| Davidson 1984 | 1772 | Intervention for nurse reminder: 50% of eligibles in 2 consecutive years Control: rest of eligible participants (called historical controls but are same years) |
Excluded. Could not assess secular trends for increase in rest of population |
| De Wals 1989 | 1677 | 1984 baseline 1985 information campaign by family physicians 1986 same + collective info campaign |
Excluded. Could not assess secular trends for increase in rest of population |
| Donato 2007 | 2016 | 2002 nurses screened participants' reminders 2003 standing orders 2004 education campaign |
Excluded. Could not assess secular trends for increase in rest of population |
| Gill 2000 | 1114, 1251, 1311 |
1997 baseline rates 1998 reminder to nurse and physician during visit |
Excluded. Could not assess secular trends for increase in rest of population |
| Harris 1990 | 1633 | Retrospective analysis 1979‐80 baseline 1981 nurse prompt 1984 computer prompt |
Excluded. Could not assess secular trends for increase in rest of population |
| Humair 2002 | 2607 | 1995 baseline 1996 intervention |
Excluded. Could not assess secular trends for increase in rest of population |
| Hutchison 1991 | Unknown | 1982‐83 historical baseline 1987‐88 reminder placed on all charts |
Excluded. Could not assess secular trends for increase in rest of population |
| Knoell 1991 | 1619 | 1987‐88 baseline 1989 intervention |
Excluded. Could not assess secular trends for increase in rest of population |
| Malmvall 2007 | 293 | 1999‐2001 baseline (rates were increasing) 2002‐2005 same intervention in each of 4 years (Appears initially to be a time series but is a series of same repeated interventions.) |
Excluded. Could not assess secular trends for increase in rest of population |
| 2 geographical areas (non‐randomised controlled trials) | |||
| Etkind 1996 | 1405 | 2 Massachusetts counties 1 reimbursement for vaccination + education campaigns 1 usual care |
Excluded. Non‐comparable control |
| Harris 2006 | 34 | S Adelaide; intervention N and W Adelaide; control |
Excluded. Non‐comparable control |
| Honkanen 1997 (same databases as Honkanen 2006) | Unknown | Admin Area A: risk of disease‐based influenza vaccination programme Admin Area B: age‐based vaccination programme offered autumn 1993 and 1994 Admin Area C: age‐based vaccination programme offered 1992‐94 |
Not randomised. Control areas may not be comparable. |
| Honkanen 2006 | 404 | 14 municipalities: risk of disease‐based intervention x 2 years 29 municipalities: age‐based intervention x 2 years 12 municipalities: cross‐over from disease‐based intervention in 1992 to age‐based intervention in 1993 |
Excluded. Control areas may not be comparable. |
| Retrospective chart reviews | |||
| Goebel 2005 | 564 | Retrospective chart review of physicians who used standing orders and those who did not | Excluded. Non‐comparable control |
| Jacobs 2001 | 1045 | Retrospective chart review of use of interpreters and non‐use | Excluded. Non‐comparable control |
| Cohorts, not historical | |||
| Bou‐Mias 2006 | 450 | 1 group assigned voice mail reminders 1 group no voice mail reminders |
Excluded. Non‐comparable control |
| Charles 1994 | 120 | Allocated by physician team: Control Intervention |
Excluded. Non‐comparable control |
| Crawford 2005 | 507 | 1 group assigned voice mail reminders 1 group no voice mail reminders |
Excluded. Non‐comparable control |
| Leirer 1989 | 1661 | 2 groups assigned voice mail reminders 2 groups no voice mail reminders |
Excluded. Non‐comparable control |
| Margolis 1992 | No ref ID: found by searching reference lists | 2 clinics assigned as intervention and 2 as control clinics | Excluded. Non‐comparable control |
| Case‐control | |||
| Earle 2003 | 846 | Comparison of influenza vaccination rates of participants in SEER (Survival, Epidemiology, and End Results) tumour registry area with case‐matched controls | Participants in the SEER registry were matched with a 5% random sample of participants with no history of cancer. Participants were excluded if they were enrolled in a health maintenance organisation or if they were not eligible for both parts of Medicare "as they would not have complete treatment information." The 2 cohorts were thus not comparable. |
Studies awaiting classification
Hurley 2017 randomised 5332 adults aged 65 years or older to centralised reminder and recall for influenza vaccination, or usual care. A conference abstract has been published, and full publication has yet to be published. Attempts to contact the study authors have so far been unsuccessful. We will assess this study for inclusion in a future update of this review.
Risk of bias in included studies
2.

'Risk of bias' summary: review authors' judgments about each risk of bias item for each included study.
3.
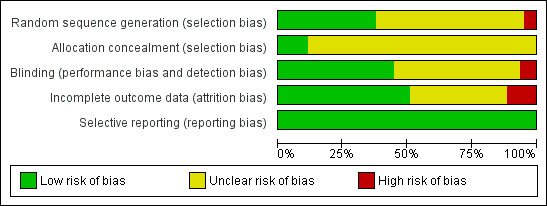
'Risk of bias' graph: review authors' judgments about each risk of bias item presented as percentages across all included studies.
Allocation
We assessed 23 trials as at low risk of bias, 35 trials as at unclear risk of bias, and three trials as at high risk of bias. We assessed seven trials as at low risk of bias for concealment of sequence allocation, and 54 trials as at unclear risk of bias. Three trials were at high risk for randomisation bias (Beck 1997; Kellerman 2000; Lukasik 1987). In Beck 1997, 113 participants did not receive the baseline Senior Health Questionnaire, and the study authors did not state if participants were randomly assigned. Lukasik 1987 reported that "After a random start participants were alternately assigned to each group," and Kellerman 2000 used "alternate randomisation of alphabetised households."
With respect to allocation concealment, only seven trials described their method of allocation concealment and were assessed as at low risk of bias (Conner 2017; Dalby 2000; Garcia‐Aymerich 2007; Hogg 2008; Karuza 1995; Kerse 1999; MacIntyre 2003). The trial authors of the remaining studies did not include an allocation concealment statement.
Blinding
We assessed 27 included trials as at low risk of bias, 30 as at unclear risk of bias, and four as at high risk of bias for this domain. Studies that reported independent verification of vaccination status from databases, or after the trial from databases, were at lower risk of detection bias, especially if the databases were independently maintained by government or health organisation agencies. Of the 27 trials assessed as at low risk of bias, the vaccination outcomes were measured through computerised databases in 17 studies; six stated that healthcare workers were blinded; two that participants were blinded; and eight that those who abstracted data from charts were blinded. The numbers add up to more than 27 because some studies stated more than one method of blinding.
We assessed four studies as at high risk of bias for this domain. Leung 2017 stated that the study was unblinded and that the medical student investigators delivered the intervention. Lukasik 1987 stated that "patients would be told, whether by telephone or in the office, that the vaccine was available, and that they would be given a shot if they wished." Nexøe 1997 stated that "Randomisation was blinded for the GPs. However, GPs were paid the equivalent of USD 36 for each patient vaccinated without patient fee." Spaulding 1991 stated that "Physicians in the Department of Family Practice were aware that a study was in progress and that some of their participants might receive postcards about influenza immunisation. Vaccine was offered to all eligible participants on a walk‐in basis. Patients who presented for immunisation read and signed an informed consent document." The authors of this study did not report if physicians performed the vaccinations.
Incomplete outcome data
Thirty‐one trials (51%) were at low risk and 23 trials (38%) at unclear risk of bias for incomplete outcome data. Seven trials (11%) were at high risk of bias for this domain. In Barnas 1989, there was 15% dropout after randomisation and it was not stated if dropout differed between groups. In Beck 1997, there were 48 (30%) dropouts from the intervention group and 21 (13%) from the control group, and the dropouts were not equivalent in composition. In Clayton 1999 the authors reported: "Because the sensitivity of administrative data is somewhat limited (estimated to be 62.4%, according to Kaiser Permanente Northeast Division studies), the vaccination rates presented are underestimates of the true rates." In Garcia‐Aymerich 2007, only 21 of 44 integrated‐care patients and 41 of 69 conventional‐care patients were assessed after 12 months, and whether the dropouts differed was not assessed. In Kiefe 2001, 13 of 48 physicians and their patients in the intervention group with benchmarking and 14 of 49 in the comparison group without benchmarking dropped out; a personal communication from author Dr C Kiefe stated: "It was not possible to review records for physicians who no longer wished to participate or were lost to follow‐up." In Kim 1999, outcomes for the 7 physicians who dropped out and their 128 participants, and a further 299 participants because their physician left the medical group, were not presented, and there was no ascertainment if the dropouts differed. In the group of 239 patients sent a letter in McDowell 1986, only 2 were returned, but in the phone group the nurse was able to contact only 177 of 208 (85%); in the personal contact group the intervention was delivered to 201 of 218 (92%); and the authors stated: "8 weeks after the study ended we called random samples of patients from each study group who had apparently not been vaccinated to estimate the extent of underreporting." (Of the 97 contacted, the percentages unaware of the programme, refusing vaccination, and undecided varied between the intervention and control groups.)
Selective reporting
All 61 trials reported the results of all of their planned interventions to increase vaccination rates, and also reported the number of dropouts and thus were free of selective reporting.
Other potential sources of bias
We constructed funnel plots for interventions where there were five or more RCTs. There were only two such groups: reminders to participants and tailored reminders to participants. The funnel plots did not show evidence of publication bias (Figure 4; Figure 5).
4.

Funnel plot of comparison: 1 Increasing community demand, outcome: 1.1 Client reminder and recall (postcard) compared to no intervention.
5.

Funnel plot of comparison: 1 Increasing community demand, outcome: 1.2 Client reminder and recall (tailored letter or postcard or phone call) compared to no intervention.
Unit of analysis issues
Of the 61 included studies, 25 were cluster‐randomised trials; in 13 of these, the study authors corrected the cluster effect statistically (Abramson 2011; Berg 2008; Chan 2002; Dapp 2011; Hogg 1998; Hull 2002; Kerse 1999; Kiefe 2001; Kim 1999; Kouides 1998; Lemelin 2001; Satterthwaite 1997; Siriwardena 2002).
Cluster‐randomised trials with clustering effects controlled for in the analysis (n = 13)
Five cluster‐randomised trials were randomised by physicians. Chan 2002 corrected randomisation by physician by general linear mixed models. Dapp 2011 corrected randomisation by physician by generalised estimating equations. Kiefe 2001 corrected nesting of participants' data within physicians by controlling for baseline performance and by generalised linear models (but 27 of 97 physicians were lost to follow‐up). Kim 1999 corrected randomisation by physician (to receive either ongoing education, academic detailing and feedback, or ongoing education) by mixed‐model analysis of variance (ANOVA), with participants' data nested within physicians. Although the study authors did not explicitly say that the effects of clustering were assessed, the analysis likely accomplished this result. Kouides 1998 randomised physicians to the intervention (additional remuneration for influenza vaccination uptake of 70% or above, with each physician's individual vaccination uptake displayed on posters in clinics, or to usual remuneration). Baseline differences were controlled for by linear regression equations by practices with seven potential confounders.
Three cluster‐randomised trials were randomised by practice. In Lemelin 2001, randomisation by practice was corrected by general linear model repeated‐measures ANOVA. Satterthwaite 1997 corrected for clustering using the Rao‐Scott method. Siriwardena 2002 corrected randomisation of practices to educational outreach, audit and feedback compared to audit and feedback as follows: "Because the target of the intervention and therefore the unit of randomisation was the practice, cluster‐randomised methodology was used" (p. 736). Siriwardena 2002 used Egret and SPSS programs for analysis and "Poisson regression was used to detect significant differences between intervention and control groups in vaccination uptake change, using population at risk as an offset and taking account of the stratification" (p. 737). The ICCs were not provided, but the study authors stated that they took the clustered design into account (Siriwardena 2002).
In one cluster‐randomised trial, randomisation was conducted by the clinic. In Abramson 2011, randomisation by clinics was corrected with the Rao‐Scott procedure in computing odds ratios with an ICC of 0.015.
In four cluster‐randomised trials, randomisation was done by household. Hull 2002 and Kerse 1999 corrected randomisation by household within practices by adjusting for clustering by generalised linear models, and Berg 2008 by using the 'proc genmod' command repeated option in SAS. Hogg 1998 randomised participants; subsequently, participants' entire families were included in the groups to which the participants were assigned. The lack of group baseline equivalence in age, family size, and number of procedures was corrected for in the analysis, thus groups were made equivalent (there were no data on the percentage of letters not delivered). This was a cluster‐randomised trial to increase the uptake of several health interventions, and the authors corrected for differences in the numbers achieved before randomisation.
Interaction among participants or among health team members was an explicit part of the research design in these cluster‐randomised trials. For example, in Lemelin 2001 and Hogg 2008 facilitators visited practices and worked with practice team members to encourage increased uptake; in Kerse 1999, the intervention was an educational programme for GPs.
Cluster‐randomised trials with clustering effects not controlled for in the analysis (n = 12)
While the solution is to correct each cluster‐randomised trial by its ICC, the Cochrane Handbook for Systematic Reviews of Interventions comments that "In fact this is seldom available in published reports. A common approach is to use external estimates obtained from similar studies" (Higgins 2011). We were not able to find ICCs relevant to this group of studies.
Four trials were randomised by practice, three by physician, two by household, and three by place of residence.
Randomisation by practice
In Buffington 1991, for 13 private group practices, 45 physicians were randomised to two interventions: a poster in the physician's office displaying the number of influenza vaccinations they had given, or poster plus reminder postcards sent to all patients. The control group received no intervention. There were no data on whether the physicians or the patients in these practices were similar. Personal communication from Dr Marc LaForce described the interest among the control group physicians and competition between physicians (LaForce 2017 [pers comm]). Hogg 2008 randomised solo or group practices to either intervention (27 practices) or control (27 practices), and two nurses with master's degrees were assigned (one to 13 and the other to 14 intervention practices). The control group had 58.7% female physicians per practice (intervention had 33.2%), and 59.2% had practice nurses (intervention had 51.8%). Practices were similar in numbers of physicians per practice, hours booked/week, date of physician's graduation from medical school, and scores on the pre‐intervention preventive performance index. Clusters could differ by numbers of patients, physicians, or the availability of an intervention nurse. Outcomes were summarised at the practice level. Karuza 1995 randomised 13 group practices to either receive an intervention of a group discussion to adopt and implement a CDC influenza vaccination guideline, or to no intervention (control group). The intervention physicians had more visits per patient during the influenza vaccination season (2.1 versus 1.6, P < 0.05) and more arthritis patients (21% versus 11%, P < 0.05), but were otherwise similar. There were no outcome differences between the 13 practice groups, so data were analysed for the 51 physicians as a group. Eleven per cent of charts were not available for review at study end. Outcomes were analysed at the physician level. There was opportunity for interaction between participants, physicians, and team members. Morrissey 1995 randomised participants to receive a nursing intervention within practices from nurses or physician assistants.
Randomisation by physician
Chambers 1991 randomised internal medicine residents into three groups (all their patients received a reminder, or half their patients received a reminder, or none of their patients received a reminder). There were baseline group differences in patient age, risk level, and number of visits. Regression analyses were run to assess the effects of these differences, but these were not corrected for in the overall results. From a list of all primary care physicians in Louisiana, Kumar 1999 randomly selected 750 to the intervention group. Physicians in the intervention group were provided with a listing of their Medicare patient pool immunisation rate and missed opportunities, and "were encouraged to evaluate ways in which their practices might improve upon the baseline immunisation status and were offered assistance in designing quality improvement projects to effect such a change. The information provided to the physicians included computed uptake for all selected physicians which allowed them to compare their uptake with those of other physicians." Nexøe 1997 randomised 13 solo physicians for their patients to receive a postcard inviting them to receive free influenza vaccination, or a postcard to receive vaccine at their own cost, or to no postcard. There were no data on whether the practices or physicians were similar.
Randomisation by household
Clayton 1999 randomised households to receive postcard reminders. The groups were equivalent at baseline on age, gender, and state of residence; there was no information on the percentage of postcards not received. While not part of the study design, 8% of participants also received a reminder call from their GP. Kellerman 2000 randomised households to receive reminder phone calls; there were no data on group baseline equivalence, and only 66% of phone calls were successful.
Randomisation by place of residence
CDC 1995a (Wyoming) and CDC 1995b (Montana) randomised regions (composed of zip code aggregates) in two states to receive reminder letters. There were no data on baseline equivalence or the percentage of letters not received. McCaul 2002 stated: "First, we randomly assigned counties to either the reminder‐letter (n = 17), action‐letter (n = 12), or no letter (n = 20) conditions. Within the reminder‐letter counties we then randomly assigned individuals within each county to either the reminder‐only, reminder plus positive frame, or reminder plus negative frame conditions. Within the action letter counties, all individuals received the same letter from their county public health offices." (p. 625). The study design was thus clustered, but incorporated random individual allocation within the reminder letter group. There were no data on group baseline equivalence and there was a 6% non‐participation rate mostly due to returned letters.
Conclusions about the cluster‐randomised trials not corrected by the study authors for clustering effects
For the cluster‐randomised trials randomised by practice or physician to intervention or control, there may be discussions between some team members; some physician participants may differ in level of motivation, organisation, and persuasiveness; and the patients may speak to each other in the waiting room before making a decision about vaccination. Those studies where the physician was designated as the focus of the intervention (and not just a way of administratively reaching patients) may be expected to have the strongest clustering effects. Hogg 2008 noted that the practices and the physicians were similar, and Karuza 1995 that the physicians were similar. Kouides 1998 controlled for baseline differences by regression equations.
Clustering within households should have an effect only if the household members had different attitudes to vaccination or receiving interventions.
For the studies that randomised by place of residence (states in the USA), there were no data on baseline equivalence, but it is highly unlikely there were conversations between potential participants. Differences between groups could arise only from differences in socioeconomic status or culture that affect willingness to receive vaccination or interventions.
As none of these cluster‐randomised trials stated ICCs, and there are no standard ICCs published for this type of intervention, we were unable to correct for clustering in those cluster‐randomised trials where the study authors had not corrected for clustering. The only ICC reported was in a study by Abramson 2011 (who noted an ICC of 0.015), but the intervention was vaccinating staff and physicians (with the hope that this would increase physicians' motivation to vaccinate patients) with no intervention to vaccinate patients.
The limited number of these cluster‐randomised trials and the variability of the method of randomisation (by practice, physician, household, or geographic area) meant that we did not have any ICCs from other studies with which to correct for clustering.
We did not find any cluster‐randomised trials where individuals joined clusters after randomisation.
RCTs randomising individual participants (n = 36)
We included 36 RCTs presenting individual participant data that did not involve clustering.
Some studies initially appeared to be cluster‐randomised trials but were not. In McDowell 1986, although families were selected, only one patient was selected per family and then randomised. In Frank 2004, individual participants were randomised by the last digit of their family medical record number to intervention (physicians received automatic electronic reminders for 12 preventive care interventions) or control. In this study, groups were equivalent at baseline, but physicians were not blinded to group of allocation. In Beck 1997, the intervention group received visits to their physician and nurse at the clinic in groups (average size eight) for:
a 15‐minute warm up and socialisation event, with information presented on specific disease processes;
a 15‐minute break for socialisation, followed by a nurse checking blood pressure, immunisation status, immediate needs and arranging for a visit with the patient's physician;
15 minutes of questions and answers and a planned next visit; or
a 30‐minute visit with their physician.
While it was expected that intervention patients would socialise and exchange information with one another, randomisation was by individual patient. In Maglione 2002a, Maglione 2002b, Maglione 2002c, and Maglione 2002d, the intervention was delivered to individuals, but it was not stated whether randomisation was by region within states. In CDC 1995a (Wyoming) and CDC 1995b (Montana), individuals were randomised within specific regions of the two states.
Availability of baseline influenza vaccination rates
The key predictor of influenza vaccination is whether the consumer received vaccination in the previous year. We therefore initially conducted separate analyses for RCTs that reported baseline influenza vaccination uptake for both treatment and control groups for the year prior to the intervention, and for RCTs with no baseline data (Appendix 8).
Table 5 shows that for the 28 RCTs with data for the previous year uptake, the difference in vaccination uptake in the treatment and control groups was 0% to 2% in 18 RCTs, 3% to 4% in seven RCTs, and 5% or more in three RCTs. Randomisation had thus been relatively effective in producing intervention and control groups with similar uptake of influenza vaccination in the year prior to the intervention. We therefore decided that it would be appropriate to analyse the studies with and without baseline influenza uptake together.
2. Differences in influenza vaccination percentages in the year before intervention for those randomised controlled trials providing this information.
| Author and date | Allocation concealment | Baseline influenza vaccination rate treatment group (%) | Baseline influenza vaccination rate control group (%) |
| Difference 2% | Or less | ||
| Abramson 2011 | Unclear | 43.4 | 44.4 |
| Arthur 2002 | Unclear | 48.7 | 46.7 |
| Barnas 1989 | Unclear | 5 | 5 |
| Beck 1997 | No | 74 | 72 |
| Clayton 1999 | Unclear | 0% for not vaccinated 100% for vaccinated |
0% for not vaccinated 100% for vaccinated |
| Frank 2004 | Yes | 65 | 66 |
| Ives 1994 | Unclear | 41.3 | 40.6 |
| Karuza 1995 | Unclear | 47.5 | 46.5 |
| Kiefe 2001 | Unclear | 40 | 40 |
| Kim 1999 | Unclear | 79 | 80 |
| Kouides 1998 | Unclear | 57.6 | 58 |
| Krieger 2000 | Yes | 0% for not vaccinated 100% for vaccinated |
0% for not vaccinated 100% for vaccinated |
| McCaul 2002 | Unclear | 0 | 0 |
| McDowell 1986 | Unclear | 0 | 0 |
| CDC 1995b (Montana) (McMahon Wyoming) | Unclear | Participants who received a personal letter: 23.8 Participants who received a form letter: 20.5 |
Participants who received no letter: 21.6 |
| Moran 1995 | Unclear | 16.7 | 16.6 |
| Nuttall 2003 | Unclear | 0 | 0 |
| Roca 2012 | Unclear | 50.9 | 49.1 |
| Difference | 3% to 4% | ||
| Dietrich 1989 | Unclear | 36 | 39 |
| Herman 1994 | Unclear | 31.3 | 34.3 |
| Lemelin 2001 | Unclear | 46.1 | 49.4 |
| Lukasik 1987 | No | 7.3 | 4.5 |
| MacIntyre 2003 | Yes | 61 | 64 |
| CDC 1995b (Montana) (McMahon Montana 1994) | Unclear | Participants who received a personal letter: 41.2 Participants who received a form letter: 46 |
Participants who received no letter: 42.3 |
| Siriwardena 2002 | Unclear | 48.6 | 44.7 |
| Difference | 5% or more | ||
| Chan 2002 | Unclear | 31.8 solo 42.5 group practice |
37.8 solo 30.1 group practice |
| Puech 1998 | Yes | 32 | 38 |
| Marrero 2006 | Unclear | 36 | 14 |
Effects of interventions
See: Table 1; Table 2; Table 3
Summary of findings for the main comparison. Increasing community demand compared to no intervention or another intervention for increasing influenza vaccination uptake.
| Increasing community demand compared to no intervention or another intervention for increasing influenza vaccination uptake | ||||||
| Patient or population: people aged 60 years and older living in the community Setting: the community Intervention: increasing community demand Comparison: no intervention or another intervention | ||||||
| Outcomes | Anticipated absolute effects* (95% CI) | Relative effect (95% CI) | № of participants (studies) | Certainty of the evidence (GRADE) | Comments | |
| Comparator | Intervention | |||||
| Client reminder and recall (postcard) compared to no intervention | Study population | ‐ | 402,367 (17 RCTs) | ⊕⊕⊕⊕ HIGH | We could not pool the data due to heterogeneity (I² = 97%). The 95% CI of 11/17 trials was above unity, implying that all these interventions increased vaccination rates. | |
| 153 per 1000 | 182 per 1000 (163 to 203) | |||||
| Client reminder and recall (tailored letter or postcard or phone call) compared to no intervention | Study population | ‐ | 195,964 (16 RCTs) | ⊕⊕⊕⊕ HIGH | We could not pool the data due to heterogeneity (I² = 99%). The 95% CI of 12/16 trials was above unity, implying that all these interventions increased vaccination rates. | |
| 105 per 1000 | 185 per 1000 (155 to 220) | |||||
| Client reminder and recall (letter + leaflet or postcard) compared to letter | Study population | OR 1.11 (1.07 to 1.15) | 64,200 (3 RCTs) | ⊕⊕⊕⊕ HIGH | ||
| 208 per 1000 | 225 per 1000 (219 to 231) | |||||
| Client reminder and recall (customised letter or phone call) compared to form letter | Study population | ‐ | 82,465 (4 RCTs) | ⊕⊕⊕⊕ HIGH | We could not pool the data due to heterogeneity (I² = 96%). The 95% CI of 2/4 RCTs was above unity, implying that these 2 trials increased vaccination rates. | |
| 133 per 1000 | 160 per 1000 (120 to 209) | |||||
| Client reminder and recall (telephone call from retired teacher plus educational brochure) compared to usual publicity | Study population | OR 3.33 (1.79 to 6.22) | 193 (1 RCT) | ⊕⊕⊕⊕ HIGH | ||
| 231 per 1000 | 500 per 1000 (349 to 651) | |||||
| Client reminder and recall (telephone invitation) compared to invitation to patient when "dropped in" to clinic | Study population | OR 2.72 (1.55 to 4.76) | 243 (1 RCT) | ⊕⊕⊕⊝ MODERATE 1 | ||
| 220 per 1000 | 433 per 1000 (304 to 572) | |||||
| Brochure + lottery for free groceries compared to no intervention | Study population | OR 1.04 (0.62 to 1.76) | 291 (1 RCT) | ⊕⊕⊕⊕ HIGH | ||
| 254 per 1000 | 261 per 1000 (174 to 374) | |||||
| Questionnaires to clients about attitudes | Study population | OR 1.13 (1.03 to 1.24) | 13,809 (1 RCT) | ⊕⊕⊕⊕ HIGH | ||
| 750 per 1000 | 773 per 1000 (756 to 788) | |||||
| Client‐based education (health risk appraisal) compared to no intervention | Study population | ‐ | 6300 (4 RCTs) | ⊕⊕⊕⊕ HIGH | We could not pool the data due to heterogeneity (I² = 96%). The 95% CI of all 4 trials was above unity, implying that all 4 increased vaccination rates. | |
| 291 per 1000 | 582 per 1000 (388 to 754) | |||||
| Client‐based education (nurses or pharmacists educated and nurses vaccinated participants) compared to no intervention | Study population | OR 3.29 (1.91 to 5.66) | 614 (2 RCTs) | ⊕⊕⊕⊕ HIGH | ||
| 90 per 1000 | 246 per 1000 (159 to 360) | |||||
| Client‐based education (nurses educated and vaccinated participants) compared to nurses educated participants | Study population | OR 152.95 (9.39 to 2490.67) | 485 (1 RCT) | ⊕⊕⊕⊕ HIGH | ||
| 0 per 1000 | 0 per 1000 (0 to 0) | |||||
| Face‐to‐face 3‐minute conversation compared to no intervention | Study population | OR 1.62 (1.11 to 2.35) | 529 (1 RCT) | ⊕⊕⊕⊝ MODERATE 2 | ||
| 254 per 1000 | 355 per 1000 (274 to 444) | |||||
| *The risk in the intervention group (and its 95% confidence interval) is based on the assumed risk in the comparison group and the relative effect of the intervention (and its 95% CI). CI: confidence interval; OR: odds ratio; RCT: randomised controlled trial | ||||||
| GRADE Working Group grades of evidence High certainty: We are very confident that the true effect lies close to that of the estimate of the effect. Moderate certainty: We are moderately confident in the effect estimate: the true effect is likely to be close to the estimate of the effect, but there is a possibility that it is substantially different. Low certainty: Our confidence in the effect estimate is limited: the true effect may be substantially different from the estimate of the effect. Very low certainty: We have very little confidence in the effect estimate: the true effect is likely to be substantially different from the estimate of effect. | ||||||
1High risk from sequence generation and blinding. 2High risk for blinding.
Summary of findings 2. Enhancing vaccination access compared to no intervention or another intervention for increasing influenza vaccination uptake.
| Enhancing vaccination access compared to no intervention or another intervention for increasing influenza vaccination uptake | ||||||
| Patient or population: people aged 60 years and older living in the community Setting: the community Intervention: enhancing vaccination access Comparison: no intervention or another intervention | ||||||
| Outcomes | Anticipated absolute effects* (95% CI) | Relative effect (95% CI) | № of participants (studies) | Certainty of the evidence (GRADE) | Comments | |
| Comparator | Intervention | |||||
| Group visits of participants to physician and nurse compared to usual care | Study population | OR 27.19 (1.60 to 463.25) | 321 (1 RCT) | ⊕⊕⊕⊝ MODERATE 1 | ||
| 0 per 1000 | 0 per 1000 (0 to 0) | |||||
| Home visit compared to invitation to attend influenza vaccination clinic | Study population | OR 1.30 (1.05 to 1.61) | 2112 (2 RCTs) | ⊕⊕⊕⊕ HIGH | ||
| 213 per 1000 | 260 per 1000 (221 to 303) | |||||
| Home visit with encouragement to receive influenza vaccination compared to home visit with safety intervention | Study population | OR 0.98 (0.64 to 1.50) | 350 (1 RCT) | ⊕⊕⊕⊕ HIGH | ||
| 566 per 1000 | 561 per 1000 (455 to 662) | |||||
| Home visit by nurse or group sessions with encouragement to receive influenza vaccination plus care plan developed with physician compared to no intervention | Study population | ‐ | 2069 (2 RCTs) | ⊕⊕⊕⊕ HIGH | We could not pool the data due to heterogeneity (I² = 91%). The 95% CI for both trials was above unity, implying that both interventions increased vaccination rates. | |
| 566 per 1000 | 706 per 1000 (663 to 746) | |||||
| Free influenza vaccine compared to invitation to be vaccinated but patient pays | Study population | OR 2.36 (1.98 to 2.82) | 2251 (2 RCTs) | ⊕⊕⊕⊕ HIGH | ||
| 304 per 1000 | 507 per 1000 (463 to 552) | |||||
| Free influenza vaccine compared to no intervention | Study population | ‐ | 2250 (2 RCTs) | ⊕⊕⊕⊕ HIGH | We could not pool the data due to heterogeneity (I² = 85%). The 95% CI for both trials was above unity, implying that both interventions increased vaccination rates. | |
| 184 per 1000 | 550 per 1000 (391 to 700) | |||||
| *The risk in the intervention group (and its 95% confidence interval) is based on the assumed risk in the comparison group and the relative effect of the intervention (and its 95% CI). CI: confidence interval; OR: odds ratio; RCT: randomised controlled trial | ||||||
| GRADE Working Group grades of evidence High certainty: We are very confident that the true effect lies close to that of the estimate of the effect. Moderate certainty: We are moderately confident in the effect estimate: the true effect is likely to be close to the estimate of the effect, but there is a possibility that it is substantially different. Low certainty: Our confidence in the effect estimate is limited: the true effect may be substantially different from the estimate of the effect. Very low certainty: We have very little confidence in the effect estimate: the true effect is likely to be substantially different from the estimate of effect. | ||||||
1High risk for randomisation and incomplete data.
Summary of findings 3. Provider‐ or system‐based interventions compared to no intervention or another intervention for increasing influenza vaccination uptake.
| Provider‐ or system‐based interventions compared to no intervention or another intervention for increasing influenza vaccination uptake | ||||||
| Patient or population: people aged 60 years and older living in the community Setting: the community Intervention: provider‐ or system‐based interventions Comparison: no intervention or another intervention | ||||||
| Outcomes | Anticipated absolute effects* (95% CI) | Relative effect (95% CI) | № of participants (studies) | Certainty of the evidence (GRADE) | Comments | |
| Comparator | Intervention | |||||
| Reminder (to physician) compared to no reminder | Study population | ‐ | 202,264 (4 RCTs) | ⊕⊕⊕⊕ HIGH | We could not pool the data due to heterogeneity (I² = 90%). The 95% CI for 3/4 trials was above unity, implying that these 3 interventions increased vaccination rates. | |
| 46 per 1000 | 56 per 1000 (42 to 72) | |||||
| Reminder to physician about all participants compared to reminder about half of participants | Study population | OR 2.47 (1.53 to 3.99) | 316 (1 RCT) | ⊕⊕⊕⊕ HIGH | ||
| 314 per 1000 | 530 per 1000 (411 to 646) | |||||
| Reminder (to hospital staff to vaccinate patient) compared to reminder letter to GP on day of discharge | Study population | OR 1.70 (0.51 to 5.70) | 45 (1 RCT) | ⊕⊕⊕⊕ HIGH | ||
| 500 per 1000 | 630 per 1000 (338 to 851) | |||||
| Posters in clinic displaying influenza vaccination rates to encourage doctors to compete plus postcards to participants compared to no intervention | Study population | OR 2.03 (1.86 to 2.22) | 8376 (1 RCT) | ⊕⊕⊕⊕ HIGH | ||
| 504 per 1000 | 673 per 1000 (654 to 693) | |||||
| Posters in clinic displaying influenza vaccination rates to encourage doctors to compete plus postcards to participants compared to posters alone | Study population | OR 1.06 (0.95 to 1.19) | 5753 (1 RCT) | ⊕⊕⊕⊕ HIGH | ||
| 661 per 1000 | 674 per 1000 (649 to 699) | |||||
| Facilitator encouragement of prevention manoeuvres including influenza vaccination compared to no intervention | Study population | ‐ | 2183 (3 RCTs) | ⊕⊕⊕⊝ MODERATE 1 | We could not pool the data due to heterogeneity (I² = 94%). The 95% CI for 3/4 trials was above unity, implying that the 3 interventions increased vaccination rates. | |
| 154 per 1000 | 500 per 1000 (92 to 907) | |||||
| Educational reminders, academic detailing, and peer comparisons to physicians compared to mailed educational materials | Study population | OR 1.13 (0.80 to 1.58) | 1400 (1 RCT) | ⊕⊕⊕⊝ MODERATE 2 | ||
| 99 per 1000 | 111 per 1000 (81 to 149) | |||||
| Chart review and feedback to physician plus benchmarking to vaccination rates achieved by top 10% of physicians compared to chart review and feedback | Study population | OR 3.43 (2.37 to 4.97) | 1360 (1 RCT) | ⊕⊕⊕⊝ MODERATE 3 | ||
| 60 per 1000 | 180 per 1000 (132 to 241) | |||||
| Educational outreach plus feedback to practice teams versus written feedback to practice teams | Study population | OR 0.77 (0.72 to 0.81) | 27,580 (1 RCT) | ⊕⊕⊕⊕ HIGH | ||
| 254 per 1000 | 208 per 1000 (197 to 216) | |||||
| Payment to physicians versus no payment | Study population | OR 2.22 (1.77 to 2.77) | 2815 (2 RCTs) | ⊕⊕⊕⊕ HIGH | ||
| 100 per 1000 | 198 per 1000 (165 to 236) | |||||
| Intervention to increase staff influenza vaccination rate versus no intervention | Study population | OR 1.04 (0.97 to 1.12) | 26,432 (1 RCT) | ⊕⊕⊕⊕ HIGH | ||
| 137 per 1000 | 142 per 1000 (133 to 151) | |||||
| *The risk in the intervention group (and its 95% confidence interval) is based on the assumed risk in the comparison group and the relative effect of the intervention (and its 95% CI). CI: confidence interval; OR: odds ratio; RCT: randomised controlled trial | ||||||
| GRADE Working Group grades of evidence High certainty: We are very confident that the true effect lies close to that of the estimate of the effect. Moderate certainty: We are moderately confident in the effect estimate: the true effect is likely to be close to the estimate of the effect, but there is a possibility that it is substantially different. Low certainty: Our confidence in the effect estimate is limited: the true effect may be substantially different from the estimate of the effect. Very low certainty: We have very little confidence in the effect estimate: the true effect is likely to be substantially different from the estimate of effect. | ||||||
1One trial at high risk for incomplete data. 2High risk for incomplete data. 3High risk for incomplete data.
The primary outcome was uptake of vaccination against influenza in those aged 60 years or older. The outcome measure for all interventions was any change in the percentage of participants who received influenza vaccination.
1. Interventions to increase community demand
To increase community demand, 41 trials with 53 arms tested 12 intervention strategies with 767,460 participants. Forty‐five arms tested methods of client reminder and recall, and eight focused on client education. For this group of interventions, a successful intervention that could be meta‐analysed was client reminders or recalls by letter or leaflet. Succesful interventions tested by single studies were patient outreach by retired teachers; invitations by clinic receptionists; nurses educating and vaccinating patients; medical students counselling patients; and multiple recall questionnaires. Some interventions could not be meta‐analysed due to significant heterogeneity: 17 studies testing simple reminders, 16 testing personalised reminders, two studies of customised letters compared to form letters, and four studies of health risk appraisals leading to a recommendation for vaccination. One study of a lottery for free groceries was found not to be effective.
Client reminders and recall
Reminder postcard
Seventeen RCTs assessed the simplest kind of intervention, that is a patient reminder postcard compared to no intervention (intervention (n = 125,801); control (n = 276,566)) (Baker 1998; Barnas 1989; Berg 2008; CDC 1995a (Wyoming); CDC 1995b (Montana); Clayton 1999; Hogg 1998; Maglione 2002a; Maglione 2002b; Maglione 2002c; McCaul 2002; Minor 2010; Moran 1992; Moran 1995; Moran 1996; Puech 1998). There was marked heterogeneity (Chi² = 535.169, P < 0.001; I² = 97%), and data could not be pooled (Analysis 1.1; Figure 5). The 95% confidence interval (CI) of 11/17 trials was above unity, implying that all these interventions increased vaccination rates: Baker 1998 (odds ratio (OR) 1.15, 95% CI 1.06 to 1.26); Boca 2012 (OR 1.20, 95% CI 1.02 to 1.41); Maglione 2002a (OR 1.42, 95% CI 1.13 to 1.80); Maglione 2002b (OR 1.05, 95% CI 1.00 to 1.11); Maglione 2002c (OR 1.14, 95% CI 1.00 to 1.08); McCaul 2002 (OR 1.33, 95% CI 1.21 to 1.47); CDC 1995a (Wyoming) (OR 1.91, 95% CI 1.81 to 2.02); CDC 1995b (Montana) (OR 1.51, 95% CI 1.42 to 1.61); Minor 2010 (OR 1.82, 95% CI 1.00 to 3.30); Moran 1996 (OR 2.05, 95% CI 1.23 to 3.41); and Puech 1998 (OR 3.75, 95% CI 1.87 to 7.56). There were insufficient studies in each 'Risk of bias' category with an appropriate I² statistic to permit sensitivity analyses by 'Risk of bias' category.
1.1. Analysis.
Comparison 1 Increasing community demand, Outcome 1 Client reminder and recall (postcard) compared to no intervention.
Letter, postcard, or phone call
Sixteen RCTs assessed letters, postcards, or phone calls personalised to the participant's health status compared to no intervention (intervention (n = 65,005); control (n = 130,959)) (Baker 1998; CDC 1995a (Wyoming); CDC 1995b (Montana); Díaz Grávalos 1999; Dietrich 1989; Hogg 1998; Hull 2002; Humiston 2011; Kellerman 2000; McCaul 2002; McDowell 1986; Minor 2010; Mullooly 1987; Roca 2012; Smith 1999; Spaulding 1991). There was marked heterogeneity (Chi² = 539.90, P < 0.001; I² = 99%), and data could not be pooled (Analysis 1.2). The 95% CI of 12/16 trials was above unity, implying that all these interventions increased vaccination rates: Baker 1998 (OR 1.22, 95% CI 1.13 to 1.31); Díaz Grávalos 1999 (OR 6.92, 95% CI 3.07 to 15.64); Hull 2002 (OR 1.27, 95% CI 1.02 to 1.58); Humiston 2011 (OR 6.25, 95% CI 5.41 to 7.22); McCaul 2002 (OR 1.61, 95% CI 1.49 to 1.74); CDC 1995a (Wyoming) (OR 1.79, 95% CI 1.69 to 1.90); CDC 1995b (Montana) (OR 2.07, 95% CI 1.45 to 2.20); Minor 2010 (OR 2.18, 95% CI 1.13 to 4.18); Mullooly 1987 (OR 1.48, 95% CI 1.24 to 1.76); Roca 2012 (OR 6.33, 95% CI 2.84 to 14.14); Smith 1999 (OR 1.24, 95% CI 1.14 to 1.35); and Spaulding 1991 (OR 3.29, 95% CI 1.82 to 5.96). There were insufficient studies in each 'Risk of bias' category with an appropriate I² statistic to permit sensitivity analyses by 'Risk of bias' category.
1.2. Analysis.
Comparison 1 Increasing community demand, Outcome 2 Client reminder and recall (tailored letter or postcard or phone call) compared to no intervention.
Reminder letter + leaflet or postcard versus a reminder letter only
Three trials compared a reminder letter plus leaflet (or postcard) to a letter (intervention (n = 32,112); control (n = 32,088)) (OR 1.11, 95% CI 1.07 to 1.15; P < 0.001; I² = 0%; Analysis 1.3) (Maglione 2002b; Maglione 2002d; Nuttall 2003).
1.3. Analysis.
Comparison 1 Increasing community demand, Outcome 3 Client reminder and recall (letter + leaflet or postcard) compared to letter.
Letter or phone call versus form letter
Four trials compared a customised letter or phone call to a form letter (intervention (n = 39,798); control (n = 42,667)) (Analysis 1.4) (CDC 1995a (Wyoming); CDC 1995b (Montana); Hogg 1998; Minor 2010). There was marked heterogeneity (Chi² = 74.39, P < 0.001; I² = 96%), and data could not be pooled. The 95% CI of two trials was above unity, implying that both these interventions increased vaccination rates: Minor 2010 (OR 1.93, 95% CI 1.02 to 3.64) and CDC 1995b (Montana) (OR 1.37, 95% CI 1.27 to 1.48). We assessed all four trials as at unclear risk of bias for randomisation; two trials were at low risk and two at unclear risk for attrition bias. We were thus unable to perform a sensitivity analysis.
1.4. Analysis.
Comparison 1 Increasing community demand, Outcome 4 Client reminder and recall (customised letter or phone call) compared to form letter.
Telephone calls to clients
Telephone calls to clients are much more time intensive, requiring contacting the consumer (sometimes with multiple attempts), presenting information, and arranging an appointment.
Krieger 2000 (intervention (n = 102); control (n = 91)) compared a telephone call from a retired teacher plus an educational brochure to usual publicity (OR 3.33, 95% CI 1.79 to 6.22; P < 0.001; Analysis 1.5). However, for participants who had been vaccinated the previous year, vaccination uptake in the intervention group declined from 100% to 98.5%, and in the control group from 100% to 94.7%, a non‐significant difference.
1.5. Analysis.
Comparison 1 Increasing community demand, Outcome 5 Client reminder and recall (telephone call from retired teacher plus educational brochure) compared to usual publicity.
Lukasik 1987 (intervention (n = 120); control (n = 123)) compared telephone vaccination invitations versus an invitation made when participants dropped into the clinic (OR 2.72, 95% CI 1.55 to 4.76; P = 0.001; Analysis 1.6).
1.6. Analysis.
Comparison 1 Increasing community demand, Outcome 6 Client reminder and recall (telephone invitation) compared to invitation to patient when "dropped in" to clinic.
Lottery for free groceries
This was the most unusual intervention. Moran 1996 (intervention (n = 153); control (n = 138)) compared a brochure plus a lottery for free groceries to no intervention (OR 1.04, 95% CI 0.62 to 1.76; P = 0.88; Analysis 1.7).
1.7. Analysis.
Comparison 1 Increasing community demand, Outcome 7 Brochure + lottery for free groceries compared to no intervention.
Questionnaires seeking intentions
Conner 2017 (intervention (n = 3100); control (n = 3200)) in a comprehensive RCT compared six different questionnaires to motivate individuals to attend for influenza vaccination. One questionnaire was a simple enquiry about intention to attend for vaccination. A second questionnaire asked about regret if the participant did not attend. A third questionnaire asked about benefits (four questions: would benefit both me and people I know; I'd feel good about myself; responsible thing to do; will protect the health of people I care about). For each of these three questionnaire groups there was a parallel group that received the same questions plus a sticky note ("Please take a few minutes to complete this for us. Thank you"). There were minimal and non‐significant differences in vaccination rates among these three question groups, and when grouped together the average vaccination rate was 2.8% higher than control (414 additional vaccinees). The OR was 1.13 (95% CI 1.03 to 1.24; P = 0.0078; Analysis 1.8).
1.8. Analysis.
Comparison 1 Increasing community demand, Outcome 8 Questionnaires to clients about attitudes.
Client‐based education and vaccination
Health risk appraisal
Four trials (intervention (n = 3100); control (n = 3200)) compared a health risk appraisal plus an offer of influenza vaccination to no intervention (Garcia‐Aymerich 2007; Ives 1994; Morrissey 1995; Stuck 2015). There was significant heterogeneity (Chi² = 77.76; P < 0.001; I² = 96%), hence data could not be pooled for analysis (Analysis 1.9). The 95% CI was above unity in all four trials, implying all four trials increased vaccination rates: Díaz Grávalos 1999 (OR 7.03, 95% CI 3.01 to 16.39); Ives 1994 (OR 2.17, 95% CI 1.70 to 2.77); Morrissey 1995 (OR 8.09, 95% CI 5.41 to 12.09); and Stuck 2015 (OR 1.33, 95% CI 1.12 to 1.58).
1.9. Analysis.
Comparison 1 Increasing community demand, Outcome 9 Client‐based education (health risk appraisal) compared to no intervention.
Client‐based education; vaccination provided by nurses
Two RCTs (intervention (n = 293); control (n = 321)) compared nurses or pharmacists educating participants about influenza vaccination and nurses vaccinating participants with no intervention (Herman 1994; Marrero 2006). The OR was 3.29 (95% CI 1.91 to 5.66; P < 0.001). Heterogeneity was low (Chi² = 1.12, P = 0.27; I² = 18%; Analysis 1.10). Herman 1994 (intervention (n = 243); control (n = 242)) also compared nurses educating and vaccinating participants to only educating participants and found the vaccination uptake in the intervention group increased 23.8% and declined in the education‐only group by 2.1% (P = 0.001). The OR was 152.95 (95% CI 9.39 to 2490.67; P = 0.001; Analysis 1.11).
1.10. Analysis.
Comparison 1 Increasing community demand, Outcome 10 Client‐based education (nurses or pharmacists educated and nurses vaccinated patients) compared to no intervention.
1.11. Analysis.
Comparison 1 Increasing community demand, Outcome 11 Client‐based education (nurses educated and vaccinated patients) compared to nurses educated patients.
Face‐to‐face three‐minute presentation
Leung 2017 (intervention (n = 265); control (n = 264)) investigated three‐minute face‐to‐face presentations by medical students with a two further minutes for questions; the OR was 1.62 (95% CI 1.11 to 2.35; P = 0.01; Analysis 1.12).
1.12. Analysis.
Comparison 1 Increasing community demand, Outcome 12 Face‐to‐face 3‐minute conversation compared to no intervention.
2. Interventions to enhance vaccination access
To increase community vaccination access, eight trials with 10 arms tested six strategies with 9353 participants. One arm assessed the effect of visits by groups of participants to primary health care. Five assessed home visits, and four free vaccines. We could meta‐analyse the following interventions: home visits and free vaccine compared to patient payment for vaccine. We were unable to meta‐analyse some interventions due to significant heterogeneity: home visits by nurses plus a physician care plan (CI above unity) and free vaccines compared to no intervention. One study of group visits was effective, and one of a home visit compared to a safety intervention was not.
Group visits to physicians and nurses
Beck 1997 (intervention (n = 160); control (n = 161)) compared visits by groups of participants to a physician and nurse to usual care by a physician. The OR was 27.19 (95% CI 1.60 to 463.25; P = 0.02). The uptake in the intervention group increased from 74% in the previous year to 81%, and declined from 72% to 64% in the control group. This decline could not be entered in the dichotomous data entry table, and the result would be stronger if the decline could be recorded (Analysis 2.1).
2.1. Analysis.
Comparison 2 Enhancing vaccination access, Outcome 1 Group visits of patients to physician and nurse compared to usual care.
Home visits
Arthur 2002 compared a home visit with an offer of influenza vaccination to a letter inviting participants to attend a vaccination clinic. The OR was 1.28 (95% CI 1.03 to 1.58). Nuttall 2003 compared a home visit with an offer of influenza vaccination to usual care. Their combined total was intervention (n = 710 participants); control (n = 1402). The pooled OR was 1.30 (95% CI 1.05 to 1.61; P = 0.01), with low heterogeneity (Chi² = 0.86, P = 0.35; I² = 0%; Analysis 2.2).
2.2. Analysis.
Comparison 2 Enhancing vaccination access, Outcome 2 Home visit compared to invitation to attend influenza vaccination clinic.
Black 1993 (intervention (n = 198); control (n = 152)) compared home visits that included an encouragement to receive influenza vaccination to home visits with a safety intervention. The OR was 0.98 (95% CI 0.64 to 1.50; P = 0.92; Analysis 2.3). Black 1993 noted: "Another 45 clients had been assigned to the influenza group but did not receive the promotion because the public health nurse found that they had already been administered influenza vaccine. These 45 participants and those who were missed (n = 9) were included in the analysis in their originally allocated group (an "intention to treat" analysis); thus a total sample of 359 was analysed." (p. 1752). However, Black 1993 did not report the distribution of these 45 between the intervention and the control groups, and an uneven distribution could positively or negatively affect the apparent effect of the intervention.
2.3. Analysis.
Comparison 2 Enhancing vaccination access, Outcome 3 Home visit with encouragement to receive influenza vaccination, compared to home visit with safety intervention.
Two trials assessed the effects of a home visit by a nurse with encouragement to receive influenza vaccination (combined intervention (n = 647); control (n = 1422)) (Dalby 2000; Dapp 2011). There was marked heterogeneity (Chi² = 10.99, P = 0.001; I² = 91%), and data could not be pooled (Analysis 2.4). The Dapp 2011 study was much larger (574 intervention, 1353 control group participants), with a complex intervention (health risk appraisal, individualised recommendations, health information, reinforcement by home visit or group sessions). The OR was 1.68 (95% CI 1.37 to 2.07; P < 0.001). Dalby 2000, a small study with 73 participants in the intervention and 69 in the control group, also employed a complex intervention (home visits with encouragement to receive influenza vaccination plus a care plan developed with a physician). The OR was 1.84 (95% CI 1.51 to 2.25; P < 0.001; Analysis 2.4). The group was unusual in being older (average age 78 years) and included women who had been widowed, hospitalised, or experienced a degree of functional loss in the previous six months. Although the study scored a low risk of bias for randomisation, there was a marked gender imbalance, with 71% female in the experimental group and 62% in the control group.
2.4. Analysis.
Comparison 2 Enhancing vaccination access, Outcome 4 Home visit by nurse or group sessions with encouragement to receive influenza vaccination, plus care plan developed with physician, compared to no intervention.
Free influenza vaccination
Two RCTs (combined intervention (n = 1125); control (n = 1125)) compared an offer of free influenza vaccination to an invitation to be vaccinated but the participant paid (Nexøe 1997; Satterthwaite 1997). The OR was 2.36 (95% CI 1.98 to 2.82; P < 0.001). Heterogeneity was low (Chi² = 0.42, P = 0.52; I² = 0%; Analysis 2.5).
2.5. Analysis.
Comparison 2 Enhancing vaccination access, Outcome 5 Free influenza vaccine compared to invitation to be vaccinated but patient pays.
The same two RCTs compared an offer of free vaccination to no intervention. However, we were unable to pool the trials due to high heterogeneity (Chi² = 6.72, P = 0.010; I² = 85%). Individually, Nexøe 1997 found an OR of 7.80 (95% CI 4.97 to 12.24; P < 0.001) and Satterthwaite 1997 an OR of 4.03 (95% CI 3.25 to 4.99; P < 0.001; Analysis 2.6).
2.6. Analysis.
Comparison 2 Enhancing vaccination access, Outcome 6 Free influenza vaccine compared to no intervention.
3. Provider‐ or system‐based interventions
To increase provider‐ or system‐based provision, 15 trials with 17 arms tested 11 intervention strategies incorporating a total of 278,524 participants. Eleven arms assessed reminders to physicians; three assessed education and feedback to physicians; two payment to physicians; and one vaccinating clinic staff. One successful intervention we could meta‐analyse was payment to physicians. Successful interventions tested by individual studies were: reminding physicians to vaccinate all patients compared to reminding approximately half of the patients; posters in clinics presenting vaccination rates and encouraging competition between doctors; and chart review and benchmarking to the rates achieved by the top 10% of physicians. We were unable to meta‐analyse reminders to physicians and facilitator encouragement of vaccination. Interventions that were not effective were: letters to GPs upon discharge from hospital; posters plus postcards versus posters alone; educational reminders; academic detailing and peer comparisons compared to mailed educational materials; educational outreach plus feedback to teams versus written feedback; and increasing staff vaccination rates.
Reminders to physicians
Four trials (intervention (n = 71,845); control (n = 130,419)) compared a reminder to physicians to no intervention (Chambers 1991; Chan 2002; Frank 2004; Kumar 1999). There was marked heterogeneity (Chi² = 30.66; P < 0.001; I² = 90%), and the trials could not be pooled (Analysis 3.1). Kumar 1999 (OR 1.18, 95% CI 1.13 to 1.23) and both arms of Chamber's trial had their 95% CI above unity. In Chamber's main trial the OR was 2.30 (95% CI 1.49 to 3.54), and in another arm which compared 198 participants in the intervention group (reminder to physicians about all their patients) and 118 in the control group (reminder to physicians about half of their patients) the OR was 2.47 (95% CI 1.53 to 3.99; P = 0.001) (Chambers 1991), (Analysis 3.2). Two trials had a 95% CI which included unity: Frank 2004 (OR 1.22; 95%CI 0.87, 1.70) and Chan 2002 (OR 1.07, 95% CI 0.98 to 1.17). We assessed three trials as at low risk of bias and one as at unclear risk of bias for both randomisation and attrition, thus a sensitivity analysis was not feasible.
3.1. Analysis.
Comparison 3 Provider‐ or system‐based intervention, Outcome 1 Reminder (to physician) compared to no reminder.
3.2. Analysis.
Comparison 3 Provider‐ or system‐based intervention, Outcome 2 Reminder to physician about all patients compared to reminder about half patients.
MacIntyre 2003, a very small study (intervention (n = 17); control (n = 27)), compared a reminder to hospital staff to vaccinate the participants to a reminder letter to the participants' GP on the day of discharge. The OR was 1.70 (95% CI 0.51 to 5.70; P = 0.39; Analysis 3.3).
3.3. Analysis.
Comparison 3 Provider‐ or system‐based intervention, Outcome 3 Reminder (to hospital staff to vaccinate patient) compared to letter to GP on day of discharge.
Posters in clinics as a reminder to physicians, participants, and staff
Buffington 1991 (intervention (n = 3604); control (n = 4772)) compared displaying posters in clinics with the influenza vaccination uptake by individual physicians (to encourage physicians to compete) plus postcards to participants, to no intervention. The OR was 2.03 (95% CI 1.86 to 2.22; P < 0.001; Analysis 3.4). The same RCT (intervention (n = 3604); control (n = 2149)) compared posters in clinics displaying vaccination uptake and also sending postcards to participants, to posters in clinics displaying vaccination uptake. The OR was 1.06 (95% CI 0.95 to 1.19; P = 0.32; Analysis 3.5).
3.4. Analysis.
Comparison 3 Provider‐ or system‐based intervention, Outcome 4 Posters in clinic displaying influenza vaccination rates to encourage doctors to compete, plus postcards to patients, compared to no intervention.
3.5. Analysis.
Comparison 3 Provider‐ or system‐based intervention, Outcome 5 Posters in clinic displaying influenza vaccination rates to encourage doctors to compete, plus postcards to patients, compared to posters displaying vaccination rates.
Facilitator encouragement of prevention manoeuvres
Three RCTs (combined intervention (n = 1013); control (n = 1170)) compared facilitator encouragement to perform prevention manoeuvres, including influenza vaccination, to no intervention (Hogg 2008; Karuza 1995; Kerse 1999). Heterogeneity was high (Chi² = 34.74, P < 0.001; I² = 94%), and the studies could not be pooled (Analysis 3.6). However, Hogg 2008 found an OR of 2.11 (95% CI 1.27 to 3.49; P = 0.001), and Karuza 1995 an OR of 292.81 (95% CI 18.16 to 4721.62; P ≤ 0.001) (the high upper 95% CI was due to the fact that there was no change in the vaccination rate in the control group). Hogg 2008 did not obtain baseline influenza vaccination data from the previous year. Lemelin 2001 did not present numbers of participants aged 65 or older and so could not be included in the meta‐analysis, but the increase in vaccination uptake in the intervention group was 18.7% and 4.0% in the control (P = 0.01).
3.6. Analysis.
Comparison 3 Provider‐ or system‐based intervention, Outcome 6 Facilitator encouragement of prevention manoeuvres including influenza vaccination compared to no intervention.
Physician education and feedback
Kim 1999 (intervention (n = 706); control (n = 694)) compared educational reminders, academic detailing, and peer comparisons to other physicians, to mailed educational materials. The OR was 1.13 (95% CI 0.80 to 1.58; P = 0.50; Analysis 3.7).
3.7. Analysis.
Comparison 3 Provider‐ or system‐based intervention, Outcome 7 Educational reminders, academic detailing, and peer comparisons to physicians compared to mailed educational materials.
Kiefe 2001 (intervention (n = 678); control (n = 682)) compared chart review and feedback to physicians plus benchmarking to the vaccination uptake achieved by the top 10% of physicians, to chart review and feedback. The OR was 3.43 (95% CI 2.37 to 4.97; P < 0.001; Analysis 3.8).
3.8. Analysis.
Comparison 3 Provider‐ or system‐based intervention, Outcome 8 Chart review and feedback to physician plus benchmarking to vaccination rates achieved by top 10% of physicians, compared to chart review and feedback.
Siriwardena 2002 (intervention (n = 13,633); control (n = 13,947)) found that educational outreach and feedback to practice teams was less effective than written feedback to practice teams. The OR was 0.77 (95% CI 0.72 to 0.81; P < 0.001; Analysis 3.9).
3.9. Analysis.
Comparison 3 Provider‐ or system‐based intervention, Outcome 9 Educational outreach + feedback to practice teams versus written feedback to practice teams.
Payment to physicians for influenza vaccinations
Ives 1994 and Kouides 1998 (combined intervention (n = 1559); control (n = 1256)) compared capitated payments to payment per vaccination. The OR was 2.22 (95% CI 1.77 to 2.77; P < 0.001), with minimal heterogeneity (Chi² = 0.23, P = 0.63; I² = 0%; Analysis 3.10).
3.10. Analysis.
Comparison 3 Provider‐ or system‐based intervention, Outcome 10 Payment to physicians versus no payment.
Interventions to increase staff influenza uptake
Abramson 2011 encouraged primary care physicians to receive influenza vaccination, hoping that would encourage them to vaccinate their patients. The physicians in the intervention group cared for 11,325 patients, and those in the control group 15,097 patients. For vaccination of patients the OR was 1.04 (95% CI 0.97 to 1.12; P = 0.24; Analysis 3.11).
3.11. Analysis.
Comparison 3 Provider‐ or system‐based intervention, Outcome 11 Intervention to increase staff influenza vaccination rate versus no intervention.
4. Societal interventions
We included no RCTs conducted at the societal level.
Joseph 2005 assessed the effects of the change in influenza vaccination policy in the UK from a purely risk‐based policy to one that stated that age itself is a risk, because of the increasing risks from influenza with age, and also because age is associated with risk factors that may be unknown to older people. In 1998 it was recommended that those aged 75 years or older should be offered influenza vaccination, and in 2000 it was recommended for those aged 65 or over. For those aged 65 to 74 years, uptake rose from 34.6% (1989 to 1990) to 55.8% (1999 to 2000), 65.8% (2000 to 2001), and 72.1% (2003 to 2004), showing a higher uptake after the introduction of the 2000 policy to vaccinate those aged 65 years or over.
A study of 795 general practices in England found that, for patients 65 and older, vaccination rates increased 7% if a personal invitation was sent; a lead staff member led the campaign and produced a practice report; and the campaign continued until the UK Quality and Outcomes Framework targets were met. If a lead staff member searched the practice information technology framework for candidates for vaccination, there was a 4% increase in vaccination rates (Dexter 2012).
McGovern 2008 performed a serial cross‐sectional study of the recording of coronary heart disease‐related health indicators and medications in 301 general practices in Scotland. Before the contract on 31 March 2004, 3.7% of participants over the age of 16 years had a computer record of coronary heart disease; post contract on 31 March 2005 this was 4.9%. Of these, 57.4% had received influenza vaccination before and 85.5% after the contract, although the data do not differentiate those aged up to 60 years and those aged 60 years and older.
Siriwardena 2003b reported on the impact of a clinical governance aim of immunising 60% of participants aged 65 years and older against influenza in 2000 in the West Lincolnshire Primary Care Trust. All 39 practices in this geographic area signed a clinical governance contract to participate and agreed to a practice audit (compulsory audit for coronary heart disease and voluntary audit for influenza vaccination). Practices that completed agreements also received additional payments. The baseline audit was conducted in May 2000, and the audit was repeated in April 2001. Changes in vaccination uptake were calculated for the 24 practices that completed the audit cycle, and uptakes were compared using paired t‐tests. There was a mean improvement of 24% (95% CI 19.7 to 28.4; P < 0.001) in vaccination uptake in participants aged 65 years or over (mean at baseline 48.9%, at follow‐up 73.0%).
Jansen 2008 noted that in the Netherlands before the 1996 to 1997 respiratory season influenza vaccination was only recommended for individuals with high‐risk medical conditions, and then extended to all those aged 65 years or older. Uptake for those aged 65 years or older increased from 30% in 1991 to 45% in 1995 and 87% in 2002.
Remmen 2002 studied variations in influenza vaccination uptake in a group practice physically located in Belgium but near the Netherlands border, which included participants from both Belgium and the Netherlands. Participants shared the same language and socioeconomic characteristics but were provided with services related to their country of residence. Since the year 2000 in both countries vaccination has been recommended for people aged 65 years or older, as well as for others with health conditions that place them at high risk of influenza complications. In Belgium, approximately 75% of the cost of obtaining a vaccine from a pharmacy and having it administered by a physician is covered by insurance. In contrast, in the Netherlands, vaccination is obtained from physicians' offices, with no direct cost to the patient. Among those aged 65 years or older, 64.3% of Belgian compared to 77.5% of Dutch participants were immunised in 2000 to 2001.
Two reports evaluated the effect of including influenza vaccination as a USA Medicare B benefit from 1988 to 1992 for 2 million individuals aged 65 years or older at intervention sites statewide in 10 states and at selected sites in another 10 states. Shalala 1993 assessed the impact on influenza vaccination by telephone surveys. Rates in telephone surveys were higher than claims by physicians, implying some individuals did not have Medicare pay for their flu shot. Vaccination rates in the surveys rose from 34% in 1988 to 1989 to 50% in 1991 to 1992. Schmitz 1993a indicated that extensive publicity campaigns and mail out of an informative and persuasive letter had accompanied the implementation of this demonstration project. Over the period of the demonstration, vaccination uptake increased in both intervention and demonstration areas. For those aged 65 to 74 years, the difference in coverage between intervention and comparison groups increased from +3% for 1988 to 1989 to +8% for 1989 to 1990 and to +12% for 1990 to 1991. For those aged 75 to 84 years, the differences were +1%, +4%, and +12%, respectively. Among those aged 85 years or older, the respective differences were ‐5%, ‐5%, and +12%.
Frick 2004 assessed the effect of including influenza vaccination as a Medicare benefit by using data from the Women's Health and Aging Study for 12 zip (postal) codes in Baltimore and interviewed 71% of the 1409 eligible females. However, uptake increased in the two years before the introduction of Medicare, and uptake thereafter decreased for African‐American people, and dipped then slightly increased for Caucasian (understood to be white) females.
Jha 2003 assessed the effects of the US Department of Veterans Affairs' 1995 re‐engineering initiative, which implemented quality‐of‐care indicators and compared vaccination uptake of Veterans Affairs patients to that of patients in the Medicare fee‐for‐service system. Influenza vaccination uptake for those aged 65 years or older in the Veterans Affairs system increased from 28% in 1994 to 1995 before re‐engineering to 78% in 2000. Uptake was 71% in 1997 to 1999 (compared to 66% for Medicare) and 78% in 2000 (compared to 71% for Medicare 2000 to 2001). There was no assessment of the differences in population characteristics or medical resources of the two systems.
The 2001 Japanese immunisation law subsidised routine influenza vaccinations for those aged 65 years or older or those aged 60 years or older with specific health conditions (Ohkusa 2005). Copayments are determined by each local government every year, and excess costs beyond co payments are subsidised by central and local governments and paid directly to the medical institutions that provide vaccinations. Ohkusa 2005 compared the amount of the copayment provided by local government in 12 large cities to the influenza immunisation uptake. Vaccination uptake increased in 2002 to 2003 compared to the 2001 to 2002 season, and the magnitude of the association was negatively related to the amount of the copayment.
These interventions on the societal level were the most challenging to evaluate because of unknown biases due to secular trends of increasing influenza vaccination rates in most societies; multiple and often unknown co‐interventions in the form of, for example, newspaper and magazine articles and alerts; and initiatives by organisations on many levels from individual practices to regional campaigns. Overall, these societal interventions correlate with increases in influenza vaccination rates.
Discussion
Of the 61 included RCTs, 31 were published in 1999 or earlier, and 30 in 2000 or later. However, there were few studies in which the research work was undertaken during or after the avian influenza and H1N1 or H2N3 scares. These events changed the level of concern of both the public and the health professions, with many interventions at international, societal, and regional levels, and significant media coverage in the form of nightly news bulletins on the radio, TV, and in the press. There is thus the question of whether all of the current body of evidence is relevant during pandemic scares and whether it remains relevant during routine influenza seasons.
Researchers have tested a wide range of interventions relevant to increasing community demand for influenza vaccination, increasing access, and provider‐ and system‐based interventions. We assessed 37% of included studies as at low risk of bias for sequence generation; 20% as at low risk for allocation concealment bias; 45% as at low risk of blinding bias; 52% as at low risk for attrition bias; and no studies as at risk of selective reporting bias. The overall GRADE assessment of the evidence was high to moderate quality.
For the letter, postcard, and phone call interventions, there was marked heterogeneity; although most individual trials reported significant results, a meta‐analysis was not possible for many interventions. The wide variety of interventions that could not be logically pooled together reduced the power of this systematic review in drawing conclusions.
Summary of main results
We included 61 RCTs of interventions to increase vaccination rates in people aged 60 years and older. We categorised interventions into three types: reminders to and education of clients to be vaccinated; interventions to increase access to vaccination; and provider‐ or system‐based interventions. Some studies reported on multiple interventions and contributed to more than one type of intervention group. We did not identify any RCTs that evaluated societal‐level interventions.
The most frequent intervention was client reminders and education (41 trials with a total of 766,931 participants), followed by provider‐ or system‐based interventions (15 trials with 278,524 participants), and interventions to increase access to vaccination (8 trials with 9353 participants). Some studies contributed data to test more than one intervention. Of the 80 study arms, 54 had 95% CIs entirely above unity implying all these interventions increased vaccination rates, but heterogeneity limited meta‐analysis.
Reminders to and education of clients to be vaccinated
We included three studies of client reminder and recall by letter plus leaflet in a meta‐analysis (OR 1.11, 95% CI 1.07 to 1.15) and two studies of nurses educating and vaccinating patients (OR 3.29, 95% CI 1.91 to 5.66).
Study heterogeneity prevented us from meta‐analysing four groups of studies, but within each group there were studies with their 95% CI entirely above unity, implying the interventions were successful. Seventeen RCTs tested simple reminders, and 11 studies had 95% CIs entirely above unity implying all 11 interventions increased vaccination rates. Sixteen studies tested personalised reminders, and 12 had 95% CIs entirely above unity implying all 12 interventions increased vaccination rates. Two RCTs of customised letters compared to form letter could not be pooled, but both had their 95% CIs above unity implying both interventions increased vaccination rates. Four RCTs of health risk appraisals leading to a recommendation for vaccination could not be pooled, but all had their 95% CI above unity implying all 4 interventions increased vaccination rates.
Six individual studies of interventions were all effective at increasing vaccination rates: patient outreach by retired teachers (OR 3.33, 95% CI 1.79 to 6.22); invitation by clinic receptionists (OR 2.72, 95% CI 1.55 to 4.76); nurses educating and vaccinating patients (OR 152.95, 95% CI 9.39 to 2490.67); medical students counselling patients (OR 1.62, 95% CI 1.11 to 2.35); and different types of questionnaire for recall (OR 1.13, 95% CI 1.03 to 1.24). A study of a lottery for free groceries was not effective (Table 1).
Interventions to increase access to vaccination
We meta‐analysed results of two studies of home visits (OR 1.30, 95% CI 1.05 to 1.61) and two studies of free vaccine compared to a user pays model (OR 2.36, 95% CI 1.98 to 2.82).
We were unable to meta‐analyse two studies of home visits by nurses plus a physician care plan, but both had 95% CIs above unity implying both interventions increased vaccination rates, and two studies of free vaccine provision compared to no intervention, both of which had their 95% CI above unity implying both interventions increased vaccination rates.
One RCT of group visits (OR 27.2, 95% CI 1.60 to 463.3) was effective, and one of a home visit compared to a safety intervention was not effective (Table 2).
Provider‐ or system‐based interventions
We meta‐analysed results of two studies investigating payment to physicians (OR 2.22, 95% CI 1.77 to 2.77).
We were unable to meta‐analyse four studies of reminders to physicians, two of which had their 95% CIs above unity implying both interventions increased vaccination rates, and three studies of facilitator encouragement of vaccination, of which two had their 95% CI above unity implying both interventions increased vaccination rates.
A study investigating reminders to physicians to vaccinate all patients compared to reminding about half of patients (OR 1.70, 95% CI 1.53 to 3.99); a study of posters in clinics of vaccination rates encouraging doctors to compete (OR 2.03, 95% CI 1.86 to 2.22); and a study of chart review and benchmarking to rates achieved by the top 10% of physicians (OR 3.43, 95% CI 2.37 to 4.97) were effective. Studies comparing letters on discharge from hospital to letters to GPs; posters + postcard versus posters; educational reminders + academic detailing + peer comparisons compared to mailed educational materials; educational outreach + feedback to teams versus written feedback; and an intervention to increase staff vaccination rates were not effective (Table 3).
Sensitivity analyses for the studies of increasing community demand, enhancing vaccination access, and provider‐ or system‐based interventions
We assessed data for heterogeneity in each category and subcategory of interventions, and used the Chi² test to examine heterogeneity between studies and the I² statistic to assess variability in estimates of effect due to heterogeneity. We carried out sensitivity analyses by serially removing studies with the highest risk of bias, and then serially removed the smallest RCTs for each group of interventions that included more than five RCTs. These changes did not decrease heterogeneity to a level that permitted meta‐analysis (less than 70%).
No studies reported adverse effects.
Interventions on the societal level
We included no RCTs at the societal level. Identifying the roles of policy changes about vaccination, educational interventions, media discussions, and societal trends in affecting vaccination uptake is difficult. Interventions on the societal level are the most challenging to evaluate, due to unknown biases relating to secular trends of increasing influenza vaccination rates in most societies, multiple and often unknown co‐interventions in the forms of stimuli such as newspaper and magazine articles, and alerts and initiatives by organisations on many levels from individual practices to regional campaigns. Overall, these societal interventions are correlated with increases in influenza vaccination rates.
Overall completeness and applicability of evidence
We included 61 RCTs, of which 36 (60%) were from the USA, seven were from Canada, four each were from Australia and the UK, three were from Spain, and one each was from Denmark, Germany, Hong Kong, Israel, New Zealand, Puerto Rico, and Switzerland. The majority of studies therefore reflect medical and financial structures in the USA.
Interventions were tested comprehensively for effect in three parts of the healthcare system: participants, healthcare providers (physicians, nurses, and pharmacists), and local or state healthcare systems, but not in overall societal healthcare systems.
However, a key problem is measuring the completeness of the assessment of influenza vaccination because it was possible for participants to receive vaccination at walk‐in clinics and during campaigns instead of from their regular clinics. Some studies did not perform independent verification of the accuracy and completeness of clinic records or financial billing.
We excluded non‐randomised designs because we were unable to assess the completeness of known confounders.
Studies were funded by government health organisations and foundations or organisations that provided health care. In one study, free vaccine was provided by a manufacturer, and 15 studies did not report funding sources.
Quality of the evidence
Of the 61 included studies, 32 were published before 2000, which may affect both the rigour of study design and data analysis. Furthermore, few studies were published after the 2002‐2004 SARS epidemic.
For randomisation, 23 (38%) trials were at low risk of bias; 35 (57%) were at unclear risk of bias; and three (5%) were at high risk of bias. We assessed trials as at unclear risk of bias usually because the description was limited to statements such as "were randomised." For concealment of allocation, seven studies (11%) were at low risk and 54 (89%) at unclear risk of bias because no statement was present in the text. For blinding, 27 (44%) trials were at low risk of bias; 30 (49%) were at unclear risk of bias; and four (7%) were at high risk of bias. For incomplete outcome data, 31 (51%) trials were at low risk of bias; 23 (38%) were at unclear risk of bias; and seven (11%) were at high risk of bias. All 61 trials (100%) were at low risk of bias for selective reporting.
Influenza vaccination uptake was recorded using computers or ascertained from computerised records or review of clinic records in 57 RCTs; by two research assistants through phone calls or home visits in Black 1993; from records during the vaccination campaign in Díaz Grávalos 1999; from hospital records or phone calls and letters to GPs in MacIntyre 2003; and from the records of the pharmacy where the RCT was conducted in Marrero 2006. All 61 trials were thus free of selective reporting.
The overall GRADE assessment of the evidence was moderate quality.
Potential biases in the review process
All stages in the review process were accomplished independently, with data checking by the other review author. This Cochrane Review was unfunded, and we included articles only in languages the review authors could read (English, French, German, Italian, Portuguese, and Spanish) or for which the English language abstract provided sufficient information. This focus on specific languages and possible exclusion of studies in other languages may have biased the results of this review. Unfortunately, we were unable to obtain data for two studies originating from South Korea (Lee 2003; Song 2000). The findings from these studies may have altered the findings reported and conclusions reached through this review.
Agreements and disagreements with other studies or reviews
We adopted the three intervention categories applied by the Community Preventive Services Task Force in the USA published in the Guide to Community Preventive Services for this review (CDC 2018). These are: increasing community demand for vaccinations; enhancing access to vaccination services; and provider‐ or system‐based interventions.
The CDC 2018 review synthesised results across age groups (children, adults, and elders) and included studies of influenza vaccine among elders. The CDC 2018 review recommended combining one or more interventions to increase community demand with at least one provider‐ or system‐based intervention, and one or more interventions to enhance access. The strategies for increasing community demand that were recommended included the use of client reminder/recall and multi component interventions that included education and enhancing access through home visits and reductions in out‐of‐pocket costs. Recommended provider‐ or system‐based interventions included reminder/recall systems for providers, assessment and feedback of vaccination information to providers, and the use of standing orders. Our review by contrast focused exclusively on influenza uptake among older adults.
Two previous Cochrane Reviews also investigated interventions to change health professionals' behaviour and addressed interventions to increase adult influenza vaccination uptake (Ivers 2012; Jacobson 2005; Krishna 2002). While our review does include some studies identified in previous reviews (Buffington 1991; Kiefe 2001; Kim 1999; Lukasik 1987; McDowell 1986; Puech 1998; Siriwardena 2002), we excluded other studies where the intervention was not aimed at increasing influenza vaccination uptake; individuals aged 60 years or older were not the focus of the research; or outcomes for those aged 60 years or older could not be identified separately. The conclusions reached in this review were therefore based on a set of studies that are distinct from those included in prior reviews.
Similarly, while Lau 2012 undertook a comprehensive search of randomised and non‐randomised studies of interventions to increase influenza and pneumococcal vaccination rates, unlike our review this review excluded all non‐English language studies.
Authors' conclusions
Implications for practice.
Effectiveness of influenza vaccine in people aged 60 years and older
The key issue was to address the effectiveness of influenza vaccine for people aged 60 years and older. The first author of this review (RE Thomas) is also the first author of the Cochrane Review on influenza vaccination of healthcare workers who care for those 60 years and older in institutions (Thomas 2016), and an author on the Cochrane Review on influenza vaccination for those 60 years and older (Demicheli 2018). To avoid selective quotation, we have presented the authors' conclusions of both reviews as follows.
Influenza vaccination of healthcare workers in institutions caring for those 60 years and older
"The four cluster‐randomised controlled trials (RCTs) contributing outcome data to our review are at high risk of bias and pooled data have not shown convincing evidence of benefit on the outcomes of direct interest, namely laboratory‐proven influenza (low quality evidence), lower respiratory tract infections (moderate quality evidence), admissions to hospital (low quality evidence), and deaths from lower respiratory tract illness or from all causes (very low quality evidence). Where meta‐analysis was possible the 95% confidence interval (CI) in each case has not excluded little or no effect of vaccination programmes. We conclude that there is an absence of high quality evidence that vaccinating healthcare workers against influenza protects people aged 60 years or older in their care on influenza‐specific outcomes. There is little evidence to justify medical care and public health practitioners mandating influenza vaccination for healthcare workers who care for the elderly in long‐term care institutions (LTCIs)." (Thomas 2016).
Influenza vaccination of those 60 years and older
Implications for practice
"Healthy older adults receiving the influenza vaccine may be at lower risk of influenza (from 6% to 2.4%, low‐certainty evidence) and are probably at lower risk of influenza‐like illness (ILI) (from 6% to 3.5%, moderate‐certainty evidence) compared with those who do not receive a vaccination over the course of a single influenza season. Our uncertainty in the effect on influenza reflects a lack of information about how the diagnosis was confirmed in the studies and judgements of high or unclear risk of bias.
"The findings of our review indicate that implementing vaccination programmes for elderly people may lead to reductions in influenza and ILI, but randomised studies to date have provided insufficient data on complications. Very few deaths occurred in the trials, and no data on hospitalisation were reported. No cases of pneumonia occurred in one study that reported this outcome. The sparse nature of the data overall may reflect the low risk of developing complications in the healthy population of interest and low rates of ILI and influenza in the trials. Vaccination probably increases fever from 1.6% to 2.5% (moderate‐certainty evidence) and may increase nausea from 2.4% to 4.2%, but for both of these harms the confidence interval is wide. Similar effects were observed for headache, general malaise, and upper respiratory tract symptoms. Sore arm and swelling occurred more frequently with vaccination.
"Policymakers considering funding vaccine programmes and individuals contemplating vaccination should take into account the likely benefits in terms of the reductions in the risk of influenza and ILI (3.5% and 2.5%, respectively), uncertainty over complications, and possible increases in harms." (Demicheli 2018).
Implications for research
"Investment in the development of better vaccines than are currently available should be linked to better knowledge of the causes and patterns of ILI in different communities. The additional effects of vaccinating carers in reducing transmission in nursing homes should be assessed. The effect of vaccination of high‐risk groups should also be further assessed.
Until such time as the role of vaccines for preventing complications of influenza in the elderly is clarified, more comprehensive and effective strategies for the control of acute respiratory infections should be investigated. These should include several preventive interventions that take into account the multi‐agent nature of ILI and its context (such as personal hygiene and adequate food, water, and sanitation).
When a new vaccination or preventive technology becomes available, an adequately powered, publicly funded, high‐quality placebo‐controlled trial run over several seasons should be undertaken. New insights on the role of viruses and other agents in the genesis of influenza and ILI are also needed." (Demicheli 2018).
Interventions to increase influenza vaccination rates in people aged 60 years and older in the community
This Cochrane Review also advocates for a publicly funded randomised controlled trial (RCT) of more effective vaccines. Our conclusions on how to increase vaccine uptake when these become available are as follows.
The 61 included RCTs investigated a wide variety of interventions that varied in approach, intensity, and cost. Although there is evidence that low‐ (e.g. postcards), medium‐ (e.g. personalised phone calls), and high‐intensity (e.g. home visits or facilitators in practices) interventions are effective in increasing community demand for vaccination, the extent, cost, and resource implications associated with the interventions vary. For instance, while facilitation and home visits were found to be effective, these approaches are likely to be more costly than other interventions. In contrast, although reminders are the least intensive intervention, they may vary in the extent to which they can effect changes in vaccination uptake. Although we found a variety of interventions to be highly effective at increasing vaccination uptake, individual healthcare practitioners will wish to assess the local resource implications of each strategy and select those that best meet their capacity and needs.
The population served and the healthcare system will affect the barriers to vaccination, motivations to implement vaccination, the resources made available, and the effectiveness of interventions. It is thus difficult to compare studies carried out in different countries or areas. Differences due to the healthcare system will occur by socioeconomic area (e.g. suburban populations where many people regularly see their own general practitioner), by distance from any healthcare facility (e.g. rural areas), or by transient work situations (e.g. agricultural or mining communities).
Implications for research.
Although this Cochrane Review includes a number of RCTs assessing the effectiveness of interventions to increase vaccination uptake among seniors, further research exploring the effectiveness of these approaches is needed. Although patient‐, provider‐, and system‐based interventions may effect changes in vaccination uptake, additional research is needed to determine how best to target these interventions to specific populations, such as people with complex, chronic health conditions, and encourage all stakeholders to actively engage in these initiatives. For example, while generic reminders to health staff may result in increases in numbers of patients who are vaccinated, reminders that include comprehensive lists of specific patients requiring vaccination may be more effective at targeting those who are least likely to request vaccination. Furthermore, people of all ages communicate via text messaging and social media. Research is also needed to investigate the effectiveness of these non‐traditional modes of communication on vaccination uptake among seniors.
We found no evidence of the effectiveness of societal‐level RCT interventions to increase vaccination. This represents a significant gap in the literature. Future studies that focus on community‐ and national‐level strategies to encourage vaccination of unvaccinated individuals with no ongoing source of primary care are needed to inform the development and implementation of approaches to vaccination that target entire populations.
Feedback
Interventions to increase influenza vaccination rates of those 60 years and older in the community, 27 October 2010
Summary
In the systematic review by Thomas et al. (Thomas 2010) titled Interventions to increase influenza vaccination rates of those 60 years and older in the community, the authors, in our opinion, fail to emphasize 2 key issues. While we do not dispute the findings that the methods proposed may increase compliance in influenza vaccine use, we question the relevance of reporting these results.
(1) The authors acknowledge the findings of a recently published systematic review Vaccines for preventing influenza in the elderly (Jefferson 2010), which concludes that ?available evidence is of poor quality and provides no guidance regarding the safety, efficacy or effectiveness of influenza vaccines for people aged 65 years or older.? Despite the recognition that current evidence is limited and is of poor quality, the authors proceed to defer to clinical practice guidelines in place since 1964 rather than stressing the importance that a large‐scale, publicly‐funded placebo‐controlled RCT is required to assess the value of vaccinating the community‐dwelling elderly population.
(2) In their review, Jefferson et al. found no difference in rates of adverse events between people who received vaccination and those who did not. However, adverse events occurring within one week of vaccine administration were assessed. Jefferson et al. also mention rare adverse events from vaccination but do not provide any detail, presumably because this data is from observational studies, as opposed to an RCT. Although the current literature on risk of serious adverse events is conflicting, this should not preclude patients and clinicians from being made aware of potential adverse effects of influenza vaccination. In addition, the prevalence of adverse events may substantially increase when a larger population is exposed to the vaccine.
(3) In our opinion, the conclusion of the review by Thomas et al. should include a definitive statement regarding the need for more robust evidence from properly designed studies on influenza vaccination, as well as an appeal to readers to consider the major gaps in the evidence. We think the conclusion should say that there is insufficient evidence that the vaccine improves clinical outcomes in the elderly. In addition, one cannot rule out the possibility that the vaccine increases the risk of serious harm. That being said, there is evidence that certain methods increase vaccination rates (e.g. postcards to patients) however this finding is of limited clinical importance based on the aforementioned concerns.
We look forward to hearing your comments.
Reference: Jefferson T, Di Pietrantonj C, Al‐Ansary LA, Ferroni E, Thorning S, Thomas RE. Vaccines for preventing influenza in the elderly. Cochrane Database of Systematic Reviews 2010, Issue 2. Art. No.: CD004876. DOI: 10.1002/14651858.CD004876.pub3.
Submitter agrees with default conflict of interest statement: I certify that I have no affiliations with or involvement in any organization or entity with a financial interest in the subject matter of my feedback.
Reply
Updated reply (24 April 2018). The Background and the Author's conclusions sections now quote in detail the conclusions of the Cochrane Reviews on influenza vaccine for people aged 60 years and older (Demicheli 2018) and influenza vaccine for health care workers who look after people aged 60 years and older in institutions (Thomas 2016), and the authors' conclusions now also state the need for a publicly funded RCT as advocated in the Cochrane Review of which I am also an author (Demicheli 2018). Thanks, Roger Thomas.
The reply is keyed to the numbers in the feedback above.
(1) The opening sentence of the present review is: “A review (Demicheli 2018) of the effectiveness of influenza vaccine in seniors includes 75 studies and 100 data sets. One RCT showed benefits against influenza symptoms but was underpowered to detect effects on complications (1348 participants). Other data sets were not randomised and were which were likely to contain biases. The review was unable to reach conclusions about the effects of the vaccines in persons 65 or older.”
The ACIP statement for 2010 (www.cdc.gov downloaded on 27 May 2011) may not have been formulated when the results of the Jefferson (2010) Cochrane review were available and stated that the recommendations for influenza vaccination for 2010 are:
All persons aged 6 months and older should be vaccinated annually.
Protection of persons at higher risk for influenza‐related complications should continue to be a focus of vaccination efforts as providers and programs transition to routine vaccination of all persons aged 6 months and older.
-
When vaccine supply is limited, vaccination efforts should focus on delivering vaccination to persons who:
are aged 6 months‐‐4 years (59 months);
are aged 50 years and older;
have chronic pulmonary (including asthma), cardiovascular (except hypertension), renal, hepatic, neurologic, hematologic, or metabolic disorders (including diabetes mellitus);
are immunosuppressed (including immunosuppression caused by medications or by human immunodeficiency virus);
are or will be pregnant during the influenza season;
are aged 6 months‐‐18 years and receiving long‐term aspirin therapy and who therefore might be at risk for experiencing Reye syndrome after influenza virus infection;
are residents of nursing homes and other chronic‐care facilities;
are American Indians/Alaska Natives;
are morbidly obese (body‐mass index is 40 or greater);
are health‐care personnel;
are household contacts and caregivers of children aged younger than 5 years and adults aged 50 years and older, with particular emphasis on vaccinating contacts of children aged younger than 6 months; and
are household contacts and caregivers of persons with medical conditions that put them at higher risk for severe complications from influenza.
The present review and the Jefferson (2010) review were conducted in the same time frame and their conclusions became available at about the same time and neither group of reviewers could have anticipated the utility or conclusions of their review compared to the other review or the ACIP recommendations (which their systematic reviews were planned to test).
(2) The commentators are correct that minimal data about potential harms is available. The Jefferson (2010) review concluded:
"Seven studies included in our safety assessment are described below: Four RCTs (Govaert 1993; Keitel 1996; Margolis 1990a; Treanor 1994). Three surveillance studies with a non‐comparative design assessing rare events (Guillan Barré Syndrome (GBS)) (Kaplan 1982; Lasky 1998; Schonberger 1979) were commented on in the text but were not included in our meta‐analysis. One RCT assessed a vaccine which has not been in production for decades (Stuart 1969). Its harms data were not extracted."
One of the purposes of the larger publicly funded RCT advocated in the conclusions of both reviews would be to assess potential harms.
(3) The conclusions of the present review made precisely the recommendation that the commentators make above and recommended using the findings of the present study (how to increase uptake of vaccine) to improve execution of the larger publicly funded study of vaccine effectiveness both reviews recommend:
“The review by Demicheli 2018, which was updated at the same time as this review was being completed, found evidence only from one RCT to support influenza vaccination in persons 65 and over and the remainder of the 100 data sets were non‐RCTs subject to unknown biases. In the present review, out of 44 RCTs only five RCTs were found to be at low risk and six at moderate risk of bias. They included three of 13 personalized postcard interventions (all three with the 95% CI above unity), two of the four home visit interventions (both with 95% CI above unity but one a small study), three of the four reminder to physicians interventions (none with 95% CI above unity) and three of the four facilitator interventions (one with 95% CI above unity and one P < 0.01). The other 33 RCTs were at high risk of bias and no recommendations for practice can be drawn. Demicheli 2018 recommends that an adequately powered publicly‐funded (to avoid influences from drug companies) placebo‐controlled RCT needs to be conducted over several influenza seasons. Evidence from such an RCT is thus required to prove that the interventions which we identified as effective should be implemented. These two reviews have identified that we have not yet established the secure evidence base required to prove that vaccination of those 65 and over is effective. The RCT recommended by Demicheli 2018 to measure the effectiveness of influenza vaccine in older persons should maximize uptake of vaccine by implementing the strategies we found effective in increasing influenza vaccination rates."
Contributors
Michelle Co, BScPharm Hayley Coe, BScPharm Sarah West, BSc, BScPharm Aaron Tejani, BScPharm, PharmD
What's new
| Date | Event | Description |
|---|---|---|
| 19 July 2018 | Amended | Text in the Abstract and Effects of interventions sections has been edited to improve clarity. |
History
Protocol first published: Issue 2, 2005 Review first published: Issue 9, 2010
| Date | Event | Description |
|---|---|---|
| 7 December 2017 | New search has been performed | In this update we included three new studies (Conner 2017; Leung 2017; Stuck 2015). We excluded two randomised controlled trials published in Korean that we identified in the previous update; we sought, but did not receive, additional information from the authors (Lee 2003; Song 2000). We have requested additional data for Hurley 2017 (Studies awaiting classification). |
| 7 December 2017 | New citation required but conclusions have not changed | The addition of the three new studies did not change our conclusions. |
| 4 June 2014 | New search has been performed | Searches updated. We included 13 new trials (Abramson 2011; Dapp 2011; Garcia‐Aymerich 2007; Humiston 2011; Kumar 1999; Maglione 2002a; Maglione 2002b; Maglione 2002c; Maglione 2002d; Minor 2010; Moran 1996; Morrissey 1995; Roca 2012), and identified two potentially relevant trials that are awaiting translation (Lee 2003a; Song 2000a). |
| 4 June 2014 | New citation required and conclusions have changed | In this update we concluded that letters and postcards, tailored letters/postcards or phone calls, educating patients, home visits, offering free vaccination, some reminders to physicians, paying physicians for improved vaccination rates, and using facilitators in clinics were all effective in increasing influenza vaccination rates. However, using educational reminders and feedback to physicians were not effective. |
| 3 May 2011 | Feedback has been incorporated | Feedback comment added to review. |
| 30 January 2008 | Amended | Converted to new review format |
| 23 November 2007 | New citation required and major changes | Substantive amendment |
Acknowledgements
We thank Janine Morrison, Emily Medd, and Wendy Spragins for retrieving full‐text articles for the first edition of this review. We thank Vicky Debold, Amy Zelmer, Ann Mayo, Tony Arthur, Mark Jones, and Matthew Thompson for comments on the draft review. We thank Dr Margaret Russell for her excellent and invaluable organisational and critical work on the first edition of this review. We thank Tony Arthur, Janet Wale, Conor Teljeur, and Matthew Thompson for comments on the 2014 update. Thanks to David Honeyman for the 2017 literature search.
For previous versions of this review, Roger E Thomas planned the review design, assessed articles for inclusion, entered data, performed the analyses, and wrote the text. Diane Lorenzetti designed and executed the search strategy, assessed articles for inclusion, entered data, and approved the text. Margaret Russell assessed articles for inclusion, entered data, and approved the text.
Appendices
Appendix 1. MEDLINE (Ovid) search strategy
1 Influenza, Human/ 2 exp Influenza A virus/ 3 exp Influenzavirus B/ 4 Influenzavirus C/ 5 (influenza or flu or h1n1).tw. 6 or/1‐5 7 exp Immunization/ 8 exp Vaccines/ 9 (immuni* or vaccin*).tw. 10 or/7‐9 11 6 and 10 12 Influenza Vaccines/ 13 11 or 12 14 exp aged/ or middle aged/ 15 ((old* or age*) adj3 (people* or person* or adult* or women* or men* or citizen* or residen*)).tw. 16 (pension* or retire* or elderly or senior* or geriatric*).tw. 17 long‐term care/ or nursing care/ or palliative care/ 18 homes for the aged/ or nursing homes/ 19 nursing home*.tw. 20 Hospitals/ 21 residential facilities/ or assisted living facilities/ 22 Health Services for the Aged/ 23 (institution* adj3 elderly*).tw. 24 (aged care or hospice* or old people* home*).tw. 25 ("50 years or older" or "55 years or older" or "60 years or older" or "65 years or older" or "70 years or older" or "75 years or older" or "80 years or older").tw. 26 ("older than 50" or "older than 55" or "older than 60" or "older than 65" or "older than 70" or "older than 75" or "older than 80").tw. 27 or/14‐26 28 13 and 27
Appendix 2. Embase (Elsevier) search strategy
#37 #35 AND #36 #36 #14 AND #29 #35 #33 NOT #34 #34 'animal'/exp NOT ('animal'/exp AND 'human'/exp) #33 #30 OR #31 OR #32 #32 allocat*:ti,ab OR assign*:ti,ab OR crossover*:ti,ab OR 'cross over*':ti,ab OR factorial:ti,ab OR placebo*:ti,ab OR random*:ti,ab OR trial*:ti,ab OR volunteer*:ti,ab #31 ((single OR double OR triple OR treble) NEAR/3 (blind* OR mask*)):ti,ab #30 'crossover procedure'/de OR 'double blind procedure'/de OR 'randomized controlled trial'/de OR 'single blind procedure'/de #29 #15 OR #16 OR #17 OR #18 OR #19 OR #20 OR #21 OR #22 OR #23 OR #24 OR #25 OR #26 OR #27 OR #28 #28 'older than 50':ti,ab OR 'older than 55':ti,ab OR 'older than 60':ti,ab OR 'older than 65':ti,ab OR 'older than 70':ti,ab OR 'older than 75':ti,ab OR 'older than 80':ti,ab #27 '50 years or older':ti,ab OR '55 years or older':ti,ab OR '60 years or older':ti,ab OR '65 years or older':ti,ab OR '70 years or older':ti,ab OR '75 years or older':ti,ab OR '80 years or older':ti,ab #26 'aged care':ti,ab OR hospice*:ti,ab OR 'old people* home*':ti,ab #25 (institution* NEAR/3 elderly*):ti,ab #24 'elderly care'/de #23 'residential home'/de OR 'assisted living facility'/de #22 'hospital'/de OR 'geriatric hospital'/de #21 'nursing home*':ti,ab #20 'home for the aged'/de OR 'nursing home'/de #19 'long term care'/de OR 'nursing care'/de OR 'palliative therapy'/de OR 'palliative nursing'/de #18 pension*:ti,ab OR retire*:ti,ab OR elderly:ti,ab OR senior*:ti,ab OR geriatric*:ti,ab #17 ((old* OR age*) NEAR/3 (people* OR person* OR adult* OR women* OR men* OR citizen* OR residen*)):ti,ab #16 'middle aged'/de #15 'aged'/exp #14 #12 OR #13 #13 'influenza vaccine'/de #12 #7 AND #11 #11 #8 OR #9 OR #10 #10 immuni*:ti,ab OR vaccin*:ti,ab #9 'vaccine'/exp #8 'immunization'/exp #7 #1 OR #2 OR #3 OR #4 OR #5 OR #6 #6 influenza:ti,ab OR flu:ti,ab OR h1n1:ti,ab #5 'seasonal influenza'/de #4 'influenza c virus'/de #3 'influenza b virus'/exp #2 'influenza a virus'/exp #1 'influenza'/de
Appendix 3. CINAHL (EBSCO) search strategy
(MH “influenza vaccine”)
AB (influenza or flu) or TI (influenza or flu)
AB (vaccin* or immuni*) or TI (vaccin* or immuni*)
2 and 3
1 or 4
(MH “aged”) or (MH “aged, 80 and over”)
AB (aged or elderly or senior*) or TI (aged or elderly or senior*)
6 or 7
5 and 8
Limit 9 to Publication Type: Clinical Trial, Systematic Review
((MH "Clinical Trials") or (MH "Meta Analysis") or (MH "Systematic Review") or (MH "Concurrent Prospective Studies") or (MH "Prospective Studies") or (MH "Placebos") or (MH "Evaluation Research")
TI ((single or double or triple or treble) and (blind* or mask*))
AB ((single or double or triple or treble) and (blind* or mask*))
TI ((systematic or synthesis) and (review* or overview*))
AB ((systematic or synthesis) and (review* or overview*))
TI (allocat* or assign* or control* or crossover* or cross over* or factorial or groups or metaanalys* or meta analys* or metanalys* or placebo* or rct* or random* or trial* or volunteer*)
AB (allocat* or assign* or control* or crossover* or cross over* or factorial or groups or metaanalys* or meta analys* or metanalys* or placebo* or rct* or random* or trial* or volunteer*)
11 or 12 or 13 or 14 or 15 or 16 or 17
9 and 18
10 or 19
Appendix 4. ERIC (ProQuest) search strategy
ALL(((influenza* OR flu OR h1n1) AND (immuni* OR vaccin*)) AND ((elderly OR senior* OR retire* OR pension* OR geriatric*) OR (old* NEAR/3 people* OR old* NEAR/3 person* OR old* NEAR/3 adult* OR old* NEAR/3 women* OR old* NEAR/3 men* OR old* NEAR/3 citizen* OR old* NEAR/3 residen*) OR (aged NEAR/3 people* OR aged NEAR/3 person* OR aged NEAR/3 adult* OR aged NEAR/3 women* OR aged NEAR/3 men* OR aged NEAR/3 citizen* OR aged NEAR/3 residen*) OR (nursing NEAR/2 home* OR home* NEAR/3 aged OR "aged care" OR retire* NEAR/2 home*) OR ("50 years or older" OR "55 years or older" OR "60 years or older" OR "65 years or older" OR "70 years or older" OR "75 years or older" OR "80 years or older") OR ("older than 50" OR "older than 55" OR "older than 60" OR "older than 65" OR "older than 70" OR "older than 75" OR "older than 80")))
Appendix 5. Previous search details
For the 2014 update we searched the Cochrane Central Register of Controlled Trials (CENTRAL) (2014, Issue 5), which contains the Cochrane Acute Respiratory Infections Group's Specialized Register, to 4 June 2014, MEDLINE (January 2010 to 4 June 2014), PubMed (January 2010 to 4 June 2014), Embase (Ovid) (January 2010 to 4 June 2014), CINAHL (January 2010 to 4 June 2014) and ERIC (Proquest) (January 2010 to 4 June 2014). We searched MEDLINE and CENTRAL using the search strategy described in Appendix 1. We combined the MEDLINE search with the Cochrane Highly Sensitive Search Strategy for identifying randomised trials in MEDLINE: sensitivity‐maximising version (2008 revision); Ovid format (Lefebvre 2011). We adapted the MEDLINE search strategy to search PubMed (search listed in this Appendix), Embase (Ovid) (search listed in this Appendix), CINAHL (Appendix 3) and ERIC (Proquest) (Appendix 4). We applied no language or publication restrictions.
For the 2010 search we searched the Cochrane Central Register of Controlled Trials (CENTRAL) (The Cochrane Library, 2010, issue 3), containing the Cochrane Acute Respiratory Infections Group's Specialized Register, MEDLINE (January 1950 to July 2010), PubMed (January 1950 to July 2010), EMBASE (1980 to 2010 Week 28), AgeLine (1978 to July 2010), ERIC (1965 to July 2010) and CINAHL (1982 to July 2010). PubMed was searched using the PubMed strategy listed in (Appendix 5). Embase (Ovid) was searched using the Embase strategy listed in this Appendix. CINAHL was searched using the strategy in Appendix 3. Search strategies for the other databases are presented below in this Appendix. No language or publication restrictions were applied.
MEDLINE (OVID 1950 to 1 July 2010)
influenza, human or exp influenzavirus a/ or exp influenzavirus b/ or influenzavirus c/
(influenza* or flu).tw.
1 or 2
vaccines/ or exp immunization/
(immuni* or vaccin*).tw.
4 or 5
3 and 6
influenza vaccines/
7 or 8
limit 9 to (“middle aged (45 plus years” or “all aged (65 and over)” or “aged (80 and over)”
exp middle aged/ or exp aged/ or homes for the aged/ or health services for the aged/
(elderly or senior*).tw.
11 or 12
9 and 13
10 or 14
(controlled clinical trial or meta analysis or randomized controlled trial).pt.
drug therapy.fs.
(groups or placebo* or random* or trial*).tw.
16 or 17 or 18
15 and 19
limit 20 to animals
limit 20 to (humans and animals)
21 not 22
20 not 23
PubMed
influenza, human[MeSH] or influenzavirus a[MeSH] or influenzavirus b[MeSH] or influenzavirus c[MeSH]
influenza[tiab] or flu[tiab]
1 or 2
Vaccines[MeSH:noexp] or immunization[MeSH]
(immuni*[tiab] or vaccin*[tiab]
4 or 5
3 and 6
influenza vaccines[MeSH]
7 or 8
limit 9 to (“middle aged (45 plus years” or “all aged (65 and over)” or “aged (80 and over)”
middle aged[MeSH] or aged[MeSH] or homes for the aged[MeSH] or health services for the aged[MeSH]
elderly[tiab] or senior*[tiab]
11 or 12
9 and 13
10 or 14
controlled clinical trial[pt] or randomized controlled trial[pt]
drug therapy[sh]
(groups[tiab] or placebo[tiab] or randomized[tiab] or randomly[tiab] or trial[tiab]
16 or 17 or 18
15 and 19
animals [mh] NOT humans [mh]
20 not 21
Embase (Ovid)
influenza/ or influenza A/ or exp influenza virus/
(influenza or flu).tw.
1 or 2
exp immunization/ or exp vaccine/
(immun* or vaccin*).tw.
4 or 5
3 and 6
influenza vaccine/ or influenza vaccination/
7 or 8
limit 9 to (adult <18 to 64 years> or aged (<65+ years>)
aged/ or exp elderly care/
(elderly or senior*).tw.
11 or 12
9 and 13
10 or 14
crossover procedure/ or double blind procedure/ o randomized controlled trial/ or single blind procedure/
((single or double or triple or treble) adj3 (blind* or mask*)).tw.
(allocat* or assign* or crossover* or cross over* or factorial or placebo* or random* or trial* or volunteer*).tw.
16 or 17 or 18
15 and 19
limit 20 to human
limit 20 to animal studies
22 not 21
20 not 23
Cochrane CENTRAL Register of Controlled Trials (CENTRAL) (Issue 3 2010)
influenza, human or exp influenzavirus a/ or exp influenzavirus b/ or influenzavirus c/
(influenza* or flu).tw.
1 or 2
vaccines/ or exp immunization/
(immuni* or vaccin*).tw.
4 or 5
3 and 6
influenza vaccines/
7 or 8
limit 9 to (“middle aged (45 plus years” or “all aged (65 and over)” or “aged (80 and over)”
exp middle aged/ or exp aged/ or homes for the aged/ or health services for the aged/
(elderly or senior*).tw.
11 or 12
9 and 13
10 or 14
(controlled clinical trial or meta analysis or randomized controlled trial).pt.
drug therapy.fs.
(groups or placebo* or random* or trial*).tw.
16 or 17 or 18
15 and 19
limit 20 to animals
limit 20 to (humans and animals)
21 not 22
20 not 23
AgeLine (OVID 1978 to 1 July 2010)
(influenza or flu).tw.
(immun* or vaccin*).tw.
1 and 2
((single or double or triple or treble) adj3 (blind* or mask*)).tw.
(control* or crossover* or cross over* or factorial or groups or placebo* or rct* or random* or trial* or volunteer*).tw.
4 or 5
3 and 6
ERIC (OVID 1965 to July 2010)
(influenza or flu).kw,tw.
(immun* or vaccin*).kw,tw.
1 and 2
(aged or elderly or senior*).kw,tw.
3 and 4
((single or double or triple or treble) adj3 (blind* or mask*)).kw,tw.
(control* or cross over* or crossover* or factorial or groups or placebo* or rct* or random* or trial* or volunteer*).kw,tw.
6 or 7
5 and 8
Appendix 6. WHO ICTRP search strategy
influenza* AND immuni* AND elderly OR flu AND immuni* AND elderly OR h1n1 AND immuni* AND elderly OR influenza* AND vaccin* AND elderly OR flu AND vaccin* AND elderly OR h1n1 AND vaccin* AND elderly OR influenza* AND immuni* AND senior* OR flu AND immuni* AND senior* OR h1n1 AND immuni* AND senior* OR influenza* AND vaccin* AND senior* OR flu AND vaccin* AND senior* OR h1n1 AND vaccin* AND senior* OR influenza* AND immuni* AND retire* OR flu AND immuni* AND retire* OR h1n1 AND immuni* AND retire* OR influenza* AND vaccin* AND retire* OR flu AND vaccin* AND retire* OR h1n1 AND vaccin* AND retire* OR influenza* AND immuni* AND pension* OR flu AND immuni* AND pension* OR h1n1 AND immuni* AND pension* OR influenza* AND vaccin* AND pension* OR flu AND vaccin* AND pension* OR h1n1 AND vaccin* AND pension* OR influenza* AND immuni* AND geriatric* OR flu AND immuni* AND geriatric* OR h1n1 AND immuni* AND geriatric* OR influenza* AND vaccin* AND geriatric* OR flu AND vaccin* AND geriatric* OR h1n1 AND vaccin* AND geriatric* OR influenza* AND immuni* AND old OR flu AND immuni* AND old OR h1n1 AND immuni* AND old OR influenza* AND vaccin* AND old OR flu AND vaccin* AND old OR h1n1 AND vaccin* AND old OR influenza* AND immuni* AND "older people" OR flu AND immuni* AND "older people" OR h1n1 AND immuni* AND "older people" OR influenza* AND vaccin* AND "older people" OR flu AND vaccin* AND "older people" OR h1n1 AND vaccin* AND "older people" OR influenza* AND immuni*
Appendix 7. ClinicalTrials.gov search strategy
(influenza OR flu OR h1n1) AND (immunization OR immunizing OR immunized OR immunizations OR immunisation OR immunising OR immunised OR immunisations OR vaccination OR vaccinating OR vaccinated OR vaccine OR vaccines) AND (elderly OR senior OR seniors OR retired OR retirees OR pensioner OR pensioners OR geriatric OR aged OR nursing OR old OR older)
Appendix 8. Randomised controlled trials without baseline influenza vaccination rates for the year before the intervention
Baker 1998; Berg 2004; Black 1993; Buffington 1991; Chambers 1991; Dalby 2000; Dapp 2011; Díaz Grávalos 1999; Garcia‐Aymerich 2007; Hogg 1998; Hogg 2008; Hull 2002; Humiston 2011; Kellerman 2000; Kerse 1999; Maglione 2002a; Maglione 2002b; Maglione 2002c; Maglione 2002d; Minor 2010; Moran 1992; Moran 1996; Morrissey 1995; Mullooly 1987; Nexøe 1997; Satterthwaite 1997; Smith 1999; Spaulding 1991. Incomplete prior year vaccination rates for Moran 1996.
Data and analyses
Comparison 1. Increasing community demand.
Comparison 2. Enhancing vaccination access.
| Outcome or subgroup title | No. of studies | No. of participants | Statistical method | Effect size |
|---|---|---|---|---|
| 1 Group visits of patients to physician and nurse compared to usual care | 1 | 321 | Odds Ratio (M‐H, Fixed, 95% CI) | 27.19 [1.60, 463.25] |
| 2 Home visit compared to invitation to attend influenza vaccination clinic | 2 | 2112 | Odds Ratio (M‐H, Random, 95% CI) | 1.30 [1.05, 1.61] |
| 3 Home visit with encouragement to receive influenza vaccination, compared to home visit with safety intervention | 1 | 350 | Odds Ratio (M‐H, Random, 95% CI) | 0.98 [0.64, 1.50] |
| 4 Home visit by nurse or group sessions with encouragement to receive influenza vaccination, plus care plan developed with physician, compared to no intervention | 2 | Odds Ratio (M‐H, Fixed, 95% CI) | Totals not selected | |
| 5 Free influenza vaccine compared to invitation to be vaccinated but patient pays | 2 | 2251 | Odds Ratio (M‐H, Random, 95% CI) | 2.36 [1.98, 2.82] |
| 6 Free influenza vaccine compared to no intervention | 2 | Odds Ratio (M‐H, Random, 95% CI) | Totals not selected |
Comparison 3. Provider‐ or system‐based intervention.
Characteristics of studies
Characteristics of included studies [ordered by study ID]
Abramson 2011.
| Methods | Purpose: to compare influenza vaccination uptake of those aged ≥ 65 years attending primary care clinics that received an intervention to increase staff influenza vaccination uptake, or control (no staff intervention). No influenza intervention for participants Design: cluster RCT (intervention provided to staff in 13 intervention clinics and not provided in 14 control clinics) Duration of study: HMO data extracted for 2007 to 2008 (intervention year) and previous year (2006 to 2007) Interval between intervention and when outcome was measured: 2007 to 2008 (intervention year) (no further details) Country: Israel Setting: 27 primary care community clinics Power computation: based on 2006‐2007 imputed ICC = 0.019, for the sample of participants in 2007 to 2008 ≥ 65, alpha = 0.05, power = 80% for increase in vaccination uptake from 50% to 58%, and power of 90% for increase in vaccination uptake to 60% for the healthcare workers, based on previous year staff vaccination uptake, predicted 156 healthcare workers required in each of intervention and control groups for power = 90% to detect relative increase in staff immunisation from 30% to 50%, with alpha = 0.05. Statistics: ORs and 95% CI corrected for clustering, logistic regression. |
|
| Participants |
Inclusion criteria Eligible participants: (health status); all healthcare workers in the 13 intervention clinics; all participants aged ≥ 65 years in 13 intervention and 14 control clinics Age: ≥ 65 years; staff were all 344 physicians, nurses, pharmacists, administrative, and ancillary staff with direct patient contact Gender: 58% female |
|
| Interventions | Intervention 1: intervention to increase staff influenza vaccination uptake in the Jerusalem area Control: no staff intervention Co‐interventions: none |
|
| Outcomes | Outcome measured: % aged ≥ 65 years influenza vaccination (intervention clinics 2006 to 2007 average influenza vaccination uptake 58.1% (43.4% 2006 to 2007); control 56.7% (44.7%). Data are from Table 1, text provides different percentages. Time points reported in the study: 2007 to 2008 was intervention year (time points not stated). |
|
| Notes | Funding: none stated | |
| Risk of bias | ||
| Bias | Authors' judgement | Support for judgement |
| Random sequence generation (selection bias) | Unclear risk | Clinics randomly selected for staff intervention (method not stated). |
| Allocation concealment (selection bias) | Unclear risk | No statement |
| Blinding (performance bias and detection bias) All outcomes | Unclear risk | No statement |
| Incomplete outcome data (attrition bias) All outcomes | Low risk | Baseline 11,755 in 13 intervention clinics; 420 (3.6%) excluded as died or left clinics or moved to sheltered accomodation before end of intervention period; 15,660 in 14 control clinics, 503 (3.2%) excluded |
| Selective reporting (reporting bias) | Low risk | No selective reporting |
Arthur 2002.
| Methods | Purpose: to compare the effect of offering home health checks to appointments in a vaccination clinic on increasing influenza vaccination uptake Design: randomised 1/3 participants to receive 30‐minute health check and offer of influenza vaccine at home, and 2/3 to receive personal letter to attend vaccination clinic in surgery Duration of study: October to 4 December 2000 Interval between intervention and when outcome was measured: letters mailed October 2000; health checks undertaken 2 October to 4 December 2000 Power computation: 99% power at alpha = 0.05 for uptake of 64% in health check group compared to 50% in personal letter group Statistics: Chi² to analyse difference in uptake between trial arms; ITT | |
| Participants | Country: UK Setting: 34 general practice physicians in Leicestershire Eligible participants: (health status) all 2052 participants aged >= 75 years living in community Age: ≥ 75 years Gender: 60% female | |
| Interventions | Intervention 1: health check at home Intervention 2: invitation to attend vaccination clinic | |
| Outcomes | Outcome measured: % influenza vaccination; how receipt of vaccine was recorded is not stated, but as this is a single practice; the sole purpose of this intervention was influenza vaccination; and vaccination clinics and home visits are by practice nurses, it can be expected to be complete Time points from the study considered in the review or measured or reported in the study: 2 October to 4 December 2000 % vaccinated by 31 December 2000 | |
| Notes | Funding: Melton, Rutland and Harborough Primary Care Group, Leicestershire Health | |
| Risk of bias | ||
| Bias | Authors' judgement | Support for judgement |
| Random sequence generation (selection bias) | Low risk | SAS data analysis program assigned codes. |
| Allocation concealment (selection bias) | Unclear risk | No statement |
| Blinding (performance bias and detection bias) All outcomes | Unclear risk | No statement |
| Incomplete outcome data (attrition bias) All outcomes | Low risk | Of 2408 participants, 356 in nursing home or sheltered accomodation; of 680 randomised to health check, 468 received health check and 680 followed up; of 1372 randomised to personal letter, 66 received flu vaccine at home and 1372 followed up. |
| Selective reporting (reporting bias) | Low risk | No selective reporting |
Baker 1998.
| Methods | Purpose: to compare generic postcard recommending immunisation, personalised postcard from physician, personalised letter from physician tailored to health risk, and no intervention Design: participants randomised to 3 interventions and 1 control group Duration of study: reminders posted 3rd week of September 1995; date of end of study not stated Interval between intervention and when outcome was measured: not stated Power computation: not performed Statistics: percentages, ORs and 95% CIs | |
| Participants | Country: USA Setting: Henry Ford multispecialty clinics, southeast Michigan Eligible participants: high risk adult patients were defined as having asthma, diabetes, end‐stage renal disease, sickle cell disease, ischaemic cardiomyopathy, or nephrotic syndrome); of these participants aged ≥ 65 years were included Age: ≥ 65 years Gender: 57.7% female | |
| Interventions | Intervention 1: generic postcard recommending immunisation Intervention 2: personalised postcard from physician Intervention 3: personalised letter from physician tailored to health risk Control: no intervention Co‐interventions: walk‐in influenza clinics October; printed materials based on Health Beliefs Model; toll‐free telephone line | |
| Outcomes | Outcome measured: % influenza vaccination Time points from the study considered in the review or measured or reported in the study: computer‐generated reminders sent last week of September 1995, date of end of study not stated % vaccinated by: not stated | |
| Notes | Funding: not stated | |
| Risk of bias | ||
| Bias | Authors' judgement | Support for judgement |
| Random sequence generation (selection bias) | Unclear risk | "randomised into one of four groups" (no method stated) |
| Allocation concealment (selection bias) | Unclear risk | No statement |
| Blinding (performance bias and detection bias) All outcomes | Low risk | No statement, but computerised billing data |
| Incomplete outcome data (attrition bias) All outcomes | Unclear risk | Cohort = 24,743, aged ≥ 65 years = 17,598; aged < 65 years with chronic condition = 10,573; aged ≥ 65 years with chronic condition = 3431, so there is overlap and those aged < 65 years and aged ≥ 65 years total 28,171, 3428 more than the cohort. We were unable to contact the authors after numerous e‐mail attempts including colleagues and organisations. |
| Selective reporting (reporting bias) | Low risk | No selective reporting |
Barnas 1989.
| Methods | Purpose: to compare pre‐appointment postcard with message encouraging influenza vaccination to pre‐appointment card with no message Design: RCT, participants randomised Duration of study: "fall of 1986" Interval between intervention and when outcome was measured: not stated Power computation: not performed Statistics: Chi², probabilities | |
| Participants | Country: USA Setting: primary care clinic, Milwaukee County Medical Complex Eligible participants: (health status): 988 participants aged ≥ 65 years were randomised, and of the 840 (85%) who kept their appointments and were seen at the clinic, 406 received the message and 434 did not. Age: ≥ 65 years Gender: not stated | |
| Interventions | Intervention 1: pre‐appointment postcard with message encouraging influenza vaccination Control: pre‐appointment card with no message | |
| Outcomes | Outcome measured: % vaccinated Time points from the study considered in the review or measured or reported in the study: "Fall of 1986" % vaccinated by: not stated | |
| Notes | Funding: not stated | |
| Risk of bias | ||
| Bias | Authors' judgement | Support for judgement |
| Random sequence generation (selection bias) | Unclear risk | "All 988 participants ... were randomised ..." (no method stated) |
| Allocation concealment (selection bias) | Unclear risk | No statement |
| Blinding (performance bias and detection bias) All outcomes | Low risk | No statement; computerised billing data |
| Incomplete outcome data (attrition bias) All outcomes | High risk | "988 participants ≥ 65 ... were randomised, ... of the 840 (85%) who kept their appointments and were seen at the clinic 406 received the message and 434 did not." Computerised billing data |
| Selective reporting (reporting bias) | Low risk | No selective reporting |
Beck 1997.
| Methods | Purpose: to compare group visits of chronically ill older participants to a physician to usual care Design: RCT; individual participants randomised Duration of study: 1 year Interval between intervention and when outcome was measured: not stated Power computation: not performed Statistics: Chi² for dichotomous data, ANOVA for continuous data; not ITT | |
| Participants | Country: USA Setting: 1 office of Colorado Permanente Medical Care Program, a group HMO in Denver Eligible participants: (health status) people 65 years or older with a chronic illness based on chart review (heart, lung, or joint disease or diabetes) or high health utilisation in past 12 months (1 or more outpatient visits/month or 1 or more calls to nurse or physician per 2 months); 68% arthritis, 62% hypertension, 30% heart disease, 31% liver disease, 15% cancer, 15% diabetes Age: average: intervention 72, usual care 75 (P = 0.008) Gender: intervention 69%, control 64% female (ns). Baseline N: 419 contacted, of whom 300 returned questionnaires (of whom 77 said not interested, 3 termination from programme, 4 transfers to another clinic, 9 lack of transport, 3 died, 2 low utilisers, 1 home bound). Then 113 additional participants added. Randomised to (1) group visits (160, of whom 20 no‐shows, 19 dropouts, 2 no transport, 5 deaths, 1 skilled nursing facility, 1 transferred clinic) and (2) usual care (161, of whom 9 deaths, 7 belonged to Kaiser Permanente, 2 skilled nursing facility, 3 transferred clinic) | |
| Interventions | Intervention group 1: visits to physician and nurse at clinic in groups average size 8, for (a) 15‐minute warmup and socialisation with information on specific disease processes; (b) 15‐minute break for socialisation, and nurse checked blood pressure, immunisation status, immediate needs, and arranged visit with physician; (c) 15 minutes of questions and answers, and planned next visit; (d) 30 minutes for visit to physician Control: usual visits to physician | |
| Outcomes | Outcome measured: % vaccinated Time points from the study considered in the review or measured or reported in the study: not stated % vaccinated by: date not stated | |
| Notes | Funding: Garfield Memorial Fund, Research and Development Fund Kaiser Health Plan of Colorado data from administrative databases and chart review used to measure vaccination uptake. No intended or unintended co‐interventions recorded. | |
| Risk of bias | ||
| Bias | Authors' judgement | Support for judgement |
| Random sequence generation (selection bias) | High risk | 113 participants added, but did not receive the baseline Senior Health Questionnaire, and not stated if randomly assigned; groups were equivalent at baseline in important characteristics related to the outcome except age (P = 0.008). |
| Allocation concealment (selection bias) | Unclear risk | No statement |
| Blinding (performance bias and detection bias) All outcomes | Low risk | Data were obtained from administrative databases and chart review to measure vaccination uptake. |
| Incomplete outcome data (attrition bias) All outcomes | High risk | In intervention group, participants attended an average of 6.62 group visits (55% of those scheduled), and no process analysis whether active involvement/participation by individual participants in group activities. 48 dropouts from intervention group (30%) and 21 (13%) from control, not equivalent in composition: intervention (20 no‐shows, 19 dropouts, 5 deaths, 2 no transport, 1 transferred to nursing home, 1 transferred clinic); control (9 deaths, 2 transferred to nursing home, 3 transferred clinic, 7 other). Influenza vaccination rate in control decreased from 72% in previous year to 64% 1 year after intervention, and in experimental group increased from 74% in previous year to 81%. The better result in the experimental group could be due in part to attrition of less interested participants. |
| Selective reporting (reporting bias) | Low risk | No selective reporting |
Berg 2008.
| Methods | Purpose: to test hypotheses that mailed advice to receive an influenza vaccine or to call a telephonic nurse service would reduce condition‐related inpatient bed days and emergency department visit Design: RCT Duration of study: 5 months Interval between intervention and when outcome was measured: not stated Power computation: no information provided Statistics: unit of study is household, not individual. Clustered analyses were done, including for differences in vaccination uptake using Chi² statistics generated by the 'proc genmod' command using the 'repeated' option in SAS to account for the clustering effect on variance. Data are presented in such a way that the reader can do a comparison of the influenza vaccination uptake between groups as a secondary analysis, but the trial was not explicitly designed to test the effects of the interventions on influenza vaccination uptake. | |
| Participants | Country: USA Setting: subscribers (households) and their dependents over the age of 65 years enrolled in the Blue Cross & Blue Shield Government‐wide Service Benefit Plan in the states of Oklahoma, Rhode Island, Kentucky, California, Arizona, Utah, and Colorado in October 2002. Subscribers were current or retired federal employees. Eligible participants: (health status): no data provided on health status; however, the 'participants' are actually 'households'. Age: 65 years or older Gender: 60% female | |
| Interventions | Intervention 1: postal cue encouraging influenza vaccination (N = 26,474 people) Intervention 2: postal cue to call a nurse advice service if symptoms consistent with influenza‐like illness developed (26,846 people) Control: no postal cues sent (81,453 people) | |
| Outcomes | Outcome measured: claims made to the insurance providers for inpatient bed days, emergency department visits, physician evaluation and management visits and other outpatient visits for selected respiratory or congestive heart failure ICD‐9‐CM code diagnoses claims. Physician evaluation and management visits were examined using clinical procedural terminology codes. However, although not a primary outcome planned for this study, data were obtained for influenza vaccination uptake, which are presented in Tables 2 and 3 in the form of rates calculated as (number of events/N in sample) x 10,000. |
|
| Notes | Funding: Blue Cross Blue Shield Association, McKesson Corporation | |
| Risk of bias | ||
| Bias | Authors' judgement | Support for judgement |
| Random sequence generation (selection bias) | Low risk | "Households in all states had an equal probability of assignment into the intervention group." "The simple randomisation code was developed by using a computer random number generator between the values of 0 and 1 so that the control group was 3 times as large as the intervention group." |
| Allocation concealment (selection bias) | Unclear risk | No statement |
| Blinding (performance bias and detection bias) All outcomes | Low risk | No statement; outcome data based on billing claims |
| Incomplete outcome data (attrition bias) All outcomes | Unclear risk | Attrition of participants not addressed: "Because the mailings were sent out in bulk, no information was available on undeliverable pieces." Unable to assess incomplete data points for participants. "Influenza vaccinations often are given in settings that do not generate claims, thus limiting the reliability of evidence of influenza vaccinations as seen via administrative claims." Analysis of whether differential attrition could affect outcomes was not performed. The study was not designed to evaluate uptake of influenza vaccination as a primary outcome, and because it is possible that participants might have received influenza vaccination from a source that did not result in a claim being made to the insurers from which the outcomes were ascertained, there is likely underestimation of the influenza vaccination uptake for all 3 study groups. However, one might argue that one would not necessarily a priori expect to see systematic difference in utilisation of uncaptured sources of influenza vaccination between these groups unless there was differential dropout between the groups over time. No information was presented on people who might have dropped out because of death during the study or on those who might have lost their insurance benefits during the study period. This is a threat to the validity of both the cardinal outcomes and the analysis of secondary outcomes we performed. |
| Selective reporting (reporting bias) | Low risk | No selective reporting |
Black 1993.
| Methods | Purpose: to compare effects on influenza vaccination uptake of a home visit including an intervention promoting influenza vaccination to a home visit with an intervention promoting safety Design: RCT Duration of study: not stated Interval between intervention and when outcome was measured: not stated Power computation: post hoc power computation showed 80% power α = 0.05 to detect 50% difference. Statistics: percentages; multiple logistic regression | |
| Participants | Country: Canada Setting: Hamilton, Ontario Eligible participants: (health status): 1011 clients aged ≥ 65 years referred to public health nurses in Hamilton Age: 78 years Gender: 71% female in influenza intervention group, 62% female in safety intervention | |
| Interventions | Intervention 1: home visit including an intervention promoting influenza vaccination Intervention 2: home visit including an intervention promoting safety Control: no control group E‐mail from author: "our high rates post intervention in the intervention and control groups may have been due to attention bias, although we tried to minimize it in the 'safety' group by asking the PHNs to avoid discussing immunization history with safety group subjects. However, at that time the province and federal governments had become more active with media campaigns and that too could explain the high rates in both groups." | |
| Outcomes | Outcome measured: % influenza vaccination Time points from the study considered in the review or measured or reported in the study: not stated % vaccinated by: not stated | |
| Notes | Funding: Ontario Ministry of Health | |
| Risk of bias | ||
| Bias | Authors' judgement | Support for judgement |
| Random sequence generation (selection bias) | Unclear risk | "were randomly assigned" (no method stated) |
| Allocation concealment (selection bias) | Unclear risk | No statement |
| Blinding (performance bias and detection bias) All outcomes | Low risk | No statement, however "outcome data were obtained through telephone interview (or home visit) by two research assistants who were unaware of group membership." |
| Incomplete outcome data (attrition bias) All outcomes | Low risk | 589 of 1011 eligible clients excluded because of cognitive impairment or not active clients, and 57 declined; 157 received influenza vaccination promotion and 148 safety promotion; 45 clients assigned to influenza vaccination promotion group had already received influenza vaccine and were included in influenza vaccination promotion group for ITT analysis. Outcome data collected by 2 research assistants either through phone calls or home visits. |
| Selective reporting (reporting bias) | Low risk | No selective reporting |
Boca 2012.
| Methods | Letter describing clinical manifestations and complications of influenza, effectiveness of vaccine sent to intervention group; control group received no intervention; power computation assessed 1187 required in each group to find difference of 5% in vaccination rates, P = 0.05, power = 0.80; vaccination assessed from computer records. | |
| Participants | 2402 participants ≥ 60 years in a health centre in Castellón, Valencia, Spain | |
| Interventions | Letter mailed to homes of participants in intervention group. | |
| Outcomes | Vaccination rates in 2009 seasonal vaccination campaign | |
| Notes | Of those vaccinated in 2009, 501 (52.7%) received the letter and 449 (47.3%) did not (P = 0.01); vaccination in 2008 was highly correlated with vaccination in 2009 (P < 0.0001). Funding: Spanish VACH Cohort and the ISCIII‐RETIC (RD06/006) |
|
| Risk of bias | ||
| Bias | Authors' judgement | Support for judgement |
| Random sequence generation (selection bias) | Low risk | Computer random number generator |
| Allocation concealment (selection bias) | Unclear risk | Not stated |
| Blinding (performance bias and detection bias) All outcomes | Low risk | Healthcare workers caring for participants blinded, participants not blinded. |
| Incomplete outcome data (attrition bias) All outcomes | Low risk | No letters returned undelivered. |
| Selective reporting (reporting bias) | Low risk | No selective reporting |
Buffington 1991.
| Methods | Purpose: to compare displaying clinic and individual physician influenza vaccination uptake on posters plus postcard reminders to participants, to displaying clinic and individual physician influenza vaccination uptake on posters, to no intervention Design: RCT, clinics as unit of randomisation Duration of study: 23 September to 30 December 1989 Interval between intervention and when outcome was measured: from 23 September to 30 December 1989 Power computation: not performed Statistics: not stated; probabilities reported | |
| Participants | Country: USA Setting: 45 physicians in 3 offices associated with Genesee Hospital, Rochester, NY Eligible participants: (health status): aged ≥ 65 years Age: ≥ 65 years Gender: not stated | |
| Interventions | Intervention 1: display of clinic and individual physician influenza vaccination uptake on posters plus postcard reminders to participants Intervention 2: display of clinic and individual physician influenza vaccination uptake on posters Control: no intervention E‐mail from author: "What was interesting was the competition that evolved in those physicians that used the target model. Physicians using the target model did compare their progress with other physician's results. The whole effort generated a pretty positive attitude toward getting the elderly immunized against influenza." | |
| Outcomes | Outcome measured: % influenza vaccination Time points from the study considered in the review or measured or reported in the study: 23 September to 30 December 1989 % vaccinated by: 30 December | |
| Notes | Funding: Medicare Influenza Demonstration Project sponsored by US Health Care Finance Administration | |
| Risk of bias | ||
| Bias | Authors' judgement | Support for judgement |
| Random sequence generation (selection bias) | Unclear risk | "Practices were stratified according to size and randomised." (no statement about method) |
| Allocation concealment (selection bias) | Unclear risk | No statement |
| Blinding (performance bias and detection bias) All outcomes | Low risk | No statement, but influenza vaccination uptake from computerised billing codes, or line listing of vaccinees in practices that were not computerised |
| Incomplete outcome data (attrition bias) All outcomes | Low risk | 2149 in Group 2 (poster), 3604 in Group 3 (poster and postcard) and 4772 in Group 1 (control), but no statement as to how many letters returned undelivered; influenza vaccination uptake from computerised billing codes, or line listing of vaccinees in practices that were not computerised |
| Selective reporting (reporting bias) | Low risk | No selective reporting |
CDC 1995a (Wyoming).
| Methods | Purpose: to compare an individual letter plus an informational brochure about influenza vaccination to a form letter plus brochure to no intervention in Montana and Wyoming Design: RCT; Montana was divided into 24 geographic regions, and Wyoming into 16 by zip codes, with 4 regions randomly assigned from each to intervention. Duration of study: 3 months Interval between intervention and when outcome was measured: brochure or letter mailed to Medicare beneficiaries 23 to 30 September 1994; vaccination uptake assessed 1 October to 31 December 1994 and compared to 1993 vaccination uptake rates Power computation: not performed Statistics: logistic regression to examine relationship of letter plus brochure and influenza vaccination; Egret statistical software to adjust for confounding variables | |
| Participants | Total number: Montana: personalised letter 19,850, form letter 21,250, no letter 150,000; Wyoming same numbers Setting: all Medicare beneficiaries in Montana and Wyoming Diagnostic criteria: % receiving influenza vaccination recorded as influenza vaccination claims submitted to Health Care Financing Administration (Medicare pays for influenza vaccination for all those enrolled in Medicare Part B, and 96% of those ≥ 65 years in the USA are enrolled in Medicare Part B). Gender: not stated Age: ≥ 65 years Country: USA Comorbidity not stated. Sociodemographics not stated. Ethnicity not stated. Date of study 1994 |
|
| Interventions | Intervention 1: individual letter plus an informational brochure about influenza vaccination Intervention 2: form letter plus brochure Control: no intervention Integrity of intervention not stated. |
|
| Outcomes | Outcome measured: % vaccinated
Time points from the study considered in the review or measured or reported in the study: influenza vaccination claims October 1 through 31 December 1994, and compared to vaccination uptake 1 October to 31 December 1993
% vaccinated by: 31 December 1984 Note: numbers in CDC 1995a (Wyoming) and CDC 1995b (Montana) differ from those in Maglione 2002a. We adopted the numbers in Maglione 2002a because the authors reported extracting data independently in duplicate, comparing them, and resolving discrepancies. |
|
| Notes | Funding: Montana‐Wyoming Foundation for Medical Care | |
| Risk of bias | ||
| Bias | Authors' judgement | Support for judgement |
| Random sequence generation (selection bias) | Unclear risk | "The two states were divided into 40 geographic regions defined by zip code aggregates (24 in Montana, 16 in Wyoming); in each state four regions were randomly selected as intervention sites." |
| Allocation concealment (selection bias) | Unclear risk | No statement |
| Blinding (performance bias and detection bias) All outcomes | Unclear risk | No statement |
| Incomplete outcome data (attrition bias) All outcomes | Low risk | Influenza vaccination data are collected by Medicare as billing claims. |
| Selective reporting (reporting bias) | Low risk | No selective reporting |
CDC 1995b (Montana).
| Methods | Data are for Wyoming. See McMahon 1995b | |
| Participants | See McMahon 1995b | |
| Interventions | See McMahon 1995b | |
| Outcomes | See McMahon 1995b | |
| Notes | — | |
| Risk of bias | ||
| Bias | Authors' judgement | Support for judgement |
| Random sequence generation (selection bias) | Unclear risk | "The two states were divided into 40 geographic regions defined by zip code aggregates (24 in Montana, 16 in Wyoming); in each state four regions were randomly selected as intervention sites." |
| Allocation concealment (selection bias) | Unclear risk | No statement |
| Blinding (performance bias and detection bias) All outcomes | Unclear risk | No statement |
| Incomplete outcome data (attrition bias) All outcomes | Low risk | Influenza vaccination data are collected by Medicare as billing claims; 96% of those ≥ 65 years are covered by Medicare Part B, which processes all billing claims for influenza vaccination. |
| Selective reporting (reporting bias) | Low risk | No selective reporting |
Chambers 1991.
| Methods | Purpose: to compare reminders to internal medicine residents to give influenza vaccination for all, half, or none of their patients Design: RCT, resident physicians randomised Duration of study: 2 months Interval between intervention and when outcome was measured: 1 October to 30 November 1987 Power computation: not performed Statistics: Chi², multiple logistic regression | |
| Participants | Country: USA Setting: Family Practice Center of Thomas Jefferson University, Philadelphia Eligible participants: (health status); all patients aged ≥ 65 years Age: ≥ 65 years Gender: 74% female | |
| Interventions | Intervention 1: reminders to internal medicine residents to give influenza vaccination for all of their patients Intervention 2: reminders to internal medicine residents to give influenza vaccination for half of their patients Control: no reminders | |
| Outcomes | Outcome measured: % influenza vaccination Time points from the study considered in the review or measured or reported in the study: 1 October to 30 November 1987 % vaccinated by: 30 November 1987 | |
| Notes | Funding: not stated | |
| Risk of bias | ||
| Bias | Authors' judgement | Support for judgement |
| Random sequence generation (selection bias) | Low risk | "All physicians in the practice were stratified based on level of training and randomly assigned to one of three groups via a computerised randomization program" |
| Allocation concealment (selection bias) | Unclear risk | No statement |
| Blinding (performance bias and detection bias) All outcomes | Low risk | No statement, but influenza vaccinations were recorded by computerised billing system. |
| Incomplete outcome data (attrition bias) All outcomes | Unclear risk | 2493 eligible patients, of whom 864 visited clinic during 2‐month study period; of these 168 excluded (had already received influenza vaccine or saw several physicians), 24 made drop‐in visits, leaving 686 for randomisation, of whom 464 aged ≥ 65 years; average 10% had received influenza vaccination previous year |
| Selective reporting (reporting bias) | Low risk | No selective reporting |
Chan 2002.
| Methods | Purpose: comparison of 4 reminders monthly to physiatrists to offer influenza vaccination compared to no reminders Design: RCT; intervention and control groups switched in 1998 Duration of study: intervention administered "during influenza season." Interval between intervention and when outcome was measured: all Medicare claims for influenza vaccination in 1997 and 1998 Power computation: not performed Statistics: t‐tests; random‐effects log‐binomial model and generalised programmed linear mixed model to estimate risk ratio of vaccination, controlling for patient age, gender and number of claims | |
| Participants | Country: USA Setting: physiatrists (rehabilitation physicians) in Washington state and their patients Eligible participants: (health status) 105 physiatrists in Washington state in 1996 with 4300 patients aged ≥ 65 years in 1997 and 4025 in 1998; exclusions: any patient seen by more than 1 physiatrist (n = 1065); 1 physiatrist who received intervention in both 1997 and 1998 and was excluded in 1998; 5 physiatrists who did not submit Medicare claims in 1997 Age: 1997: 70.2 years; 1998: 69.5 years Gender: 60% female | |
| Interventions | Intervention 1: in 1997 the solo practitioners were randomised to receive either 4 reminders or none; group practices were also randomised to receive 4 reminders or none; in 1998 within each practice group intervention and control groups were switched. Control: no reminders in alternate years | |
| Outcomes | Outcome measured: % vaccinated Time points from the study considered in the review or measured or reported in the study: all Medicare claims for influenza vaccination in 1997 and 1998 % vaccinated by 31 December 1998 | |
| Notes | Funding: Health Care Financing Administration We entered the vaccination uptake in the control groups in 1997 as the baseline prior year uptake for the intervention group in 1998; the 1998 trial was a cross‐over of the 1997 participants. | |
| Risk of bias | ||
| Bias | Authors' judgement | Support for judgement |
| Random sequence generation (selection bias) | Low risk | "We performed a randomised crossover trial ..." E‐mail from author: "This project was done through Medicare's Division of Clinic Standards and Quality as a quality improvement project. I think that we went to a table of random numbers assigned each provider a random number. The even numbers got one arm, the odd number got the other arm" |
| Allocation concealment (selection bias) | Unclear risk | No statement |
| Blinding (performance bias and detection bias) All outcomes | Low risk | E‐mail from author: "Staff were blinded to the allocation." Outcome was influenza Medicare claims. |
| Incomplete outcome data (attrition bias) All outcomes | Low risk | Data reported for all 1997 and 1998 participants. |
| Selective reporting (reporting bias) | Low risk | No selective reporting |
Clayton 1999.
| Methods | Purpose: to compare educational materials plus postcard to educational materials to encourage influenza vaccination Design: RCT, households randomised Duration of study: October to December 1997 Interval between intervention and when outcome was measured: October to December 1997 Power computation: 99% power to detect 5% difference Statistics: binomial test for differences in proportions; Chi² for association between demographic variables and group assignment | |
| Participants | Country: USA Setting: Kaiser Permanente Northeast Eligible participants: (health status): 10,700 aged ≥ 65 years Age: 73.5 years Sex: 57% female | |
| Interventions | Participants with a record of influenza vaccination the previous year (n = 5278) Intervention 1: mailed educational materials plus reminder postcard (N = 2631) Intervention 2: mailed educational materials (N = 2647) Participants with no record of influenza vaccination previous year (n = 5422) Intervention 1: mailed educational materials plus reminder postcard (N = 5422) No control group | |
| Outcomes | Outcome measured: % influenza vaccination Time points from the study considered in the review or measured or reported in the study: October to December 1997 % vaccinated by: December 1997 | |
| Notes | Funding: Kaiser Permanente | |
| Risk of bias | ||
| Bias | Authors' judgement | Support for judgement |
| Random sequence generation (selection bias) | Unclear risk | "... half were randomly selected to receive the postcard reminder in addition to the standard member educational materials (intervention group), and the other half did not receive a postcard (control group)." |
| Allocation concealment (selection bias) | Unclear risk | No statement |
| Blinding (performance bias and detection bias) All outcomes | Low risk | "... the vaccination rates were estimated through administrative data." |
| Incomplete outcome data (attrition bias) All outcomes | High risk | "Because the sensitivity of administrative data is somewhat limited (estimated to be 62.4%, according to Kaiser Permanente Northeast Division studies), the vaccination rates presented are underestimates of the true rates." |
| Selective reporting (reporting bias) | Low risk | No selective reporting |
Conner 2017.
| Methods | Purpose: to assess the impact of question‐behaviour effect (QBE) surveys on influenza vaccination behaviour in older adults Design: RCT Power computation: "Using the effect size (d ¼ 0.13) from Conner et al. (2011) study of the QBE and influenza vaccination, G*Power indicated that 1539 participants per condition would provide 95% power to detect a significant effect at an alpha of 0.05 using a two‐tailed test." Statistics: "multilevel modelling analyses (using random effects, the Bernoulli model, and centring predictor variables around the group mean) that controlled for the fact that participants were clustered within one of seven General Practices examined the impact of condition on rates of vaccination controlling for any differences across conditions. For each predictor we report unstandardized coefficients, standard errors, odds ratios and 95% confidence intervals (based on the population‐average model)." |
|
| Participants | All participants aged 65 years or over in 1 of 7 general practices in northern England who were eligible for an influenza vaccine but had not taken part in a "centralized influenza vaccination invitation scheme in Fall/Autumn 2012)." | |
| Interventions | Participants in control condition 1 (no questionnaire) did not receive a questionnaire. Participants in control condition 2 (demographics questionnaire) received a questionnaire tapping whether they had children, their occupation, marital status, and ethnic origin. Participants in the other 6 conditions received questionnaires tapping the same demographic questions plus questions about influenza vaccination: intention + attitude questions (both conditions 3 and 4); anticipated regret + intention + attitude questions (both conditions 5 and 6); beneficence + intention + attitude questions (both conditions 7 and 8). Conditions 4, 6, and 8 additionally had a sticky note attached to the front that included a message (“Please take a few minutes to complete this for us. Thank you!”) printed in blue on a yellow (72 72 mm) sticky note but with the message appearing to be handwritten. | |
| Outcomes | 1. Receipt of a demographic questionnaire had no effect on vaccination rates as compared with control (those who did not receive a questionnaire) (B = 0.058, standard error = 0.081, P = 0.50, OR = 1.06, 95% CI = 0.87, 1.29). 2. Vaccination rates were higher among participants who received a vaccination questionnaire (B = 0.160, P = 0.04). 3. Neither cognitive target manipulation (intention + attitude questions vs intention + attitude + anticipated regret questions vs intention + attitude + beneficence questions) nor presence vs absence of a sticky note influenced vaccination rates. 83.4% had received a previous influenza vaccination. The vaccination rates for the 8 groups were: (a) control group 1 (no questionnaire) 74.7%; control group 2 (demographics questionnaire) 75.7%; (b) intention to attend for a flu shot group 1 ("I intend to attend for a flu shot") 76.8%; intention group 2 (with sticky note "Please take a few minutes to complete this for us. Thank you!") 77.4%; (c) regret + intention group 1 (2 questions: "If I did not attend for the flu shot I would feel regret"; "I would later wish I had") 77.2%; regret + intention group 2 (with sticky note) 78.1%; (d) intention + regret + beneficence group 1 72.2%; group 2 (with sticky note) 77.1%. |
|
| Notes | Funding: UK Economic and Social Research Council | |
| Risk of bias | ||
| Bias | Authors' judgement | Support for judgement |
| Random sequence generation (selection bias) | Low risk | "Patients were randomized individually to one of eight conditions by the second author using a random number generator but were not blinded to condition (presence or type of survey administered)" |
| Allocation concealment (selection bias) | Low risk | "Patients were randomized individually to one of eight conditions by the second author using a random number generator but were not blinded to condition (presence or type of survey administered)" |
| Blinding (performance bias and detection bias) All outcomes | Unclear risk | No statement |
| Incomplete outcome data (attrition bias) All outcomes | Unclear risk | A total of 15 participants were excluded (12 not randomised, 3 no vaccination data), resulting in a final sample of 13,803 (there were no significant differences between the 2 groups on sex, age, or previous influenza vaccination). |
| Selective reporting (reporting bias) | Low risk | No selective reporting |
Dalby 2000.
| Methods | Purpose: to compare encouragement by visiting nurse to receive influenza vaccination to no intervention Design: RCT Duration of study: 14 months Interval between intervention and when outcome was measured: within 14 months of study Power computation: α = 0.05, β = 0.8, difference = 15%, requires n = 128 Statistics: Chi², Fisher's exact; Student's t‐test, Mann‐Whitney U test | |
| Participants | Country: Canada Setting: practices of 2 physicians in Stoney Creek, Ontario Eligible participants: (health status): individuals ≥ 70 years and functional impairment or admission to hospital or bereavement in past 6 months Age: ≥ 70 years, average 78.5 years Gender: 71% female in nurse group, 62% in control | |
| Interventions | Intervention 1: encouragement by visiting nurse during comprehensive assessments to receive influenza vaccination, care plan developed with physician Control: no intervention | |
| Outcomes | Outcome measured: % influenza vaccination Time points from the study considered in the review or measured or reported in the study: 14 months, dates not stated % vaccinated by: not stated | |
| Notes | Funding: Ontario Ministry of Health | |
| Risk of bias | ||
| Bias | Authors' judgement | Support for judgement |
| Random sequence generation (selection bias) | Low risk | "Eligible participants were randomly assigned ... by a research assistant not affiliated with the HSO using a random number table. The randomization schedule was developed by another research assistant, who was not involved in the randomization process." |
| Allocation concealment (selection bias) | Low risk | "The randomizations schedule was kept within the Health Services Delivery Research Unit of the St. Joseph's Community Health centre throughout the trial." |
| Blinding (performance bias and detection bias) All outcomes | Unclear risk | No statement |
| Incomplete outcome data (attrition bias) All outcomes | Low risk | "... a research nurse conducted a detailed audit of all participants' medical records" |
| Selective reporting (reporting bias) | Low risk | No selective reporting |
Dapp 2011.
| Methods | Purpose: to assess the effects of health risk appraisal, personal reinforcement, and quality circles for older people to improve preventive care and health behaviour Design: RCT (participants of solo GPs individually randomly assigned by computer to intervention or control). The 21 solo GPs were allocated to 3 clusters of GPs matched by age, gender, and qualification. Duration of study: recruitment over a 9‐month period. Follow‐up at 1 year (duration of intervention not stated) Interval between intervention and when outcome was measured: follow‐up at 1 year (duration from end of intervention not stated) Power computation: 763 required in intervention and 1525 in control to detect 30% difference in preventive care or health behaviour, alpha = 0.05, power = 80%, assuming 20% preventive behaviour in controls and 20% dropout. Statistics: generalised estimating equations; for missing data multiple imputations |
|
| Participants | Country: Germany Setting: 21 solo GP practices in Hamburg Eligible participants: (health status): 500 GP practices in Hamburg, of which 21 agreed to participate; each practice provided completed list of those ≥ 60 years, and "eligibles" from practices who returned brief questionnaire and consent form were randomised (total number of eligibles not stated); 2580 patients of 14 general practitioners who returned questionnaires were randomised and 746 who were not randomised were placed in a "concurrent comparison" group. Age: average 72 years Gender: 62% female |
|
| Interventions | Intervention (n = 878): health risk appraisal, individualised recommendations, health information, reinforcement by home visit or group sessions Control (n = 1702): usual care (but their GPs had received the training how to care for the intervention group participants but did not implement it with their patients) Comparison group (n = 746): "usual care;" (patients were placed in this group if their GPs had not received training Co‐interventions: none |
|
| Outcomes | Outcome measured: % influenza vaccination (and 8 other preventive care outcomes and 6 health behaviours) Time points reported in the study: follow‐up 1 year, time from end of intervention to follow‐up not stated |
|
| Notes | Funding: European Union; Swiss Federal Education and Science Ministry; Bundesministerium für Familie, Senioren, Frauen und Jugend, Berlin; Max and Ingeburg Herz Stiftung, Hambung; Robert Bosch Stiftung, Stuttgart | |
| Risk of bias | ||
| Bias | Authors' judgement | Support for judgement |
| Random sequence generation (selection bias) | Low risk | Computer based at independent centre (participants individually randomised within solo GP practices, GPs were allocated 7 to intervention, 7 to control, and 7 to "concurrent comparison" group) |
| Allocation concealment (selection bias) | Unclear risk | No statement |
| Blinding (performance bias and detection bias) All outcomes | Unclear risk | Blinding not possible, as treating GPs received summary statements about participants as part of intervention. |
| Incomplete outcome data (attrition bias) All outcomes | Unclear risk | Total eligibles not stated; 2580 baseline in RCT (878 intervention, 1702 control), baseline characteristics similar, 746 in "concurrent comparison" group; at 1‐year follow‐up 587 (67%) and 1376 (81%) in control group returned questionnaire; no differential attrition analysis of losses from groups. |
| Selective reporting (reporting bias) | Low risk | No selective reporting |
Dietrich 1989.
| Methods | Purpose: to compare effects of reminder letters and checklists to obtain influenza vaccination to no intervention Design: RCT, participants randomised Duration of study: enrolment during 3 months in "fall of 1984" Interval between intervention and when outcome was measured: 12 months before and after randomisation Power computation: not performed Statistics: t‐tests; Chi² | |
| Participants | Country: USA Setting: community practice in New England with 5 family physicians and 1 internist Eligible participants: (health status) aged ≥ 65 years with office visits during 3‐month enrolment period in 1984; exclusions: no telephone, transient, blind, demented, terminally ill; 156 potential participants, 31 not eligible; 117 returned baseline questionnaire; 2 died and 1 moved during study Age: 74 years Gender: 68% female | |
| Interventions | Intervention: mailed personal prevention checklists, letters encouraging use of checklists to keep track of preventive health care Control: no intervention | |
| Outcomes | Outcome measured: % vaccinated Time points from the study considered in the review or measured or reported in the study: 12 months before and after randomisation % vaccinated by 12 months after randomisation | |
| Notes | Funding: American Academy of Family Physicians and US Public Health Service | |
| Risk of bias | ||
| Bias | Authors' judgement | Support for judgement |
| Random sequence generation (selection bias) | Unclear risk | "participants were assigned randomly" (no statement about method) |
| Allocation concealment (selection bias) | Unclear risk | No statement |
| Blinding (performance bias and detection bias) All outcomes | Low risk | No statement, chart audit for vaccinations (not stated who performed chart audit, but was retrospective), and questionnaires for vaccination received elsewhere |
| Incomplete outcome data (attrition bias) All outcomes | Low risk | All 114 recruited participants were followed to the end of the study; chart audit for vaccinations, and questionnaires for vaccination received elsewhere. |
| Selective reporting (reporting bias) | Low risk | No selective reporting |
Díaz Grávalos 1999.
| Methods | Purpose: to compare personalised postcard to encourage influenza vaccination to no intervention Design: RCT, participants randomised Duration of study: 1 October to 4 December 1998 Interval between intervention and when outcome was measured: 1 October to 4 December 1998 Power computation: P1 = 0.05; P2 = 0.15, α = 0.05, β = 0.90, requires n = 152 Statistics: RRs, 95% CIs | |
| Participants | Country: Spain Setting: San Cristovo de Cea, Ourense Eligible participants: (health status): residents aged ≥ 65 years (n = 640) who had not been vaccinated after 50 days (3/4 of the duration of the influenza vaccination campaign) had elapsed, and were randomly assigned to receive a reminder postcard (n = 162) or no intervention (n = 478). Age: ≥ 65 years, average 76.5 years Gender: 58.6% female | |
| Interventions | Intervention: personalised postcard to encourage influenza vaccination Control: no intervention | |
| Outcomes | Outcome measured: % influenza vaccination Time points from the study considered in the review or measured or reported in the study: 1 October to 4 December 1998 % vaccinated by: 4 December 1998 |
|
| Notes | Funding: not stated | |
| Risk of bias | ||
| Bias | Authors' judgement | Support for judgement |
| Random sequence generation (selection bias) | Low risk | randomised number table using EPIDAT |
| Allocation concealment (selection bias) | Unclear risk | No statement |
| Blinding (performance bias and detection bias) All outcomes | Unclear risk | No statement |
| Incomplete outcome data (attrition bias) All outcomes | Unclear risk | No statement on how many of the 162 were assessed at the end of the study. No differences by gender or age between vaccinees in intervention and control groups |
| Selective reporting (reporting bias) | Low risk | No selective reporting |
Frank 2004.
| Methods | Purpose: comparison of opportunistic on‐screen reminders to physicians about preventive care compared to no reminders Design: RCT Duration of study: 9 March 1998 to 8 March 1999 Interval between intervention and when outcome was measured: between 9 March 1998 and 8 March 1999 Power computation: not performed Statistics: univariate binomial regression with GEE; ITT analysis (Very helpful e‐mail from Dr Frank, 23 August 2008: "Our study looked at whether each opportunity to provide a preventive service in a consultation was taken. This is a different way of looking at the question from the more usual approach of asking what proportion of participants who had attended during the influenza immunization season had received the vaccine by the end of the season (in other words, efficacy), or from asking what proportion of participants of the practice had received the vaccine by the end of the season (effectiveness). "We were interested in what happened in each consultation in which influenza vaccination was indicated and due for the patient. We were able to do this very data‐intensive exercise only because we set out to use a practice that kept all clinical and billing data electronically and because I custom wrote software to analyse the practice's electronic data automatically. To my knowledge, this study is unique in its intensive automated analysis of each consultation. "The GPs actually performed slightly worse when reminded to give influenza vaccine. We don't know why this occurred, but it may be because the rate of giving influenza vaccine to participants 65 years and over in Australia was already quite high, possibly making our reminders redundant "In our approach, we were not interested in numbers of participants, but in the number of opportunities that arose in consultations for the participants who did attend. Our approach to examining the question of opportunistic performance of preventive services is almost unique, in that we looked closely at every opportunity that arose, and did not take a snapshot of the practice population at one point in time, which is what almost all other studies have done. In retrospect, it would have been useful to collect data about efficacy so that we could compare our results more easily with those other studies.") | |
| Participants | Country: Australia Setting: urban practice with 10 GPs Eligible participants: (health status): 10,507 for all reminder activities, of whom 1847 were ≥ 65 years and eligible for the influenza intervention Age: ≥ 65 years Gender: 57% female | |
| Interventions | Intervention: computer‐generated reminder Control: no intervention | |
| Outcomes | Outcome measured: % influenza vaccination Time points from the study considered in the review or measured or reported in the study: 9 March 1998 to 30 June 1998 (these dates are from e‐mail from author) % vaccinated by: 30 June 1998 | |
| Notes | Funding: not stated (PhD thesis) | |
| Risk of bias | ||
| Bias | Authors' judgement | Support for judgement |
| Random sequence generation (selection bias) | Low risk | All quotes are from e‐mail from author 18 August 2008: "Randomization of participants was automated. Patients were randomised by the last digit of their family's five digit number within the practice. Family numbers had been allocated sequentially by the practice's computer system without regard to any characteristics of the patient or the family. We were satisfied that this method was not likely to cause any bias in the randomization." |
| Allocation concealment (selection bias) | Unclear risk | "Allocation was not concealed. However, I believe that in the daily rush of seeing participants, most of the GPs were unlikely to have had time or energy to look at the patient's family number in order to work out to which group the patient had been randomised." |
| Blinding (performance bias and detection bias) All outcomes | Unclear risk | "Blinding, in the sense of blinding the investigators, was not necessary because the judgement of whether a preventive activity (including the administration of influenza vaccine) had been performed was made by searching the practice's electronic clinical record automatically"; "Vaccinations were recorded by the doctors in their clinical record system's immunization module which used coded data entry to make the entries consistent and therefore machine‐searchable. If our search found a record of influenza vaccine being given between 9th March (the start of our trial) and the end of June (the end of the useful immunization season), this was counted as influenza immunisation having been performed" |
| Incomplete outcome data (attrition bias) All outcomes | Low risk | "We analysed all data by intention to treat. All participants who were enrolled and randomised (both of which occurred automatically at their first visit during the trial) were included in the analyses." |
| Selective reporting (reporting bias) | Low risk | No selective reporting |
Garcia‐Aymerich 2007.
| Methods | Purpose: evaluate the effects of an integrated care intervention on outcomes of participants with COPD Design: RCT; participants randomised Duration: 1 year Power computation: not performed Statistics: "Results are expressed as mean (SD), median (P25–P75), or as number (percentage) in the corresponding categories. To assess the possibility of selection bias, comparisons of baseline characteristics between UC [usual care] and IC [integrated care], both for the followed‐up and for the lost subjects were performed using independent t‐tests, Kruskal–Wallis test or the Chi‐square test" |
|
| Participants | Country: Spain Setting: Barcelona tertiary hospital Participants: 113 people with COPD discharged from hospital Age: average 73 years Gender: 84% male |
|
| Interventions | Intervention group received: 1. "a comprehensive assessment of the patient at discharge ... by a specialized nurse"; 2. a 2‐hour education session focusing on disease education, treatment, self management, social support, and call centre support; 3. tailored treatment plan, home visit by specialised nurse and primary care team within 72 hours after discharge and follow‐up phone calls at 3 and 9 months to reinforce self management strategies, and online access to a specialised nurse. Control group received usual care. Participants in intervention and control groups were assessed via a questionnaire. |
|
| Outcomes | No significant difference in influenza vaccination uptake between intervention and control (90% versus 78%, P = 0.442) | |
| Notes | Funding: European Union Linkcare eTEN C517435; Marato de TV3; Comissionat per a Universitats i Recerca de la Generalitat de Catalunya (SGR‐00386) and Red Respira‐ISCIII‐RTIC‐03/11 and Red Telemedicina ISCIII‐RTIC‐03/117; Instituto de Salud Carlos III (CP05/00118), Ministry of Health, Spain; European Union CHRONIC (IST‐1999/12158) | |
| Risk of bias | ||
| Bias | Authors' judgement | Support for judgement |
| Random sequence generation (selection bias) | Low risk | "randomly assigned"; "blindly assigned (1:2 ratio) using computer generated random numbers either to integrated care (IC) or to usual care (UC)." |
| Allocation concealment (selection bias) | Low risk | "blindly assigned (1:2 ratio) using computer generated random numbers either to integrated care (IC) or to usual care (UC)." |
| Blinding (performance bias and detection bias) All outcomes | Low risk | "blindly assigned (1:2 ratio) using computer generated random numbers either to integrated care (IC) or to usual care (UC)." |
| Incomplete outcome data (attrition bias) All outcomes | High risk | 21/44 integrated‐care participants and 41/69 conventional‐care participants assessed at 12 months; "subjects who were lost for the present analysis had a higher number of COPD admissions in the previous year and in the follow‐up year, and they were using long‐term oxygen therapy in a higher proportion than those subjects who participated in the 12 months assessment." (no differential analysis by group) |
| Selective reporting (reporting bias) | Low risk | No selective reporting |
Herman 1994.
| Methods | Purpose: to compare patient education before the participants were seen by the physician, to patient education and vaccination by nurses before the participants were seen by the physician, to no intervention Design: RCT Duration of study: 1 October 1989 to 31 March 1990 Interval between intervention and when outcome was measured: 1 October 1989 to 31 January 1990 Power computation: not performed Statistics: Chi²; ANOVA; logistic regression controlling for prior baseline vaccination status, age, race, gender, high‐risk comorbidity, and physicians' level of training | |
| Participants | Country: USA Setting: Metro‐Health Medical Center, teaching hospital of Case Western Reserve University Participants: (health status) 1202 participants ≥ 65 years seen during 1988/9 and 1989/90 influenza seasons, of whom 756 were seen during both seasons Age: 74 years Gender: 69% female | |
| Interventions | Intervention 1 "patient education group": educational materials (background papers, guidelines, lectures) plus nurses educated patients with National Institute on Aging 'Shots for Safety' and material on influenza vaccination from Ohio Department of Health Intervention 2 "prevention team group": same as intervention 1, but nurses were allowed to vaccinate patients before they were seen by doctor and maintained health maintenance flow sheet for each patient Control: no intervention for patients Co‐interventions: physicians and nurse practitioners in all 3 groups received educational materials and opportunities to attend lectures. | |
| Outcomes | Outcome measured: % vaccinated, by billing data, researcher chart review, health maintenance flow sheets Time points from the study considered in the review or measured or reported in the study: 1 October 1989 to 31 January 1990 % vaccinated by: 31 January 1990 | |
| Notes | Funding: Case Western Reserve University Teaching Nursing Home Program | |
| Risk of bias | ||
| Bias | Authors' judgement | Support for judgement |
| Random sequence generation (selection bias) | Unclear risk | "The three ... practices were assigned randomly" (no statement about method) |
| Allocation concealment (selection bias) | Unclear risk | No statement |
| Blinding (performance bias and detection bias) All outcomes | Low risk | Daily billing forms were reviewed by trained research assistant. |
| Incomplete outcome data (attrition bias) All outcomes | Low risk | All 1202 participants analysed. |
| Selective reporting (reporting bias) | Low risk | No selective reporting |
Hogg 1998.
| Methods | Purpose: to compare customised letters recommending preventive procedures, to form letters, to no intervention Design: RCT; participants randomised, then entire family included in the intervention group to which the individual patient had been randomised Duration of study: letters sent September 1990 to March 1991; data collected months after letters sent. Interval between intervention and when outcome was measured: 6 months Power computation: the smallest increase to be detected was for Pap smears, so sample powered with α = 0.05, β = 0.8 (% difference to be detected not stated), with allowance for participants who would leave the practice. Statistics: Chi², ANOVA, Kruskal‐Wallis one‐way ANOVA | |
| Participants | Country: Canada Setting: Wakefield Family Medicine Centre, western Quebec Eligible participants: (health status): 8770 families, from whom 719 families were randomly selected; "The random selection of the study sample was applied to individual patient registration numbers in the medical record software system." Age: ≥ 65 years Gender: not stated separately for those aged ≥ 65 years | |
| Interventions | Intervention 1: customised letters recommending preventive procedures Intervention 2: form letters recommending preventive procedures Control: no intervention | |
| Outcomes | Outcome measured: % influenza vaccination Time points from the study considered in the review or measured or reported in the study: letters sent September 1990 to March 1991; data collected months after letters sent % vaccinated by: September 1991 | |
| Notes | Funding: National Health Research & Development Program, Health Canada | |
| Risk of bias | ||
| Bias | Authors' judgement | Support for judgement |
| Random sequence generation (selection bias) | Unclear risk | "The study used a randomised controlled trial design."; "Once an individual was selected, his or her entire family was randomly assigned to one of the three arms of the study." (method not stated) |
| Allocation concealment (selection bias) | Unclear risk | No statement |
| Blinding (performance bias and detection bias) All outcomes | High risk | "The study was not blinded in that physicians could be aware that a patient was a member of a family in the study if the patient mentioned that the family had received a letter." |
| Incomplete outcome data (attrition bias) All outcomes | Unclear risk | 682 randomised to no letter, 676 to form letter, and 613 to customised letter; final comparison among groups (Table 2) lists 249, 245, 192; initial randomisation resulted in unevenly sized groups with fewer in the control group. |
| Selective reporting (reporting bias) | Low risk | No selective reporting |
Hogg 2008.
| Methods | Purpose: to compare a comprehensive preventive intervention programme to no intervention Design: cluster‐RCT, match‐paired; "The unit of randomization and analysis was the practice; the unit of observation was the patient." Duration of study: 11.5 months Interval between intervention and when outcome was measured: "The intervention lasted 11.5 months."; "Data were collected ... up to 2 months after the intervention." Power computation: 24 practices were needed to detect a mean difference of 0.07 in the primary outcome between intervention and control groups ("The delta selected (0.07) approximates the 10% change in care frequently associated with care improvement interventions"), SD = 0.083, α = 0.05, β = 0.83, and 27 practices were recruited to allow for 15% attrition. Statistics: Chi², paired t‐tests | |
| Participants | Country: Canada Setting: 2 letters and brochure to 351 primary care practices in eastern Ontario; 54 practices participated Eligible participants: (health status): aged ≥ 65 years Age: ≥ 65 years Gender: not stated | |
| Interventions | Intervention: comprehensive preventive intervention programme; facilitators were assigned 13 to 14 practices whom they visited monthly, average duration of visit 46 minutes; facilitators encouraged 26 preventive manoeuvres; with baseline audit, feedback, and consensus building, and periodic follow‐up and consensus building Control: no intervention | |
| Outcomes | Outcome measured: % influenza vaccination for each practice Time points from the study considered in the review or measured or reported in the study: "The intervention lasted 11.5 months."; "Data were collected ... up to 2 months after the intervention." % vaccinated by: "up to 2 months after the intervention" | |
| Notes | Funding: Canadian Institutes of Health Research | |
| Risk of bias | ||
| Bias | Authors' judgement | Support for judgement |
| Random sequence generation (selection bias) | Low risk | "Practices were matched on solo versus group practice, presence of nursing staff and location (rural or urban) and each pair member was randomly assigned using the Statistical Analysis software package." |
| Allocation concealment (selection bias) | Low risk | "The allocation sequence was kept locked and unavailable to the administrative staff until the time of assignment." |
| Blinding (performance bias and detection bias) All outcomes | Low risk | "Physicians and facilitators were blinded to the actual manoeuvres that would be included in the preventive performance index." |
| Incomplete outcome data (attrition bias) All outcomes | Low risk | 54 practices randomised, data from 54 analysed (27 intervention, 27 control practices). |
| Selective reporting (reporting bias) | Low risk | No selective reporting |
Hull 2002.
| Methods | Purpose: to compare phone call by receptionist to attend influenza vaccination clinic to no intervention Design: RCT Duration of study: 25 September to 6 October 2000 Interval between intervention and when outcome was measured: data on influenza vaccination status was submitted mid‐December 2000. Power computation: for α = 0.05, β = 0.8, would require 384 participants to show increase in vaccination uptake from 40% to 50%. Statistics: Chi², ITT, generalised linear models for clustered data | |
| Participants | Country: UK Setting: 3 general practices in East London and Essex Eligible participants: (health status): 1820 participants 65 to 74 years not previously in an influenza vaccination recall system; exclusions: asthma, diabetes, COPD, IHD, renal disease Age: 69 years Gender: 54% female | |
| Interventions | Intervention: phone call by receptionist to attend influenza vaccination clinic Control: no intervention Co‐interventions: East London and City Health Authority sent letter to every patient aged ≥ 65 years asking them to contact GP for influenza vaccination; national campaign September promoting influenza vaccination. | |
| Outcomes | Outcome measured: % influenza vaccination Time points from the study considered in the review or measured or reported in the study: 25 September to 6 October 2000 % vaccinated by: 6 October 2001 | |
| Notes | Funding: ELENoR infrastructure grant | |
| Risk of bias | ||
| Bias | Authors' judgement | Support for judgement |
| Random sequence generation (selection bias) | Low risk | "... households, which were randomised to either the control or intervention group by the study co‐ordinator using a computer program (STATA)" |
| Allocation concealment (selection bias) | Unclear risk | "... households, which were randomised to either the control or intervention group by the study co‐ordinator using a computer program (STATA)" (unclear if, once randomised, study co‐ordinator referred back to randomisation lists) |
| Blinding (performance bias and detection bias) All outcomes | Low risk | "Nurses who undertook the vaccination clinics were unaware of the household allocation to control or intervention group." |
| Incomplete outcome data (attrition bias) All outcomes | Low risk | E‐mail from author: "We did an intention to treat analysis, all households in the original randomisation were included in the analysis." |
| Selective reporting (reporting bias) | Low risk | No selective reporting |
Humiston 2011.
| Methods | Purpose: to compare tracking patient influenza vaccination uptake, providing reminders, patient recall, and outreach to participants to standard care in each of 7 clinics Design: RCT; individual seniors were randomised within each clinic to intervention or control Duration of study: 29 September to 13 October 2004 (depending on arrival of influenza vaccine) to 22 January 2004 Interval between intervention and when outcome was measured: 15 weeks Power computation: 170 participants/group to demonstrate 15% difference in vaccination uptake (control rate = 50%), P < 0.05, power 0.80, 2‐tailed; as interest was also to collect data across multiple sites and ethnic groups, more participants were enrolled than required by power computation Statistics: Chi², Fisher's exact, logistic regression; intention‐to‐treat |
|
| Participants | Country: USA Setting: 7 clinics in Rochester, NY Eligible participants: (health status): 2004 (control), 1748 (intervention); 50% white, 33% African‐American, 10% Hispanic, 7% other Age: average 74.2 years Gender: 62% female |
|
| Interventions | Intervention: outreach workers in each of 7 clinics tracked patient influenza vaccination uptake, provided reminders, recalled participants, recalled and phoned participants. Control: standard routine for each clinic Co‐interventions: none |
|
| Outcomes | Outcome measured: % influenza vaccination Time points reported in the study: from 29 September to 13 October 2004 (depending on arrival of influenza vaccine) to 22 January 2004 |
|
| Notes | Funding: Centers for Disease Control and Prevention National Immunization Program | |
| Risk of bias | ||
| Bias | Authors' judgement | Support for judgement |
| Random sequence generation (selection bias) | Low risk | "individual seniors within PCCs to intervention or standard‐of‐care control groups" according to whether last digit of Social Security number odd or even |
| Allocation concealment (selection bias) | Unclear risk | No statement |
| Blinding (performance bias and detection bias) All outcomes | Unclear risk | Blinding not possible due to recalls and prompts. |
| Incomplete outcome data (attrition bias) All outcomes | Unclear risk | 3752 eligibles randomised (participants who died during the trial were analysed as randomised). However: "Each outreach worker was responsible for tracking approximately 900 to 1,000 eligible patients" (which implies for 7 clinics total eligibles = 6300 to 7000). |
| Selective reporting (reporting bias) | Low risk | No selective reporting |
Ives 1994.
| Methods | Purpose: to compare offer of free influenza vaccination in capitated care groups, to fee‐for‐service care groups, to no offer Design: RCT; participants randomised Duration of study: 1 May to 31 December 1989 Interval between intervention and when outcome was measured: April 1991 to March 1992 Power computation: not provided Statistics: Chi²; logistic regression controlling for age, gender, marital status, education, insurance, and intervention group | |
| Participants | Country: USA Setting: community‐dwelling Medicare beneficiaries 65 to 79 years in rural Pennsylvania Eligible participants: (health status) 3884 enrolled in demonstration project, of whom 3606 (92.8%) completed follow‐up telephone interview; study population was then limited to those interviewed between April 1991 and March 1992 = 1989 community‐dwelling Medicare beneficiaries 65 to 79 years. Exclusions: institutionalised, non‐ambulatory, life‐threatening diagnosis of cancer in previous 5 years Age: 65 to 79 years Gender: not stated | |
| Interventions | Intervention 1: those participating in capitated payment group; after health risk appraisal interview randomly assigned to offer of no‐cost influenza immunisation Intervention 2: those participating in fee‐for‐service group; after health risk appraisal interview randomly assigned to offer of no‐cost influenza immunisation; physicians only paid if they received and submitted payment voucher from participants Control: given their health risk appraisals but not offered immunisation Received this helpful e‐mail from Dr Diane Ives: "Regarding the issues of bias, this was a community based demonstration project to see if Medicare beneficiaries would use prevention programs if offered at no cost. Everyone enrolled in Medicare Part B was potentially eligible and contacted to invite participation. Due to the nature of the programs, it was impossible to blind the providers or participants. However, subjects were randomly assigned to one of the 3 comparison groups (hospital based, physician based and control/no free services), with the exception that spouse pairs were assigned to the same group for feasibility of both using the services. The 2 references below detail the characteristics of people who came into the program based on various recruitment methods, and also describe those who did not participate. We found people who participated had more disease history and risk factors, people who were contacted but refused to participate were the healthiest and possibly refused because they felt they did not have the risk factors targeted by the interventions, and those unable to be reached had highest levels of disease based on Medicare claims data and may have been too ill to participate Ives DG, Kuller LH, Schulz R, Traven ND, Lave JR. Comparison of recruitment strategies and associated disease prevalence for health promotion in rural elderly. Preventive Medicine 1992;21:582‐591 Ives DG, Traven ND, Kuller LH, Schulz R. Selection bias and non response to health promotion in older adults. Epidemiology 1994;5:456‐461." | |
| Outcomes | Outcome measured: % vaccinated, measured by self report and by completed flu vouchers for payment to physician by Medicare Time points from the study considered in the review or measured or reported in the study: April 1991 to March 1992 % vaccinated by March 1992 (2.5 years after study had begun, 1.5 years after offer of influenza vaccine) | |
| Notes | Funding: Health Care Financing Administration | |
| Risk of bias | ||
| Bias | Authors' judgement | Support for judgement |
| Random sequence generation (selection bias) | Unclear risk | "... participants were randomly assigned" (no statement about method) |
| Allocation concealment (selection bias) | Unclear risk | No statement |
| Blinding (performance bias and detection bias) All outcomes | Unclear risk | Measured by self report, but also by completed flu vouchers for payment to physician by Medicare |
| Incomplete outcome data (attrition bias) All outcomes | Low risk | All 1989 participants enrolled were analysed. |
| Selective reporting (reporting bias) | Low risk | No selective reporting |
Karuza 1995.
| Methods | Purpose: to compare focus groups of physicians discussing adoption of influenza guideline for participants ≥ 65 years to focus groups of physicians about an unrelated topic Design: RCT, practices as the unit of randomisation Duration of study: 4 months Interval between intervention and when outcome was measured: 4 months Power computation: not performed Statistics: ANOVA for differences in uptake between study arms | |
| Participants | Country: USA Setting: HMO in Buffalo, NY Eligible participants: (health status) 13 practices in prepaid HMO in Buffalo, NY; all physicians volunteered to participate; 8 physicians dropped out due to sickness or reassignment, and 6 physicians were omitted as they did not have 5 eligible participants Age: participants were aged ≥ 65 years, not institutionalised Gender: 63.5% female | |
| Interventions | Intervention 1: physician focus group with expert presenting guideline of immunisation practices of the Advisory Committee of the Centers for Disease Control and Prevention, including discussion with facilitator, with a plan that intervention practices would develop their own methods such as reminder letters to participants or reminders on charts Intervention 2: focus group on non‐influenza topic (steroid use and GI bleeding) Control: none | |
| Outcomes | Outcome measured: % influenza vaccination Time points from the study considered in the review or measured or reported in the study: pre‐intervention base uptake measured 1 October 1990 through 31 January 1991; intervention uptake measured during vaccination season 1 October 1991 to 31 January 1992 % vaccinated by 31 January 1992 | |
| Notes | Funding: US Bureau of Health Professions, US Health Resources and Services Administration, and Agency for Health Care Policy and Research, US Public Health Service | |
| Risk of bias | ||
| Bias | Authors' judgement | Support for judgement |
| Random sequence generation (selection bias) | Unclear risk | "Thirteen group practices and their primary care physicians (mean size, 5) were assigned randomly to intervention or control arms." |
| Allocation concealment (selection bias) | Low risk | "The vaccination data were obtained through prechart and postchart reviews conducted at these sites by trained outside reviewers." |
| Blinding (performance bias and detection bias) All outcomes | Low risk | "The vaccination data were obtained through prechart and postchart reviews conducted at these sites by trained outside reviewers." |
| Incomplete outcome data (attrition bias) All outcomes | Unclear risk | "Active participants who were not seen during the influenza vaccination season were counted as not receiving the vaccine."; "... 10% of the charts were reviewed again by a different reviewer. For the key measures the inter‐judge reliability of the chart review was better than 98% agreement."; "Because of expected patient attrition (e.g. mortality, moving out of town, and changing physicians) and clerical error, an average of 11% of the charts was unavailable at the post chart review per physician." |
| Selective reporting (reporting bias) | Low risk | No selective reporting |
Kellerman 2000.
| Methods | Purpose: to compare a phone call reminder about influenza vaccination to no intervention Design: RCT; participants randomised Duration of study: 23 September to 23 October 1996 Interval between intervention and when outcome was measured: 1 month Power computation: not performed Statistics: percentages, probabilities | |
| Participants | Country: USA Setting: Smoky Hill Family Practice Center, Salina, Kansas Eligible participants: (health status): all 475 individuals aged ≥ 65 years were sent a postcard reminder, eligibles were those who did not respond; exclusions: those resident in nursing homes Age: ≥ 65 years Gender: not stated | |
| Interventions | All 475 individuals aged ≥ 65 years were sent a postcard reminding them about influenza vaccination; non‐respondents were then randomised to either: 1. intervention: 1 to 2 phone calls; or 2. control: no intervention. | |
| Outcomes | Outcome measured: % influenza vaccination Time points from the study considered in the review or measured or reported in the study: 23 September to 23 October 1996 % vaccinated by: 23 October 1996 | |
| Notes | Funding: no funding | |
| Risk of bias | ||
| Bias | Authors' judgement | Support for judgement |
| Random sequence generation (selection bias) | High risk | Alternate randomisation of alphabetised households |
| Allocation concealment (selection bias) | Unclear risk | No statement |
| Blinding (performance bias and detection bias) All outcomes | Unclear risk | No statement |
| Incomplete outcome data (attrition bias) All outcomes | Unclear risk | Vaccination uptake for the whole practice for the 2 preceding years is provided, but not for the intervention and control groups. Not stated how immunisation data were recorded or whether the practice was computerised (however, participants were all aged ≥ 65 years and thus Medicare beneficiaries, so there was an incentive to record data to obtain payment). "For the purposes of this study, only immunizations administered at the Family Practice Center were considered in assessing the study's outcome. During the telephone intervention, Family Practice Center staff recorded any patient comments about prior immunization for that season or subsequent intentions for immunization." |
| Selective reporting (reporting bias) | Low risk | No selective reporting |
Kerse 1999.
| Methods | Purpose: to compare an educational programme for GPs about social and physical activity, prescribing and vaccination practices for elderly participants with audit, to no intervention Design: RCT; general practices were unit of allocation Duration of study: November 1995 to April 1997 Interval between intervention and when outcome was measured: November 1995 to April 1997 Power computation: website stated 93 participants needed in each group to detect 20% change with α = 0.05, β = 0.8, allowing for clustering. Statistics: ITT. "We adjusted for the effect of clustered design with a cross sectional time series iterative programed least squares regression." | |
| Participants | Country: Australia Setting: 42 GPs in Melbourne Eligible participants: (health status) a number was assigned to 398 GPs in metropolitan Melbourne, then 193 with no computerised recall system were randomly selected for influenza vaccination; exclusions from the 193 were: 6 were not contactable; 25 moved or had died; 28 had partners already enrolled in trial; 25 worked < 12 hours/week; 7 were retiring; 13 had no elderly participants or participants who did not speak English; and 7 had computerised recall systems. 42 of 82 eligibles were then enrolled, and using random number table average 397 charts were reviewed per practitioner, and 10 elderly participants identified per practitioner; 267 (64%) of invited participants participated. Age: ≥ 65 years Gender: 54% female | |
| Interventions | Intervention: educational programme in 5 stages for GPs about social and physical activity, prescribing and vaccination practices for elderly participants Control: no intervention | |
| Outcomes | Outcome measured: % influenza vaccination Time points from the study considered in the review or measured or reported in the study: November 1995 to February 1996 and at 1‐year follow‐up (December 1996 to April 1997) % vaccinated by: April 1997 E‐mail from Dr Kerse indicated data on baseline influenza uptake for the year before the intervention would be supplied, but further e‐mail not received. | |
| Notes | Funding: Victoria Health Promotion Foundation; doctoral scholarship for Dr Kerse | |
| Risk of bias | ||
| Bias | Authors' judgement | Support for judgement |
| Random sequence generation (selection bias) | Low risk | "An independent research assistant at a distant site used computer randomisation to allocate general practitioners to intervention or control group and this was concealed until the interview began." |
| Allocation concealment (selection bias) | Low risk | "An independent research assistant at a distant site used computer randomization to allocate general practitioners to intervention or control group and this was concealed until the interview began." |
| Blinding (performance bias and detection bias) All outcomes | Low risk | "Interviewers evaluating outcomes were blinded to the intervention group of participants and general practitioners at all times, and participants were unaware of the group allocation of their general practitioner." |
| Incomplete outcome data (attrition bias) All outcomes | Unclear risk | In Table 1, 135 participants are listed in the intervention group (but only 120 are listed as either "yes" or "no" for influenza vaccination) and 132 in the control (but only 112 listed "yes" or "no" for influenza vaccination status). "Influenza vaccination rates increased by almost 10% in both groups" (but no numbers for these outcomes are cited) After 1 year, 34 participants could not be followed up; they were correctly counted in the groups to which they were randomised in an ITT analysis. Immunisation data ascertained by chart review (all practices were deliberately selected as being not computerised). |
| Selective reporting (reporting bias) | Low risk | No selective reporting |
Kiefe 2001.
| Methods | Purpose: to compare a multimodal improvement intervention with chart review and feedback to physicians, to the same intervention plus feedback about the performance of the top 10% of physicians Design: RCT, physicians randomly assigned; 20 records for each physician randomly assessed at baseline and a different set of 20 records at follow‐up Duration of study: baseline was performance of physicians 1 January 1994 through 30 June 1995; intervention during 1996; follow‐up through 30 June 1998. Interval between intervention and when outcome was measured: 1 January 1997 to 30 June 1998 Power computation: (e‐mail from author Dr C Kiefe: "We did perform an a priori power computation to have at least 80% power to detect an effect on at least one of the indicators. Because the study was positive, this became meaningless and we did not include this is the paper.") Statistics: t‐tests; generalised linear models with nesting of participants within physicians and controlling for baseline performance (no adjustments for patient characteristics as "each quality measure specified a group of participants who were ideal candidates for intervention") | |
| Participants | Country: USA Setting: 561 eligible physicians in Alabama Eligible participants: (health status) random sample of 97 Alabama fee‐for‐service physicians (of whom 70 completed the study; the 27 who did not complete the study practised in a different environment, or were retired or deceased) from a group of 561 Alabama family physicians, internists, and endocrinologists. The 70 physicians had 2978 diabetic participants. Exclusions were: end‐stage renal disease, in a skilled nursing home, dead at baseline. (E‐mail from author Dr C Kiefe: "Community physicians who were participating in CMS (then [Alabama Health Quality Assurance Foundation] HCFA) Ambulatory Care Quality Improvement Project (ACQIP). The analyses were at the patient level, because the outcomes were measured at the patient level. Patients were Medicare beneficiaries with diabetes.") Age: average 76 years Gender: not stated ("We have archived the original data and we could find the exact % female, but it would be fairly burdensome. I seem to remember that this older Medicare population had about 75% women") | |
| Interventions | Intervention 1: Ambulatory Care Quality Improvement Project; physicians given performance feedback on diabetes care, then quality improvement (n = 49 physicians, 14 lost to follow‐up) Intervention 2: same as intervention 1 + achievable benchmark based on performance of top 10% of physicians being assessed (n = 48 physicians, 13 lost to follow‐up) No control group | |
| Outcomes | Outcome measured: % influenza vaccination Time points from the study considered in the review or measured or reported in the study: baseline was performance of physicians 1 January 1994 through 30 June 1995; intervention during 1996; follow‐up 1 January 1997 to 30 June 1998. % vaccinated by: 20 June 1998 | |
| Notes | Funding: Agency for Healthcare Research and Quality | |
| Risk of bias | ||
| Bias | Authors' judgement | Support for judgement |
| Random sequence generation (selection bias) | Unclear risk | "... this group‐randomized trial" (E‐mail from author Dr C Kiefe: "We randomised the physicians and then reviewed the medical records of their participants to ascertain whether flu vaccine was documented.") |
| Allocation concealment (selection bias) | Unclear risk | No statement |
| Blinding (performance bias and detection bias) All outcomes | Unclear risk | No statement, but vaccination status assessed by chart review using pilot‐tested protocol |
| Incomplete outcome data (attrition bias) All outcomes | High risk | 97 physicians randomised; intervention group (48 received ACQIP + achievable benchmarks, 13 lost to follow‐up); control (49 received ACQIP, 14 lost to follow‐up). Outcomes for physicians who did not complete study not presented. (E‐mail from author Dr C Kiefe: "It was not possible to review records for physicians who no longer wished to participate or were lost to follow‐up.") |
| Selective reporting (reporting bias) | Low risk | No selective reporting |
Kim 1999.
| Methods | Purpose: to compare the effect of providing education, peer‐comparison feedback, and academic detailing to physicians with providing education to physicians, on the number of preventive services and the % of participants to which they were offered Design: RCT, physicians randomised to the 2 interventions Duration of study: 2.5 years Interval between intervention and when outcome was measured: February 1992 to February 1994 Power computation: not performed Statistics: mixed‐model ANOVA, participants nested within physicians | |
| Participants | Country: USA Setting: Kaiser Permanente Woodland Hills HMO San Fernando Valley, California Eligible participants: (health status) 48 family physicians, internists, and subspecialists providing primary care for at least 60 participants (of whom 7 dropped out, leaving 41); 9233 participants were 65 to 75 years and eligible; surveys mailed to a random sample of 3249, of whom 2237 completed baseline and follow‐up surveys, 299 then excluded as their physician left the group, sample = 1810 participants Age: average 73 years Gender: participants 50% female | |
| Interventions | Intervention 1: mailed educational materials about 7 preventive care services Intervention 2: same as intervention 1 + anonymous 15 minutes academic detailing and peer‐comparison feedback from pharmacist at beginning of study and 6 and 12 months later Control: no control group | |
| Outcomes | Outcome measured: % vaccinated; measured by chart review and patient survey (23% to 26% overestimation by participants compared to chart review) Time points from the study considered in the review or measured or reported in the study: surveys of participants January to May 1992, and December 1995 to January 1996 Vaccinated by: January 1996 | |
| Notes | Funding: Sidney Garfield Memorial Fund, S Kaiser Permanente | |
| Risk of bias | ||
| Bias | Authors' judgement | Support for judgement |
| Random sequence generation (selection bias) | Unclear risk | "... physicians were randomly assigned" (no statement about method) |
| Allocation concealment (selection bias) | Unclear risk | No statement |
| Blinding (performance bias and detection bias) All outcomes | Low risk | No statement, but chart review by 4 trained personnel using standardised forms, inter‐rater reliability = 100% |
| Incomplete outcome data (attrition bias) All outcomes | High risk | 48 physicians randomised to intervention (comprehensive education) or control (education), and 2337 participants completed both baseline and follow‐up surveys, but outcomes for the 7 physicians who dropped out and their 128 participants, and a further 299 participants because their physician left the medical group, are not presented; final outcome data are presented for only 1810 participants. |
| Selective reporting (reporting bias) | Low risk | No selective reporting |
Kouides 1998.
| Methods | Purpose: to assess the effect of financial incentives to physicians for influenza vaccinations on achieving vaccination targets Design: RCT, physician practices randomised Duration of study: September 1991 to 1 January 1992 Interval between intervention and when outcome was measured: September 1991 to 1 January 1992 Power computation: not performed Statistics: t‐tests for normally distributed continuous variables; Wilcoxon rank sum tests for non‐parametric variables; Chi², Fisher's exact test for discrete variables; multiple linear regression, controlling for number of elderly participants in the practice, type of practice, per cent immunised in baseline year 1990, routine use of phone calls, postcards or flowcharts as reminders for preventive services, and total number of visits by study personnel to the practice | |
| Participants | Country: USA Setting: Medicare Influenza Demonstration Project, Monroe County, NY Eligible participants: (health status) 54 practices. Exclusions were physicians who provided care to < 50 participants, did not participate in Medicare Influenza Demonstration Project, or had participated in a previous study. Age: ≥ 65 years Gender: not stated | |
| Interventions | Intervention: physicians received free influenza vaccine and were paid the standard USD 8.00 fee per vaccination from the Medicare Demonsration Project, and they were asked to enter cumulative weekly vaccinations on an office poster (target population = all active non‐nursing home participants with office visits 1991 or 1992). If they achieved 70% vaccination coverage, they received an additional USD 0.80 per vaccination for vaccinations given in their office, and if they achieved 85% coverage they received an additional USD 1.60 per vaccination. Control: no intervention Co‐interventions: extensive community media campaign, beneficiary letters to all Medicare recipients, extended schedule for public vaccination clinics (Kouides 1993 describes a non‐randomised study comparing patient vaccination uptake for physicians admitting to 2 hospitals, which could have had an effect on Kouides' RCT study) | |
| Outcomes | Outcome measured: % vaccinated Time points from the study considered in the review or measured or reported in the study: September 1991 to 1 January 1992 % vaccinated by: 1 January 1992 | |
| Notes | Funding: Medicare Influenza Demonstration Project, Monroe County, NY | |
| Risk of bias | ||
| Bias | Authors' judgement | Support for judgement |
| Random sequence generation (selection bias) | Unclear risk | "All physicians ... were randomised." (no statement about method) |
| Allocation concealment (selection bias) | Unclear risk | No statement |
| Blinding (performance bias and detection bias) All outcomes | Low risk | No statement, but vaccination status measured by Medicare billing |
| Incomplete outcome data (attrition bias) All outcomes | Low risk | Intention‐to‐treat with intervention group n = 21,196 and control group n = 17,608 |
| Selective reporting (reporting bias) | Low risk | No selective reporting |
Krieger 2000.
| Methods | Purpose: to assess the effect of peer‐to‐peer telephone outreach by seniors to increase vaccination uptake Design: RCT, seniors randomised Duration of study: baseline survey September 1996; intervention 3rd week of October 1996 for 6 weeks; follow‐up survey March 1997 Interval between intervention and when outcome was measured: intervention 3rd week of October 1996 for 6 weeks; follow‐up survey March 1997 Power computation: "We estimated that 1000 participants divided into 2 groups of equal size would provide at least 80% power to detect a 25% difference in the proportions of subjects receiving a recommended immunization, given control‐group immunization uptake ranging from 40%–80% and a 5 0.05. Analyses included only the 1083 participants who completed both surveys." Statistics: "The chi‐square (with Yates correction), t test, analysis of variance, and Wilcoxon matched‐pairs signed‐rank and rank‐sum procedures were used to test for differences between groups, and McNemar test was used for assessing baseline to follow‐up differences within groups." | |
| Participants | Country: USA Setting: Seattle Partners for Healthy Communities Seattle Senior Immunization Project Eligible participants: (health status) recruited from senior centre and a marketing database of seniors in 5 contiguous zip codes; 5512 invited, of whom 1246 (23%) completed baseline survey; 163 (13%) dropped out Age: average 75 years Gender: intervention 42.8% female; control 47.8% female | |
| Interventions | Intervention: mailed educational brochure, senior volunteers called 25 participants using script (4 hours training), follow‐up phone call, plus same interventions as control Control: usual senior centre and community immunisation newspaper articles, health fair, pamphlets, posters, media announcements, mailed letter from regional Medicare office to 10% of seniors, vaccine available at senior centre | |
| Outcomes | Outcome measured: % vaccinated, self report by survey (medical records were not audited because seniors obtained influenza vaccination from several locations) Time points from the study considered in the review or measured or reported in the study: baseline survey September 1996; intervention 3rd week of October 1996 for 6 weeks; follow‐up survey March 1997 % vaccinated by: March 1997 | |
| Notes | Funding: Centers for Disease Control and Prevention | |
| Risk of bias | ||
| Bias | Authors' judgement | Support for judgement |
| Random sequence generation (selection bias) | Low risk | "... systematic allocation of alternate respondents to either control or intervention" |
| Allocation concealment (selection bias) | Unclear risk | No statement |
| Blinding (performance bias and detection bias) All outcomes | Unclear risk | "Volunteers ... made a follow‐up contact to ascertain whether immunization(s) were received." |
| Incomplete outcome data (attrition bias) All outcomes | Low risk | 163 (13%) lost to follow‐up, similar proportions in intervention and control groups; "computerized registry to track the contact and immunization status of each subject" |
| Selective reporting (reporting bias) | Low risk | No selective reporting |
Kumar 1999.
| Methods | Purpose: to assess the effect of a physician‐targeted intervention to increase influenza vaccination uptake among seniors Design: RCT, physicians randomised Duration of study: 1 September to 31 December 1997 Power computation: none provided Statistics: percentage of total Medicare beneficiaries immunised | |
| Participants | Country: USA
Setting: Louisiana physician offices Participants: non‐HMO Medicare providers. 750 physicians assigned to intervention group; 1167 assigned to control group. Age: participants aged > = 65 years Gender: not reported |
|
| Interventions | Intervention group received a "... cover letter and their Medicare patient pool influenza immunization and missed opportunity indicator uptake in October 1997" and "... were encouraged to evaluate ways in which their practices might improve upon the baseline immunization status and were offered assistance in designing quality improvement projects to effect such a change. The information provided to the physicians included computed rates for all selected physicians which allowed them to compare their rates with rates of other physicians." The control group did not receive any educational or other materials. | |
| Outcomes | % influenza vaccination Although the influenza vaccination uptake increased from 1996 to 1997 in both the intervention group (4.21% versus 5.23%) and the control group (3.74% versus 4.5%), the intervention group uptake increased significantly more (P = 0.03) than the control group uptake. |
|
| Notes | Funding: US Health Care Financing Administration, Department of Health and Human Services | |
| Risk of bias | ||
| Bias | Authors' judgement | Support for judgement |
| Random sequence generation (selection bias) | Unclear risk | "Randomly selected 'intervention group' of physicians (n = 750)" and "... another group of physicians, with similar characteristics, was also randomly selected and designated as the 'control group' (n = 1,167)." (no statement about method of randomisation) |
| Allocation concealment (selection bias) | Unclear risk | No statement |
| Blinding (performance bias and detection bias) All outcomes | Low risk | No statement, but outcomes ascertained from Medicare Part B claims |
| Incomplete outcome data (attrition bias) All outcomes | Low risk | Identified all Louisiana Medicare‐certified providers; analysed 1996 and 1997 Medicare Part B claims files for influenza vaccinations |
| Selective reporting (reporting bias) | Low risk | No selective reporting |
Lemelin 2001.
| Methods | Purpose: to compare the effect of facilitators using 7 intervention strategies to encourage 8 recommended and to discourage 5 not‐recommended preventive care manoeuvres, compared to no intervention Design: RCT, practices as unit of randomisation Duration of study: 18 months Interval between intervention and when outcome was measured: 18 months after last patient visit Power computation: 40 practices needed to detect mean difference of 0.09 in preventive performance index used in this study between intervention and control groups with α = 0.05, power = 80% Statistics: "Cross tabulations using Chi² test and Fisher's exact test were used to examine categorical data and compare groups. We used Student's t‐test for independent groups for comparisons of continuous data. To test for significant differences in end points between the intervention and control groups, we analysed end points using GLE repeated‐measures ANOVA, where end points measured at baseline and follow‐up were treated as within‐subject factors ... and the intervention group was the between‐subjects factor ... Significant interaction effects were further analysed with a least‐significant‐difference post‐hoc test to evaluate mean differences. We used a GLE ANOVA to test for differences between the study groups in preventive performance index." | |
| Participants | Country: Canada Setting: health service organisations in Ontario Eligible participants: (health status): 100 health service organisations, of which 46 were recruited and 45 remained in study Age: Canadian Task Force on Preventive Care recommended age of ≥ 65 years Gender: 53.6% female | |
| Interventions | Intervention: facilitators used 7 strategies (audit and ongoing feedback, consensus building, opinion leaders and networking, academic detailing and education materials, reminder systems, patient‐mediated activities, and patient education materials) to increase uptake of 8 preventive care manoeuvres recommended by the Canadian Task Force on Preventive Care and to discourage 5 that were not recommended. Control: no intervention | |
| Outcomes | Outcome measured: % vaccinated Time points from the study considered in the review or measured or reported in the study: intervention July 1997 to December 1998 % vaccinated by: 31 December 1998 E‐mail from Dr Bill Hogg: "Unfortunately the paper does not report the age break down of the participants in the intervention and control groups (only the average age) and so the information cannot be derived from the paper. I would have to go back to trial data to produce the numbers requested. I'm on sabbatical and away from home so can't manage this." | |
| Notes | Funding: Ontario Ministry of Health | |
| Risk of bias | ||
| Bias | Authors' judgement | Support for judgement |
| Random sequence generation (selection bias) | Unclear risk | "The primary care practice (1 to 6 doctors) was the unit of randomization and the unit of analysis." (no statement of method) |
| Allocation concealment (selection bias) | Unclear risk | No statement |
| Blinding (performance bias and detection bias) All outcomes | Low risk | "The chart auditors were blinded as to the status of the practices and assessment of outcomes." |
| Incomplete outcome data (attrition bias) All outcomes | Unclear risk | For the performance of preventive manoeuvres: "The concordance between auditors was 85.4% (kappa = 0.71) at baseline and 84.4% (kappa = 0.69) at follow‐up." |
| Selective reporting (reporting bias) | Low risk | No selective reporting |
Leung 2017.
| Methods | Purpose: to compare influenza vaccination rates after 3‐minute conversation, with no‐intervention control Design: RCT Duration of study: 19 to 30 October 2015 Interval between intervention and when outcome was measured: 9 days Power computation: 524 participants required to detect 20% difference in vaccination rate with significance level of 0.05 and 80% power Statistics: Mantel‐Haenszel test |
|
| Participants | 529 participants in outpatient departments of 2 Hong Kong hospitals, October 2015 | |
| Interventions | 3‐minute face‐to‐face scripted presentation (influenza prevalence, transmission, symptoms, and complications; efficacy and adverse effects of vaccine), then 2 minutes for questions; no‐intervention control | |
| Outcomes | Influenza vaccination rate 9 days after intervention group received the intervention | |
| Notes | The influenza vaccination rate "in past 2 years" was 130 (49%) and 129 (49%) in control group, i.e. much higher than current outcome in intervention (94 vaccinated) and control (67 vaccinated). Funding: School of Public Health, Li Ka Shing Faculty of Medicine, University of Hong Kong |
|
| Risk of bias | ||
| Bias | Authors' judgement | Support for judgement |
| Random sequence generation (selection bias) | Low risk | Sealed envelope (www.sealedenvelope.com); investigators called a contact independent of research to obtain allocation for each individual |
| Allocation concealment (selection bias) | Unclear risk | Not stated |
| Blinding (performance bias and detection bias) All outcomes | High risk | States that study was unblinded; the investigators presented the intervention to the participants |
| Incomplete outcome data (attrition bias) All outcomes | Low risk | 7276 eligibles, 529 randomised, vaccination report retrieved for 529, intention‐to‐treat |
| Selective reporting (reporting bias) | Low risk | No selective reporting |
Lukasik 1987.
| Methods | Purpose: to compare phone invitations to receive influenza vaccination to a statement of vaccine availability when participants "dropped in" to the clinic Design: RCT Duration of study: mid‐September to December 1985 Interval between intervention and when outcome was measured: 0 to 3.5 months Power computation: not performed Statistics: not stated, appears to be comparison of percentages | |
| Participants | Country: Canada Setting: University Family Medicine clinic in London, Ontario Eligible participants: (health status): participants aged ≥ 65 years Age: ≥ 65 years, average not stated Gender: not stated | |
| Interventions | Intervention 1: phone call to participants to inform them that influenza vaccine was available and that they could receive it during a regular visit or a vaccine clinic Intervention 2: invitation to receive influenza vaccine during "drop‐in" visit to clinic Control: historical data from 1983 and 1984 (not used in this review as they are historical controls with no information about secular trends) | |
| Outcomes | Outcome measured: % vaccinated Time points from the study considered in the review or measured or reported in the study: mid‐September to December 1985 (date in December not stated) % vaccinated by: December 1985 (date not stated) | |
| Notes | Funding: no funding stated | |
| Risk of bias | ||
| Bias | Authors' judgement | Support for judgement |
| Random sequence generation (selection bias) | High risk | "After a random start participants were alternately assigned to each group, though related participants and those living in a single household were kept in the same group." |
| Allocation concealment (selection bias) | Unclear risk | No statement |
| Blinding (performance bias and detection bias) All outcomes | High risk | "A brightly coloured sticker was applied to the charts of the entire study population as a reminder to the health‐care team that the study was under way and that they were expected to promote the flu vaccine."; "The patients would be told, whether by telephone or in the office, that the vaccine was available, and that they would be given a shot if they wished." |
| Incomplete outcome data (attrition bias) All outcomes | Low risk | "The analysis was done with participants in their originally assigned groups ... an intention to treat analysis." Vaccination ascertained by chart review by research collaborators, outcomes for all 243 participants were tracked. |
| Selective reporting (reporting bias) | Low risk | No selective reporting |
MacIntyre 2003.
| Methods | Purpose: for hospitalised participants aged ≥ 65 years, to compare an alert system for hospital staff to vaccinate them against influenza and a reminder letter sent to their GP on the day of their discharge Design: RCT, individuals randomised Duration of study: for participants admitted May to September 1998 Interval between intervention and when outcome was measured: day of discharge (arm A) or 1 month and 3 months after discharge (arm B) Power computation: 100 required for 10% difference in vaccination with 95% confidence and 80% power Statistics: odds ratios | |
| Participants | Country: Australia Setting: Royal Melbourne Hospital Eligible participants: (health status): 606 participants aged ≥ 65 years admitted to a Melbourne hospital, of whom 238 already vaccinated, 35 vaccination history not verified, 88 unable to obtain consent, and 113 refused, leaving 131 consented Age: 74 years Gender: 56% female | |
| Interventions | Intervention 1: reminder in chart and face‐to‐face reminder to nursing and medical staff Intervention 2: reminder to GP on day of discharge Control: no control group | |
| Outcomes | Outcome measured: % vaccinated Time points from the study considered in the review or measured or reported in the study: from admission (May to September 1998) up to day of discharge for hospital arm and up to 3 months after discharge for GP arm % vaccinated by day of discharge for hospital arm and 3 months after discharge for GP arm | |
| Notes | Funding: Department of Human Services, Victoria | |
| Risk of bias | ||
| Bias | Authors' judgement | Support for judgement |
| Random sequence generation (selection bias) | Low risk | "... research nurse picked a sealed envelope from a randomization box" |
| Allocation concealment (selection bias) | Low risk | "... research nurse picked a sealed envelope from a randomization box" (so likely researchers not aware of allocation) |
| Blinding (performance bias and detection bias) All outcomes | Unclear risk | No statement |
| Incomplete outcome data (attrition bias) All outcomes | Low risk | 244 eligibles, 131 consented; all those who consented followed through to randomisation and receipt of vaccine. Vaccination for those vaccinated in hospital arm ascertained by discharge records, and for those in GP arm by phone call then letter to GP. |
| Selective reporting (reporting bias) | Low risk | No selective reporting |
Maglione 2002a.
| Methods | Purpose: to report the findings of four unpublished studies of RCTs to increase vaccination rates in Health Care Quality Improvement Projects (HCQIP). For the purposes of this Cochrane review we have labelled them Maglione 2002a (comparison of a letter and brochure to no intervention in Minnesota); Maglione 2002b (four groups: letter; postcard; letter plus postcard; no intervention in New Jersey; Maglione 2002c (comparison of a postcard compared to no intervention in Utah‐Nevada), and Maglione 2002d (comparison of a letter followed by a separate mailing of a postcard to no intervention in Washington state). [N.B.: 2 published reports of the HCQIP database in Wyoming and Montana are reported separately in this Cochrane review as (CDC 1995a (Wyoming); CDC 1995b (Montana). Design: RCT; Peer Review Organizations in US states are required to conduct quality improvement projects and report results as part of the Health Care Quality Improvement Project (HCQIP). Maglione 2002a searched for unpublished reports about Minnesota, Utah‐Nevada, New Jersey, and Washington state. Maglione and co‐authors independently abstracted the number and characteristics of participants and the setting, location and target of intervention. 2 authors independently abstracted data, and resolved discrepancies by consensus. Duration of study: not stated Interval between intervention and when outcome was measured: not stated. All 4 unpublished RCTs were reported as being performed in 1996. Power computation: not performed Statistics: percentages |
|
| Participants | Total number: Minnesota (letter plus brochure 2924, no intervention 3343); Utah‐Nevada (postcard 25,000, no intervention 50,437); Washington state (letter plus postcard 16,082, no intervention 16,057); New Jersey (letter 16,000, postcard 16,001, letter plus postcard 16,000, no intervention 16,001) Setting: Minnesota, Utah‐Nevada, Washington state, New Jersey, all Medicare Part B beneficiaries Diagnostic criteria: % receiving influenza vaccination, validated by HCFA billing claims Gender: not stated Age: ≥ 65 years Country: USA Comorbidity not stated. Sociodemographics not stated. Ethnicity not stated. Date of studies 1996 |
|
| Interventions | Minnesota: Intervention: letter and brochure; control (no intervention) New Jersey: Intervention 1: letter; intervention 2: postcard; intervention 3: letter and postcard; control (no intervention) Utah‐Nevada: intervention: postcard; control (no intervention) Washington State: Intervention: letter and later mailing of a postcard; control (no intervention) Integrity of intervention: Minnesota: letter and brochure sent to statewide sample of 5,000 elderly Medicare beneficiaries prior to 1995 influenza season. Only 2924 could be matched to the Medicare claims file and of these 50.3% received influenza vaccination. New Jersey: randomly selected beneficiaries at risk of serious risk of influenza complications were randomised to interventions or control. No statement on rates of reception of interventions. Utah‐Nevada: 5000 beneficiaries who had been vaccinated and 25,000 who had not in 1995 were randomised to receive a postcard reminder (estimated 82% received the postcard) or no intervention. Washington State: beneficiaries who did not receive influenza vaccination in 1995 were randomised to the two interventions or control. No statement about rates of reception of the interventions. |
|
| Outcomes | Outcome measured: % vaccinated as measured by HCFA billing claims Time points from the study considered in the review or measured or reported in the study: 1996 % vaccinated during 1996 | |
| Notes | Funding: Center for Medicare and Medicaid Services, US Department of Health and Human Services | |
| Risk of bias | ||
| Bias | Authors' judgement | Support for judgement |
| Random sequence generation (selection bias) | Unclear risk | Described only as "RCT" |
| Allocation concealment (selection bias) | Unclear risk | No statement |
| Blinding (performance bias and detection bias) All outcomes | Unclear risk | No statement |
| Incomplete outcome data (attrition bias) All outcomes | Low risk | 96% of those aged ≥ 65 years are covered by Medicare Part B, which processes all billing claims for influenza vaccination. |
| Selective reporting (reporting bias) | Low risk | No selective reporting |
Maglione 2002b.
| Methods | Data are reported for New Jersey. For details see Maglione 2002a | |
| Participants | See Maglione 2002a | |
| Interventions | See Maglione 2002a | |
| Outcomes | See Maglione 2002a | |
| Notes | See Maglione 2002a | |
| Risk of bias | ||
| Bias | Authors' judgement | Support for judgement |
| Random sequence generation (selection bias) | Unclear risk | Described only as "RCT" |
| Allocation concealment (selection bias) | Unclear risk | No statement |
| Blinding (performance bias and detection bias) All outcomes | Unclear risk | No statement |
| Incomplete outcome data (attrition bias) All outcomes | Low risk | 96% of those aged ≥ 65 years are covered by Medicare Part B, which processes all billing claims for influenza vaccination. |
| Selective reporting (reporting bias) | Low risk | No selective reporting |
Maglione 2002c.
| Methods | Data are reported for Utah‐Nevada. For details see Maglione 2002a | |
| Participants | See Maglione 2002a | |
| Interventions | See Maglione 2002a | |
| Outcomes | See Maglione 2002a | |
| Notes | See Maglione 2002a | |
| Risk of bias | ||
| Bias | Authors' judgement | Support for judgement |
| Random sequence generation (selection bias) | Unclear risk | Described only as "RCT" |
| Allocation concealment (selection bias) | Unclear risk | No statement |
| Blinding (performance bias and detection bias) All outcomes | Unclear risk | No statement |
| Incomplete outcome data (attrition bias) All outcomes | Low risk | 96% of those aged ≥ 65 years are covered by Medicare Part B, which processes all billing claims for influenza vaccination. |
| Selective reporting (reporting bias) | Low risk | No selective reporting |
Maglione 2002d.
| Methods | Data are reported for Washington state. For details see Maglione 2002a | |
| Participants | See Maglione 2002a | |
| Interventions | See Maglione 2002a | |
| Outcomes | See Maglione 2002a | |
| Notes | See Maglione 2002a | |
| Risk of bias | ||
| Bias | Authors' judgement | Support for judgement |
| Random sequence generation (selection bias) | Unclear risk | Described only as "RCT" |
| Allocation concealment (selection bias) | Unclear risk | No statement |
| Blinding (performance bias and detection bias) All outcomes | Unclear risk | No statement |
| Incomplete outcome data (attrition bias) All outcomes | Low risk | 96% of those aged ≥ 65 years are covered by Medicare Part B, which processes all billing claims for influenza vaccination. |
| Selective reporting (reporting bias) | Low risk | No selective reporting |
Marrero 2006.
| Methods | Purpose: to compare an educational session about influenza and vaccination clinic in a pharmacy to "usual care" (no intervention) Design: RCT Duration of study: 12 months Interval between intervention and when outcome was measured: 12 months Power computation: not performed Statistics: percentages, ANOVA | |
| Participants | Country: Puerto Rico Setting: pharmacy in San Lorenzo Eligible participants: (health status): pharmacy customers ≥ 65 years who visited pharmacy June or July 2000 Age: ≥ 65 years Gender: 62% female | |
| Interventions | Intervention: offer of educational session about influenza and to attend vaccination clinic Control: no intervention | |
| Outcomes | Outcome measured: % influenza vaccination Time points from the study considered in the review or measured or reported in the study: 12 months % vaccinated by: 12 months from intervention | |
| Notes | Funding: not stated | |
| Risk of bias | ||
| Bias | Authors' judgement | Support for judgement |
| Random sequence generation (selection bias) | Unclear risk | "randomised allocation to intervention or control" |
| Allocation concealment (selection bias) | Unclear risk | No statement |
| Blinding (performance bias and detection bias) All outcomes | Unclear risk | No statement |
| Incomplete outcome data (attrition bias) All outcomes | Unclear risk | 46/50 from intervention and 37/50 from control group received vaccination at 3 months; clinical results from 42/50 from intervention and 31/50 from control group assessed after 12 months (no differential attrition analysis). |
| Selective reporting (reporting bias) | Low risk | No selective reporting |
McCaul 2002.
| Methods | Purpose: to compare letter informing participants of importance of flu shot to reminder letter stating date and time of clinic Design: RCT, clustered by counties Duration of study: not reported Interval between intervention and when outcome was measured: not stated Power computation: not performed Statistics: t‐tests | |
| Participants | Country: USA Setting: 29 North Dakota counties Eligible participants: (health status): 6730 male and 9107 female Medicare recipients who had not submitted Medicare reimbursement requests for flu shots the previous year. Age: ≥ 65 years Gender: 57.5% female | |
| Interventions | Intervention 1: card reminding recipients of advantages of flu shots Intervention 2: letter reminding recipients of advantages of flu shots and stating time, date, and place of flu shot clinics Control: no intervention | |
| Outcomes | Outcome measured: % vaccinated Time points from the study considered in the review or measured or reported in the study: not stated % vaccinated by: not stated |
|
| Notes | Funding: US Health Care Financing Administration | |
| Risk of bias | ||
| Bias | Authors' judgement | Support for judgement |
| Random sequence generation (selection bias) | Unclear risk | "we randomly assigned counties to either the reminder letter (n = 17), action‐letter (n = 12), or no‐letter (n = 20) conditions. Within the reminder‐letter counties, we then randomly assigned individuals within each county to either the reminder‐only, reminder plus positive frame, or reminder plus negative frame conditions. Within the action‐letter counties, all individuals received the same action letter" (no statement about method of randomisation) |
| Allocation concealment (selection bias) | Unclear risk | No statement |
| Blinding (performance bias and detection bias) All outcomes | Low risk | No statement about blinding, but assessment based on Medicare reimbursement claims |
| Incomplete outcome data (attrition bias) All outcomes | Low risk | E‐mail from author states "... subject loss was 6%, most of which was letters being returned." |
| Selective reporting (reporting bias) | Low risk | No selective reporting |
McDowell 1986.
| Methods | Purpose: to compare reminders to patients to receive influenza vaccination by telephone reminder by their family physician, telephone reminder by nurse, or by letter Design: cluster‐RCT, participants randomised by family Duration of study: 23 October to 31 December 1984 Interval between intervention and when outcome was measured: 23 October to 31 December 1984 Power computation: sample sizes offered power to detect 10% to 15% difference in proportions (alpha not stated) Statistics: Chi² | |
| Participants | Country: Canada Setting: Ottawa Civic Hospital Family Practice Clinics Eligible participants: (health status): 13,345 eligible participants, of whom 1420 aged ≥ 65 years; 2 physicians refused to participate, leaving 939 participants; 113 patients had been vaccinated before the trial and were excluded, leaving 201 available for a personal reminder to patients by their family physician, 208 for a phone call by nurse, 239 for a letter, and 215 in a control group Age: ≥ 65 years Gender: not stated Intervention group 1 (physician reminder): 1122 families, 1471 people Intervention group 2 (telephone reminder): 1104 families, 1468 people Intervention group 3 (letter reminder): 1168 families, 1541 people Control group: 1056 families, 1403 eligible participants Exclusions: not clear | |
| Interventions | Intervention 1 (reminder to patients by their family physician): a computer‐generated reminder was included on the routinely printed encounter form before any visit to the office to remind the physician of outstanding preventive procedures their patients needed. Intervention 2 (telephone reminder): the practice nurse attempted to contact the family, making a maximum of 5 calls during working hours, and completed an action form for each listed patient. Once contact was made, the nurse advised the patient about the indicated procedures and then attempted to arrange for them to be performed. The person answering the telephone was asked to relay the message to other family members. Intervention 3 (letter reminder): computer‐generated letter, signed by their physician and nurse, describing the procedures that were overdue for each member of the family and the importance of having them performed. After 21 days a second reminder was sent out to non‐respondents. Control: no action was taken to remind the physicians or the participants that a procedure was overdue. Non‐randomised control group: the participants of 2 doctors who refused were not randomised and were treated as a second control group to assess the effects of the increased preventive activity in the practices. In the 1990 article in Family Medicine, McDowell provided baseline vaccination data for 1984, the year before the 2‐year intervention in 1985 and 1986, and grouped the letter, nurse, and physician reminders into 1 treatment group compared to a control. We have followed this reporting of the results in the final publication in their series. | |
| Outcomes | Outcome measured: % vaccinated by 31 December 1984, recorded in clinic computer Time points from the study considered in the review or measured or reported in the study: intervention 23 October 1984 to 31 December 1984, vaccine receipt assessed until 31 December 1984 % vaccinated by: 31 December 1984 Intervention 1 (physician reminder): 766/1471 people visited the practice in the study year; 22.9% of group were vaccinated, but the denominator for this proportion is not stated (i.e. cannot tell if it was 766 people versus 1471 people versus 1122 families). Intervention 2 (telephone reminder): 1104 of the 1468 families assigned to telephone reminder required a reminder for 1 or more interventions; 684 families were actually contacted. 37% of group were vaccinated, but denominator for proportion not stated (i.e. cannot tell if it was 1104 families versus 684 families versus 1468 people that constituted the 1104 families versus unknown number of people in the 684 families actually reached). Intervention 3 (letter reminder): 164 of 1442 people sent letters had letters returned as undeliverable. 35.2% were vaccinated, but cannot tell which denominator was used (i.e. 1442 versus 978 people). Control: 9.8% "of study group" were vaccinated. Not stated if the denominator is families or individual people | |
| Notes | Funding: Department of National Health and Welfare, Ontario Ministry of Health, Career Health Scientist Award to Dr McDowell; follow‐up in 1985 showed no difference between intervention and control groups (McDowell 1990). | |
| Risk of bias | ||
| Bias | Authors' judgement | Support for judgement |
| Random sequence generation (selection bias) | Unclear risk | "... participants were randomly allocated by family" |
| Allocation concealment (selection bias) | Unclear risk | No statement |
| Blinding (performance bias and detection bias) All outcomes | Unclear risk | No statement about blinding, but vaccinations recorded in clinic computer |
| Incomplete outcome data (attrition bias) All outcomes | High risk | In the group in which the family physician invited the patient to be vaccinated this intervention was delivered to 201/218 (92%). In the letter group, 239 letters were sent and only 2 returned. In the phone group the nurses were able to contact 177/208 (85%);
Intervention 1: 766/1471 people visited the practice in the study year; 22.9% of group vaccinated, but the denominator for this proportion is not stated (cannot tell if it was 766 people versus 1471 people versus 1122 families).
Intervention 2: 1104 of the 1468 families assigned to telephone reminder required a reminder for 1 or more interventions, and 684 families were actually contacted; 37% of group were vaccinated, but denominator for proportion not stated (cannot tell if it was 1104 families versus 684 families versus 1468 people that constituted the 1104 families versus unknown number of people in the 684 families actually reached).
Intervention 3: 164 of 1442 people sent letters had letters returned as undeliverable; 35.2% were vaccinated, but cannot tell which denominator was used (1442 versus 978 people).
Control: 9.8% "of study group" were vaccinated. Not stated if the denominator is families or individual people "8 weeks after the study ended we called random samples of patients from each study group who had apparently not been vaccinated to estimate the extent of underreporting." |
| Selective reporting (reporting bias) | Low risk | No selective reporting |
Minor 2010.
| Methods | Purpose: increase influenza vaccination uptake by phone versus mail reminders Design: RCT of attendees at hypertension clinic to phone, mail, or control Duration of study: mid‐November to "the following spring" Interval between intervention and when outcome was measured: intervention began after mid‐November, follow‐up "in the following Spring." Power computation: not performed Statistics: %s; ORs and 95% CIs |
|
| Participants | Country: USA Setting: University of Mississippi Hypertension Clinic Eligible participants: (health status): 257 aged > 65 years Age: 257 > 65 years Gender: 62% female for whole sample aged < 50 years to > 65 years |
|
| Interventions | Intervention 1: letter plus CDC Influenza Vaccine Information Statement Intervention 2: phone call with same information Control: standard clinic practice Co‐interventions: none |
|
| Outcomes | Outcome measured: % influenza vaccination Time points reported in the study: "Mid November"; "following Spring" |
|
| Notes | Funding: none stated | |
| Risk of bias | ||
| Bias | Authors' judgement | Support for judgement |
| Random sequence generation (selection bias) | Unclear risk | "... randomly assigned" |
| Allocation concealment (selection bias) | Unclear risk | No statement |
| Blinding (performance bias and detection bias) All outcomes | Unclear risk | No statement |
| Incomplete outcome data (attrition bias) All outcomes | Unclear risk | 1712 eligibles had clinic visit in preceding 15 months; 341 had received influenza vaccination, 487 not contactable after 5 attempts; sample = 884, of whom 257 aged > 65 years. |
| Selective reporting (reporting bias) | Low risk | No selective reporting |
Moran 1992.
| Methods | Purpose: to compare 1 and 2 reminder letters offering free influenza vaccine to no intervention Design: RCT, participants randomised Duration of study: mid‐October Interval between intervention and when outcome was measured: not reported Power computation: "Sample size was sufficient to detect a 20% change in immunization (40% to 60%) with 80% power at ? = 0.05." Statistics: percentages | |
| Participants | Country: USA Setting: urban community health centre (location not stated, but first author was located in Winston‐Salem, NC) Eligible participants: (health status): "High‐risk participants seen at an urban community health center." (eligible number not stated) Age: ≥ 65 years Gender: 61% female | |
| Interventions | Intervention 1: 1 letter offering free influenza vaccine Intervention 2: 2 letters offering free influenza vaccine Control: no intervention | |
| Outcomes | Outcome measured: % influenza vaccination Time points from the study considered in the review or measured or reported in the study: first letter sent mid‐October 1990, second letter (to intervention group receiving 2 letters) sent 1 month later. Vaccinated by: not stated | |
| Notes | Funding: US National Research Service Award, National Institute on Aging | |
| Risk of bias | ||
| Bias | Authors' judgement | Support for judgement |
| Random sequence generation (selection bias) | Unclear risk | "A randomised, single‐blind, controlled trial ..." |
| Allocation concealment (selection bias) | Unclear risk | No statement |
| Blinding (performance bias and detection bias) All outcomes | Unclear risk | "single‐blind", but does not state if it was participants or researchers blinded; data entered on computer clinical tracking program |
| Incomplete outcome data (attrition bias) All outcomes | Low risk | Participants randomised to intervention group 1 (n = 135) and intervention group 2 (n = 138) and 136 to control, of whom 66, 68, and 68 were aged ≥ 65 years; vaccination status of all participants reported; immunisation reported in clinic computers. |
| Selective reporting (reporting bias) | Low risk | No selective reporting |
Moran 1995.
| Methods | Purpose: to compare the effect of a mailed educational brochure on influenza vaccination uptake compared to no intervention Design: RCT, participants as unit of randomisation Duration of study: 4 months Interval between intervention and when outcome was measured: "The educational brochures were mailed to the intervention group when the influenza vaccine became available at the beginning of October." (year not stated) Power computation: 900 participants required to detect 20% difference if baseline rate 20%, 90% power, α = 0.05. Statistics: not stated (probabilities computed) | |
| Participants | Country: USA Setting: general internal medicine and gerontology service, Wake Forest University, North Carolina Eligible participants: (health status): 1583, then residents of long‐term care facilities excluded, leaving 1251, of whom 900 were randomised to treatment and control groups Age: ≥ 65 years, average 76 years Gender: 65.4% female | |
| Interventions | Intervention: mailed brochure encouraging influenza vaccination Control: no intervention | |
| Outcomes | Outcome measured: % vaccinated Time points from the study considered in the review or measured or reported in the study: October to following January (year not stated) % vaccinated by: January following intervention in October | |
| Notes | Funding: National Institute on Aging | |
| Risk of bias | ||
| Bias | Authors' judgement | Support for judgement |
| Random sequence generation (selection bias) | Unclear risk | "... two random samples of 450 were selected for the intervention and control groups." |
| Allocation concealment (selection bias) | Unclear risk | No statement |
| Blinding (performance bias and detection bias) All outcomes | Unclear risk | No statement, vaccination status entered in computer clinical tracking program |
| Incomplete outcome data (attrition bias) All outcomes | Unclear risk | Clinic immunisation and financial logs showed 80 participants in intervention and 71 in control group received influenza vaccination; 666/900 responded to the postcard survey, and a total of 218 in intervention and 213 in control group said they had been vaccinated in clinic and elsewhere. |
| Selective reporting (reporting bias) | Low risk | No selective reporting |
Moran 1996.
| Methods | Purpose: "To determine whether an educational brochure or a lottery‐type incentive increases influenza immunization rates."
Design: RCT, participants randomised Duration of study: 3 months Power computation: not reported Statistics: Chi², Wilcoxon, logistic regression, odds ratios with CI, percentage participants receiving influenza vaccination in 4 groups |
|
| Participants | Country: USA Setting: urban community health centre Participants: "All high‐risk ambulatory patients seen at the community health centre within the preceding 18 months" Age: > 18 to 99 years of age, mean age 66 (n = 797) Gender: male and female |
|
| Interventions | Participants were randomly assigned to 1 of 4 groups: control (n = 202), mailed educational brochure (n = 198), mailed lottery incentive wherein participants who obtained an influenza vaccination would be eligible to win 1 of 3 grocery gift certificates (n = 198), and a mailed combined educational brochure and lottery incentive (n = 199). | |
| Outcomes | Odds ratio of participants in the 4 groups obtaining an influenza vaccination. Odds ratio for participants in the brochure group obtaining influenza immunisation when compared with the control (OR 2.29, 95% CI 1.45 to 3.61), odds ratio for incentive group compared with control (OR 1.68, 95% CI 1.05 to 2.68). "Immunization for the group mailed both interventions was not significantly different from control (OR = 1.41, 95% confidence interval CI 0.88‐2.27). For the subset of individuals for whom prior immunization status was known, the impact of the educational brochure was even more significant (OR = 4.21, 95% CI 2.48 to 7.14), but the groups mailed incentive or both interventions were not significantly different." For those aged 65+ years, the study reports on the percentage in each group that received vaccination: 25% control, 41% brochure, 30% incentive, 24% brochure and incentive. | |
| Notes | National Research Service Award, US National Institute on Aging | |
| Risk of bias | ||
| Bias | Authors' judgement | Support for judgement |
| Random sequence generation (selection bias) | Unclear risk | "High‐risk patients were randomly allocated to one of four groups." (no statement about method of randomisation) |
| Allocation concealment (selection bias) | Unclear risk | No statement |
| Blinding (performance bias and detection bias) All outcomes | Unclear risk | No statement |
| Incomplete outcome data (attrition bias) All outcomes | Low risk | "... all high‐risk patients (n = 797) seen in the preceding 18 months" were reported in the final outcome (Table II) |
| Selective reporting (reporting bias) | Low risk | No selective reporting |
Morrissey 1995.
| Methods | Purpose: to evaluate the effects of a free package of preventive healthcare services, including influenza vaccinations, on the health outcomes of seniors Design: RCT, participants randomised within practices Duration: 2 years Power computation: all eligible participants at the practices were evaluated for study inclusion. Statistics: Chi², analysis of covariance and regression analysis |
|
| Participants | Country: USA Setting: 10 primary care practices in 13 locations in central North Carolina Participants: 1914 participants (954 intervention, 960 control) Age: >= 65 years Gender: 61.1% women |
|
| Interventions | "The health promotion service package contained a set of procedures and nursing interventions that address important risk factors and premature mortality, institutionalization, and increased disability for older people. Health promotion sessions, in this demonstration were conducted in physician offices using an individual counseling strategy that involved the nurse/physician assistant and patient in mutual planning ..." Practices were sent monthly reminders by research team to schedule intervention participants for preventive care and health promotion care services. Nurses were provided with training in administering the services. The control group received the usual preventive services offered by their practice at the usual costs. | |
| Outcomes | Medical chart audits were performed on 3 heterogeneous practices (231 intervention participants and 224 controls) to determine whether or not there was an increase in the number of preventive care procedures performed in the intervention group. The percentage of participants who received the Fluvax vaccine during the 1st year of the study increased in the intervention group as compared to the control after randomisation (72% versus 52%, P < 0.001). | |
| Notes | US Health Care Financing Administration | |
| Risk of bias | ||
| Bias | Authors' judgement | Support for judgement |
| Random sequence generation (selection bias) | Unclear risk | "... randomised by strata into intervention or control" (no statement about method) |
| Allocation concealment (selection bias) | Unclear risk | No statement |
| Blinding (performance bias and detection bias) All outcomes | Low risk | "Although contamination of the control group is sometimes a concern with such a design, it was not an issue here for two reasons: first, the financial intervention involved full Medicare reimbursement to physicians for preventive‐care and health promotion packages only for those patients randomised to the intervention group; and second, the office system intervention was in effect only for patients receiving the intervention group. The control group was not identified to the practice, there was no prompting, no form, and no special preventive visit for the control‐group patients"; "Patients were informed of their random assignment only after they came into the practice for the interview" |
| Incomplete outcome data (attrition bias) All outcomes | Unclear risk | Of the 1914 participants recruited: "... it was not feasible to conduct chart reviews in every practice, so we chose three diverse groups: a three‐physician family practice ... a ten‐physician community health center, a six physician suburban internal medicine practice ..."; "Of 458 patients eligible for chart audit, charts were located and reviewed for 455 (231 intervention, 224 control)" |
| Selective reporting (reporting bias) | Low risk | No selective reporting |
Mullooly 1987.
| Methods | Purpose: to compare personalised letter with no intervention Design: RCT, individuals randomised Duration of study: interval between intervention and when outcome was measured: "Kaiser Permanente ... operates seasonal influenza clinics." Power computation: not performed Statistics: percentages | |
| Participants | Country: USA Setting: Kaiser Permanente Northeast Region HMO in Portland, Oregon/Vancouver and Washington metropolitan area Eligible participants: (health status): ≥ 65 years, discharged alive from hospital October 1983 to September 1984 with diagnoses of cardiovascular, pulmonary, renal, metabolic/nutritional, neurologic, or malignant diseases Age: ≥ 65 years Gender: intervention 48.1% female; control 52.7% female | |
| Interventions | Intervention 1: personalised recommendation to obtain influenza vaccination, and information about where and when to obtain vaccination Control: no intervention | |
| Outcomes | Outcome measured: % influenza vaccination Time points from the study considered in the review or measured or reported in the study: not stated: "Kaiser Permanente ... operates seasonal influenza clinics." % vaccinated by: not stated | |
| Notes | Funding: not stated; we e‐mailed the author for influenza vaccination uptake in the year before the intervention but received no reply | |
| Risk of bias | ||
| Bias | Authors' judgement | Support for judgement |
| Random sequence generation (selection bias) | Low risk | "The study group population was randomised into intervention and control groups based on a pseudo random digit of the individual membership ID number." |
| Allocation concealment (selection bias) | Unclear risk | No statement |
| Blinding (performance bias and detection bias) All outcomes | Unclear risk | No statement: "Medical records were retrospectively reviewed at the end of the study period to ascertain whether subjects had received influenza vaccine" |
| Incomplete outcome data (attrition bias) All outcomes | Unclear risk | "Medical records were retrospectively reviewed at the end of the study period to ascertain whether subjects had received influenza vaccine ..." |
| Selective reporting (reporting bias) | Low risk | No selective reporting |
Nexøe 1997.
| Methods | Purpose: to compare offer of free influenza vaccination to postal reminder with fee for vaccination paid by the participants Design: RCT Duration of study: 25 September to 15 December 1995 Interval between intervention and when outcome was measured: not clear Power computation: no information provided Statistics: Chi² statistic for proportions, 2‐way analysis of variance at alpha = 0.05. No adjustments were made for within‐practice clustering or for prior‐year influenza vaccination status. | |
| Participants | Country: Denmark Setting: 13 solo general practices in the counties of Funene and Vejle, 25 September to 15 December 1995. Eligible practices had not sent mailed reminders to participants in previous years and were required to have at least 45 elderly participants aged 65 years or older with a medical indication for influenza vaccination. Eligible participants (health status): 585 people. These included 45 participants from the practice of each GP who were aged over 65 years and with a medical indication for influenza vaccination (treated for chronic pulmonary or cardiovascular disorder; acquired or congenital immunodeficiency, other chronic disease such that the doctor perceived the person to be at increased risk for influenza‐related complications or nursing home resident). Age: all aged over 65 years, no age distribution provided Sex: no data presented | |
| Interventions | Intervention 1: free influenza vaccination (15 from each practice, i.e. 1/3 of participants from each practice) Intervention 2: invitation for influenza vaccination but requirement to pay the usual GP fee (USD 40 to 60) (15 from each practice, i.e. 1/3 of participants from each practice) Control: no invitation, vaccinated only at their own request (15 from each practice, i.e. 1/3 of participants from each practice) | |
| Outcomes | Outcome measured: % vaccinated within each group as "registered" Time points from the study considered in the review or measured or reported in the study: registration occurred from 25 September to 15 December 1995. % vaccinated by 15 December 1995 | |
| Notes | Participants were randomised within each practice. Explicit definition of "registered" not provided; the context of the phrase suggests that this was by chart audit or records review. In the control group 83% of the participants had been vaccinated in the previous year. Overall, 25% of all participants had been vaccinated in the prior year (only aggregated data across all practices provided). Authors do not provide practice‐specific denominators, only practice‐specific numerators for outcomes. Funding: Danish Research Foundation for General Practice Fees for vaccination and vaccine were paid for by the State Serum Institute. | |
| Risk of bias | ||
| Bias | Authors' judgement | Support for judgement |
| Random sequence generation (selection bias) | Unclear risk | No information provided. |
| Allocation concealment (selection bias) | Unclear risk | Insufficient information provided. |
| Blinding (performance bias and detection bias) All outcomes | Unclear risk | Randomisation was blinded for the GPs. However, GPs were paid the equivalent of USD 36 for each patient vaccinated without patient fee. |
| Incomplete outcome data (attrition bias) All outcomes | Unclear risk | Attrition of participants: no explicit statement as to follow‐up Incomplete data points for participants No analysis if differential attrition could affect outcomes Given that data were obtained from the GP records, they would appear to be complete, although there is no explicit statement of records audit being done. Completeness of ascertainment would be best for the free‐vaccination group, as it is stated that "the GP’s were paid for each patient vaccinated without patient fee." |
| Selective reporting (reporting bias) | Low risk | No selective reporting |
Nuttall 2003.
| Methods | Purpose: test hypothesis that an invitation letter to attend GP for influenza immunisation plus home visit to discuss influenza vaccination is more likely to increase influenza vaccine uptake than an invitation letter to attend GP for immunisation alone, or invitation letter plus pamphlet promoting influenza immunisation Design: RCT: eligible participants were stratified by age (< 72 years, 72 years or older to ensure equal numbers of each age group within each intervention group). Participants within each age group were randomly allocated into 3 groups. A total of 30 people were allocated to each intervention. Interval between intervention and when outcome was measured: not explicitly stated except for the statements: "the intervention was to be completed the start of the influenza immunisation programme at the GP surgery," and that health records were audited "following completion of the influenza immunization program." Power computation: not done Statistics: simple comparison of proportions immunised across groups (ITT) | |
| Participants | Country: UK Setting: a single GP practice in East Lancashire Eligible participants (health status): 90 participants aged 65 to 90 years registered to the practice who had failed to attend for the influenza immunisation in the prior year (i.e. 2000 to 2001 campaign (N = 393) who agreed to participate, were not confused, did not have egg allergy (i.e. 90 participants)) Age: 50% were aged 65 to 72 years, 50% were aged over 72 years. Gender: no information provided | |
| Interventions | Intervention 1: invitation letter to attend GP for influenza immunisation plus leaflet promoting influenza vaccination Intervention 2: letter plus home visit Control: letter alone | |
| Outcomes | Outcome measured: % vaccinated based upon audit of health records Time points from the study considered in the review or measured or reported in the study: research project started following ethical approval (received 2 August 2001) and was completed by June 2002. % vaccinated by: not explicitly stated | |
| Notes | No source of funding mentioned. Author comments that a smaller proportion of those immunised at outcome had received a prior vaccination, but a larger proportion of those immunised at outcome had a qualifying health condition at baseline. 90 participants were eligible and consented of 393 who had failed to attend for the influenza immunisation in the prior year. | |
| Risk of bias | ||
| Bias | Authors' judgement | Support for judgement |
| Random sequence generation (selection bias) | Unclear risk | The 90 respondents were divided in half by age (< 72 years, 72 years or older). The participants in each age group were allocated into the 3 intervention groups, using the stratified randomisation technique. |
| Allocation concealment (selection bias) | Unclear risk | No information provided. |
| Blinding (performance bias and detection bias) All outcomes | Unclear risk | No information provided. |
| Incomplete outcome data (attrition bias) All outcomes | Low risk | Attrition of participants? Implied to be none, not explicitly stated Incomplete data points for participants? No Analysis if differential attrition could affect outcomes? No information provided. Vaccination data assessed by chart review (RCT was of a single practice). |
| Selective reporting (reporting bias) | Low risk | No selective reporting |
Puech 1998.
| Methods | Purpose: to determine if a single postcard reminder for people aged 65 years or older would improve influenza vaccination uptake in a 3‐partner general practice Design: RCT Duration of study: 1 April to 31 July 1996 Interval between intervention and when outcome was measured: postcard mailed on 1 April 1996. Outcomes ascertained "end of July 1996", 4 months later. Power computation: study power to detect a difference of 20% in immunisation rates at 0.05 (2‐sided): 61% for males, 81% for females Statistics: randomisation was done within sex strata, analysis controlled (logistic regression) for 1995 immunisation status and study factor but did not control for proximity to practice. Separate regressions done for males and females. | |
| Participants | Country: Australia
Site: Leichhardt General Practice (a 3‐partner practice) in suburban Sydney, Australia
Eligible participants: 325 people aged 65 years or older identified from a computerised age‐sex‐disease registry maintained by the general practice who had made at least 3 visits to the practice, 1 of which had to have occurred in the 2 years prior to study
Age: 65 to 69 years: 86/325 (26.5%) 70 to 74 years: 78/325 (24.0%) 75 to 79 years: 58/325 (17.8%) 80 to 84 years: 62/325 (19.1%) 85 years or older: 41/325 (12.6%) Gender: 38.5% male, 61.5% female Exclusions: 1. Nursing home residents were excluded as not on the computerised register 2. Flu vaccination received prior to 1 April 1996 3. Participants who had left practice, gone to a nursing home, or died since most recent update of the practice register 4. Those known to be allergic to egg protein 5. Known by practice to object to flu vaccination, or having severe or terminal illness, dementia, or unstable psychiatric conditions |
|
| Interventions | Intervention: postcard mailed 1 April 1996 reminding participants to attend the practice for an influenza vaccination before the end of the month and providing information on disease and vaccine, vaccine availability, and vaccine cost Control: usual care: "ad hoc approach" co‐interventions: "influenced by news coverage of outbreaks, media campaigns by vaccine manufacturers, opportunistic reminders and secular events" | |
| Outcomes | Outcome measured: % vaccinated in 1996 (end of July) as validated by chart review Time points from the study considered in the review or measured or reported in the study: postcards mailed to intervention group on 1 April 1996. Practice records reviewed for documentation of receiving vaccination at the end of July 1996. | |
| Notes | Chart review of practice: assessor blind to participant group allocation; required documentation in chart that vaccination, not just prescription for vaccine actually provided. However, no information provided as to whether or not chart review would have captured any vaccinations obtained from outside of the practice. Funding: no information provided. | |
| Risk of bias | ||
| Bias | Authors' judgement | Support for judgement |
| Random sequence generation (selection bias) | Low risk | Participants stratified by sex, then computer‐generated random numbers; however, for married couples once identified as married, both randomly allocated to same intervention. |
| Allocation concealment (selection bias) | Unclear risk | Insufficient information |
| Blinding (performance bias and detection bias) All outcomes | Low risk | General practitioners were blind to allocation, but no information provided on methods of blinding. Person who assessed outcome was blind to the participant group allocation. |
| Incomplete outcome data (attrition bias) All outcomes | Unclear risk | Outcomes were ascertained from patient chart, and participants were considered immunised if either immunisation was documented in patient record OR a prescription given for flu vaccine but no record of the actual vaccination in the notes. No information provided on loss to follow‐up, thus it is possible that participants recorded as not vaccinated might in theory have received vaccination from another practice. |
| Selective reporting (reporting bias) | Low risk | No selective reporting |
Roca 2012.
| Methods | Purpose: to assess the effects of a mail‐out education campaign on influenza vaccination uptake among seniors Design: RCT Duration: 1 week in September 2009 Power computation: "On the basis of the percentage of participants vaccinated in 2008 and results of previous studies, we calculated that a sample size of 1187 participants in each group was needed to find a vaccination rate difference of at least 5% between the EPG and the NPG (42.5% and 37.5% respectively) with a level of significance of P = .05 and a power of 80%" Statistics: t‐tests, Mann‐Whitney U, Wilcoxon, Kruskal‐Wallis, regression analysis |
|
| Participants | Country: Spain Setting: a health centre in Castellon, Spain Participants: 2402 participants in family practices of 13 physicians Age: >= 60 years old Gender: 55.7% female |
|
| Interventions | A personalised letter was sent to participants in the intervention group providing them with information about influenza and answers to common questions/concerns with respect to the influenza vaccine. The control group did not receive any letter. | |
| Outcomes | Although there was an increase in vaccination uptake for both groups as compared with the previous year, there was a greater increase in the intervention group as compared with the control (9.4% versus 1.6% increase, P < 0.01) | |
| Notes | Spanish VACH Cohort and the ISCIII‐RETIC (RD06/006) | |
| Risk of bias | ||
| Bias | Authors' judgement | Support for judgement |
| Random sequence generation (selection bias) | Low risk | "We used a computer random number generator and a 1:1 ratio to randomly assign participants to 1 of 2 groups" |
| Allocation concealment (selection bias) | Unclear risk | No statement |
| Blinding (performance bias and detection bias) All outcomes | Low risk | "The study was open for participants but blinded for the healthcare workers responsible for caring for the patients." |
| Incomplete outcome data (attrition bias) All outcomes | Low risk | All 2402 participants recruited were followed through the 2009 vaccination season. |
| Selective reporting (reporting bias) | Low risk | No selective reporting |
Satterthwaite 1997.
| Methods | Purpose: to compare effect of personalised invitation recommending a visit to doctor to receive a flu vaccination where patient was required to pay for vaccination, to personalised invitation recommending a visit to doctor to receive a flu vaccination at no charge, to no intervention on influenza immunisation uptake Design: RCT Duration of study: not stated Interval between intervention and when outcome was measured: not stated Power computation: not stated Statistics: Chi² statistic of significance adjusted for design effect of within‐practice clustering. Design effect for contrast of intervention 1 versus control was 1.09. Design effect of contrast for intervention 2 versus control was 4.05. | |
| Participants | Country: New Zealand Setting: 31 active general practitioners in the Auckland region randomly selected from the cervical screening program were invited to participate. Eligible practitioners were able to generate a list of names and addresses of all patients over 65 years of age; normally provided influenza vaccine to patients; worked at least 8/10 full‐time equivalent; and did not currently have in place a postal reminder system for influenza vaccination for patients over 65 years. 8 doctors were not eligible; 7 were eligible but did not wish to participate; and 16 were eligible and participated. Within each practice, up to 210 patients were randomly allocated to interventions. Eligible participants: (health status) 2791 people aged over 65 years Age: within each practice, participants aged over 65 years. Age distribution of participants not stated. Gender: sex distribution of participants not stated. No information provided on exclusion of participants. | |
| Interventions | Intervention 1 (N = 931): personalised invitation sent to people (mail) recommending that they visit their general practitioner to receive a flu vaccination. Those who accepted the invitation would have had to pay about NZD 20 for vaccination. Intervention 2 (N = 930): personalised invitation sent to people recommending that they visit their general practitioner to receive a flu vaccination at no charge Control (N = 930): no intervention. These people would have had to pay about NZD 20 for vaccination. | |
| Outcomes | Outcome measured: % participants vaccinated after intervention as recorded by practice staff, validated by authors only for participants who received intervention 2 Time points from the study considered in the review or measured or reported in the study: no information provided. | |
| Notes | No information provided on year study was done. Internal evidence in the article suggests prior to February 1997. Authors note that in 1997 flu season, government policy will change to make influenza vaccination free for people over 65 years of age. No information provided on vaccination status in the prior year. Data are not presented by practice. Funding: vaccine provided at no cost by Rhone Poulenc and distributed to practitioners by Ebos Group. | |
| Risk of bias | ||
| Bias | Authors' judgement | Support for judgement |
| Random sequence generation (selection bias) | Unclear risk | "The patients were randomly allocated" (no method stated) |
| Allocation concealment (selection bias) | Unclear risk | No information provided. |
| Blinding (performance bias and detection bias) All outcomes | Unclear risk | No information provided. |
| Incomplete outcome data (attrition bias) All outcomes | Unclear risk | 931 in group 1 (invitation letter), 930 in group 2 (free vaccine letter), and 930 in group 3 (control); no data on attrition |
| Selective reporting (reporting bias) | Low risk | No selective reporting |
Siriwardena 2002.
| Methods | Purpose: to compare the effect of an educational outreach visit to primary healthcare teams to written feedback on influenza and pneumococcal vaccination uptake Design: stratified cluster‐RCT Duration of study: 8 months Interval between intervention and when outcome was measured: 6 months Power computation: based on vaccination rate per practice as primary outcome. Sample size was based upon attainment of an increase in vaccination uptake of 20%. To detect a difference between control rates and the desired targets of at least 1 SD, the Student's t‐test with power 0.8 and size 0.05 would require 17 practices per group or 9 per group to detect an effect of 1.5 SDs with same power. Statistics: Poisson regression using population at risk as an offset and taking account of the stratification. Rates were expressed as mean vaccination rates, odds ratios and confidence intervals. | |
| Participants | Country: UK Setting: 20 primary care practices in the West Lincolnshire Primary Care Trust and the 10 from the Trent Focus Collaborative Research Network Eligible participants: (health status) 30 practices had patients aged 65 years or older or who had coronary heart disease, diabetes, or splenectomy on their registers. A total of 27,580 participants aged 65 years or older were included in the 30 practices. Age: no information provided on age distribution of participants in practices. Gender: no information provided on sex distribution of participants in practices. | |
| Interventions | Intervention: 1‐hour educational outreach visit (based on principles of academic detailing) to practice teams delivered by 1 member of the research team that included feedback of practice vaccination uptake in relation to other practices in the study and national targets Control: written feedback on vaccination uptake of practice compared with other participating practices | |
| Outcomes | Outcome measured: mean vaccination uptake (adjusted for initial level and stratification) based upon practice records, for:
Time points from the study considered in the review or measured or reported in the study: baseline data collection began in August 2000. Interventions delivered at the start of the annual influenza vaccination campaign of October 2000. Outcomes ascertained 6 months after the educational outreach visit, i.e. 8 months after baseline data collection. |
|
| Notes | Baseline data collection was in August 2000 and was done by practice staff. The unit of cluster was the practice. However, due to ceiling effects (capacity to increase immunisation uptake depends on baseline, possibly easier to increase from low baseline), practices were stratified on baseline uptake of influenza vaccination for diabetics, as this was previously shown to be correlated with risk group. Within strata, practices were randomly allocated to intervention or control. 20/39 practices in the West Lincolnshire Primary Trust participated as did 10/50 from the Trent Focus Collaborative Research Network. Participating and non‐participating practices were similar in number of partners, list size, whether or not they were dispensing practices, and rurally. Funding: Trent Focus and West Lincolnshire Primary Care Trust | |
| Risk of bias | ||
| Bias | Authors' judgement | Support for judgement |
| Random sequence generation (selection bias) | Unclear risk | "Fifteen practices were randomised to intervention and 15 to the control group after stratifying for baseline vaccination rate." |
| Allocation concealment (selection bias) | Unclear risk | No information provided. |
| Blinding (performance bias and detection bias) All outcomes | Unclear risk | Not possible with this design |
| Incomplete outcome data (attrition bias) All outcomes | Unclear risk | 13,633 in intervention group and 13,947 in control group, but no data on attrition; vaccination status assessed from clinic records |
| Selective reporting (reporting bias) | Low risk | No selective reporting |
Smith 1999.
| Methods | Purpose: to determine the effectiveness of mailed reminders on influenza vaccination uptake Design: RCT Duration of study: 3 months Interval between intervention and when outcome was measured: first measurement was made on 9 February 1996 (minimum 8+ weeks after intervention). Power computation: not discussed Statistics: logistic regression analysis adjusting for age, gender, residency in medium‐ or low‐ compared to high‐population density counties. In sensitivity analysis, the logistic regression had data from both immunisation data and survey results with chronic disease variables. | |
| Participants | Country: USA Setting: 10 counties in Indiana Eligible participants: 9011 people (4508 intervention group, 4503 control group) registered in the Medicare eligibility file who were age 65 years or older, had no evidence of having died, had an allowable charge in the prior year, who were not residents of nursing homes and were not members of an HMO who lived in 1 of 10 eligible counties were randomly selected for the study in 1995. Intervention group: 4508 eligible participants Control group: 4503 eligible participants Age: 65 years or older; mean age of control group was 75.4 years, for intervention group 75.5 years Gender: 61.9% female (control group), 61.2% female (intervention group) Exclusions: those who were found to reside in a nursing home, who had an invalid address, who were dead, or who refused to participate (intervention group: 497; control group: 492) | |
| Interventions | Intervention: a reminder letter adapted from the Health Belief Model that advised that costs were covered by Medicare, provided a state board of health phone number for those without access to physicians plus information about influenza vaccination. Letter was signed by the principal investigator, the state health commissioner, and the medical director of Medicare for Indiana. Control: no letters were sent. | |
| Outcomes | Outcome measured: N, % vaccinated against influenza (self report by postal survey or by having a claim filed for immunisation between 1 October 1995 and 31 January 1996). Self reported immunisation was validated by survey (99.6% agreement between survey and Medicare claims for influenza vaccination). Time points from the study considered in the review or measured or reported in the study: letter was sent on 3 November 1995 and a reminder (same letter) sent again on 22 December 1995. | |
| Notes | The eligible counties were selected by multistage random sampling from the 56 Indiana counties that did not abut state borders: the county with highest population density of elders, 4 counties randomly selected with a medium density of elders (19.6/square miles), and 5 counties with low population density of elders (random number generator). The reason for exclusion of border counties was that residents of those counties were perceived to be more likely to use out‐of‐state health services, which would reduce ability to track outcomes. Intensive follow‐up was done to ascertain outcomes: non‐responders to the 9 February 1996 postal survey were sent a second survey 16 April 1996 and 14 July 1996. A sample of those who did not respond after the 14 July mail‐out and who did not submit a claim for influenza immunisation or were not identified in mortality files were telephoned to determine immunisation status. Interviewers were blind to intervention assignment. Funding: no information provided. No data on vaccination prior to 1995 were collected or reported. | |
| Risk of bias | ||
| Bias | Authors' judgement | Support for judgement |
| Random sequence generation (selection bias) | Unclear risk | Random selection was by a random number generator; ? "... and then randomised within county to control and intervention groups." No explicit statement that random allocation used a random number generator. |
| Allocation concealment (selection bias) | Unclear risk | No information provided. |
| Blinding (performance bias and detection bias) All outcomes | Low risk | In follow‐ups, telephone interviewers were blinded to intervention; no information provided as to blinding for postal surveys or Medicare claims. However, it is unlikely that contamination could have occurred. |
| Incomplete outcome data (attrition bias) All outcomes | Unclear risk | 10,000 Medicare beneficiaries randomly selected; 5000 randomised to intervention and 5000 to control; 4503 eligibles in control, 4508 eligibles in intervention group; 3487 in control group responded to survey or filed claim, and 3454 in intervention group responded to survey or filed claim (no differential attrition analysis). |
| Selective reporting (reporting bias) | Low risk | No selective reporting |
Spaulding 1991.
| Methods | Purpose: to compare the effect of a postcard reminder sent to high‐risk participants to usual care (no postcard) on influenza immunisation uptake Design: RCT Duration of study: 6 months Time: 1983/1984 influenza season Outcome measured: % vaccinated against influenza for the 1983 to 1984 season by sex, rank of military sponsor, and age group (including those aged > 64 years) Interval between intervention and when outcome was measured: 6 months were allowed for people to be vaccinated, and it is clear that the intervention antedated the measurement of outcome. Power computation: no information provided Statistics: Chi² statistic to compare proportions vaccinated in each group. Multivariate analysis using Mantel‐Haenszel Chi² statistic and Mantel‐Haenszel adjusted risk ratio. Within‐family clustering was not addressed. | |
| Participants | Country: USA Setting: Department of Family Practice at Madigan Army Medical Center, Ft Lewis, Washington Eligible participants: 1068 military retirees or the family members of active or retired members of the military who had 1 or more high‐risk diagnoses for influenza complications according to the US Immunization Practices Advisory Committee criteria of 1983 Age: people of all ages 0 to 20 years: 153 (71 intervention; 82 control) 21 to 40 years: 130 (63 intervention; 70 control) 41 to 64 years: 289 (269 intervention; 289 control) 65 years or older: 224 (116 intervention; 108 control) Sex: males 56.3%, females 43.7% Males: 573 (519 intervention; 549 control) Females: 496 (257 intervention group; 238 control) Exclusions: people who did not have a high‐risk health condition | |
| Interventions | Intervention: 519 participants in intervention group were mailed a reminder postcard advising them that their physician had determined that they were at high risk of complications should they catch the flu and strongly urging them to come to the Family Practice Clinic for intervention. Postcard sent 2 weeks before availability of the influenza vaccine used during the 1983/84 season. Control: 549 participants who received routine care, were not sent a postcard | |
| Outcomes | Outcome measured: % receiving influenza vaccine based on office records of being vaccinated
Time points from the study considered in the review or measured or reported in the study: from time postcard sent 2 weeks before vaccine availability to 6 months after vaccine became available Intervention: postcard sent 2 weeks before availability of the influenza vaccine used during the 1983/84 season. % vaccinated by 6 months after the influenza vaccine used in the 1983/1984 season became available |
|
| Notes | Potential participants were assigned a code number that included 2 digits to identify if they were members of the same family. These data were not used in analysis (i.e. within‐family clustering was not addressed in the data analysis). There was no cost to patient for influenza immunisation. No data are provided on influenza vaccination prior year. Funding: no information provided. | |
| Risk of bias | ||
| Bias | Authors' judgement | Support for judgement |
| Random sequence generation (selection bias) | Low risk | Individuals were assigned to intervention or control group by a table of random numbers. |
| Allocation concealment (selection bias) | Unclear risk | No information provided. |
| Blinding (performance bias and detection bias) All outcomes | High risk | Physicians in the Department of Family Practice were aware that a study was in progress and that some of their patients might receive postcards about influenza immunisation. Vaccine was offered to all eligible participants on a walk‐in basis. Participants who presented for immunisation read and signed an informed consent document. It is not stated if the physicians were those who performed the vaccinations. However, participants might have told their vaccinator whether or not they had received a postcard. |
| Incomplete outcome data (attrition bias) All outcomes | Unclear risk | No information provided on attrition or incomplete data points. No analysis whether differential attrition could affect results; vaccination status assessed from records at US Army Medical Center |
| Selective reporting (reporting bias) | Low risk | No selective reporting |
Stuck 2015.
| Methods | Purpose: to compare the effect of a health risk assessment compared to usual care to improve (1) primary outcomes: unfavourable health behaviours, health and social impairments and risk factors (including influenza vaccination) at 2‐year follow‐up, and (2) secondary outcome: all‐cause mortality at 8 year follow‐up.
Design: RCT
Duration of study: 2 and 8 year follow‐ups
Time: November 2000 to January 2002
Outcome measured relevant to this review: % vaccinated against influenza in 2001
Interval between intervention and when outcome was measured: only defined as "influenza vaccination in past 1 year"
Power computation: to demonstrate a 1.3 fold increase in positive health behaviours or preventive care use with 80% power and a significance level of 0.05, assuming a dropout rate of 20%, 1000 participants in each group were required. For a 1:2 randomisation (intervention to control) 732 individuals were required in the intervention and 1464 in the control group. Statistics: Intention to treat analysis, imputation methods for handling missing data, generalised estimating equations with an underlying equicorrelation structure. |
|
| Participants | Individuals ≥ 65 in 19 primary care practices in Solothurn, Switzerland | |
| Interventions | European PRO‐AGE Health Risk Assessment (11 preventive care recommendations) November 2000 to January 2002; nurses and counsellors used a manual, and nurses visited participants at home at baseline and every 6 months and contacted them by phone at 3 months; control group received usual care from primary care practitioner | |
| Outcomes | At 2 years' assessment of 6 outcomes: measurement of blood pressure, cholesterol, glucose, faecal occult blood, influenza (65.8% intervention, 59.2% usual care) and pneumococcal vaccination; at 8 years all‐cause and cause‐specific mortality | |
| Notes | Exclusions: needing assistance with basic activities of daily living, Mini Mental State score ≤ 24, terminal disease, or inability to speak German; power computation assessed needed 1000 in each group to demonstrate 1.3 fold increase in positive health behaviour or preventive care use with alpha 0.05 and power = 80%, assuming control group prevalence = 20% and dropouts = 20%; due to resource constraints randomisation changed to 1:2 ratio, and needed 732 in intervention and 1464 in control; ITT analysis No funding; data provided by Swiss Federal Statistical Office |
|
| Risk of bias | ||
| Bias | Authors' judgement | Support for judgement |
| Random sequence generation (selection bias) | Low risk | Computer‐generated random number generator |
| Allocation concealment (selection bias) | Unclear risk | No statement |
| Blinding (performance bias and detection bias) All outcomes | Low risk | Data extractors abstracted data from primary care practice records and were blinded. |
| Incomplete outcome data (attrition bias) All outcomes | Low risk | In intervention group, 779 of 874 randomised participants had 2‐year outcome data and 874/874 8‐year outcome data; in control group these numbers were 1238/1410 and 1410/1410, respectively. Intention‐to‐treat analysis with multiple imputation for missing values |
| Selective reporting (reporting bias) | Low risk | No selective reporting |
ANOVA: analysis of variance CDC: Centers for Disease Control and Prevention CI: confidence interval COPD: chronic obstructive pulmonary disease GI: gastrointestinal GLE ANOVA: general linear model repeated‐measures analysis of variance GP: general practitioner HCFA: Health Care Financing Administration HMO: health maintenance organisation ICC: intraclass correlation ICD‐9‐CM: International Classification of Diseases 9th Revision Clinical Modification IHD: ischaemic heart disease ITT: intention‐to‐treat ns: non‐significant OR: odds ratio RCT: randomised controlled trial RR: risk ratio SD: standard deviation
Characteristics of excluded studies [ordered by study ID]
| Study | Reason for exclusion |
|---|---|
| Ahmed 2004 | RCT; intervention to increase influenza vaccination rates, but cannot separate outcomes for 60 to 64 years from 18 to 64 years. E‐mail from Dr Faruque Ahmed on 3 April 2013: "We generated a random number for each employer using the RANUNI function in SAS. We randomised to the study arms based on the random number using defined cut‐offs. I am not sure whether we still have the data." |
| Alemi 1996 | Not RCT; children |
| Alexy 1998 | Not RCT; intervention to increase influenza vaccination rate and influenza vaccination rate outcomes; prospective cohort without control group (and those who participated through either the mobile health unit or a home visit received the same level of intervention, thus no comparison could be made for different levels of intervention) |
| Allsup 2004 | RCT; however, focus was invitation from practices to participate in an RCT. Once invitees agreed to participate they were randomised to receive either influenza vaccination or placebo, but there was no control group that did not receive an invitation to participate. The primary focus of analysis was the occurrence of GP‐assessed pneumonia or ILI. |
| Anderson 1979 | Not RCT, survey of subsample asked about swine flu |
| Armstrong 1999 | Not RCT; 8596 community‐dwelling residents who received care at University of Pennsylvania primary care site; reminder postcard to receive influenza vaccination mailed to random sample of 5000; brochure mailed to 390 of remaining 3596; no baseline data; excluded as cannot assess secular trend in rest of population |
| Arthur 2001 | Not RCT; offer of health assessment, but no control group |
| Bakare 2007 | Not RCT; retrospective survey of physician‐ and nurse‐initiated influenza vaccination in acute care hospital |
| Balagué 1993 | Not RCT; survey of vaccination rates |
| Baldo 1999 | RCT; no intervention to increase vaccination rates |
| Bardenheier 2005 | Not RCT |
| Bardenheier 2010 | Not RCT; survey of vaccination policies and influenza vaccination rates |
| Bardenheier 2011 | Not RCT, survey of vaccination policies and influenza vaccination rates |
| Barker 1999 | Not RCT; cohort comparing Monroe Country and Onondaga County, NY; no data on comparability of cohorts; Bennett 1994 and Kouides 1993 also describe this non‐RCT |
| Barton 1990 | Not RCT; an intervention to increase influenza vaccination rates was used. For HMO in Boston 1983‐4 = baseline rates as historical control; 1984 postcard reminders for high‐risk individuals aged < 65 years; 1985 chart reminders for those aged > 65 years plus feedback to service chiefs; 1986 chart reminders plus feedback to service chiefs plus feedback to physicians plus lists of unimmunised participants; excluded as historical controls; excluded as cannot assess secular trend in rest of population |
| Beardsworth 2004 | Not RCT; coalition helped family physicians purchase influenza vaccine, educational pamphlets and provided a hotline |
| Becker 1989 | Not RCT, 40 to 60 years of age; preventive care reminders |
| Bekker 2003 | Not RCT, survey of attitudes of those aged ≥ 65 years to influenza vaccination |
| Belcher 1990 | RCT; interventions to increase influenza rates: comparing education and feedback to physicians, patient education, and a health promotion clinic; no baseline influenza vaccination rates; data for those aged ≥ 60 years not available separately. We e‐mailed the author for data for those aged ≥ 60 years, but received no response. |
| Bennett 1994 | Not RCT, intervention to increase influenza vaccination rates: community‐wide demonstration project in Monroe County, New York, to enrol all Medicare B enrollees those aged ≥ 65 years to increase influenza vaccination rates |
| Berg 2004 | RCT; intervention to increase influenza vaccination rates: informational sheet; publication does not state baseline data or data for those aged < 60 years and aged ≥ 60 years separately. We e‐mailed the trial authors for data but received no reply. |
| Berg 2005 | Not RCT, matched participants randomly assigned from geographic regions; 78% of participants aged < 65 years |
| Birchmeier 2002 | Not RCT, residents offered influenza vaccination to participants in clinic |
| Bloom 1988 | Not RCT, participants aged ≥ 65 years; intervention to increase influenza vaccination rates |
| Bloom 1999 | Not RCT; for those participants aged ≥ 65 years, a fax was sent to family physician requesting they administer influenza and pneumococcal vaccines |
| Bond 2011 | RCT; cannot identify outcomes for those aged ≥ 65 years |
| Bou‐Mias 2006 | Not RCT; individuals aged 60 to 64 years in urban health centre in Spain; non‐random allocation to receive phone call about influenza vaccination or no call; no baseline rates for year before intervention |
| Bovier 2001 | Not RCT; survey of attitudes of those aged ≥ 65 years to influenza vaccination |
| Brady 1988 | RCT; cannot separate results for those aged < 60 years and those aged ≥ 60 years |
| Breen 2003 | Not RCT; pneumococcal vaccination campaign |
| Brimberry 1988 | RCT; article states no baseline influenza vaccination rates available; vaccination rates not separately available for those aged ≥ 60 years |
| Browngoehl 1997 | Not RCT, children |
| Buchner 1987 | RCT; intervention to increase influenza vaccination; participants aged ≥ 65 years, but self report of influenza vaccination by questionnaire |
| Burns 2005 | Not RCT, survey of attitudes to vaccination |
| Call 2005 | Not RCT, no intervention to increase influenza vaccination; article describes the clinical diagnosis of ILI |
| Cardozo 1998 | Not RCT, article is a retrospective chart review |
| Carey 1991 | Not RCT; audit of 13 preventive manoeuvres including influenza vaccination |
| Carman 2000 | RCT, but no intervention to increase vaccination in elderly (1 group of long‐term care hospitals had an "opt in" policy for influenza vaccination and another group an "opt out" policy); focus was on vaccinating healthcare workers |
| Carter 1986 | RCT; design of brochure to promote influenza vaccination; unable to contact author for more baseline and outcome numbers and percentages for those aged ≥ 60 years; self report of influenza vaccination |
| CDC 2003 | Not RCT, article is a note about policy change by Centers for Medicare and Medicaid to remove requirement for physician signature on orders for influenza vaccination |
| Chami 2012 | RCT in nursing homes to use hygienic measures to reduce infections; no influenza vaccine intervention |
| Chan 1999 | Not RCT, no intervention to increase vaccination rates. Article is a survey of influenza vaccination rates of female Medicare beneficiaries. |
| Charles 1994 | Not RCT; participants at Sunnybrook Health Science Centre Family Practice Unit, Toronto; 4 physician teams divided into 2 groups and "patients of two of the four teams were designated as subjects and patients of the remaining two were designated as controls," then "simple random selection of patients from the roster of each team physician to participate in the study." (Participants aged ≥ 65 years.) |
| Chen 2007 | Not RCT, no intervention to increase vaccination rates. Article is a telephone survey of attitudes to influenza vaccination. |
| Cheney 1987 | RCT; intervention to increase influenza vaccination rates: internal medicine residents were randomised to receive preventive care checklists; no baseline pre‐intervention influenza vaccination rates; no numbers for outcomes, only graphical presentation on small graphs, so cannot assess numbers. We e‐mailed the authors for numbers for outcomes but did not receive a reply. |
| Chi 2006 | Not RCT, no intervention to increase vaccination rates. Article is a telephone survey of factors influencing influenza vaccination. |
| Chodroff 1990 | Not RCT; 1986 historical controls; 1986 to 1990 residents given preventive care checklists |
| Christenson 2001 | Not RCT; intervention to increase influenza vaccination rates: all individuals in Stockholm County aged ≥ 65 years (n = 259,627) invited to participate in influenza plus pneumococcal vaccination campaign; 100,242 received vaccine; focus on effectiveness of vaccination in reducing hospitalisation and pneumonia |
| Clancy 2003 | RCT; publication does not provide separate data for those aged < 60 years and aged ≥ 60 years, or baseline influenza vaccination data for year prior to intervention; unable to locate author |
| Cohen 1982 | RCT; no baseline data for influenza vaccination rates; influenza rates for participants aged ≥ 60 years not available separately |
| Cohen 2004 | Not RCT, article is an observational study of how physicians offer vaccination during consultations |
| Colombo 2005 | Not RCT, article is an economic analysis of vaccination strategies |
| Correa‐de‐Araujo 2006 | Not RCT, secondary analysis of differences in immunisation rates by ethnic group in Medical Expenditure Panel Survey; no intervention to increase vaccination rates |
| Costa 1994 | Not RCT, article is a prospective cross‐over without control; results for those aged ≥ 60 years not available |
| Cowan 1992 | RCT; 16 residents in intervention, 13 in control group; no data that residents or participants groups similar; retrospective chart review of 107 charts (62 intervention, 45 control), also random sample of charts seen by first‐year residents (different residents from current sample) previous year |
| Cowan 2006 | Not RCT, no intervention to increase vaccination rates. Article is about attitudes to vaccination among healthcare workers. |
| Crawford 2005 | Not RCT; participants in a managed care organisation in "the eastern United States." For breast cancer screening, cervical cancer screening, or influenza vaccination (aged ≥ 65 years) interactive voice reminders were sent; no data on secular trends; baseline data for year before intervention available. |
| Crawford 2011 | Not RCT, no intervention; survey of patient characteristics of those aged ≥ 65 years accepting influenza vaccination |
| Crouse 1994 | Not RCT; 6 community hospitals in northern Minnesota assessed 3 strategies to increase influenza vaccination rates: standing orders, physician chart reminders, physician education; excluded as cannot assess secular trend in rest of population |
| Curry 2006 | Not RCT, survey of factors associated with influenza vaccination; no intervention to increase vaccination rates |
| Daniels 2007 | RCT; intervention to increase influenza vaccination rates: onsite adult vaccination in churches; abstract states participants aged ≥ 65 years, but Table 1 states mean age is 65 years with SD = + or ‐14, so clearly includes participants younger than 60 years |
| Dannetun 2003 | Not RCT, survey of reasons for not being vaccinated by seniors in Linköping, Sweden; no intervention to increase vaccination rates |
| Davidse 1995 | Not RCT; GPs selected participants in Brabant for vaccination; cannot separate those aged ≥ 60 years, no publication by this author since 1995 in MEDLINE to obtain e‐mail address |
| Davidson 1984 | Not RCT; intervention to increase influenza vaccination rates: university‐based internal medicine practice in North Carolina; 50% sample selected 1 July 1979 to 30 June 1980 to receive nurse reminder for influenza vaccination, then another 50% sample selected 1 January to 31 December 1981; 50% not selected in each period served as controls; not stated what overlap occurred between intervention groups in the 2 periods or controls in the 2 periods; excluded as cannot assess secular trend in rest of population |
| Davis 2005 | Not RCT, focus groups with physicians about barriers to influenza vaccination |
| De Wals 1989 | Not RCT; intervention to increase vaccination rates: participants of GPs in Braine‐le‐Château, Belgium; 1984 baseline; 1985 information campaign by GPs; 1986 information campaign by posters, newspaper editorials, and lectures for retired individuals; excluded as cannot assess secular trend in rest of population |
| De Wals 1996 | Not RCT; survey of influenza vaccination rates in long‐term care facilities in Quebec |
| Denis 1996 | Not RCT; intervention in Charleroi, Belgium, to increase influenza vaccination rates in those aged ≥ 65 years |
| Desbiens 2005 | Not RCT; observational study of All‐Inclusive Care for the Elderly programme in Chattanooga, Tennessee |
| Dexter 2001 | RCT; intervention to increase influenza vaccination rates in hospitalised patients; cannot separate those aged ≥ 60 years |
| Dickey 1990 | Not RCT, survey of US family physicians about interest in using patient‐held health passport preventive care checklist |
| Dickey 1992 | Not RCT. Health Passport preventive care checklists used for preventive services in university family medicine clinic, but key table listing preventive services is omitted from article. |
| Dickey 1993 | Not RCT, literature review of paediatric and adult patient‐held preventive healthcare cards |
| Dini 1996 | Not RCT, no intervention to increase vaccination rates and not appropriate age group (audit of childhood vaccinations in Georgia, USA) |
| Donato 2007 | Not RCT; intervention to increase vaccination rates: 650‐bed community hospital in Pennsylvania; 2002 nurses screened participants for influenza vaccination, put reminder stickers on front of chart and orders in chart for physician to sign; 2003 nurses screened participants and standing order for influenza vaccination before discharge; 2004 same as 2003 plus Grand Rounds and nursing education sessions on each unit; excluded as cannot assess secular trend in rest of population |
| Douglas 1990 | Not RCT; no intervention to increase influenza vaccination rates. Retrospective audit in Kansas City family medicine residency programme clinics |
| Earle 2003 | Not RCT; survey of participants with colorectal cancer in SEER (US National Cancer Institute Survival, Epidemiology, and End Results) programme and factors associated with vaccination; average age 79 years; no baseline data for year before case‐control study; no control |
| Egido Polo 1989 | Not RCT, data for those aged ≥ 60 years not available; e‐mail for author not available |
| Etkind 1996 | Not RCT; in Essex County, Massachusetts, letters sent to all healthcare providers, press releases, newspaper articles, radio and TV announcements, lectures at senior centres, influenza vaccination clinic schedules sent to all community and elder organisations, Grand Rounds at each Essex County hospital; in Worcester County "usual care"; excluded as not RCT, geographical areas may not be comparable |
| Evans 2003 | Not RCT, no intervention to increase vaccination rates. Survey of reasons for not being vaccinated against influenza |
| Fairbrother 1999 | Not RCT, childhood vaccinations |
| Fedson 1989 | Not RCT, no intervention to increase vaccination rates (guidelines for influenza vaccination in institutional settings) |
| Fedson 1994 | Not RCT, no intervention to increase vaccination rates (article presenting guidelines for prevention and control of influenza in hospitals and hospital staff) |
| Fedson 1996 | Not RCT, no intervention to increase vaccination rates (review of effectiveness of influenza vaccine) |
| Fernández Silvela 1994 | Not RCT; no baseline data |
| Ferrante 2010 | Not RCT, cross‐sectional data from RCT on colon cancer screening; 23% received influenza vaccination, but no report of comparison to control group |
| Fiebach 1991 | Not RCT, survey of reasons for accepting or refusing influenza vaccination |
| Fishbein 2006a | Not RCT, observational study of missed opportunities for influenza vaccination |
| Fishbein 2006b | Not RCT, average age 46 to 48; cannot separate outcomes for those aged ≥ 65 years; no reply to e‐mail to author |
| Fisher 2003 | Not RCT, cross‐sectional analysis of spending patterns in Medicare regions and influenza vaccination rates; no intervention to increase vaccination rates in elderly |
| Fitzner 2001 | Not RCT, theoretical model of cost‐effectiveness of influenza vaccination in Hong Kong |
| Fitzpatrick 2004 | Not RCT; retrospective case‐control; no intervention to increase vaccination rates in elderly |
| Flach 2004 | Not RCT, secondary analysis of survey of relationship of patient‐centred care and vaccination rates in Veterans Administration Hospitals |
| Fontanesi 2004 | Not RCT, analysis of workflow observations of care of participants ≥ 50 in convenience sample of 16 ambulatory care settings in San Diego, California and Rochester, New York; development of model of 7 critical organisational, temporal, and clinical activities that predicted 93% of influenza immunisations |
| Fowles 1998 | Not RCT; survey of influenza vaccination rates in seniors in HMO in Minneapolis‐St Paul comparing staff, multispecialty or primary care practices |
| Frame 1994 | RCT; 10 preventive items; no influenza vaccination data |
| Francisco 2006 | Not RCT, survey of reasons for not receiving influenza vaccination among those aged ≥ 60 years in Sao Paulo, Brazil |
| Frank 1985 | Not RCT; cohort, no control; reminder letters and phone calls for influenza vaccination |
| Frick 2004 | Not RCT, analysis of changes in influenza vaccination rates by race in USA among disabled seniors |
| Furey 2001 | Not RCT; feedback to GPs on influenza vaccination rates in those aged ≥ 75 years in Merton Sutton and Wandsworth Health Authority, UK |
| Galasso 1977 | Not RCT, review of clinical trials of influenza vaccination 1976 |
| Ganguly 1989 | Not RCT, survey of reasons for acceptance/refusal of vaccination |
| Ganguly 1995 | Not RCT, survey of vaccination status of veterans in a nursing home |
| Gannon 2012 | Not RCT, team intervention to improve multiple vaccination rates; no data on secular trends |
| Garrett 2005 | Not RCT; pre‐post cohort; study of employed workers, i.e. those aged < 65 years; ages not stated |
| Gauthey 1999 | Not RCT, survey of influenza vaccination rates and motivations for receiving influenza vaccine among those aged ≥ 65 years in the State of Geneva in Switzerland |
| Gelfman 1986 | Not RCT, before‐and‐after 1‐group study; physicians were not prompted to offer influenza and pneumococcal vaccinations to high‐risk participants at the beginning of the influenza season, then later in the influenza season were prompted by reminders placed on charts at the Medical College of Virginia |
| Gerace 1988 | Not RCT, comparison of letter in 1985 and phone call in 1986 |
| Giles 2003 | Not RCT. Summary of articles by Arthur 2002 and Hull 2002 |
| Gill 2000 | Not RCT; Christiana Care Foulk Road Family Medicine Center, Delaware, USA; 1997 baseline rates; 1998 reminder to nurse and physician during visit; excluded as cannot assess secular trend in rest of population |
| Gill 2005 | Not RCT; retrospective cohort; impact of "Providing a Medical Home to the Uninsured" in Delaware, USA; cannot separately identify those aged ≥ 60 years |
| Goebel 2005 | Not RCT; retrospective chart review of physicians who used standing orders and those who did not |
| Grabenstein 1990 | Not RCT, survey of vaccination status at Walter Reed Army Hospital |
| Grabenstein 1992 | Not RCT, cost‐effectiveness model of pharmacists advocating and providing influenza vaccine |
| Grabenstein 2001 | Not RCT; survey of influenza vaccination in Washington state (where pharmacists can give influenza vaccinations) and Oregon (where they cannot) |
| Granollers 1993 | Not RCT; participants not aged ≥ 60 years; nursing staff preventive care interventions |
| Green 2003 | Not RCT, survey of the relationship of functional status, depression, and treatment for psychiatric problems to rates of influenza vaccination in those aged ≥ 65 years in the Kaiser Permanente Northeast HMO |
| Greene 2001 | Not RCT, survey of uptake of preventive care |
| Groll 2006 | Not RCT; study of Universal Influenza Campaign in Ontario; data for those aged ≥ 60 years not available separately |
| Gutiérrez 2005 | Not RCT, economic evaluation of influenza vaccination for those aged ≥ 65 years in Mexico |
| Gutschi 1998 | RCT; intervention to increase influenza rates; no vaccination rates for year before intervention; cannot separate rates for those aged ≥ 60 years |
| Hahn 1990 | Not RCT; use of a health maintenance protocol in a family practice clinic; no influenza intervention or outcomes |
| Halliday 2003 | Not RCT, survey of 19 residential care facilities in Australian Capital Territory on staff vaccination |
| Hanna 2001 | Not RCT; survey of pneumococcal and influenza vaccine rates in indigenous population in New Zealand, and monitoring after local physicians were encouraged to offer vaccination; no information on secular trends; cannot separate outcomes for those aged ≥ 60 years |
| Hannah 2005 | Not RCT, intervention programme in West Virginia; no patient outcome data |
| Harari 2008 | RCT; influenza vaccination only recorded for year before study (Table 3) |
| Harbarth 1998 | Not RCT (concurrent comparison group) |
| Harris 1990 | Not RCT, retrospective chart review; North Carolina Memorial Hospital Department of Medicine Polyclinic Practice; time series: 1979 to 1980 no prompts; 1981 nursing prompt; 1984 computer prompt; excluded as cannot assess secular trend in rest of population; cannot assess numbers in target groups from Figure 2 |
| Harris 2006 | Not RCT; 249 participants with COPD recently discharged from hospital in Adelaide, Australia, for COPD intervention group (received Cochrane Collaboration systematic review summaries related to COPD) and control groups allocated to separate geographical areas; author sent PhD dissertation, and we were able to verify it was not an RCT |
| Hedlund 2003 | Not RCT; study of influenza and pneumococcal vaccination campaign for individuals aged ≥ 65 years in Stockholm County, Sweden, 1998; no control group; baseline data for year before intervention not available |
| Henk 1975 | Not RCT; cohort, no control; age lists used to identify participants for influenza vaccination |
| Hermiz 2002 | RCT; no intervention to increase influenza vaccination; no statement as to whether vaccinated participants had received vaccination before or after intervention |
| Herrett 2016 | RCT of text messages to at‐risk participants for influenza vaccination. However, age groups are 18 to 34, 35 to 50, and 51 to 64, and cannot separate outcomes for those 60 and older. |
| Hirdes 2006 | Not RCT, survey of predictors of vaccination in Ontario nursing homes |
| Hoey 1982 | Not RCT; intervention to increase vaccination rates: nurses offered influenza vaccination to half participants seen in morning clinics, and participants were vaccinated by physicians in afternoon clinics; participants aged ≥ 60 years cannot be identified |
| Honkanen 1996 | Not RCT, survey of knowledge about influenza vaccination |
| Honkanen 1997 | Not RCT; for 3 administrative areas in Finland: Admin Area A: risk of disease‐based influenza vaccination programme; Admin Area B: age‐based vaccination programme offered Autumn 1993 and 1994; Admin Area C: age‐based vaccination programme offered 1992 to 1994; areas not necessarily identical |
| Honkanen 2006 | Not RCT; northern Finland; 14 municipalities risk of disease‐based intervention x 2 years; 29 municipalities: age‐based intervention x 2 years. 12 municipalities cross‐over from disease‐based intervention in 1992 to age‐based intervention in 1993; excluded as not RCT; geographical areas may not be comparable |
| Humair 2002 | Not RCT; primary care clinic of Department of Community Medicine, Geneva University Hospital; 1995 baseline; 1996 leaflets and posters at reception desk and waiting areas, walk‐in immunisation clinic, 1.5‐hour training workshop on influenza for physicians, computer reports every 2 weeks to residents on vaccination performance compared to other residents; reminder stickers for records of high‐risk participants; excluded as cannot assess secular trend in rest of population |
| Hutchinson 1995 | Not RCT; survey of influenza vaccination in clinic participants |
| Hutchison 1991 | Not RCT; historical control 1982 to 1983; reminder letter 1987 to 1988 |
| Hutt 2010 | Not RCT, quasi‐experimental mixed methods; cohort (8 nursing homes in Denver; no data on comparability of 8 non‐intervention nursing homes in Missouri and Kansas); survey of implementation of guidelines on nursing home‐acquired pneumonia and hospitalisation; data on influenza vaccination rates 2004 to 2007 |
| Jacobs 2001 | Not RCT; retrospective chart review of use and non‐use of interpreters for clinical and preventive services |
| Jain 1998 | Not RCT, survey; no intervention to increase influenza vaccination |
| Jans 2000 | Not RCT, cohort of 14 medical practices with 16 physicians implementing 8 guidelines for care of COPD and asthma, compared to 5 control practices with 5 physicians "located in the same region" (non‐comparable intervention and control groups: practices differed P = 0.04 in "troublesome symptoms" and P < 0.01 in type of disease (COPD versus asthma)) |
| Jefferson 1996 | Not RCT, economic evaluation of influenza vaccination |
| Jiménez‐Garcia 2007 | Not RCT, survey of influenza vaccination rates of people with COPD in Catalonia |
| Jin 2003 | Not RCT, secondary analysis of Alberta administrative data for influenza vaccination rates for those aged ≥ 65 years |
| Johnson 2005 | C‐RCT; no outcome data for influenza |
| Kassam 2001 | C‐RCT; cannot separate outcomes for influenza vaccination from pneumococcal vaccination |
| Kelly 1988 | Not RCT; children |
| Kemper 1993 | RCT; children |
| Kendal 1985 | Not RCT, survey of vaccination rates in nursing homes in the USA |
| Kennedy 1994 | Not RCT; tracking system for paediatric vaccinations in a Medicaid managed care organisation |
| Kern 1990 | Not RCT; preventive care audit by faculty of charts of participants seen by internal medicine residents; influenza vaccine outcomes not available separately for those aged ≥ 65 years |
| Klachko 1989 | Not RCT; survey of influenza vaccination rates in diabetic clinic; data not available separately for those aged ≥ 60 years |
| Knoell 1991 | Not RCT; General Internal Medicine Group Practices at the University of California at San Francisco; 1987 to 1988 baseline; 1989 pharmacist presented 3 in‐services to nursing staff about influenza vaccination, participants aged > 65 years received information sheet in clinic, campaign to provide vaccination with or without a visit; excluded as cannot assess secular trend in rest of population |
| Korn 1988 | Not RCT; preventive medicine checklist placed on charts, including influenza for those aged ≥ 65 years; faculty audit of charts of 15 internal medicine residents exposed to intervention and 13 who had not been; no assessment if residents were similar; no data on secular trends in practice |
| Kosiak 2006 | Not RCT, secondary analysis of influenza vaccination rates for those aged ≥ 65 years in 2004 National Healthcare Quality Report and National Healthcare Disparities Report |
| Kunze 1998 | Not RCT. Editorial; no intervention to increase vaccination rates |
| Kwong 2006 | Not RCT, secondary analysis of influenza vaccination rates in 1996 to 1997 National Population Health Survey of Canada and Population Health Survey of Canada 2000 to 2001 and 2003, including those aged ≥ 65 years |
| Kyaw 2002 | Not RCT, survey of influenza vaccination rates and vaccination policies in 53 general practices in Scotland 1993 to 1999 |
| Landis 1995 | Not RCT; vaccine manager to increase use of 4 vaccines; no data on influenza vaccination |
| Landon 2004 | Not RCT, secondary analysis of Centers for Medicare & Medicaid Services data on influenza vaccination rates for those aged ≥ 65 |
| Larson 1979 | Not RCT; reminder letter to those aged ≥ 65 years and high‐risk patients at the University of Washington family medicine centre; cannot separate outcomes for those aged ≥ 65 years from high‐risk participants |
| Larson 1982 | RCT; intervention to increase influenza vaccination rates: postcard reminders; correspondence from author was neither able to provide precise baseline influenza vaccination rates before intervention (Dr Larson estimated them from a survey with a 75% response rate at 50%), nor provide data separately for those aged ≥ 60 years; self report of vaccination |
| Lau 2006 | Not RCT, telephone survey of influenza vaccination rates among residents of Hong Kong for those aged ≥ 65 years |
| Lawson 2000 | Not RCT; standing orders for influenza vaccination; no control group (community rate used as control rate, no details on characteristics of community group) |
| Lazorik 2001 | Not RCT; no intervention to increase vaccination rates; article summarising preventive care options |
| LeBaron 1997 | Not RCT; annual measurement and feedback programme; children |
| Lee 2003 | Requested needed additional computations from author but no reply |
| Lees 2005 | Not RCT, secondary analysis of 2000 US National Health Interview on influenza vaccination rates |
| Leirer 1989 | Not RCT; intervention to increase influenza vaccination rates: 321 older people who attended community‐supported lunch program at a senior citizen centre (location not stated, authors' professional address is Stanford, California); 64 individuals ≥ 65 "randomly selected" from those who attended ≥ 1 per week, and 257 "randomly selected" from those attending less frequently; (however 64 + 257 = 321, leaving no degrees of freedom, so the second sample could not have been randomly selected); frequency of attendance does not control for potential confounders; no baseline data |
| Leirer 1991 | Not RCT; no influenza outcomes, n = only 16 |
| Levy 1996 | Not RCT, French economic evaluations of influenza vaccination |
| Lieberman 2003 | Not RCT; no intervention to increase vaccination rates. Discussion article about managing respiratory infections |
| Lindley 2006 | Not RCT, telephone survey of Medicare beneficiaries about vaccination rates |
| Loeser 1983 | Not RCT; report of computerised vaccination register for children in Montreal; no influenza outcomes |
| Lu 2005 | Not RCT, secondary analysis of 1989 to 2002 US National Health Interview Surveys for influenza vaccination rates in those aged ≥ 65 years, and factors predicting vaccination |
| Lynd 2005 | Not RCT, article about antivirals for influenza |
| Macdonald 1985 | Not RCT; mass campaign; children |
| Maciosek 2006 | Not RCT, literature review of cost‐effectiveness of influenza vaccination |
| Madlon‐Kay 1987 | Not RCT; audit of 8 preventive care items, but influenza not audited as seasonal administration |
| Mair 1974 | RCT with outcomes of antigenicity and reactogenicity. No intervention to increase vaccination rates |
| Malmvall 2007 | Not RCT; intervention to increase influenza vaccination rates: inhabitants aged ≥ 65 years in Jönköping County, Sweden; 1999 to 2001 baseline; 90% of GPs informed of vaccination campaign 2002; education meetings encouraging senior practice nurses to vaccinate seniors each year 2002 to 2005; cannot assess secular trend in rest of population |
| Mandel 1985 | Not RCT; audit of 9 preventive care items, but influenza not included |
| Mangione 2006 | Not RCT; secondary analysis of influenza vaccination status of random sample of 8661 participants with diabetes in 7 US health plans 2000 to 2001, and description of physician reminders, performance feedback, and structured care management |
| Mangtani 2006 | Not RCT, survey of attitudes to influenza vaccination of 844 community‐dwelling individuals ≥ 75 in the UK 2004 Medical Research Council Trial of Assessment and Management of Older People in the Community |
| Margolis 1988 | Not RCT; Veterans Affairs clinic in Minneapolis with participants in 3 subspecialty clinics as historical controls |
| Margolis 1992 | Not RCT; informational mailing to participants; standing vaccination orders; vaccination reminders on daily patient lists; walk‐in vaccination visits; no numbers from control clinic; comparator is 2 clinics "similar location" |
| Marra 2011 | RCT with random allocation of 12 communities in British Columbia to an intervention for pharmacists to offer influenza vaccination and 13 control communities, but no data on vaccination rates in control communities |
| Marsteller 2006 | Not RCT, secondary analysis of the Canadian 1999 National Nursing Home Survey of the influenza vaccination status of a random sample of 73,350 individuals aged ≥ 65 years in 1423 nursing facilities |
| Martinen 2004 | Not RCT; cohort; no control; managing congestive heart failure in long‐term care |
| Mayo 2004 | RCT. No intervention to increase vaccination rates. Study of perceived barriers for hospital participants to receiving influenza vaccination |
| McArthur 1999 | Not RCT. Survey of factors affecting vaccination rates in all 1520 Canadian long‐term care facilities in 1991 |
| McDonald 1984 | RCT; intervention to increase influenza vaccination rates: residents randomly allocated to receive computer analyses of patient charts with care reminders including CDC recommendations for influenza vaccination; influenza outcomes; no pre‐intervention baseline data |
| McDonald 1992 | RCT; intervention to increase influenza vaccination rates: computer‐generated influenza vaccination reminders; publication does not provide separate data for those aged < 60 years and ≥ 60 years, or baseline influenza vaccination data for year prior to intervention; unable to locate author |
| McKinney 1989 | Not RCT; survey of factors related to physician ordering of influenza vaccination in the Primary Care Clinic at Milwaukee County Medical Complex |
| McLeod 2001 | Not RCT, analysis of influenza outbreaks in seniors' lodges in Calgary 1997 to 2000 |
| Merkel 1994 | Not RCT; cohort; reminder data sheet; influenza vaccination baseline data available for only 75% of cohort; no control |
| Milman 2005 | Not RCT, no control group; effect of patient care team on influenza decisions |
| Mody 2005 | Not RCT; survey of infection control practices in nursing homes in southeast Michigan |
| Morrow 1995 | Not RCT; audit of 3 preventive items; no influenza data |
| Mosesso 2003 | Not RCT; prospective observational cohort study of influenza vaccination by emergency services in Pittsburgh |
| Mukamel 2001 | Not RCT, no control group, no influenza outcome data |
| Mulet Pons 1995 | Not RCT, telephone survey of influenza vaccination status of those aged ≥ 65 years in a health centre in Alicante, Spain, and reasons for refusing vaccination |
| Murphy 1996 | Not RCT; intervention to increase childhood 0 to 5 vaccination rates in an inner‐city Dublin family practice using postcard reminders and an improved vaccination record system |
| Métrailler 2003 | Not RCT; no intervention to increase vaccination rates |
| Müller 2005 | Not RCT, no intervention to increase vaccination rates |
| Nakatani 2002 | Not RCT; no intervention to increase vaccination rates. Inappropriate study design |
| Ndiaye 2005 | Not RCT. No intervention to increase vaccination rates. In this review, none of the results are presented for people aged 60 years or older ‐ summary just shows "high risk" and occasionally results for those younger than 65 years. |
| Nichol 1990 | Not RCT. Self reported vaccination status without validation |
| Nichol 1992 | No intervention to increase vaccination rates |
| Nichol 1998 | Not RCT |
| Nichol 2006 | No intervention to increase vaccination rates |
| Nicoleau 2001 | Not RCT |
| Nowalk 2004a | No intervention to increase vaccination rates |
| Nowalk 2004b | No intervention to increase vaccination rates |
| Nowalk 2004c | Not RCT; outcomes are office and patient factors associated with vaccination |
| Nowalk 2008 | Not RCT; data for those aged ≥ 60 years not separately identifiable |
| Nowalk 2012 | Not RCT; no data for those aged ≥ 60 years |
| Nowalk 2014 | Not RCT |
| O'Connor 1996 | RCT. No data for those ≥ 60 years |
| O'Connor 1998 | Not RCT; unable to extract vaccination data for target age group |
| O'Malley 2006 | No intervention to increase vaccination rates |
| O'Reilly 2002 | No intervention to increase vaccination rates |
| Ohmit 1995 | Not RCT |
| Ompad 2006 | Not RCT |
| Ornstein 1991 | Not influenza vaccination |
| Overhage 1996 | Not influenza vaccination |
| Padiyara 2011 | Not RCT |
| Parchman 2004 | No intervention to increase vaccination rates |
| Parry 2004 | Not RCT |
| Pasquarella 2003 | Not RCT |
| Patel 2004 | Not RCT; no data for those aged ≥ 60 years |
| Patel 2006 | No intervention to increase vaccination rates |
| Patriarca 1985 | Not RCT; no intervention to increase vaccination rates |
| Payaprom 2011 | Not RCT; cannot identify outcomes for those aged ≥ 60 years |
| Pearson 2005 | Not RCT |
| Piedra 1995 | Not RCT; no intervention to increase vaccination rates |
| Pleis 2002 | Not RCT |
| Ploeg 1994 | No intervention to increase influenza vaccination rates |
| Postma 2005 | Not RCT; no intervention to increase influenza vaccination rates |
| Prati 2012 | No influenza vaccination outcomes (only risk perception, efficacy, and self efficacy) |
| Puig‐Barberà 1999 | Not RCT |
| Quinley 2004 | No influenza vaccination outcomes |
| Rantz 2001 | No intervention to increase influenza vaccination rates |
| Reichert 2001 | No intervention to increase influenza vaccination rates |
| Resnick 2001 | Not RCT; no intervention to increase influenza vaccination rates |
| Ressel 2003 | Not RCT; no intervention to increase influenza vaccination rates |
| Retchin 1991 | Not RCT; no intervention to increase influenza vaccination rates |
| Rimple 2006 | Not RCT |
| Robare 2011 | Unable to extract vaccination data for target age group |
| Rodewald 1999 | Not target age group |
| Rodriguez 1993 | Not RCT |
| Rodriguez‐Rodriguez 2006 | No intervention to increase vaccination rates |
| Roffey 1998 | No intervention to increase vaccination rates |
| Russell 2000 | No intervention to increase vaccination rates |
| Rust 1999 | No intervention to increase vaccination rates |
| Ryan 1984 | No intervention to increase vaccination rates |
| Sambamoorthi 2005 | No intervention to increase vaccination rates |
| Sansom 2003 | No intervention to increase vaccination rates |
| Sarnoff 1998 | Not RCT |
| Schectman 1995 | No intervention to increase vaccination rates |
| Schensul 2009 | Unable to extract vaccination data for target age group |
| Schluter 1999 | Not RCT |
| Schmitz 1993a | Not RCT |
| Schmitz 1993b | Not RCT |
| Schneider 2001 | Not RCT |
| Schreiner 1988 | Not RCT |
| Schwartz 2006 | Not RCT |
| Schwarz 2005 | Not RCT |
| Scott 1996 | No intervention to increase vaccination rates |
| Setia 1985 | Not RCT |
| Shah 2006 | Not RCT |
| Shahrabani 2006 | No intervention to increase vaccination rates |
| Shank 1989 | Not RCT |
| Shenson 2005 | Not RCT. No intervention to increase vaccination rates |
| Shenson 2007 | No intervention to increase vaccination rates |
| Shenson 2011 | Not RCT |
| Shugarman 2006 | Not RCT |
| Siebers 1985 | Not influenza vaccination |
| Simor 2002 | No intervention to increase vaccination rates |
| Siriwardena 2003a | Not RCT |
| Slobodkin 1998 | Not RCT |
| Soljak 1987 | Not target age group |
| Song 2000 | Participants reported influenza vaccination by telephone and this was not independently validated [personal communication from author 2009]. We requested needed additional computations from author in November 2017 but have received no reply. |
| Stancliff 2000 | Not RCT; inappropriate age group |
| Stehr‐Green 1993 | Not target age group |
| Stenqvist 2006 | Not RCT |
| Steyer 2004 | Not RCT; no intervention to increase vaccination rates |
| Stott 1998 | No intervention to increase vaccination rates |
| Straits‐Troster 2006 | No intervention to increase vaccination rates |
| Stuart 1969 | No intervention to increase vaccination rates |
| Sylvan 2003 | Not RCT |
| Szilagyi 1992 | Not target age group |
| Szilagyi 2005 | No intervention to increase vaccination rates |
| Szilagyi 2006 | Not target age group |
| Szucs 2006 | No intervention to increase vaccination rates |
| Tabbarah 2005 | Not RCT. No intervention to increase vaccination rates |
| Tacken 2002 | Not RCT |
| Tape 1993 | Not RCT |
| Terrell‐Perica 2001 | Not possible to extract results for those aged ≥ 60 years |
| Tierney 2005 | Not possible to extract results for those aged ≥ 60 years |
| Tollestrup 1991 | Not target age group, not influenza vaccination |
| Toscani 2003 | No intervention to increase vaccination rates |
| Traeger 2006 | Not RCT |
| Trick 2009 | Not RCT |
| Tucker 1987 | Not RCT |
| Turner 1989 | Not RCT; not influenza vaccination |
| Turner 1990 | Not possible to extract outcomes by age group |
| Turner 2003 | Not RCT. No intervention to increase vaccination rates |
| Tymchuk 1991 | No intervention to increase vaccination rates |
| Usami 2009 | Influenza vaccination data collected through self report. |
| Van Amburgh 2001 | Not RCT |
| Van den Hooven 2006 | No intervention to increase vaccination rates |
| Van Essen 1997 | Not target age group |
| Van Hoof 2001 | Not RCT |
| Van Lieshout 2012 | Not RCT |
| Wadhwa 1997 | RCT; participants ≥ aged 65 years, but 57% of those in the phone arm were not contacted either by voice or machine, so excluded as unknown large risk of bias |
| Walker 1992 | Not RCT |
| Walsh 2012 | RCT; cannot separate outcome data for those aged ≥ 60 years |
| Wang 2005 | Not RCT. No intervention to increase vaccination rates |
| Warren 1995 | Not RCT. No intervention to increase vaccination rates |
| Watkinson 2004 | Not RCT |
| Weatherill 2004 | Not RCT |
| Weaver 2001 | Not RCT. The data for this study derive from an RCT; however, the focus of this article is a cost‐effectiveness analysis of a community‐based outreach initiative to promote pneumococcal and influenza vaccines for people aged 65 years or older. The full report of the RCT is presented in Krieger 2000. |
| Weaver 2003 | Not RCT. Cannot separate outcome data for those aged ≥ 60 years |
| Wee 2001 | Not RCT |
| Wei 2007 | No intervention to increase vaccination rates |
| Whelan 2013 | No influenza vaccination outcome data |
| While 2005 | Not RCT. No intervention to increase vaccination rates |
| Wiese‐Posselt 2006 | No intervention to increase vaccination rates |
| Wilkinson 2002 | Not target age group. This was a pilot study, and participants were randomly allocated to intervention; however, it was not possible to extract outcomes by age group. |
| Williams 1987 | Not RCT |
| Wilson 1989 | Not RCT |
| Winston 2006a | Not RCT |
| Winston 2006b | Not RCT |
| Wood 1998 | Not target age group |
| Worasathit 2015 | Not RCT |
| Wortley 2005 | Not RCT. No intervention to increase vaccination rates |
| Wray 2009 | RCT; intervention to increase influenza vaccination rates (vaccine safety message versus vaccine information statement); no influenza vaccination outcomes; cannot separate results for those aged ≥ 60 years |
| Wright 2011 | RCT; outcome data for those aged ≥ 60 years cannot be identified; we received no reply from e‐mail to author |
| Wuorenma 1994 | Not RCT. Not target age group |
| Yoo 2006 | Not RCT. No intervention to increase vaccination rates |
| Young 1980 | Not target age group |
| Zimmerman 2003a | No intervention to increase vaccination rates |
| Zimmerman 2003b | No intervention to increase vaccination rates |
| Zimmerman 2003c | Not RCT |
| Zimmerman 2004 | Not RCT. No intervention to increase vaccination rates |
| Zwar 2016 | RCT; aged 40 to 85 and cannot separate vaccination outcomes for those aged ≥ 60 years |
COPD: chronic obstructive pulmonary disease CDC: Centers for Disease Control and Prevention C‐RCT: cluster‐randomised controlled trial GP: general practitioner HMO: health maintenance organisation ILI: influenza‐like illness RCT: randomised controlled trial SD: standard deviation
Characteristics of studies awaiting assessment [ordered by study ID]
Hurley 2017.
| Methods | Randomised controlled trial |
| Participants | 5332 adults ≥ 65 years in Denver, Colorado |
| Interventions | An invitation for influenza, pneumococcal, or Tdap vaccination as indicated either from a centralised reminder and recall system (Colorado Immunization Information System) or by usual care |
| Outcomes | 32% of seniors in the centralised recall and 28.6% in the usual care group received influenza vaccine (P = 0.007). |
| Notes | We contacted authors to request additional data and information about study methods and risk of bias, but received no reply before publication of this update. |
Differences between protocol and review
None.
Contributions of authors
Roger E Thomas designed the review, assessed articles for inclusion, performed the analyses, and wrote the text. Diane L Lorenzetti assessed articles for inclusion and edited and approved the text.
Sources of support
Internal sources
None, Other.
External sources
No sources of support, Other.
Declarations of interest
Roger E Thomas: none known. Diane L Lorenzetti: none known.
Edited (no change to conclusions)
References
References to studies included in this review
Abramson 2011 {published data only}
- Abramson ZH, Avni O, Levi O, Miskin IN. Is the influenza vaccination rate of elderly patients affected by raising the vaccination rate of the staff at their primary health care clinics?. Israel Medical Association Journal 2011;13:325‐8. [PubMed] [Google Scholar]
- Abramson ZH, Avni O, Levi O, Miskin IN. Randomized trial of a program to increase staff influenza vaccination in primary care clinics. Annals of Family Medicine 2010;8:293‐8. [DOI: 10.1370/afm.1132] [DOI] [PMC free article] [PubMed] [Google Scholar]
Arthur 2002 {published data only}
- Arthur AJ, Matthews RJ, Jagger C, Clarke M, Hipkin A, Bennison DP. Improving uptake of influenza vaccination among older people: a randomised controlled trial. British Journal of General Practice 2002;52(482):717‐22. [PMC free article] [PubMed] [Google Scholar]
Baker 1998 {published data only (unpublished sought but not used)}
- Baker AM, McCarthy B, Gurley VF, Yood MU. Influenza immunization in a managed care organization. Journal of General Internal Medicine 1998;13(7):469‐75. [DOI] [PMC free article] [PubMed] [Google Scholar]
- Thomas RE [pers comm]. Baseline vaccination rates. AM Baker 20 September 2008 [no reply received].
Barnas 1989 {published data only}
- Barnas GP, McKinney WP. Postcard reminders and influenza vaccination. Journal of the American Geriatrics Society 1989;37(2):195. [DOI] [PubMed] [Google Scholar]
Beck 1997 {published data only}
- Beck A, Scott J, Williams P, Robertson B, Jackson D, Gade G, et al. A randomized controlled trial of group outpatient visits for chronically ill older HMO members: The Cooperative Health Care Clinic. Journal of the American Geriatrics Society 1997;45(5):543‐9. [DOI] [PubMed] [Google Scholar]
Berg 2008 {published data only}
- Berg GD, Silverstein S, Thomas E, Korn AM. Cost and utilization avoidance with mail prompts: a randomized controlled trial. American Journal of Managed Care 2008;14(11):748‐54. [PubMed] [Google Scholar]
Black 1993 {published and unpublished data}
- Black M [pers comm]. Request for community prevalence immunization rates and risk of bias. RE Thomas 20 August 2008.
- Black ME, Ploeg J, Walter SD, Hutchinson BG, Scott EA, Chambers LW. The impact of a public health nurse intervention on influenza vaccine acceptance. American Journal of Public Health 1993;83(12):1751‐3. [DOI] [PMC free article] [PubMed] [Google Scholar]
Boca 2012 {published data only}
- Boca B, Herrero E, Resino E, Torres V, Penades M, Andreu C. Impact of education program on influenza vaccination rates in Spain. American Journal of Managed Care 2012;18(12):e446‐52. [PubMed] [Google Scholar]
Buffington 1991 {published and unpublished data}
- Buffington J, Bell KM, LaForce FM. A target‐based model for increasing influenza immunizations in private practice. Genesee Hospital Medical Staff. Journal of General Internal Medicine 1991;6(3):204‐9. [DOI] [PubMed] [Google Scholar]
- LaForce M (pers comm). Vacination rates and study methods. E‐mail reply to: RE Thomas 18 August 2017.
- Thomas RE (pers comm). Vaccination rates and study methods. E‐mail to M Laforce 1 August 2017.
CDC 1995a (Wyoming) {published data only (unpublished sought but not used)}
- Centers for Disease Control and Prevention. McMahon JW, Hillman JR, McInerney M, Kileen MJ, Christensen C. Increasing influenza vaccination rates for Medicare beneficiaries ‐ Montana and Wyoming, 1994. Morbidity and Mortality Weekly Report 1995;44(40):741‐4. [PubMed] [Google Scholar]
- Thomas RE [pers comm]. Baseline vaccination rates, verification letters were received, study risk of bias. Email to: Dr JW McMahon 20 August 2008 [no reply received].
CDC 1995b (Montana) {published data only (unpublished sought but not used)}
- Centers for Disease Control and Prevention. McMahon JW, Hillman JR, McInerney M, Kileen MJ, Christensen C. Increasing influenza vaccination rates for Medicare beneficiaries ‐ Montana and Wyoming, 1994. Morbidity and Mortality Weekly Report 1995;44(40):741‐4. [PubMed] [Google Scholar]
- Thomas RE [pers comm]. Baseline vaccination rates, verification letters were received, study risk of bias. Email to: JW McMahon 20 August 2008 [no reply received].
Chambers 1991 {published data only}
- Chambers CV, Balaban DJ, Carlson BL, Grasberger DM. The effect of microcomputer‐generated reminders on influenza vaccination rates in a university‐based family practice center. Journal of the American Board of Family Practice 1991;4(1):19‐26. [PubMed] [Google Scholar]
Chan 2002 {published and unpublished data}
- Chan L [pers comm]. Baseline vaccination rates and study risk of bias. RE Thomas 3 November 2008.
- Chan L, MacLehose RF, Houck PM. Impact of physician reminders on the use of influenza vaccinations: a randomized trial. Archives of Physical Medicine and Rehabilitation 2002;83(3):371‐5. [DOI] [PubMed] [Google Scholar]
Clayton 1999 {published data only}
- Clayton AE, McNutt LA, Homestead HL, Hartman TW, Senecal S. Public health in managed care: a randomized controlled trial of the effectiveness of postcard reminders. American Journal of Public Health 1999;89(8):1235‐7. [DOI] [PMC free article] [PubMed] [Google Scholar]
Conner 2017 {published data only}
- Conner M, Sandberg T, Nekitsing C, Hutter R, Wood C, Jackson C, et al. Varying cognitive targets and response rates to enhance the question behaviour effect: an 8‐arm randomized controlled trial on influenza vaccination uptake. Social Science & Medicine 2017;180:135‐42. [DOI] [PubMed] [Google Scholar]
Dalby 2000 {published and unpublished data}
- Dalby DM, Sellors JW, Fraser FD, Fraser C, Ineveld C, Howard M. Effect of preventive home visits by a nurse on the outcomes of frail elderly people in the community: a randomized controlled trial. Canadian Medical Association Journal 2000;162(4):497‐500. [PMC free article] [PubMed] [Google Scholar]
- Howard M [pers comm]. Baseline vaccination rates, and study risk of bias. RE Thomas 5 September 2017.
Dapp 2011 {published data only}
- Dapp U [pers comm]. Baseline vaccination rates, study design, participants, interventions, results, and study risk of bias. RE Thomas 1 April 2013.
- Dapp U, Anders J, Renteln‐Kruse W, Meier‐Baumgartner HP. Active health promotion in old age: methodology of a preventive intervention programme provided by an interdisciplinary health advisory team for independent older people. Journal of Public Health 2005;13(3):122‐7. [Google Scholar]
- Dapp U, Anders JAM, Renteln‐Kruse W, Minder CE, Meier‐Baumgartner HP, Swift CG, et al. A randomized trial of effects of health risk appraisal combined with group sessions or home visits on preventive behaviors in older adults. Journal of Gerontology A Biological Medical Science 2011;66A(5):591‐8. [DOI] [PubMed] [Google Scholar]
Díaz Grávalos 1999 {published data only}
- Díaz Grávalos GJ, Palmeiro FG, Vazquez Fernandez LA, Casado Gorriz I, Fernandez Bernardez MA, Sobrado Palomares JR. Annual influenza vaccination. Causes of non‐compliance among patients aged over 65 years [Vacunación antigripal anual: causa de incumplimiento en mayores de 65 años]. Medifam ‐ Revisita de Medicina Familiar y Comunitaria 1999;9(4):222‐6. [Google Scholar]
Dietrich 1989 {published data only}
- Dietrich AJ, Duhamel M. Improving geriatric preventive care through a patient‐held checklist. Family Medicine 1989;21(3):195‐8. [PubMed] [Google Scholar]
Frank 2004 {published and unpublished data}
- Frank O [pers comm]. Baseline vaccination rates, results and study risk of bias. RE Thomas 23 August 2008.
- Frank O, Litt J, Beilby J. Opportunistic electronic reminders. Improving performance of preventive care in general practice. Australian Family Physician 2004;33(1‐2):87‐90. [PubMed] [Google Scholar]
Garcia‐Aymerich 2007 {published data only}
- Garcia‐Aymerich J, Hernandez C, Alonso A, Casas A, Rodriguez‐Roisin R, Anto JM, et al. Effects of an integrated care intervention on risk factors of COPD readmission. Respiratory Medicine 2007;101(7):1462‐9. [DOI] [PubMed] [Google Scholar]
Herman 1994 {published data only}
- Herman CJ, Speroff T, Cebul RD. Improving compliance with immunization in the older adult: results of a randomized cohort study. Journal of the American Geriatrics Society 1994;42(11):1154‐9. [DOI] [PubMed] [Google Scholar]
Hogg 1998 {published data only (unpublished sought but not used)}
- Hogg WE [pers comm]. Baseline vaccination rates. RE Thomas 15 December 2008.
- Hogg WE, Bass M, Calonge N, Crouch H, Satenstein G. Randomized controlled study of customized preventive medicine reminder letters in a community practice. Canadian Family Physician 1998;44:81‐8. [PMC free article] [PubMed] [Google Scholar]
Hogg 2008 {published and unpublished data}
- Hogg W, Lemelin J, Graham ID, Grimshaw J, Martin C, Moore L, et al. Improving prevention in primary care: evaluating the effectiveness of outreach facilitation. Family Practice 2008;25(1):40‐8. [DOI] [PubMed] [Google Scholar]
Hull 2002 {published and unpublished data}
- Hull S [pers comm]. Baseline vaccination rates, and study risk of bias. RE Thomas 20 August 2008.
- Hull S, Hagdrup N, Hart B, Griffiths C, Hennessy E. Boosting uptake of influenza immunisation: a randomised controlled trial of telephone appointing in general practice. British Journal of General Practice 2002;52(482):712‐6. [PMC free article] [PubMed] [Google Scholar]
Humiston 2011 {published data only}
- Humiston SG, Bennett NM, Long C, Eberly S, Arvelo L, Stankaitis J, et al. Increasing inner‐city adult influenza vaccination rates: a randomized controlled trial. Public Health Reports 2011;126(Suppl 2):39‐47. [DOI] [PMC free article] [PubMed] [Google Scholar]
Ives 1994 {published and unpublished data}
- Ives D [pers comm]. Baseline vaccination rates, results and study risk of bias. Thomas RE 19 August 2008.
- Ives DG, Lave JR, Traven ND, Kuller LH. Impact of Medicare reimbursement on influenza vaccination rates in the elderly. Preventive Medicine 1994;23(2):134‐41. [DOI] [PubMed] [Google Scholar]
Karuza 1995 {published data only}
- Karuza J, Calkins E, Feather J, Hershey CO, Katz L, Majeroni B. Enhancing physician adoption of practice guidelines. Dissemination of influenza vaccination guideline using a small‐group consensus process. Archives of Internal Medicine 1995;155(6):625‐32. [PubMed] [Google Scholar]
Kellerman 2000 {published data only}
- Kellerman RD, Allred CT, Frisch LE. Enhancing influenza immunization. Postcard and telephone reminders and the challenge of immunization site shift. Archives of Family Medicine 2000;9(4):368‐72. [DOI] [PubMed] [Google Scholar]
Kerse 1999 {published data only (unpublished sought but not used)}
- Kerse NM, Flicker L, Jolley D, Arroll B, Young D. Improving the health behaviours of elderly people: randomised controlled trial of a general practice education programme. BMJ 1999;319(7211):683‐7. [DOI] [PMC free article] [PubMed] [Google Scholar]
- Thomas RE [pers comm]. Baseline vaccination rates, results and study risk of bias. NM Kerse 28 August 2008.
Kiefe 2001 {published and unpublished data}
- Kiefe CI [pers comm]. Baseline vaccination rates, results and study risk of bias. RE Thomas 22 December 2008.
- Kiefe CI, Allison JJ, Williams OD, Person SD, Weaver MT, Weissman NW. Improving quality improvement using achievable benchmarks for physician feedback: a randomized controlled trial. JAMA 2001;285(22):2871‐9. [DOI] [PubMed] [Google Scholar]
Kim 1999 {published data only}
- Kim CS, Kristopaitis RJ, Stone E, Pelter M, Sandhu M, Weingarten SR. Physician education and report cards: do they make the grade? Results from a randomized controlled trial. American Journal of Medicine 1999;107(6):556‐60. [DOI] [PubMed] [Google Scholar]
Kouides 1998 {published data only}
- Kouides RW, Bennett NM, Lewis B, Cappuccio JD, Barker WH, LaForce FM. Performance‐based physician reimbursement and influenza immunization rates in the elderly. The Primary‐Care Physicians of Monroe County. American Journal of Preventive Medicine 1998;14(2):89‐95. [DOI] [PubMed] [Google Scholar]
- Kouides RW, Lewis B, Bennett NM, Bell KM, Barker WH, Black ER, et al. A performance‐based incentive program for influenza immunization in the elderly. American Journal of Preventive Medicine 1993;9:250‐4. [PubMed] [Google Scholar]
Krieger 2000 {published data only}
- Krieger JW, Castorina JS, Walls ML, Weaver MR, Ciske S. Increasing influenza and pneumococcal immunization rates: a randomized controlled study of a senior center‐based intervention. American Journal of Preventive Medicine 2000;18(2):123‐31. [DOI] [PubMed] [Google Scholar]
Kumar 1999 {published data only}
- Kumar S, Deichman RE, Sarkar I. Effect of physician‐specific mailouts aimed at increasing influenza immunization rates. Journal of the Louisiana State Medical Society 1999;151(11):558‐65. [PubMed] [Google Scholar]
Lemelin 2001 {published data only}
- Lemelin J, Hogg W, Baskerville N. Evidence to action: a tailored multifaceted approach to changing family physician practice patterns and improving preventive care. Canadian Medical Association Journal 2001;164(6):757‐63. [PMC free article] [PubMed] [Google Scholar]
Leung 2017 {published data only}
- Leung KC, Mui C, Chiu WY, Ng YY, Chen MHY, Ho PH, et al. Impact of patient education on influenza vaccine uptake among community‐dwelling elderly: a randomized controlled trial. Education Research 2017;32(5):455‐64. [DOI: 10.1093/her/cyx053] [DOI] [PubMed] [Google Scholar]
Lukasik 1987 {published data only}
- Lukasik MH, Pratt G. The telephone: an overlooked technology for prevention in family medicine. Canadian Family Physician 1987;33:1997‐2001. [PMC free article] [PubMed] [Google Scholar]
MacIntyre 2003 {published and unpublished data}
- MacIntyre CR, Kainer MA, Brown GV. A randomised, clinical trial comparing the effectiveness of hospital and community‐based reminder systems for increasing uptake of influenza and pneumococcal vaccine in hospitalised patients aged 65 years and over. Gerontology 2003;49(1):33‐40. [DOI] [PubMed] [Google Scholar]
- MacIntyre R [pers comm]. Baseline vaccination rates, results and study risk of bias. RE Thomas 9 September 2008.
Maglione 2002a {published data only}
- Maglione MA, Stone EG, Shekelle PG. Mass mailings have little effect on utilization of influenza vaccine among Medicare beneficiaries. American Journal of Preventive Medicine 2002;23(1):43‐6. [DOI] [PubMed] [Google Scholar]
Maglione 2002b {published data only}
- Maglione MA, Stone EG, Shekelle PG. Mass mailings have little effect on utilization of influenza vaccine among Medicare beneficiaries. American Journal of Preventive Medicine 2002;23(1):43‐6. [DOI] [PubMed] [Google Scholar]
Maglione 2002c {published data only}
- Maglione MA, Stone EG, Shekelle PG. Mass mailings have little effect on utilization of influenza vaccine among Medicare beneficiaries. American Journal of Preventive Medicine 2002;23(1):43‐6. [DOI] [PubMed] [Google Scholar]
Maglione 2002d {published data only}
- Maglione MA, Stone EG, Shekelle PG. Mass mailings have little effect on utilization of influenza vaccine among Medicare beneficiaries. American Journal of Preventive Medicine 2002;23(1):43‐6. [DOI] [PubMed] [Google Scholar]
Marrero 2006 {published and unpublished data}
- Marrero W [pers comm]. Baseline vaccination rates. RE Thomas 26 September 2008.
- Marrero W, Hernandez L, Garcia R, Gutierrez LM. Immunization program against influenza for adults 65 years or older at a community pharmacy in Puerto Rico. Puerto Rico Health Sciences Journal 2006;25(1):35‐42. [PubMed] [Google Scholar]
McCaul 2002 {published and unpublished data}
- McCaul KD [pers comm]. Baseline vaccination rates, results and study risk of bias. RE Thomas 21 August 2008.
- McCaul KD, Johnson RJ, Rothman AJ. The effects of framing and action instructions on whether older adults obtain flu shots. Health Psychology 2002;21(6):624‐8. [DOI] [PubMed] [Google Scholar]
McDowell 1986 {published data only}
- McDowell I, Newell C, Rosser W. A follow‐up study of patients advised to obtain influenza immunizations. Family Medicine 1990;22(4):303‐6. [PubMed] [Google Scholar]
- McDowell I, Newell C, Rosser W. Comparison of three methods of recalling patients for influenza vaccination. Canadian Medical Association Journal 1986;135(9):991‐7. [PMC free article] [PubMed] [Google Scholar]
Minor 2010 {published data only (unpublished sought but not used)}
- Minor D [pers comm]. Baseline vaccination rates, results and study risk of bias. RE Thomas 5 April 2013.
- Minor DS, Eubanks JT, Butler KR Jr, Wofford MR, Penman D, Replogle WH. Improving influenza vaccination rates by targeting individuals not seeking early seasonal vaccination. American Journal of Medicine 2010;123(11):1031‐5. [DOI] [PubMed] [Google Scholar]
Moran 1992 {published and unpublished data}
- Moran WP [pers comm]. Baseline vaccination rates, results and study risk of bias. RE Thomas 1 September 2008.
- Moran WP, Nelson K, Wofford JL, Velez R. Computer‐generated mailed reminders for influenza immunization: a clinical trial. Journal of General Internal Medicine 1992;7(5):535‐7. [DOI] [PubMed] [Google Scholar]
Moran 1995 {published data only}
- Moran WP, Wofford JL, Velez R. Assessment of influenza immunization of community elderly: illustrating the need for community level health information. Carolina Health Services Review 1995;3:21‐9. [Google Scholar]
Moran 1996 {published data only}
- Moran WP, Nelson K, Wofford JL, Velez R, Case LD. Increasing influenza immunization among high‐risk patients: education or financial incentive?. American Journal of Medicine 1996;101(6):612‐20. [DOI] [PubMed] [Google Scholar]
Morrissey 1995 {published data only}
- Morrissey JP, Harris RP, Kincade‐Norburn J, McLaughlin C, Garrett JM, Jackman AM, et al. Medicare reimbursement for preventive care: changes in performance of services, quality of life, and health care costs. Journal of the American Geriatric Society 1995;33(4):315‐31. [PubMed] [Google Scholar]
Mullooly 1987 {published data only}
- Mullooly JP. Increasing influenza vaccination among high‐risk elderly: a randomized controlled trial of a mail cue in an HMO setting. American Journal of Public Health 1987;77(5):626‐7. [DOI] [PMC free article] [PubMed] [Google Scholar]
Nexøe 1997 {published data only}
- Nexøe J, Kragstrup J, Ronne T. Impact of postal invitations and user fee on influenza vaccination rates among the elderly. A randomized controlled trial in general practice. Scandinavian Journal of Primary Health Care 1997;15(2):109‐12. [DOI] [PubMed] [Google Scholar]
Nuttall 2003 {published data only}
- Nuttall D. The influence of health professionals on the uptake of the influenza immunization. British Journal of Community Nursing 2003;8(9):391‐6. [DOI] [PubMed] [Google Scholar]
Puech 1998 {published data only}
- Puech M, Ward J, Lajoie V. Postcard reminders from GPs for influenza vaccine: are they more effective than an ad hoc approach?. Australian and New Zealand Journal of Public Health 1998;22(2):254‐6. [DOI] [PubMed] [Google Scholar]
Roca 2012 {published data only}
- Roca B, Herrero E, Resino E, Torres V, Penades M, Andreu C. Impact of education program on influenza vaccination rates in Spain. American Journal of Managed Care 2012;18(12):e446‐52. [PubMed] [Google Scholar]
Satterthwaite 1997 {published data only}
- Satterthwaite P. A randomised intervention study to examine the effect on immunisation coverage of making influenza vaccine available at no cost. New Zealand Medical Journal 1997;110(1038):58‐60. [PubMed] [Google Scholar]
Siriwardena 2002 {published data only}
- Siriwardena AN, Rashid A, Johnson MR, Dewey ME. Cluster randomised controlled trial of an educational outreach visit to improve influenza and pneumococcal immunisation rates in primary care. British Journal of General Practice 2002;52(482):735‐40. [PMC free article] [PubMed] [Google Scholar]
Smith 1999 {published data only}
- Smith DM, Zhou XH, Weinberger M, Smith F, McDonald RC. Mailed reminders for area‐wide influenza immunization: a randomized controlled trial. Journal of the American Geriatric Society 1999;47(1):1‐5. [DOI] [PubMed] [Google Scholar]
Spaulding 1991 {published data only}
- Spaulding SA, Kugler JP. Influenza immunization: the impact of notifying patients of high‐risk status. Journal of Family Practice 1991;33(5):495‐8. [PubMed] [Google Scholar]
Stuck 2015 {published data only}
- Stuck AE, Moser A, Mort U, Wirz U, Wyser J, Gillmann G, et al. Effect of health risk assessment and counselling on health behaviour and survival in older people: a pragmatic randomised trial. PLoS Medicine 2015;12(10):e1001889. [DOI: 10.1371/journal.pmed.1001889] [DOI] [PMC free article] [PubMed] [Google Scholar]
References to studies excluded from this review
Ahmed 2004 {published data only}
- Ahmed F, Friedman C, Franks A, Latts LM, Nugent EW, France EK, et al. Effect of the frequency of delivery of reminders and an influenza tool kit on increasing influenza vaccination rates among adults with high‐risk conditions. American Journal of Managed Care 2004;10:698‐702. [PubMed] [Google Scholar]
Alemi 1996 {published data only}
- Alemi F, Alemagno SA, Goldhagen J, Ash L, Finkelstein B, Lavin A, et al. Computer reminders improve on‐time immunization rates. Medical Care 1996;34(Suppl 10):45‐51. [DOI] [PubMed] [Google Scholar]
Alexy 1998 {published data only}
- Alexy BB, Elnitsky C. Rural mobile health unit: outcomes. Public Health Nursing 1998;15(1):3‐11. [DOI] [PubMed] [Google Scholar]
Allsup 2004 {published data only}
- Allsup S, Haycox A, Regan M, Gosney M. Is influenza vaccination cost effective for healthy people between ages 65 and 74 years? A randomised controlled trial. Vaccine 2004;23:639‐45. [DOI] [PubMed] [Google Scholar]
Anderson 1979 {published data only}
- Anderson C, Martin H. Effectiveness of patient recall system on immunization rates for influenza. Journal of Family Practice 1979;9(4):727‐30. [PubMed] [Google Scholar]
Armstrong 1999 {published data only}
- Armstrong K, Berlin M, Schwartz JS, Propert K, Ubel PA. Educational content and the effectiveness of influenza vaccination reminders. Journal of General Internal Medicine 1999;14(11):695‐8. [DOI] [PMC free article] [PubMed] [Google Scholar]
Arthur 2001 {published data only}
- Arthur AJ. The effect of health assessments by practice nurses on uptake of influenza vaccination among older people in the UK. Journal of Clinical Nursing 2001;10(5):716‐7. [DOI] [PubMed] [Google Scholar]
Bakare 2007 {published data only}
- Bakare M, Shrivastava R, Jeevanantham V, Navaneethan SD. Impact of two different models on influenza and pneumococcal vaccination in hospitalized patients. Southern Medical Journal 2007;100(2):140‐4. [DOI] [PubMed] [Google Scholar]
Balagué 1993 {published data only}
- Balagué GL, Ruiz Martinez MC, Mercade Mercade MA. The evaluation of an influenza vaccination campaign in a health sector. Atencion Primaria 1993;11(4):202. [PubMed] [Google Scholar]
Baldo 1999 {published data only}
- Baldo V, Menegon T, Buoro S, Scalici C, Vesco A, Peale S, et al. Vaccination against influenza in the elderly. Experience with adjuvant vaccines [Vaccinazione antinfluenzale in anziani. Esperienza con vaccini adiuvati]. Annali di Igiene 1999;11:369‐73. [PubMed] [Google Scholar]
Bardenheier 2005 {published data only}
- Bardenheier BH, Shefer A, McKibben L, Roberts H, Rhew D, Bratzler D. Factors predictive of increased influenza and pneumococcal vaccination coverage in long‐term care facilities: the CMS‐CDC Standing Orders Program Project. Journal of the American Medical Directors Association 2005;6(5):291‐9. [DOI] [PubMed] [Google Scholar]
Bardenheier 2010 {published data only}
- Bardenheier BH, Shefer AM, Remsburg RE, Marsteller JA. Are standing order programs associated with influenza vaccination? ‐ NNHS, 2004. Journal of the American Medical Directors Association 2010;11:654‐61. [DOI] [PubMed] [Google Scholar]
Bardenheier 2011 {published data only}
- Bardenheier B, Shefer A, Ahmed F, Remsburg R, Rowland Hogue CJ, Gravenstein S. Do vaccination strategies implemented in nursing homes narrow the racial gap in receipt of influenza vaccinations in the United States?. Journal of the American Geriatric Society 2011;59:687‐93. [DOI] [PMC free article] [PubMed] [Google Scholar]
Barker 1999 {published data only}
- Barker WH, Bennett NM, LaForce FM, Waltz EC, Weiner LB. "McFlu". The Monroe County, New York, Medicare vaccine demonstration. American Journal of Preventive Medicine 1999;16(Suppl 3):118‐27. [DOI] [PubMed] [Google Scholar]
Barton 1990 {published data only}
- Barton MB, Schoenbaum SC. Improving influenza vaccination performance in an HMO setting: the use of computer‐generated reminders and peer comparison feedback. American Journal of Public Health 1990;80(5):534‐6. [DOI] [PMC free article] [PubMed] [Google Scholar]
Beardsworth 2004 {published data only}
- Beardsworth A, Maxim R, Bertrand T. The power of coalition ‐ improving Rhode Island's adult immunization rate ‐ the Ocean State Adult Immunization Coalition. Medicine & Health, Rhode Island 2004;87(3):72‐4. [PubMed] [Google Scholar]
Becker 1989 {published data only}
- Becker DM, Gomez EB, Kaiser DL, Yoshihasi A, Hodge RH Jr. Improving preventive care at a medical clinic: how can the patient help?. American Journal of Preventive Medicine 1989;5(6):353‐9. [PubMed] [Google Scholar]
Bekker 2003 {published data only}
- Bekker HL, Gough D, Williams M. Attendance choices about the influenza immunization programme: evidence for targeting patients' beliefs. Psychology Health & Medicine 2003;8(3):279‐88. [Google Scholar]
Belcher 1990 {published data only}
- Belcher DW. Implementing preventive services. Success and failure in an outpatient trial. Archives of Internal Medicine 1990;150(12):2533‐41. [DOI] [PubMed] [Google Scholar]
Bennett 1994 {published data only}
- Bennett NM, Lewis B, Doniger AS, Bell K, Kouides R, LaForce FM, et al. A coordinated, community‐wide program in Monroe County, New York, to increase influenza immunization rates in the elderly. Archives of Internal Medicine 1994;154:1741‐5. [PubMed] [Google Scholar]
Berg 2004 {published data only (unpublished sought but not used)}
- Berg GD, Thomas E, Silverstein S, Neel CL, Mireles M. Reducing medical service utilization by encouraging vaccines: randomized controlled trial. American Journal of Preventive Medicine 2004;27(4):284‐8. [DOI] [PubMed] [Google Scholar]
Berg 2005 {published data only}
- Berg GD, Fleegler E, Vonno CJ, Thomas E. A matched‐cohort study of health services utilization for a heart failure disease management program. Disease Management 2005;8(1):35‐41. [DOI] [PubMed] [Google Scholar]
Birchmeier 2002 {published data only}
- Birchmeier M, Favrat B, Pecoud A, Abetel G, Karly M, Landry P, et al. Improving influenza vaccination rates in the elderly. Journal of Family Practice 2002;51(10):856. [PubMed] [Google Scholar]
Bloom 1988 {published data only}
- Bloom HG, Bloom JS, Krasnoff L, Frank AD. Increased utilization of influenza and pneumococcal vaccines in an elderly hospitalized population. Journal of the American Geriatrics Society 1988;36(10):897‐901. [DOI] [PubMed] [Google Scholar]
Bloom 1999 {published data only}
- Bloom HG, Wheeler DA, Linn J. A managed care organization's attempt to increase influenza and pneumococcal immunizations for older adults in an acute care setting. Journal of the American Geriatrics Society 1999;47(1):106‐10. [DOI] [PubMed] [Google Scholar]
Bond 2011 {published data only}
- Bond TC, Patel PR, Krisher J, Sauls L, Deans J, Strott K, et al. A group‐randomized evaluation of a quality improvement intervention to improve influenza vaccination rates in dialysis centers. American Journal of Kidney Disease 2011;57(2):283‐90. [DOI] [PubMed] [Google Scholar]
Bou‐Mias 2006 {published data only}
- Bou‐Mias C, Zwart‐Salmeron M, Calvet‐Freixas E, Bunuel‐Alvarez JC. Telephone recruitment for flu vaccination. Atencion Primaria 2006;37(3):176‐7. [DOI] [PMC free article] [PubMed] [Google Scholar]
Bovier 2001 {published data only}
- Bovier PA, Chamot E, Gallacchi MB, Loutan L. Importance of patients' perceptions and general practitioners' recommendations in understanding missed opportunities for immunisations in Swiss adults. Vaccine 2001;19(32):4760‐7. [DOI] [PubMed] [Google Scholar]
Brady 1988 {published data only}
- Brady WJ, Hissa DC, McConnell M, Wones RG. Should physicians perform their own quality assurance audits?. Journal of General Internal Medicine 1988;3(6):560‐5. [DOI] [PubMed] [Google Scholar]
Breen 2003 {published data only}
- Breen D. Pneumococcal vaccination programme in over 65s and at‐risk groups: the Dumfries and Galloway experience. Communicable Disease & Public Health 2003;6(3):228‐30. [PubMed] [Google Scholar]
Brimberry 1988 {published data only}
- Brimberry R. Vaccination of high‐risk patients for influenza. A comparison of telephone and mail reminder methods. Journal of Family Practice 1988;26(4):397‐400. [PubMed] [Google Scholar]
Browngoehl 1997 {published data only}
- Browngoehl K, Kennedy K, Krotki K, Mainzer H. Increasing immunization: a Medicaid managed care model. Pediatrics 1997;99:E4. [DOI] [PubMed] [Google Scholar]
Buchner 1987 {published and unpublished data}
- Buchner D [pers comm]. Baseline vaccination rates, verification letters were received, study risk of bias. RE Thomas 21 August 2008.
- Buchner DM, Larson EB, White RF. Influenza vaccination in community elderly. A controlled trial of postcard reminders. Journal of the American Geriatrics Society 1987;35(8):755‐60. [DOI] [PubMed] [Google Scholar]
Burns 2005 {published data only}
- Burns VE, Ring C, Carroll D. Factors influencing influenza vaccination uptake in an elderly, community‐based sample. Vaccine 2005;23(27):3604‐8. [DOI] [PubMed] [Google Scholar]
Call 2005 {published data only}
- Call SA, Vollenweider MA, Hornung CA, Simel DL, McKinney WP. Does this patient have influenza?. JAMA 2005;293(8):987‐97. [DOI] [PubMed] [Google Scholar]
Cardozo 1998 {published data only}
- Cardozo LJ, Steinberg J, Lepczyk MB, Binnus‐Emerick L, Cardozo YM, Aranha AN. Delivery of preventive healthcare to older African‐American patients: a performance comparison from two practice models. American Journal of Managed Care 1998;4(6):809‐16. [PubMed] [Google Scholar]
Carey 1991 {published data only}
- Carey TS, Levis D, Pickard CG, Bernstein J. Development of a model quality‐of‐care assessment program for adult preventive care in rural medical practices. Quality Review Bulletin 1991;17(2):54‐9. [DOI] [PubMed] [Google Scholar]
Carman 2000 {published data only}
- Carman WF, Elder AG, Wallace LA, McAulay K, Walker A, Murray GD, et al. Effects of influenza vaccination of health‐care workers on mortality of elderly people in long‐term care: a randomised controlled trial. Lancet 2000;355(9198):93‐7. [DOI] [PubMed] [Google Scholar]
Carter 1986 {published data only}
- Carter WB, Beach LR, Inui TS. The flu shot study: using multiattribute utility theory to design a vaccination intervention. Organizational Behavior & Human Decision Processes 1986;38(3):378‐91. [DOI] [PubMed] [Google Scholar]
CDC 2003 {published data only}
- Centers for Disease Control and Prevention. Facilitating influenza and pneumococcal vaccination through standing order programs. Morbidity and Mortality Weekly Report 2003;52(4):68‐9. [PubMed] [Google Scholar]
Chami 2012 {published data only}
- Chami K, Gavazzi G, Bar‐Hen A, Carrat F, Wazière B, Lejeune B, et al. A short‐term multicomponent infection control program in nursing homes: a cluster randomized controlled trial. Journal of the American Association of Medical Directors 2012;13:569.e9‐e17. [DOI] [PubMed] [Google Scholar]
Chan 1999 {published data only (unpublished sought but not used)}
- Chan L [pers comm]. Baseline vaccination rates, study risk of bias. RE Thomas 3 November 2008.
- Chan L, Doctor JN, MacLehose RF, Lawson H, Rosenblatt RA, Baldwin L, et al. Do Medicare patients with disabilities receive preventive services? A population‐based study. Archives of Physical Medicine & Rehabilitation 1999;80(6):642‐6. [DOI] [PubMed] [Google Scholar]
Charles 1994 {published data only}
- Charles J, Lewis J. Requiring elderly patients to give signed consent for influenza vaccine. Does it affect acceptance?. Canadian Family Physician 1994;40:474‐7. [PMC free article] [PubMed] [Google Scholar]
Chen 2007 {published data only}
- Chen JY, Fox SA, Cantrell CH, Stockdale SE, Kagawa‐Singer M. Health disparities and prevention: racial/ethnic barriers to flu vaccinations. Journal of Community Health 2007;32(1):5‐20. [DOI] [PubMed] [Google Scholar]
Cheney 1987 {published data only}
- Cheney C, Ramsdell JW. Effect of medical records' checklists on implementation of periodic health measures. American Journal of Medicine 1987;83(1):129‐36. [DOI] [PubMed] [Google Scholar]
Chi 2006 {published data only}
- Chi RC, Reiber GE, Neuzil KM. Influenza and pneumococcal vaccination in older veterans: results from the behavioral risk factor surveillance system. Journal of the American Geriatrics Society 2006;54(2):217‐23. [DOI] [PubMed] [Google Scholar]
Chodroff 1990 {published data only}
- Chodroff CH. Cancer screening and immunization quality assurance using a personal computer. Quality Review Bulletin 1990;16(8):279‐87. [DOI] [PubMed] [Google Scholar]
Christenson 2001 {published data only}
- Christenson B, Lundbergh P, Hedlund J, Ortqvisit A. Effects of a large‐scale intervention with influenza and 23‐valent pneumococcal vaccines in adults aged 65 years or older: a prospective study. Lancet 2001;357(9261):1008‐11. [DOI] [PubMed] [Google Scholar]
Clancy 2003 {published data only (unpublished sought but not used)}
- Clancy DE, Cope DW, Magruder KM, Huang P, Wolfman TE. Evaluating concordance to American Diabetes Association standards of care for type 2 diabetes through group visits in an uninsured or inadequately insured patient population. Diabetes Care 2003;26(7):2032‐6. [DOI] [PubMed] [Google Scholar]
Cohen 1982 {published data only}
- Cohen DI, Littenberg B, Wetzel C, Neuhauser D. Improving physician compliance with preventive medicine guidelines. Medical Care 1982;20(10):1040‐5. [DOI] [PubMed] [Google Scholar]
Cohen 2004 {published data only}
- Cohen D, Cicco‐Bloom B, Strickland PO, Headley A, Orzano J, Levine J, et al. Opportunistic approaches for delivering preventive care in illness visits. Preventive Medicine 2004;38(5):565‐73. [DOI] [PubMed] [Google Scholar]
Colombo 2005 {published data only}
- Colombo GL, Serra G, Morlotti L, Fara GM. The role of economic evaluation for the implementation of vaccination strategies [Ruolo della valutazione economica nell'implementazione di strategie vaccinali]. Annali di Igiene 2005;17(6):479‐90. [PubMed] [Google Scholar]
Correa‐de‐Araujo 2006 {published data only}
- Correa‐de‐Araujo R, McDermott K, Moy E. Gender differences across racial and ethnic groups in the quality of care for diabetes. Women's Health Issues 2006;16(2):56‐65. [DOI] [PubMed] [Google Scholar]
Costa 1994 {published data only}
- Costa TX, Rodriguez AA, Perez PN, Begines CM, Cabello Ortega RC, Romero GA. Influenza vaccination in high‐risk groups. Role of the nursing staff. Atencion Primaria 1994;13(5):256‐8. [PubMed] [Google Scholar]
Cowan 1992 {published data only}
- Cowan JA, Heckerling PS, Parker JB. Effect of a fact sheet reminder on performance of the periodic health examination: a randomized controlled trial. American Journal of Preventive Medicine 1992;8:104‐9. [PubMed] [Google Scholar]
Cowan 2006 {published data only}
- Cowan AE, Winston CA, Davis MM, Wortley PM, Clark SJ. Influenza vaccination status and influenza‐related perspectives and practices among US physicians. American Journal of Infection Control 2006;34(4):164‐9. [DOI] [PubMed] [Google Scholar]
Crawford 2005 {published data only}
- Crawford AG, Sikirica V, Goldfarb N, Popiel RG, Patel M, Wang C, et al. Interactive voice response reminder effects on preventive service utilization. American Journal of Medical Quality 2005;20(6):329‐36. [DOI] [PubMed] [Google Scholar]
Crawford 2011 {published data only}
- Crawford VLS, O'Hanlon A, McGee H. The effect of patient characteristics upon uptake of the influenza vaccination: a study comparing community‐based older adults in two healthcare systems. Age and Aging 2011;40:35‐41. [DOI] [PubMed] [Google Scholar]
Crouse 1994 {published data only}
- Crouse BJ, Nichol K, Peterson DC, Grimm MB. Hospital‐based strategies for improving influenza vaccination rates. Journal of Family Practice 1994;38(3):258‐61. [PubMed] [Google Scholar]
Curry 2006 {published data only}
- Curry E, Kerr N, Yang J, Briggs S. Influenza immunisation rate for 2005 and factors associated with receiving this vaccine in patients aged 65 years and over admitted to a general medical ward at Auckland City Hospital. New Zealand Medical Journal 2006;119(1243):U2254. [PubMed] [Google Scholar]
Daniels 2007 {published data only}
- Daniels NA, Juarbe T, Moreno‐John G, Perez‐Stable EJ. Effectiveness of adult vaccination programs in faith‐based organizations. Ethnicity and Disease 2007;17(1):S1. [PubMed] [Google Scholar]
Dannetun 2003 {published data only}
- Dannetun E, Tegnell A, Normann B, Garpenholt O, Giesecke J. Influenza vaccine coverage and reasons for non‐vaccination in a sample of people above 65 years of age, in Sweden, 1998‐2000. Scandinavian Journal of Infectious Diseases 2003;35(6‐7):389‐93. [DOI] [PubMed] [Google Scholar]
Davidse 1995 {published data only}
- Davidse W, Perenboom RJ. Increase of degree of vaccination against influenza in at‐risk patients by directed primary care invitation. Nederlands Tijdschrift Voor Geneeskunde 1995;139(42):2149‐52. [PubMed] [Google Scholar]
Davidson 1984 {published data only}
- Davidson RA, Fletcher SW, Retchin S, Duh S. A nurse‐initiated reminder system for the periodic health examination. Implementation and evaluation. Archives of Internal Medicine 1984;144(11):2167‐70. [PubMed] [Google Scholar]
Davis 2005 {published data only}
- Davis MM, Halasyamani LK, Sneller V‐P, Bishop KR, Clark SJ. Provider response to different formats of the adult immunization schedule. American Journal of Preventive Medicine 2005;29(1):34‐40. [DOI] [PubMed] [Google Scholar]
Denis 1996 {published data only}
- Denis B, Lambrechts T, Lambeau JL, Soetens G. Immunization against influenza among elderly in general practice. Louvain Medical 1996;115(1):12‐9. [Google Scholar]
Desbiens 2005 {published data only}
- Desbiens NA. A 5‐year experience with influenza prevention and containment in a program of all‐inclusive care for elderly adults. American Journal of Infection Control 2005;33(4):238‐42. [DOI] [PubMed] [Google Scholar]
De Wals 1989 {published data only}
- Wals P, Vienne A, Lemaire G, Tamigniau P, Demolin A, Hecquet P, et al. Acceptability of vaccination against influenza. Revue Medicale de Bruxelles 1989;10(1‐2):49‐52. [PubMed] [Google Scholar]
De Wals 1996 {published data only}
- Wals P, Carbonneau M, Payette H, Niyonsenga T. Influenza and pneumococcal vaccination in long term care facilities in two regions of Quebec. Canadian Journal of Infectious Diseases 1996;7(5):296‐300. [DOI] [PMC free article] [PubMed] [Google Scholar]
Dexter 2001 {published data only}
- Dexter PR, Perkins S, Overhage JM, Maharry K, Kohler RB, McDonald CJ. A computerized reminder system to increase the use of preventive care for hospitalized patients. New England Journal of Medicine 2001;345(13):965‐70. [DOI] [PubMed] [Google Scholar]
Dickey 1990 {published data only}
- Dickey LL, Petitti D. Assessment of a patient‐held minirecord for adult health maintenance. Journal of Family Practice 1990;31(4):431‐8. [PubMed] [Google Scholar]
Dickey 1992 {published data only}
- Dickey LL, Petitti D. A patient‐held minirecord to promote adult preventive care. Journal of Family Practice 1992;34(4):457‐63. [PubMed] [Google Scholar]
Dickey 1993 {published data only}
- Dickey LL. Promoting preventive care with patient‐held minirecords: a review. Patient Education & Counseling 1993;20(1):37‐47. [DOI] [PubMed] [Google Scholar]
Dini 1996 {published data only}
- Dini EF, Chaney M, Moolenaar RL, LeBaron CW. Information as intervention: how Georgia used vaccination coverage data to double public sector vaccination coverage in seven years. Journal of Public Health Management Practice 1996;2(1):45‐9. [DOI] [PubMed] [Google Scholar]
Donato 2007 {published data only}
- Donato AA, Motz LM, Wilson G, Lloyd BJ. Efficacy of multiple influenza vaccine delivery systems in a single facility. Infection Control & Hospital Epidemiology 2007;28(2):219‐21. [DOI] [PubMed] [Google Scholar]
Douglas 1990 {published data only}
- Douglas KC, Rush DR, O'Dell M, Monroe A, Ausmus M. Adult immunization in a network of family practice residency programs. Journal of Family Practice 1990;31(5):513‐20. [PubMed] [Google Scholar]
Earle 2003 {published data only}
- Earle CC, Burstein HJ, Winer EP, Weeks JC. Quality of non‐breast cancer health maintenance among elderly breast cancer survivors. Journal of Clinical Oncology 2003;21(8):1447‐51. [DOI] [PubMed] [Google Scholar]
Egido Polo 1989 {published data only}
- Egido Polo A, Abat Dinarés X, Marimon Amenos MR, Andujar Gallo A, Albiol Perelló M. Influenza vaccination: evaluation of an integrated program in a basic urban health area. Atencion Primaria 1989;6(8):578‐82. [PubMed] [Google Scholar]
Etkind 1996 {published data only}
- Etkind P, Simon M, Shannon S, Bottum C, Goldstein R, Werner B, et al. The impact of the Medicare Influenza Demonstration Project on influenza vaccination in a county in Massachusetts, 1988‐1992. Journal of Community Health 1996;21(3):199‐209. [DOI] [PubMed] [Google Scholar]
Evans 2003 {published data only}
- Evans MR, Watson PA. Why do older people not get immunised against influenza? A community survey. Vaccine 2003;21(19‐20):2421‐7. [DOI] [PubMed] [Google Scholar]
Fairbrother 1999 {published data only}
- Fairbrother G, Hanson KL, Friedman S, Butts GC. The impact of physician bonuses, enhanced fees, and feedback on childhood immunization coverage rates. American Journal of Public Health 1999;89(2):171‐5. [DOI] [PMC free article] [PubMed] [Google Scholar]
Fedson 1989 {published data only}
- Fedson DS. Prevention and control of influenza in institutional settings. Hospital Practice 1989;24(9A):87‐94. [PubMed] [Google Scholar]
Fedson 1994 {published data only}
- Fedson DS. Influenza and pneumococcal vaccination of the elderly: newer vaccines and prospects for clinical benefits at the margin. Preventive Medicine 1994;23(5):751‐5. [DOI] [PubMed] [Google Scholar]
Fedson 1996 {published data only}
- Fedson DS. Evaluating the impact of influenza vaccination: a North American perspective. Pharmacoeconomics 1996;9(Suppl 3):54‐61. [DOI] [PubMed] [Google Scholar]
Fernández Silvela 1994 {published data only}
- Fernández Silvela A, Lindoso López T, Valencia Barrera S, Alvarez Otero S, Alvarez Mazariegos JA. Influenza vaccination campaigns. A comparative evaluation [Campanas de vacunacion antigripal. Evaluacion comparativa]. Revisita de Enfermeria 1994;17(191‐2):13‐8. [PubMed] [Google Scholar]
Ferrante 2010 {published data only}
- Ferrante JM, Balasubramanian BA, Hudson SV, Crabtree BF. Principles of the patient‐centered medical home and preventive services delivery. Annals of Family Medicine 2010;8:108‐16. [DOI] [PMC free article] [PubMed] [Google Scholar]
Fiebach 1991 {published data only}
- Fiebach NH, Viscoli CM. Patient acceptance of influenza vaccination. American Journal of Medicine 1991;91(4):393‐400. [DOI] [PubMed] [Google Scholar]
Fishbein 2006a {published data only}
- Fishbein DB, Fontanesi J, Kopald D, Stevenson J, Bennett NM, Stryker DW, et al. Why do not patients receive influenza vaccine in December and January?. Vaccine 2006;24(6):798‐802. [DOI] [PubMed] [Google Scholar]
Fishbein 2006b {published data only}
- Fishbein DB, Willis BC, Cassidy WM, Marioneaux D, Winston CA. A comprehensive patient assessment and physician reminder tool for adult immunization: effect on vaccine administration. Vaccine 2006;25:3971‐83. [DOI] [PubMed] [Google Scholar]
Fisher 2003 {published data only}
- Fisher ES, Wennberg DE, Stukel TA, Gottlieb DJ, Lucas FL, Pinder EL. The implications of regional variations in Medicare spending. Part 1: the content, quality, and accessibility of care. Annals of Internal Medicine 2003;138(4):273‐87. [DOI] [PubMed] [Google Scholar]
Fitzner 2001 {published data only}
- Fitzner KA, Shortridge KF, McGhee SM, Hedley AJ. Cost‐effectiveness study on influenza prevention in Hong Kong. Health Policy 2001;56(3):215‐34. [DOI] [PubMed] [Google Scholar]
Fitzpatrick 2004 {published data only}
- Fitzpatrick F, Harrington P, Mahony D. The "silver‐haired" general medical services patient. Clinical activity of the non‐means tested over‐70's during their first six months. Irish Medical Journal 2004;97(4):111‐4. [PubMed] [Google Scholar]
Flach 2004 {published data only}
- Flach SD, McCoy KD, Vaughn TE, Ward MM, Boots Miller BJ, Doebbeling BN. Does patient‐centered care improve provision of preventive services?. Journal of General Internal Medicine 2004;19(10):1019‐26. [DOI] [PMC free article] [PubMed] [Google Scholar]
Fontanesi 2004 {published data only}
- Fontanesi J, Shefer AM, Fishbein DB, Bennett NM, Guire M, Kopald D, et al. Operational conditions affecting the vaccination of older adults. American Journal of Preventive Medicine 2004;26(4):265‐70. [DOI] [PubMed] [Google Scholar]
Fowles 1998 {published data only}
- Fowles JB, Beebe TJ. Failure to immunize the elderly: a systems problem or a statement of personal values?. Joint Commission Journal on Quality Improvement 1998;24(12):704‐10. [DOI] [PubMed] [Google Scholar]
Frame 1994 {published data only}
- Frame PS, Zimmer JG, Werth PL, Hall WJ, Eberly SW. Computer‐based vs manual health maintenance tracking. A controlled trial. Archives of Family Medicine 1994;3(7):581‐8. [DOI] [PubMed] [Google Scholar]
Francisco 2006 {published data only}
- Francisco PM, Donalisio MR, Barros MB, Cesar CL, Carandina L, Goldbaum M. Factors associated with vaccination against influenza in the elderly. Pan American Journal of Public Health 2006;19(4):259‐64. [DOI] [PubMed] [Google Scholar]
Frank 1985 {published data only}
- Frank JW, Henderson M, McMurray L. Influenza vaccination in the elderly: 1. Determinants of acceptance. Canadian Medical Association Journal 1985;132(4):371‐5. [PMC free article] [PubMed] [Google Scholar]
Frick 2004 {published data only}
- Frick KD, Scanlon DP, Bandeen‐Roche K, Kasper JD, Simonsick EM, Sullivan EM. Influenza vaccination by race among disabled community dwelling older women. Journal of Health Care for the Poor & Underserved 2004;15(2):220‐36. [DOI] [PubMed] [Google Scholar]
Furey 2001 {published data only}
- Furey A, Robinson E, Young Y. Improving influenza immunisation coverage in 2000‐2001: a baseline survey, review of the evidence and sharing of best practice. Communicable Disease & Public Health 2001;4(3):183‐7. [PubMed] [Google Scholar]
Galasso 1977 {published data only}
- Galasso GJ, Tyeryar FJ, M Jr. Overview of clinical trials of influenza vaccines, 1976. Journal of Infectious Diseases 1977;136(Suppl):425‐8. [DOI] [PubMed] [Google Scholar]
Ganguly 1989 {published data only}
- Ganguly R, Cameron D. Factors affecting immunization rate in a cohort of elderly veterans: a retrospective pilot study of influenza vaccine compliance. Vaccine 1989;7(5):462‐4. [DOI] [PubMed] [Google Scholar]
Ganguly 1995 {published data only}
- Ganguly R, Webster TB. Influenza vaccination in the elderly. Journal of Investigational Allergology & Clinical Immunology 1995;5(2):73‐7. [PubMed] [Google Scholar]
Gannon 2012 {published data only}
- Gannon M, Qaseem A, Snooks Q, Snow V. Improving adult immunization practices using a team approach in the primary care setting. American Journal of Public Health 102;7:e46‐52. [DOI] [PMC free article] [PubMed] [Google Scholar]
Garrett 2005 {published data only}
- Garrett DG, Bluml BM. Patient self‐management program for diabetes: first‐year clinical, humanistic, and economic outcomes. Journal of the American Pharmacists Association 2005;45(2):130‐7. [DOI] [PubMed] [Google Scholar]
Gauthey 1999 {published data only}
- Gauthey L, Toscani L, Chamot E, Larequi T, Robert CF. Influenza vaccination coverage in the geriatric population of the State of Geneva, Switzerland. European Journal of Public Health 1999;9(1):36‐40. [Google Scholar]
Gelfman 1986 {published data only}
- Gelfman DM, Witherspoon JM, Buchsbaum DG, Centor RM. Short‐term results of an immunization compliance program. Virginia Medical 1986;113(9):532‐4. [PubMed] [Google Scholar]
Gerace 1988 {published data only}
- Gerace TM, Sangster JF. Influenza vaccination: a comparison of two outreach strategies. Family Medicine 1988;20(1):43‐5. [PubMed] [Google Scholar]
Giles 2003 {published data only}
- Giles SG. A home based health check combined with influenza vaccination improved uptake of influenza vaccination in people >/= 75 years of age. Evidence‐Based Nursing 2003;6:52‐3. [PubMed] [Google Scholar]
Gill 2000 {published data only}
- Gill JM, Saldarriaga AM. The impact of a computerized physician reminder and a mailed patient reminder on influenza immunizations for older patients. Delaware Medical Journal 2000;72(10):425‐30. [PubMed] [Google Scholar]
Gill 2005 {published data only}
- Gill JM, Fagan HB, Townsend B, Mainous AG 3rd. Impact of providing a medical home to the uninsured: evaluation of a statewide program. Journal of Health Care for the Poor & Underserved 2005;16(3):515‐35. [DOI] [PubMed] [Google Scholar]
Goebel 2005 {published data only}
- Goebel LJ, Neitch SM, Mufson MA. Standing orders in an ambulatory setting increases influenza vaccine usage in older people. Journal of the American Geriatrics Society 2005;53(6):1008‐10. [DOI] [PubMed] [Google Scholar]
Grabenstein 1990 {published data only}
- Grabenstein JD, Smith LJ, Watson RR, Summers RJ. Immunization outreach using individual need assessments of adults at an army hospital. Public Health Reports 1990;105(3):311‐6. [PMC free article] [PubMed] [Google Scholar]
Grabenstein 1992 {published data only}
- Grabenstein JD, Hartzema AG, Guess HA, Johnston WP, Rittenhouse BE. Community pharmacists as immunization advocates. Cost‐effectiveness of a cue to influenza vaccination. Medical Care 1992;30(6):503‐13. [DOI] [PubMed] [Google Scholar]
Grabenstein 2001 {published data only}
- Grabenstein JD, Guess HA, Hartzema AG, Koch GG, Konrad TR. Effect of vaccination by community pharmacists among adult prescription recipients. Medical Care 2001;39(4):340‐8. [DOI] [PubMed] [Google Scholar]
Granollers 1993 {published data only}
- Granollers Mercarder S, Pont RA. Nurse care in primary health care: diagnosis and follow‐up of health problems [Cuidados de enfermeria en atencion primaria: diagnostico y seguimiento de problemas de salud]. Atencion Primaria 1993;11(2):64‐8. [PubMed] [Google Scholar]
Green 2003 {published data only}
- Green CA, Polen MR, Brody KK. Depression, functional status, treatment for psychiatric problems, and the health‐related practices of elderly HMO members. American Journal of Health Promotion 2003;17(4):269‐75. [DOI] [PubMed] [Google Scholar]
Greene 2001 {published data only}
- Greene J, Blustein J, Laflamme KA. Use of preventive care services, beneficiary characteristics, and Medicare HMO performance. Health Care Financing Review 2001;22(4):141‐53. [PMC free article] [PubMed] [Google Scholar]
Groll 2006 {published data only}
- Groll DL, Thomson DJ. Incidence of influenza in Ontario following the Universal Influenza Immunization Campaign. Vaccine 2006;24(24):5245‐50. [DOI] [PubMed] [Google Scholar]
Gutiérrez 2005 {published data only}
- Gutiérrez JP, Bertozzi SM. Influenza vaccination in the elderly population in Mexico: economic considerations [Vacunacion contra influenza para adultos mayores en Mexico: consideraciones economicas]. Salud Publica de Mexico 2005;47(3):234‐9. [DOI] [PubMed] [Google Scholar]
Gutschi 1998 {published data only}
- Gutschi LM, Vaillancourt R. Effect of pharmacist interventions on pneumococcal and influenza vaccination rates: a seamless care approach. Canadian Pharmaceutical Journal 1998;131(8):32‐8. [Google Scholar]
Hahn 1990 {published data only}
- Hahn DL, Berger MG. Implementation of a systematic health maintenance protocol in a private practice. Journal of Family Practice 1990;31(5):492‐502. [PubMed] [Google Scholar]
Halliday 2003 {published data only}
- Halliday L, Thomson JA, Roberts L, Bowen S, Mead C. Influenza vaccination of staff in aged care facilities in the ACT: how can we improve the uptake of influenza vaccine?. Australian and New Zealand Journal of Public Health 2003;27(1):70. [DOI] [PubMed] [Google Scholar]
Hanna 2001 {published data only}
- Hanna JN, Young DM, Brookes DL, Dostie BG, Murphy DM. The initial coverage and impact of the pneumococcal and influenza vaccination program for at‐risk indigenous adults in Far North Queensland. Australian and New Zealand Journal of Public Health 2001;25(6):543‐6. [DOI] [PubMed] [Google Scholar]
Hannah 2005 {published data only}
- Hannah KL, Schade CP, Cochran R, Brehm JG. Promoting influenza and pneumococcal immunization in older adults. Joint Commission Journal on Quality & Patient Safety 2005;31(5):286‐93. [DOI] [PubMed] [Google Scholar]
Harari 2008 {published data only}
- Harari D, Iliffe S, Kharicha K, Egger M, Gillman G, Renteln‐Kruse W, et al. Promotion of health in older people: a randomised controlled trial of health risk appraisal in British general practice. Age and Ageing 2008;37:565–71. [DOI] [PubMed] [Google Scholar]
Harbarth 1998 {published data only}
- Harbarth S, Siegrist C, Schira J, Wunderli W, Pittet D. Influenza immunization: improving compliance of healthcare workers. Infection Control and Hospital Epidemiology 1998;19:337–42. [DOI] [PubMed] [Google Scholar]
Harris 1990 {published data only}
- Harris RP, O'Malley MS, Fletcher SW, Knight BP. Prompting physicians for preventive procedures: a five‐year study of manual and computer reminders. American Journal of Preventive Medicine 1990;6(3):145‐52. [PubMed] [Google Scholar]
Harris 2006 {published data only}
- Harris LM, Chin NP, Fiscella K, Humiston S. Barrier to pneumococcal and influenza vaccinations in Black elderly communities: mistrust. Journal of the National Medical Association 2006;98(10):1678‐84. [PMC free article] [PubMed] [Google Scholar]
Hedlund 2003 {published data only}
- Hedlund J, Christenson B, Lundbergh P, Ortqvisit A. Effects of a large‐scale intervention with influenza and 23‐valent pneumococcal vaccines in elderly people: a 1‐year follow‐up. Vaccine 2003;21(25‐6):3906‐11. [DOI] [PubMed] [Google Scholar]
Henk 1975 {published data only}
- Henk M, Froom J. Outreach by primary‐care physicians. JAMA 1975;233(3):256‐9. [PubMed] [Google Scholar]
Hermiz 2002 {published data only}
- Hermiz O, Comino E, Marks G, Daffurn K, Wilson S, Harris M. Randomised controlled trial of home based care of patients with chronic obstructive pulmonary disease. BMJ 2002;325(7370):938. [DOI] [PMC free article] [PubMed] [Google Scholar]
Herrett 2016 {published data only}
- Herrett E, Williamson E, Staa T, Ranopa M, Free C, Chadborn T, et al. Text messaging reminders for influenza vaccine in primary care: a cluster randomised controlled trial (TXT4FLUJAB). BMJ Open 2016;6(2):e010069. [DOI: 10.1136/bmjopen-2015-010069] [DOI] [PMC free article] [PubMed] [Google Scholar]
Hirdes 2006 {published data only}
- Hirdes JP, Dalby DM, Knight SR, Iain CG, Bernabei R, Morris JN, et al. Predictors of influenza immunization among home care clients in Ontario. Canadian Journal of Public Health 2006;97(4):335‐9. [DOI] [PMC free article] [PubMed] [Google Scholar]
Hoey 1982 {published data only}
- Hoey JR, McCallum HP, Lepage EM. Expanding the nurse's role to improve preventive service in an outpatient clinic. Canadian Medical Association Journal 1982;127(1):27‐8. [PMC free article] [PubMed] [Google Scholar]
Honkanen 1996 {published data only}
- Honkanen PO, Keistinen T, Kivela SL. Factors associated with influenza vaccination coverage among the elderly: role of health care personnel. Public Health 1996;110(3):163‐8. [DOI] [PubMed] [Google Scholar]
Honkanen 1997 {published data only}
- Honkanen PO, Keistinen T, Kivela SL. The impact of vaccination strategy and methods of information on influenza and pneumococcal vaccination coverage in the elderly population. Vaccine 1997;15(3):317‐20. [DOI] [PubMed] [Google Scholar]
Honkanen 2006 {published data only}
- Honkanen P, Laara E, Pyhala R, Kivela SL, Helena MP. Comparison of two vaccination programmes in preventing influenza‐related hospitalization among the elderly during two consecutive seasons. Scandinavian Journal of Infectious Diseases 2006;38(6‐7):506‐11. [DOI] [PubMed] [Google Scholar]
Humair 2002 {published data only}
- Humair J‐P, Buchs CR, Stalder H. Promoting influenza vaccination of elderly patients in primary care. Family Practice 2002;19(4):383‐9. [DOI] [PubMed] [Google Scholar]
Hutchinson 1995 {published data only}
- Hutchinson HL, Norman LA. Compliance with influenza immunization: a survey of high‐risk patients at a family medicine clinic. Journal of the American Board of Family Practice 1995;8:448–51. [PubMed] [Google Scholar]
Hutchison 1991 {published data only}
- Hutchison BG, Shannon HS. Effect of repeated annual reminder letters on influenza immunization among elderly patients. Journal of Family Practice 1991;33(2):187‐9. [PubMed] [Google Scholar]
Hutt 2010 {published data only}
- Hutt E, Radcliff TA, Oman KS, Fink R, Ruscin M, Linnebur S, et al. Impact of NHAP guideline implementation intervention on staff and resident vaccination rates. Journal of the American Medical Directors Association 2010;11:365‐70. [DOI] [PubMed] [Google Scholar]
- Hutt E, Ruscin M, Linnebur SA, Fish DN, Oman KS, Fink RM, et al. A multifaceted intervention to implement guidelines did not affect hospitalization rates for nursing‐home acquired pneumonia. Journal of the American Medical Directors Association 2011;12:499‐507. [DOI] [PubMed] [Google Scholar]
Jacobs 2001 {published data only}
- Jacobs EA, Lauderdale DS, Meltzer D, Shorey JM, Levinson W, Thisted RA. Impact of interpreter services on delivery of health care to limited‐English‐proficient patients. Journal of General Internal Medicine 2001;16(7):468‐74. [DOI] [PMC free article] [PubMed] [Google Scholar]
Jain 1998 {published data only}
- Jain S, Avins AL, Mendelson T. Preventive health services and access to care for male veterans compared with their spouses. Western Journal of Medicine 1998;168(6):499‐503. [PMC free article] [PubMed] [Google Scholar]
Jans 2000 {published data only}
- Jans MP, Schellevis FG, Hensbergen W, Eijk JT. Improving general practice care of patients with asthma or chronic obstructive pulmonary disease: evaluation of a quality system. Effective Clinical Practice 2000;3(1):16‐24. [PubMed] [Google Scholar]
Jefferson 1996 {published data only}
- Jefferson T, Demicheli V. Economic evaluation of influenza vaccination and economic modelling. Can results be pooled?. Pharmacoeconomics 1996;9(Suppl 3):67‐72. [DOI] [PubMed] [Google Scholar]
Jiménez‐Garcia 2007 {published data only}
- Jiménez‐Garcia R, Rinez‐Fernandez MC, Hernandez‐Barrera V, Garcia‐Carballo MM, Miguel AG, Carrasco‐Garrido P. Compliance with influenza and pneumococcal vaccination among patients with chronic obstructive pulmonary disease consulting their medical practitioners in Catalonia, Spain. Journal of Infection 2007;54(1):65‐74. [DOI] [PubMed] [Google Scholar]
Jin 2003 {published data only}
- Jin Y, Carriere KC, Predy G, Johnson DH, Marrie TJ. The association between influenza immunization coverage rates and hospitalization for community‐acquired pneumonia in Alberta. Canadian Journal of Public Health 2003;94(5):341‐5. [DOI] [PMC free article] [PubMed] [Google Scholar]
Johnson 2005 {published data only}
- Johnson EA, Webb WL, McDowall JM, Chasson LL, Oser CS, Grandpre JR, et al. A field‐based approach to support improved diabetes care in rural states. Preventing Chronic Disease 2005;2(4):1‐9. [PMC free article] [PubMed] [Google Scholar]
Kassam 2001 {published data only}
- Kassam R, Farris KB, Burback L, Volume CI, Cox CE, Cave A. Pharmaceutical care research and education project: pharmacists' interventions. Journal of the American Pharmaceutical Association 2001;41(3):401‐10. [DOI] [PubMed] [Google Scholar]
Kelly 1988 {published data only}
- Kelly SD. The impact of a microcomputer on a general practice immunisation clinic. Practitioner 1988;232(1443):197, 200‐1. [PubMed] [Google Scholar]
Kemper 1993 {published data only}
- Kemper KJ, Goldberg H. Do computer‐generated reminder letters improve the rate of influenza immunization in an urban pediatric clinic?. American Journal of Diseases of Children 1993;147(7):717‐8. [DOI] [PubMed] [Google Scholar]
Kendal 1985 {published data only}
- Kendal AP, Patriarca PA, Arden NH. Policies and outcomes for control of influenza among the elderly in the USA. Vaccine 1985;3(3):274‐6. [DOI] [PubMed] [Google Scholar]
Kennedy 1994 {published data only}
- Kennedy KM, Browngoehl K. A "high‐tech," "soft‐touch" immunization program for members of a Medicaid managed care organization. HMO Practice 1994;8(3):115‐20, 21. [PubMed] [Google Scholar]
Kern 1990 {published data only}
- Kern DE, Harris WL, Boekeloo BO, Barker LR, Hogeland P. Use of an outpatient medical record audit to achieve educational objectives: changes in residents' performances over six years. Journal of General Internal Medicine 1990;5(3):218‐24. [DOI] [PubMed] [Google Scholar]
Klachko 1989 {published data only}
- Klachko DM, Wright DL, Gardner DW. Effect of a microcomputer‐based registry on adult immunizations. Journal of Family Practice 1989;29(2):169‐72. [PubMed] [Google Scholar]
Knoell 1991 {published data only}
- Knoell KR, Leeds AL. Influenza vaccination program for elderly outpatients. American Journal of Hospital Pharmacy 1991;48(2):256‐9. [PubMed] [Google Scholar]
Korn 1988 {published data only}
- Korn JE, Schlossberg LA, Rich EC. Improved preventive care following an intervention during an ambulatory care rotation: carryover to a second setting. Journal of General Internal Medicine 1988;3(2):156‐60. [DOI] [PubMed] [Google Scholar]
Kosiak 2006 {published data only}
- Kosiak B, Sangl J, Correa‐de‐Araujo R. Quality of health care for older women: what do we know?. Women's Health Issues 2006;16(2):89‐99. [DOI] [PubMed] [Google Scholar]
Kunze 1998 {published data only}
- Kunze M. The contribution of social medicine to vaccination in Austria. Wiener Medizinische Wochenschrift 1998;148(8‐9):191‐7. [PubMed] [Google Scholar]
Kwong 2006 {published data only}
- Kwong JC, Sambell C, Johansen H, Stukel TA, Manuel DG. The effect of universal influenza immunization on vaccination rates in Ontario. Health Reports 2006;17(2):31‐40. [PubMed] [Google Scholar]
Kyaw 2002 {published data only}
- Kyaw MH, Wayne B, Chalmers J, Jones IG, Campbell H. Influenza and pneumococcal vaccine distribution and use in primary care and hospital settings in Scotland: coverage, practice and policies. Epidemiology & Infection 2002;128(3):445‐55. [DOI] [PMC free article] [PubMed] [Google Scholar]
Landis 1995 {published data only}
- Landis S, Scarbrough ML. Using a vaccine manager to enhance in‐hospital vaccine administration. Journal of Family Practice 1995;41(4):364‐9. [PubMed] [Google Scholar]
Landon 2004 {published data only}
- Landon BE, Zaslavsky AM, Bernard SL, Cioffi MJ, Cleary PD. Comparison of performance of traditional Medicare vs Medicare managed care. JAMA 2004;291(14):1744‐52. [DOI] [PubMed] [Google Scholar]
Larson 1979 {published data only}
- Larson EB, Olsen E, Cole W, Shortell S. The relationship of health beliefs and a postcard reminder to influenza vaccination. Journal of Family Practice 1979;8(6):1207‐11. [PubMed] [Google Scholar]
Larson 1982 {published and unpublished data}
- Larson EB, Bergman J, Heidrich F, Alvin BL, Schneeweiss R. Do postcard reminders improve influenza compliance? A prospective trial of different postcard "cues". Medical Care 1982;20(6):639‐48. [DOI] [PubMed] [Google Scholar]
Lau 2006 {published data only}
- Lau JTF, Yang X, Tsui HY, Kim JH. Prevalence of influenza vaccination and associated factors among community‐dwelling Hong Kong residents of age 65 or above. Vaccine 2006;24(26):5526‐34. [DOI] [PubMed] [Google Scholar]
Lawson 2000 {published data only}
- Lawson F, Baker V, Au D, McElhaney JE. Standing orders for influenza vaccination increased vaccination rates in inpatient settings compared with community rates. Journals of Gerontology Series A‐Biological Sciences & Medical Sciences 2000;55(9):522‐6. [DOI] [PubMed] [Google Scholar]
Lazorik 2001 {published data only}
- Lazorik D. The role of emergency nurses in the prevention and control of influenza and pneumococcal disease. Journal of Emergency Nursing 2001;27(5):454‐60. [DOI] [PubMed] [Google Scholar]
LeBaron 1997 {published data only}
- LeBaron CW, Chaney M, Baughman AL, Dini EF, Maes E, Dietz V, et al. Impact of measurement and feedback on vaccination coverage in public clinics, 1988‐1994. JAMA 1997;277(8):631‐5. [PubMed] [Google Scholar]
Lee 2003 {published data only (unpublished sought but not used)}
- Lee SS. Is the use of physician reminder sticker on medical records effective for improving the rate of recommending influenza vaccination?. Korean Academy of Family Medicine 2003;24(8):715‐20. [Google Scholar]
Lees 2005 {published data only}
- Lees KA, Wortley PM, Coughlin SS. Comparison of racial/ethnic disparities in adult immunization and cancer screening. American Journal of Preventive Medicine 2005;29(5):404‐11. [DOI] [PubMed] [Google Scholar]
Leirer 1989 {published data only}
- Leirer VO, Morrow DG, Pariante G, Doksum T. Increasing influenza vaccination adherence through voice mail. Journal of the American Geriatrics Society 1989;37(12):1147‐50. [DOI] [PubMed] [Google Scholar]
Leirer 1991 {published data only}
- Leirer VO, Morrow DG, Tanke ED, Pariante GM. Elders' nonadherence: its assessment and medication reminding by voice mail. Gerontologist 1991;31(4):514‐20. [DOI] [PubMed] [Google Scholar]
Levy 1996 {published data only}
- Levy E. French economic evaluations of influenza and influenza vaccination. Pharmacoeconomics 1996;9(Suppl 3):62‐6. [DOI] [PubMed] [Google Scholar]
Lieberman 2003 {published data only}
- Lieberman D, Lieberman D. Management of respiratory infections in the elderly. Expert Review of Antiinfective Therapy 2003;1(3):505‐16. [DOI] [PubMed] [Google Scholar]
Lindley 2006 {published data only}
- Lindley MC, Wortley PM, Winston CA, Bardenheier BH. The role of attitudes in understanding disparities in adult influenza vaccination. American Journal of Preventive Medicine 2006;31(4):281‐5. [DOI] [PubMed] [Google Scholar]
Loeser 1983 {published data only}
- Loeser H, Zvagulis I, Hercz L, Pless IB. The organization and evaluation of a computer‐assisted, centralized immunization registry. American Journal of Public Health 1983;73(11):1298‐301. [DOI] [PMC free article] [PubMed] [Google Scholar]
Lu 2005 {published data only}
- Lu P‐J, Singleton JA, Rangel MC, Wortley PM, Bridges CB. Influenza vaccination trends among adults 65 years or older in the United States, 1989‐2002. Archives of Internal Medicine 2005;165(16):1849‐56. [DOI] [PubMed] [Google Scholar]
Lynd 2005 {published data only}
- Lynd LD, Goeree R, O'Brien BJ. Antiviral agents for influenza: a comparison of cost‐effectiveness data. Pharmacoeconomics 2005;23(11):1083‐106. [DOI] [PubMed] [Google Scholar]
Macdonald 1985 {published data only}
- Macdonald H, Roder D. The planning, implementation and evaluation of an immunization promotion campaign in South Australia. Hygiene 1985;4(2):13‐7. [PubMed] [Google Scholar]
Maciosek 2006 {published data only}
- Maciosek MV, Solberg LI, Coffield AB, Edwards NM, Goodman MJ. Influenza vaccination health impact and cost effectiveness among adults aged 50 to 64 and 65 and older. American Journal of Preventive Medicine 2006;31(1):72‐9. [DOI] [PubMed] [Google Scholar]
Madlon‐Kay 1987 {published data only}
- Madlon‐Kay DJ. Improving the periodic health examination: use of a screening flow chart for patients and physicians. Journal of Family Practice 1987;25(5):470‐3. [PubMed] [Google Scholar]
Mair 1974 {published data only}
- Mair HJ, Sansome DA, Tillett HE. A controlled trial of inactivated monovalent influenza A vaccines in general practice. Journal of Hygiene 1974;73(2):317‐27. [DOI] [PMC free article] [PubMed] [Google Scholar]
Malmvall 2007 {published data only}
- Malmvall BE, Franzen I, Abom PE, Hugosson MB. The rate of influenza immunization to people aged 65 years and older was increased from 45% to 70% by a primary health care‐based multiprofessional approach. Quality Management in Health Care 2007;16(1):51‐9. [PubMed] [Google Scholar]
Mandel 1985 {published data only}
- Mandel I, Franks P, Dickinson J. Improving physician compliance with preventive medicine guidelines. Journal of Family Practice 1985;21(3):223‐4. [PubMed] [Google Scholar]
Mangione 2006 {published data only}
- Mangione CM, Gerzoff RB, Williamson DF, Steers WN, Kerr EA, Brown AF, et al. The association between quality of care and the intensity of diabetes disease management programs. Annals of Internal Medicine 2006;145(2):107‐16. [DOI] [PubMed] [Google Scholar]
Mangtani 2006 {published data only}
- Mangtani P, Breeze E, Stirling S, Hanciles S, Kovats S, Fletcher A. Cross‐sectional survey of older peoples' views related to influenza vaccine uptake. BMC Public Health 2006;6:249. [DOI] [PMC free article] [PubMed] [Google Scholar]
Margolis 1988 {published data only}
- Margolis KL, Lofgren RP, Korn JE. Organizational strategies to improve influenza vaccine delivery. A standing order in a general medicine clinic. Archives of Internal Medicine 1988;148(10):2205‐7. [PubMed] [Google Scholar]
Margolis 1992 {published data only}
- Margolis KL, Nichol KL, Wuorenma J, Sternberg TL. Exporting a successful influenza vaccination program from a teaching hospital to a community outpatient setting. Journal of the American Geriatrics Society 1992;40(10):1021‐3. [DOI] [PubMed] [Google Scholar]
Marra 2011 {published data only}
- Marra F, Marra C, Kaczorowski J, Gastonguay L. Pharmacy‐based immunization in rural communities strategy (PhICS): interim results. Canadian Pharmacists Journal 2011;14(5):e17. [DOI] [PMC free article] [PubMed] [Google Scholar]
Marsteller 2006 {published data only}
- Marsteller JA, Tiggle R, Remsburg R, Shefer A, Bardenheier B. Influenza immunization in nursing homes: who does not get immunized and whose status is unknown?. Infection Control & Hospital Epidemiology 2006;27(4):388‐96. [DOI] [PubMed] [Google Scholar]
Martinen 2004 {published data only}
- Martinen M, Freundl M. Managing congestive heart failure in long‐term care. Journal of Gerontological Nursing 2004;30(12):5‐12. [DOI] [PubMed] [Google Scholar]
Mayo 2004 {published data only}
- Mayo AM, Cobler S. Flu vaccines and patient decision making: what we need to know. Journal of the American Academy of Nurse Practitioners 2004;16(9):402‐10. [DOI] [PubMed] [Google Scholar]
McArthur 1999 {published data only}
- McArthur MA, Simor AE, Campbell B, McGeer A. Influenza vaccination in long‐term‐care facilities: structuring programs for success. Infection Control and Hospital Epidemiology 1999;20(7):499‐503. [DOI] [PubMed] [Google Scholar]
McDonald 1984 {published data only}
- McDonald CJ, Hui SL, Smith DM, Tierney WM, Cohen SJ, Weinberger M, et al. Reminders to physicians from an introspective computer medical record. A two‐year randomized trial. Annals of Internal Medicine 1984;100(1):130‐8. [DOI] [PubMed] [Google Scholar]
McDonald 1992 {published data only (unpublished sought but not used)}
- McDonald CJ, Hui SL, Tierney WM. Effects of computer reminders for influenza vaccination on morbidity during influenza epidemics. MD Computing: Computers in Medical Practice 1992;9(5):304‐12. [PubMed] [Google Scholar]
McKinney 1989 {published data only}
- McKinney WP, Barnas GP. Influenza immunization in the elderly: knowledge and attitudes do not explain physician behavior. American Journal of Public Health 1989;79(10):1422. [DOI] [PMC free article] [PubMed] [Google Scholar]
McLeod 2001 {published data only}
- McLeod L, Lau WW. Decreasing influenza impact in lodges: 1997‐2000 Calgary Regional Health Authority. Canadian Journal of Public Health [Revue Canadienne de Santé Publique] 2001;92(4):291‐4. [DOI] [PMC free article] [PubMed] [Google Scholar]
Merkel 1994 {published data only}
- Merkel PA, Caputo GC. Evaluation of a simple office‐based strategy for increasing influenza vaccine administration and the effect of differing reimbursement plans on the patient acceptance rate. Journal of General Internal Medicine 1994;9(12):679‐83. [DOI] [PubMed] [Google Scholar]
Métrailler 2003 {published data only}
- Métrailler A, Emery G, Zuber A, Robyr M, Mabillard F, Dolt G, et al. Can we improve the general and nutritional management of elderly individuals living at a medical‐social facility? A team work [Peut‐on améliorer la prise en charge generale et nutritionnelle des personnes âgées vivant en etablissement médico‐social? Un travail d'equipe]. Revue Medicale de la Suisse Romande 2003;123(3):197‐200. [PubMed] [Google Scholar]
Milman 2005 {published data only}
- Milman U, Ben‐Moshe S, Hermoni D. The role of the patient care team in elderly people decision on influenza vaccination. Patient Education & Counseling 2005;58(2):203‐8. [DOI] [PubMed] [Google Scholar]
Mody 2005 {published data only}
- Mody L, Langa KM, Saint S, Bradley SF. Preventing infections in nursing homes: a survey of infection control practices in southeast Michigan. American Journal of Infection Control 2005;33(8):489‐92. [DOI] [PMC free article] [PubMed] [Google Scholar]
Morrow 1995 {published data only}
- Morrow RW, Gooding AD, Clark C. Improving physicians' preventive health care behavior through peer review and financial incentives. Archives of Family Medicine 1995;4(2):165‐9. [DOI] [PubMed] [Google Scholar]
Mosesso 2003 {published data only}
- Mosesso VN Jr, Packer CR, McMahon J, Auble TE, Paris PM. Influenza immunizations provided by EMS agencies: the MEDICVAX Project. Prehospital Emergency Care 2003;7(1):74‐8. [DOI] [PubMed] [Google Scholar]
Mukamel 2001 {published data only}
- Mukamel DB, Gold HT, Bennett NM. Cost utility of public clinics to increase pneumococcal vaccines in the elderly. American Journal of Preventive Medicine 2001;21(1):29‐34. [DOI] [PubMed] [Google Scholar]
Mulet Pons 1995 {published data only}
- Mulet Pons MJ, Sarrión Ferre MT, Barea Montoro A, Marin Rueda N, Blanquer Grégori JJ, Melchor Penella MA. Evaluation of the completion of influenza vaccination [Evaluacion del cumplimiento de la vacunacion antigripal]. Atención Primaria 1995;16(7):423‐7. [PubMed] [Google Scholar]
Müller 2005 {published data only}
- Müller D, Szucs TD. Coverage rates of influenza vaccine in Italy during the 2002/3 and 2003/04 seasons: a cross‐sectional study. Annali di Igiene 2005;17(4):351‐63. [PubMed] [Google Scholar]
Murphy 1996 {published data only}
- Murphy AW, Harrington M, Bury G, O'Doherty K, O'Kelly F, Smith M, et al. Impact of a collaborative immunisation programme in an inner city practice. Irish Medical Journal 1996;89(6):220‐1. [PubMed] [Google Scholar]
Nakatani 2002 {published data only}
- Nakatani H, Sano T, Iuchi T. Development of vaccination policy in Japan: current issues and policy directions. Journal of Infectious Diseases 2002;55(4):101‐11. [PubMed] [Google Scholar]
Ndiaye 2005 {published data only}
- Ndiaye SM, Hopkins DP, Shefer AM, Hinman AR, Briss PA, Rodewald L, et al. Interventions to improve influenza, pneumococcal polysaccharide, and hepatitis B vaccination coverage among high‐risk adults: a systematic review. American Journal of Preventive Medicine 2005;28(Suppl 5):248‐79. [DOI] [PubMed] [Google Scholar]
Nichol 1990 {published data only}
- Nichol KL, Korn JE, Margolis KL, Poland GA, Petzel RA, Lofgren RP. Achieving the national health objective for influenza immunization: success of an institution‐wide vaccination program. American Journal of Medicine 1990;89(2):156‐60. [DOI] [PubMed] [Google Scholar]
Nichol 1992 {published data only}
- Nichol KL, Lofgren RP, Gapinski J. Influenza vaccination. Knowledge, attitudes, and behavior among high‐risk outpatients. Archives of Internal Medicine 1992;152(1):106‐10. [DOI] [PubMed] [Google Scholar]
Nichol 1998 {published data only}
- Nichol KL. Ten‐year durability and success of an organized program to increase influenza and pneumococcal vaccination rates among high‐risk adults. American Journal of Medicine 1998;105(5):385‐92. [DOI] [PubMed] [Google Scholar]
Nichol 2006 {published data only}
- Nichol K, Nordin J, Mullooly J. Influence of clinical outcome and outcome period definitions on estimates of absolute clinical and economic benefits of influenza vaccination in community dwelling elderly persons. Vaccine 2006;24(10):1562‐8. [DOI] [PubMed] [Google Scholar]
Nicoleau 2001 {published data only}
- Nicoleau A, Nicoleau CA, Balzora JD, Oboh A, Siddiqui N, Rosenberg C. Elderly African‐Americans and the influenza vaccine: the impact of the primary care physician. Journal of the American Medical Directors Association 2001;2(2):56‐9. [PubMed] [Google Scholar]
Nowalk 2004a {published data only}
- Nowalk MP, Zimmerman RK, Feghali J. Missed opportunities for adult immunization in diverse primary care office settings. Vaccine 2004;22(25‐6):3457‐63. [DOI] [PubMed] [Google Scholar]
Nowalk 2004b {published data only}
- Nowalk MP, Zimmerman RK, Shen S, Jewell IK, Raymund M. Barriers to pneumococcal and influenza vaccination in older community‐dwelling adults. Journal of the American Geriatrics Society 2004;52(1):25‐30. [DOI] [PubMed] [Google Scholar]
Nowalk 2004c {published data only}
- Nowalk MP, Bardella IJ, Zimmerman RK, Shen S. The physician's office: can it influence adult immunization rates?. American Journal of Managed Care 2004;10(1):13‐9. [PubMed] [Google Scholar]
Nowalk 2008 {published data only}
- Nowalk MP, Zimmerman RK, Lin CJ, Raymund M, Tabbarah M, Wilson SA, et al. Raising adult vaccination rates over 4 years among racially diverse patients at inner‐city health centers. Journal of the American Geriatrics Society 2008;56(7):1177‐82. [DOI] [PubMed] [Google Scholar]
Nowalk 2012 {published data only}
- Nowalk MP, Nutini J, Raymund M, Ahmed F, Albert SM, Zimmerman RK. Evaluation of a toolkit to introduce standing orders for influenza and pneumococcal vaccination in adults: a multimodal pilot project. Vaccine 2012;30(41):5978‐82. [PUBMED: 22835736] [DOI] [PubMed] [Google Scholar]
Nowalk 2014 {published data only}
- Nowalk MP, Nolan BA, Nutini J, Ahmed F, Albert SM, Susick M, et al. Success of the 4 pillars toolkit for influenza and pneumococcal vaccination in adults. Journal of Healthcare Quality 2014;36(6):5‐15. [PUBMED: 23777396] [DOI] [PubMed] [Google Scholar]
O'Connor 1996 {published data only}
- O'Connor AM, Pennie RA, Dales RE. Framing effects on expectations, decisions, and side effects experienced: the case of influenza immunization. Journal of Clinical Epidemiology 1996;49(11):1271‐6. [DOI] [PubMed] [Google Scholar]
O'Connor 1998 {published data only}
- O'Connor PJ, Desai J, Rush WA, Cherney LM, Solberg LI, Bishop DB. Is having a regular provider of diabetes care related to intensity of care and glycemic control?. Journal of Family Practice 1998;47(4):290‐7. [PubMed] [Google Scholar]
O'Malley 2006 {published data only}
- O'Malley AS, Forrest CB. Immunization disparities in older Americans: determinants and future research needs. American Journal of Preventive Medicine 2006;31(2):150‐8. [DOI] [PubMed] [Google Scholar]
O'Reilly 2002 {published data only}
- O'Reilly D, Gormley G, Gilliland A, Cuene‐Grandidier H, Rafferty C, Reilly P, et al. Influenza vaccinations in Northern Ireland: are older patients missing out?. Age and Ageing 2002;31(5):385‐90. [DOI] [PubMed] [Google Scholar]
Ohmit 1995 {published data only}
- Ohmit SE, Furumoto‐Dawson A, Monto AS, Fasano N. Influenza vaccine use among an elderly population in a community intervention. American Journal of Preventive Medicine 1995;11(4):271‐6. [PubMed] [Google Scholar]
Ompad 2006 {published data only}
- Ompad DC, Galea S, Vlahov D. Distribution of influenza vaccine to high‐risk groups. Epidemiologic Reviews 2006;28:54‐70. [DOI] [PubMed] [Google Scholar]
Ornstein 1991 {published data only}
- Ornstein SM, Garr DR, Jenkins RG, Rust PF, Arnon A. Computer‐generated physician and patient reminders. Tools to improve population adherence to selected preventive services. Journal of Family Practice 1991;32(1):82‐90. [PubMed] [Google Scholar]
Overhage 1996 {published data only}
- Overhage JM, Tierney WM, McDonald CJ. Computer reminders to implement preventive care guidelines for hospitalized patients. Archives of Internal Medicine 1996;156:1551‐6. [PubMed] [Google Scholar]
Padiyara 2011 {published data only}
- Padiyara RS, D'Souza JJ, Rihani RS. Clinical pharmacist intervention and the proportion of diabetes patients attaining prevention objectives in a multispecialty medical group. Journal of Managed Care Pharmacy 2011;17(6):456‐62. [DOI] [PMC free article] [PubMed] [Google Scholar]
Parchman 2004 {published data only}
- Parchman ML, Burge SK. The patient‐physician relationship, primary care attributes, and preventive services. Family Medicine 2004;36(1):22‐7. [PubMed] [Google Scholar]
Parry 2004 {published data only}
- Parry MF, Grant B, Iton A, Parry PD, Baranowsky D. Influenza vaccination: a collaborative effort to improve the health of the community. Infection Control and Hospital Epidemiology 2004;25(11):929‐32. [DOI] [PubMed] [Google Scholar]
Pasquarella 2003 {published data only}
- Pasquarella A, Perria C, D'Amato M, Billi P, Marceca M, Volpe E, et al. Management of vaccination practices in adults: the influenza vaccination campaign in Lazio region, Italy [Modelli organizzativi di profilassi vaccinale nell'adulto: l'esperienza della campagna di vaccinazione antinfluenzale nella regione Lazio]. Annali di Igiene 2003;15(6):871‐9. [PubMed] [Google Scholar]
Patel 2004 {published data only}
- Patel PH, Welsh C, Foggs MB. Improved asthma outcomes using a coordinated care approach in a large medical group. Disease Management 2004;7(2):102‐11. [DOI] [PubMed] [Google Scholar]
Patel 2006 {published data only}
- Patel MS, Davis MM. Could a federal program to promote influenza vaccination among elders be cost‐effective?. Preventive Medicine 2006;42(3):240‐6. [DOI] [PubMed] [Google Scholar]
Patriarca 1985 {published data only}
- Patriarca PA, Weber JA, Meissner MK, Stricof RL, Dateno B, Braun JE, et al. Use of influenza vaccine in nursing homes. Journal of the American Geriatrics Society 1985;33(7):463‐6. [DOI] [PubMed] [Google Scholar]
Payaprom 2011 {published data only}
- Payaprom Y, Alabaster E, Bennett P, Tantipong H. Using the health action process approach and implementation intentions to increase flu vaccine uptake in high risk Thai individuals: a controlled before‐after trial. Health Psychology 2011;30(4):492‐500. [DOI] [PubMed] [Google Scholar]
Pearson 2005 {published data only}
- Pearson E, Lang E, Colacone A, Farooki N, Afilalo M. Successful implementation of a combined pneumococcal and influenza vaccination program in a Canadian emergency department. Canadian Journal of Emergency Medical Care 2005;7(6):371‐7. [PubMed] [Google Scholar]
Piedra 1995 {published data only}
- Piedra PA. Influenza virus pneumonia: pathogenesis, treatment, and prevention. Seminars in Respiratory Infections 1995;10(4):216‐23. [PubMed] [Google Scholar]
Pleis 2002 {published data only}
- Pleis JR, Gentleman JF. Using the National Health Interview Survey: time trends in influenza vaccinations among targeted adults. Effective Clinical Practice 2002;5(Suppl 3):E3. [PubMed] [Google Scholar]
Ploeg 1994 {published data only}
- Ploeg J, Black ME, Hutchison BG, Walter SD, Scott EA, Chambers LW. Personal, home and community safety promotion with community‐dwelling elderly persons: response to a public health nurse intervention. Canadian Journal of Public Health 1994;85(3):188‐91. [PubMed] [Google Scholar]
Postma 2005 {published data only}
- Postma MJ, Jansema P, Scheijbeler HW, Genugten ML. Scenarios on costs and savings of influenza treatment and prevention for Dutch healthy working adults. Vaccine 2005;23(46‐7):5365‐71. [DOI] [PubMed] [Google Scholar]
Prati 2012 {published data only}
- Prati G, Pietrantoni L, Zani B. Influenza vaccination: the persuasiveness of messages among people aged 65 years and older. Health Communication 2012;27:413‐20. [DOI] [PubMed] [Google Scholar]
Puig‐Barberà 1999 {published data only}
- Puig‐Barberà J, Ors‐Zarzoso P, Vilches Peña C, Lloria Paes F. Impact of various strategies on the rates of flu vaccination in the elderly [Impacto de distintas estrategias en las tasas de vacunación antigripal en ancianos]. Atención Primaria 1999;23(6):339‐45. [PubMed] [Google Scholar]
Quinley 2004 {published data only}
- Quinley JC, Shih A. Improving physician coverage of pneumococcal vaccine: a randomized trial of a telephone intervention. Journal of Community Health 2004;29(2):103‐15. [DOI] [PubMed] [Google Scholar]
Rantz 2001 {published data only}
- Rantz MJ, Popejoy L, Petroski GF, Madsden RW, Mehr DR, Zwygart‐Stauffacher M, et al. Randomized clinical trial of quality improvement interventions in nursing homes. Gerontologist 2001;41(4):525‐38. [DOI] [PubMed] [Google Scholar]
Reichert 2001 {published data only}
- Reichert TA, Sugaya N, Fedson DS, Glezen WP, Simonsen L, Tashiro M. The Japanese experience with vaccinating schoolchildren against influenza. New England Journal of Medicine 2001;344(12):889‐96. [DOI] [PubMed] [Google Scholar]
Resnick 2001 {published data only}
- Resnick B. Promoting health in older adults: a four‐year analysis. Journal of the American Academic Nurse 2001;13(1):23‐33. [DOI] [PubMed] [Google Scholar]
Ressel 2003 {published data only}
- Ressel GW, Advisory Committee on Immunization Practices. ACIP releases 2003 guidelines on the prevention and control of influenza. American Family Physician 2003;68(7):1426‐30. [PubMed] [Google Scholar]
Retchin 1991 {published data only}
- Retchin SM, Preston J. Effects of cost containment on the care of elderly diabetics. Archives of Internal Medicine 1991;151(11):2244‐8. [PubMed] [Google Scholar]
Rimple 2006 {published data only}
- Rimple D, Weiss SJ, Brett M, Ernst AA. An emergency department‐based vaccination program: overcoming the barriers for adults at high risk for vaccine‐preventable diseases. Academic Emergency Medicine 2006;13(9):922‐30. [DOI] [PubMed] [Google Scholar]
Robare 2011 {published data only}
- Robare JF, Bayles CM, Newman AB, Williams K, Milas C, Boudreau R, et al. The "10 Keys" to Healthy Aging: 24‐month follow‐up results from an innovative community‐based prevention program. Health Education & Behavior 2011;38(4):379‐88. [DOI] [PubMed] [Google Scholar]
Rodewald 1999 {published data only}
- Rodewald L, Szilagyi P, Humiston S, Barth R, Kraus R, Raubertas R. A randomized study of tracking with outreach and provider prompting to improve immunization coverage and primary care. Pediatrics 1999;103(1):31‐8. [DOI] [PubMed] [Google Scholar]
Rodriguez 1993 {published data only}
- Rodriguez RM, Baraff LJ. Emergency department immunization of the elderly with pneumococcal and influenza vaccines. Annals of Emergency Medicine 1993;22(11):1729‐32. [DOI] [PubMed] [Google Scholar]
Rodriguez‐Rodriguez 2006 {published data only}
- Rodriguez‐Rodriguez MI, Gatón Del Amo M, Robles‐Marinas V, Rubio‐Dominguez J. Factors determining flu vaccination in the over‐65s [Factores determinantes de vacunación antigripal en mayores de 65 años]. Atención Primaria 2006;37(7):381‐5. [DOI] [PMC free article] [PubMed] [Google Scholar]
Roffey 1998 {published data only}
- Roffey VE. Vaccination of health care workers working in geriatric long term care hospitals reduced patient mortality. Evidence‐Based Nursing 1998;1:18. [Google Scholar]
Russell 2000 {published data only}
- Russell ML, Maxwell CJ. The prevalence and correlates of influenza vaccination among a home care population. Canadian Journal of Public Health 2000;91(6):441‐4. [DOI] [PMC free article] [PubMed] [Google Scholar]
Rust 1999 {published data only}
- Rust CT, Sisk FA, Kuo AR, Smith J, Miller R, Sullivan KM. Impact of resident feedback on immunization outcomes. Archives of Pediatrics & Adolescent Medicine 1999;153(11):1165‐9. [DOI] [PubMed] [Google Scholar]
Ryan 1984 {published data only}
- Ryan MP, MacLeod AF. A comparison of adverse effects of two influenza vaccines, and the influence on subsequent uptake. Journal of the Royal College of General Practitioners 1984;34(265):442‐4. [PMC free article] [PubMed] [Google Scholar]
Sambamoorthi 2005 {published data only}
- Sambamoorthi U, Findley PA. Who are the elderly who never receive influenza immunization?. Preventive Medicine 2005;40(4):469‐78. [DOI] [PubMed] [Google Scholar]
Sansom 2003 {published data only}
- Sansom S, Rudy E, Strine T, Douglas W. Hepatitis A and B vaccination in a sexually transmitted disease clinic for men who have sex with men. Sexually Transmitted Diseases 2003;30(9):685‐8. [DOI] [PubMed] [Google Scholar]
Sarnoff 1998 {published data only}
- Sarnoff R, Rundall T. Meta‐analysis of effectiveness of interventions to increase influenza immunization rates among high‐risk population groups. Medical Care Research & Review 1998;55(4):432‐56. [DOI] [PubMed] [Google Scholar]
Schectman 1995 {published data only}
- Schectman JM, Kanwal NK, Schroth WS, Elinsky EG. The effect of an education and feedback intervention on group‐model and network‐model health maintenance organisation physician prescribing behavior. Medical Care 1995;33:139‐44. [PubMed] [Google Scholar]
Schensul 2009 {published data only}
- Schensul JJ, Radda K, Coman E, Vazquez E. Multi‐level intervention to prevent influenza infections in older low income and minority adults. American Journal of Community Psychology 2009;43(3‐4):313‐29. [DOI] [PubMed] [Google Scholar]
Schluter 1999 {published data only}
- Schluter WW, Ralston DL, Delaney RJ, Sauaia A, Dunn TR. Increasing influenza and pneumococcal vaccination and tuberculosis screening among residents of Colorado long‐term care facilities. Evaluation & the Health Professions 1999;22(4):466‐83. [DOI] [PubMed] [Google Scholar]
Schmitz 1993a {published data only}
- Schmitz R, Schwartz A. The Medicare influenza vaccine cost‐effectiveness study nursing home survey. International Congress Series; options for the control of influenza International Congress Series: 1019 1993;1:123‐6. [Google Scholar]
Schmitz 1993b {published data only}
- Schmitz RJ, Schwartz AM. Medicare coverage, vaccine promotion and rates of influenza vaccination among the Medicare population: 1998‐1991. International Congress Series; options for the control of influenza International Congress Series: 1019. Elsevier Science Publishers B.V.; Elsevier Science Publishing Co., Inc 1993;1:115‐22. [Google Scholar]
Schneider 2001 {published data only}
- Schneider EC, Cleary PD, Zaslavsky AM, Epstein AM. Racial disparity in influenza vaccination: does managed care narrow the gap between African Americans and whites?. JAMA 2001;286(12):1455‐60. [DOI] [PubMed] [Google Scholar]
Schreiner 1988 {published data only}
- Schreiner DT, Petrus ER, Rettie CS, Kluge RM. Improving compliance with preventive medicine procedures in a house staff training program. Southern Medical Journal 1988;81(12):1553‐7. [DOI] [PubMed] [Google Scholar]
Schwartz 2006 {published data only}
- Schwartz KL, Neale AV, Northrup J, Monsur J, Patel DA, Tobar R Jr, et al. Racial similarities in response to standardized offer of influenza vaccination: a MetroNet study. Journal of General Internal Medicine 2006;21(4):346‐51. [DOI] [PMC free article] [PubMed] [Google Scholar]
Schwarz 2005 {published data only}
- Schwarz Chavarri H, Ortuno Lopez JL, Lattur Vilchez A, Pedrera Carbonell V, Orozco Beltran D, Gil Guillen V. Flu vaccination in primary care: analysis of the process and proposals for increasing coverage [Vacunación antigripal en atención primaria: análisis del proceso y propuestas para aumentar las tasas de cobertura]. Atención Primaria 2005;36(7):390‐6. [DOI] [PMC free article] [PubMed] [Google Scholar]
Scott 1996 {published data only}
- Scott WG, Scott HM. Economic evaluation of vaccination against influenza in New Zealand. Pharmacoeconomics 1996;9(1):51‐60. [DOI] [PubMed] [Google Scholar]
Setia 1985 {published data only}
- Setia U, Serventi I, Lorenz P. Factors affecting the use of influenza vaccine in the institutionalized elderly. Journal of the American Geriatrics Society 1985;33(12):856‐8. [DOI] [PubMed] [Google Scholar]
Shah 2006 {published data only}
- Shah MN, Clarkson L, Lerner EB, Fairbanks RJ, McCann R, Schneider SM. An emergency medical services program to promote the health of older adults. Journal of the American Geriatrics Society 2006;54:956‐62. [DOI] [PubMed] [Google Scholar]
Shahrabani 2006 {published data only}
- Shahrabani S, Benzion U. The effects of socioeconomic factors on the decision to be vaccinated: the case of flu shot vaccination. Israel Medical Association Journal 2006;8(9):630‐4. [PubMed] [Google Scholar]
Shank 1989 {published data only}
- Shank JC, Powell T, Llewelyn J. A five‐year demonstration project associated with improvement in physician health maintenance behavior. Family Medicine 1989;21(4):273‐8. [PubMed] [Google Scholar]
Shenson 2005 {published data only}
- Shenson D, Bolen J, Adams M, Seeff L, Blackman D. Are older adults up‐to‐date with cancer screening and vaccinations?. Preventing Chronic Disease 2005;2(3):A04. [PMC free article] [PubMed] [Google Scholar]
Shenson 2007 {published data only}
- Shenson D, Bolen J, Adams M. Receipt of preventive services by elders based on composite measures, 1997‐2004. American Journal of Preventive Medicine 2007;32(1):11‐8. [DOI] [PubMed] [Google Scholar]
Shenson 2011 {published data only}
- Shenson D, Adams M, Bolen J, Anderson L. Routine checkups don't ensure that seniors get preventive services. Journal of Family Practice 2011;60(1):E1‐10. [PubMed] [Google Scholar]
Shugarman 2006 {published data only}
- Shugarman LR, Hales C, Setodji CM, Bardenheier B, Lynn J. The influence of staff and resident immunization rates on influenza‐like illness outbreaks in nursing homes. Journal of the American Medical Directors Association 2006;7:562‐7. [DOI] [PubMed] [Google Scholar]
Siebers 1985 {published data only}
- Siebers M, Hunt V. Increasing the pneumococcal vaccination rate of elderly patients in a general internal medicine clinic. Journal of the American Geriatrics Society 1985;33(3):175‐8. [DOI] [PubMed] [Google Scholar]
Simor 2002 {published data only}
- Simor AE. Influenza outbreaks in long‐term‐care facilities: how can we do better?. Infection Control and Hospital Epidemiology 2002;23(10):564‐7. [DOI] [PubMed] [Google Scholar]
Siriwardena 2003a {published data only}
- Siriwardena AN, Rashid A, Johnson M, Hazelwood L, Wilburn T. Improving influenza and pneumococcal vaccination uptake in high‐risk groups in Lincolnshire: a quality improvement report from a large rural county. Quality in Primary Care 2003;11(1):19‐28. [Google Scholar]
Slobodkin 1998 {published data only}
- Slobodkin D, Kitlas J, Zielske P. Opportunities not missed ‐ systematic influenza and pneumococcal immunization in a public inner‐city emergency department. Vaccine 1998;16(19):1795‐802. [DOI] [PubMed] [Google Scholar]
Soljak 1987 {published data only}
- Soljak M, Handford S. Early results from the Northland immunisation register. New Zealand Medical Journal 1987;100(822):244‐6. [PubMed] [Google Scholar]
Song 2000 {published data only (unpublished sought but not used)}
- Russell M [pers comm]. Baseline vaccination rates, results and study risk of bias. RE Thomas 16 February 2009.
- Song Y, Oh J, Han S, Choi C. Effectiveness of telephone and postcard reminders for the influenza vaccination: a study in the elderly who have visited a family practice center in a tertiary care hospital. Korean Journal of Preventive Medicine 2000;33(1):109‐16. [Google Scholar]
- Song YM [pers comm]. Baseline vaccination rates, results and study risk of bias. RE Thomas 16 February 2009; 20 November 2017.
Stancliff 2000 {published data only}
- Stancliff S, Salomon N, Perlman DC, Russell PC. Provision of influenza and pneumococcal vaccines to injection drug users at a syringe exchange. Journal of Substance Abuse and Treatment 2000;18(3):263‐5. [DOI] [PubMed] [Google Scholar]
Stehr‐Green 1993 {published data only}
- Stehr‐Green P, Dini E, Lindegren M, Patriarca P. Evaluation of telephoned computer‐generated reminders to improve immunization coverage at inner‐city clinics. Public Health Reports 1993;108(4):426‐30. [PMC free article] [PubMed] [Google Scholar]
Stenqvist 2006 {published data only}
- Stenqvist K, Hellvin MA, Hellke P, Hoglund D, Sydow H. Influenza work on the regional level in Sweden: an integrated program for vaccination of risk groups, surveillance and pandemic planning which focuses on the role of the health care worker. Vaccine 2006;24(44‐6):6712‐6. [DOI] [PubMed] [Google Scholar]
Steyer 2004 {published data only}
- Steyer TE, Ragucci KR, Pearson WS, Mainous AG 3rd. The role of pharmacists in the delivery of influenza vaccinations. Vaccine 2004;22(8):1001‐6. [DOI] [PubMed] [Google Scholar]
Stott 1998 {published data only}
- Stott DJ, Murray GD, Elder A, Carman WB. Influenza vaccination of health care workers in long‐term care protects elderly patients. Age and Ageing 1998;27(Suppl 2):45‐6. [Google Scholar]
Straits‐Troster 2006 {published data only}
- Straits‐Troster KA, Kahwati LC, Kinsinger LS, Orelien J, Burdick MB, Yevich SJ. Racial/ethnic differences in influenza vaccination in the Veterans Affairs Healthcare System. American Journal of Preventive Medicine 2006;31(5):375‐82. [DOI] [PubMed] [Google Scholar]
Stuart 1969 {published data only}
- Stuart WH, Dull HB, Newton LH, McQueen JL, Schiff ER. Evaluation of monovalent influenza vaccine in a retirement community during the epidemic of 1965‐66. JAMA 1969;209(2):232‐8. [PubMed] [Google Scholar]
Sylvan 2003 {published data only}
- Sylvan S, Eriksson G, Berglund K, Pauksen K, Bergqvisit S. Low vaccine coverage rate for influenza and pneumococcal vaccination in an elderly population in Uppsala County, Sweden. Interscience Conference on Antimicrobial Agents and Chemotherapy. 2003; Vol. 43:Abstract no. G‐884.
Szilagyi 1992 {published data only}
- Szilagyi P, Rodewald L, Savageau J, Yoos L, Doane C. Improving influenza immunization vaccination rates in children with asthma: a test of a computerized reminder system and an analysis of factors predicting vaccination. Pediatrics 1992;90(6):871‐5. [PubMed] [Google Scholar]
Szilagyi 2005 {published data only}
- Szilagyi PG, Shone LP, Barth R, Kouides RW, Long C, Humiston SG, et al. Physician practices and attitudes regarding adult immunizations. Preventive Medicine 2005;40(2):152‐61. [DOI] [PubMed] [Google Scholar]
Szilagyi 2006 {published data only}
- Szilagyi PG, Schaffer S, Barth R, Shone LP, Humiston SG, Ambrose S, et al. Effect of telephone reminder/recall on adolescent immunization and preventive visits: results from a randomized clinical trial. Archives of Pediatrics and Adolescent Medicine 2006;160:157‐63. [DOI] [PubMed] [Google Scholar]
Szucs 2006 {published data only}
- Szucs TD, Wahle K, Muller D. Influenza vaccination in Germany. A population‐based cross‐sectional analysis of three seasons between 2002 and 2005 [Grippeimpfung in Deutschland. Eine bevolkerungsbezongene Querschnittsanalyse der derie Influenzasasons von 2002 bis 2005]. Medizinische Klinik 2006;10(7):537‐45. [DOI] [PubMed] [Google Scholar]
Tabbarah 2005 {published data only}
- Tabbarah M, Zimmerman RK, Nowalk MP, Janosky JE, Troy JA, Raymund M, et al. What predicts influenza vaccination status in older Americans over several years?. Journal of the American Geriatrics Society 2005;53(8):1354‐9. [DOI] [PubMed] [Google Scholar]
Tacken 2002 {published data only}
- Tacken M, Braspenning J, Spreeuwenberg P, Hoogen H, Essen G, Bakker D, et al. Patient characteristics determine differences in the influenza vaccination rate more so than practice features. Preventive Medicine 2002;35(4):401‐6. [DOI] [PubMed] [Google Scholar]
Tape 1993 {published data only}
- Tape TG, Campbell JR. Computerized medical records and preventive health care: success depends on many factors. American Journal of Medicine 1993;94(6):619‐25. [DOI] [PubMed] [Google Scholar]
Terrell‐Perica 2001 {published data only}
- Terrell‐Perica SM, Effler PV, Houck PM, Lee L, Crosthwaite GH. The effect of a combined influenza/pneumococcal immunization reminder letter. American Journal of Preventive Medicine 2001;21(4):256‐60. [DOI] [PubMed] [Google Scholar]
Tierney 2005 {published data only}
- Tierney WM, Overhage JM, Murray MD, Harris LE, Zhou X‐H, Eckert GJ, et al. Can computer‐generated evidence‐based care suggestions enhance evidence‐based management of asthma and chronic obstructive pulmonary disease? A randomized, controlled trial. Health Services Research 2005;40(2):477‐97. [DOI] [PMC free article] [PubMed] [Google Scholar]
Tollestrup 1991 {published data only}
- Tollestrup K, Hubbard B. Evaluation of a follow‐up system in a county health department's immunization clinic. American Journal of Preventive Medicine 1991;7(1):24‐8. [PubMed] [Google Scholar]
Toscani 2003 {published data only}
- Toscani L, Gauthey L, Robert CF. The information network of senior citizens in Geneva, Switzerland, and progress in flu vaccination coverage between 1991 and 2000. Vaccine 2003;21(5‐6):393‐8. [DOI] [PubMed] [Google Scholar]
Traeger 2006 {published data only}
- Traeger M, Thompson A, Dickson E, Provencio A. Bridging disparity: a multidisciplinary approach for influenza vaccination in an American Indian community. American Journal of Public Health 2006;96(5):921‐5. [DOI] [PMC free article] [PubMed] [Google Scholar]
Trick 2009 {published data only}
- Trick WE, Das K, Gerard MN, Charles‐Damte M, Murphy G, Benson I, et al. Clinical trial of standing‐orders strategies to increase the inpatient influenza vaccination rate. Infection Control and Hospital Epidemiology 2009;30(1):86‐8. [DOI] [PubMed] [Google Scholar]
Tucker 1987 {published data only}
- Tucker JB, DeSimone JP. Patient response to mail cues recommending influenza vaccine. Family Medicine 1987;19(3):209‐12. [PubMed] [Google Scholar]
Turner 1989 {published data only}
- Turner BJ, Day SC, Borenstein B. A controlled trial to improve delivery of preventive care: physician or patient reminders. Journal of General Internal Medicine 1989;4:403‐9. [DOI] [PubMed] [Google Scholar]
Turner 1990 {published data only}
- Turner RC, Waivers LE, O'Brien K. The effect of patient‐carried reminder cards on the performance of health maintenance measures. Archives of Internal Medicine 1990;150:645‐7. [PubMed] [Google Scholar]
Turner 2003 {published data only}
- Turner D, Wailoo A, Nicholson K, Cooper N, Sutton A, Abrams K. Systematic review and economic decision modelling for the prevention and treatment of influenza A and B. Health Technology Assessment 2003;7(35):iii‐iv, xi‐xiii, 1‐170. [DOI] [PubMed] [Google Scholar]
Tymchuk 1991 {published data only}
- Tymchuk AJ, Ouslander JG. Informed consent: does position of information have an effect upon what elderly people in long‐term care remember?. Educational Gerontology 1991;17(1):11‐9. [DOI] [PubMed] [Google Scholar]
Usami 2009 {published data only}
- Usami T, Hashiguchi M, Kouhara T, Ishii A, Nagata T, Mochizuki M. Impact of community pharmacists advocating immunization on influenza vaccination rates among the elderly. Yakugaku Zasshi 2009;129(9):1063‐8. [DOI] [PubMed] [Google Scholar]
Van Amburgh 2001 {published data only}
- Amburgh JA, Waite NM, Hobson EH, Migden H. Improved influenza vaccination rates in a rural population as a result of a pharmacist‐managed immunization campaign. Pharmacotherapy 2001;21(9):1115‐22. [DOI] [PubMed] [Google Scholar]
Van den Hooven 2006 {published data only}
- Hooven E, Hoes A, Nichol K, Hak E. Influence of design and analytical factors on confounding in non‐randomised influenza vaccine effect studies. European Journal of Epidemiology 2006;21(Suppl S):52‐3. [Google Scholar]
Van Essen 1997 {published and unpublished data}
- Essen GA, Kuyvenhoven MM, Melker RA. Implementing the Dutch College of General Practitioner's guidelines for influenza vaccination: an intervention study. British Journal of General Practice 1997;47(414):25‐9. [PMC free article] [PubMed] [Google Scholar]
Van Hoof 2001 {published data only}
- Hoof TJ, Holmboe ES, Barr JK, Reisine S, Cohen KL, Wang Y, et al. Preventive service utilization in older adults: follow‐up results of a quality improvement project. Preventive Medicine in Managed Care 2001;2(3):115‐24. [Google Scholar]
Van Lieshout 2012 {published data only}
- Lieshout J, Capell EF, Ludt S, Grol R, Wensing M. What components of chronic care organisation relate to better primary care for coronary heart disease patients? An observational study. BMJ Open 2012;2:e001344. [DOI: 10.1136/bmjopen-2012-001344] [DOI] [PMC free article] [PubMed] [Google Scholar]
Wadhwa 1997 {published and unpublished data}
- Wadhwa S, Lavizzo‐Mourey R, Taylor L, Pasupathy S, Shulkin D. Improving influenza vaccination among the elderly members of a large health care network: a randomized controlled trial of letter and voice reminders. Journal of General Internal Medicine 1997;12(Suppl 1):112. [Google Scholar]
- Wadhwa S, Russell M [pers comm]. Baseline vaccination rates, results and study risk of bias. RE Thomas 18 February 2009.
Walker 1992 {published data only}
- Walker CL, Patterson R, Wu A, Bennett E. Influenza vaccination: a successful outpatient program. Allergy Proceedings 1992;13(6):317‐9. [DOI] [PubMed] [Google Scholar]
Walsh 2012 {published data only}
- Walsh JME, Gildengorin G, Green LW, Jenkins J, Potter MB. The FLU‐FOBT Program in community clinics: durable benefits of a randomized controlled trial. Health Education Research 2012;27(5):886‐94. [DOI] [PMC free article] [PubMed] [Google Scholar]
Wang 2005 {published data only}
- Wang ST, Lee LT, Chen LS, Chen TH. Economic evaluation of vaccination against influenza in the elderly: an experience from a population‐based influenza vaccination program in Taiwan. Vaccine 2005;23(16):1973‐80. [DOI] [PubMed] [Google Scholar]
Warren 1995 {published data only}
- Warren SS, Nguyen‐Van‐Tam JS, Pearson JC, Madeley RJ. Practices and policies for influenza immunization in old people's homes in Nottingham (UK) during the 1992‐1993 season: potential for improvement. Journal of Public Health Medicine 1995;17(4):392‐6. [PubMed] [Google Scholar]
Watkinson 2004 {published data only}
- Watkinson M. Group visits improved concordance with American Diabetes Association practice guidelines in type 2 diabetes. Evidence‐Based Nursing 2004;7:57. [DOI] [PubMed] [Google Scholar]
Weatherill 2004 {published data only}
- Weatherill SA, Buxton JA, Daly PC. Immunization programs in non‐traditional settings. Canadian Journal of Public Health 2004;95(2):133‐7. [DOI] [PMC free article] [PubMed] [Google Scholar]
Weaver 2001 {published data only}
- Weaver M, Krieger J, Castorina J, Walls M, Ciske S. Cost‐effectiveness of combined outreach for the pneumococcal and influenza vaccines. Archives of Internal Medicine 2001;161(1):111‐30. [DOI] [PubMed] [Google Scholar]
Weaver 2003 {published data only}
- Weaver FM, Goldstein B, Evans CT, Legro MW, LaVela S, Smith B, et al. Influenza vaccination among veterans with spinal cord injury: Part 2. Increasing vaccination rates. Journal of Spinal Cord Medicine 2003;26(3):210‐8. [DOI] [PubMed] [Google Scholar]
Wee 2001 {published data only}
- Wee CC, Phillips RS, Burstin HR, Cook EF, Puopolo AL, Brennan TA, et al. Influence of financial productivity incentives on the use of preventive care. American Journal of Medicine 2001;110(3):181‐7. [DOI] [PubMed] [Google Scholar]
Wei 2007 {published data only}
- Wei W, Findley PA, Sambamoorthi U. Disability and receipt of clinical preventive services among women. Women's Health Issues 2007;16(6):286‐96. [DOI] [PMC free article] [PubMed] [Google Scholar]
Whelan 2013 {published data only}
- Whelan PJ, Walwyn R, Gaughran F, Macdonald A. Impact of the demand for 'proxy' assent on recruitment to a randomised controlled trial of vaccination testing in care homes. Journal of Medical Ethics 2013;39:36‐40. [DOI] [PubMed] [Google Scholar]
While 2005 {published data only}
- While A, George C, Murgatroyd B. Promoting influenza vaccination in older people: rationale and reality. British Journal of Community Nursing 2005;10(9):427‐30. [DOI] [PubMed] [Google Scholar]
Wiese‐Posselt 2006 {published data only}
- Wiese‐Posselt M, Leitmeyer K, Hamouda O, Bocter N, Zollner I, Haas W, et al. Influenza vaccination coverage in adults belonging to defined target groups, Germany, 2003/2004. Vaccine 2006;24(14):2560‐6. [DOI] [PubMed] [Google Scholar]
Wilkinson 2002 {published data only}
- Wilkinson CR, Williams M. Strengthening patient‐provider relationships. Lippincott's Case Management 2002;7(3):86‐99. [DOI] [PubMed] [Google Scholar]
Williams 1987 {published data only}
- Williams DM, Daugherty LM, Aycock DG, Lindley CM, Harris MJ. Effectiveness of improved targeting efforts for influenza immunization in an ambulatory care setting. Hospital Pharmacy 1987;22(5):462‐4. [PubMed] [Google Scholar]
Wilson 1989 {published data only}
- Wilson RW, Patterson MA, Alford DM. Services for maintaining independence. Journal of Gerontological Nursing 1989;15(6):31‐7. [DOI] [PubMed] [Google Scholar]
Winston 2006a {published data only}
- Winston CA, Wortley PM, Lees KA. Factors associated with vaccination of Medicare beneficiaries in five U.S. communities: results from the Racial and Ethnic Adult Disparities in Immunization Initiative survey, 2003. Journal of the American Geriatrics Society 2006;54(2):303‐10. [DOI] [PubMed] [Google Scholar]
Winston 2006b {published data only}
- Winston CA, Lindley MC, Wortley PM. Lessons learned from inpatient vaccination in Michigan. American Journal of Medical Quality 2006;21(2):125‐33. [DOI] [PubMed] [Google Scholar]
Wood 1998 {published data only}
- Wood D, Halfon N, Donald‐Sherbourne C, Mazel R, Schuster M, Hamlin J, et al. Increasing immunization rates among inner‐city, African American children. A randomized trial of case management. JAMA 1998;279(1):29‐34. [DOI] [PubMed] [Google Scholar]
Worasathit 2015 {published data only}
- Worasathit R, Wattana W, Okanurak K, Songthap A, Dhitavat J, Pitisuttithum P. Health education and factors influencing acceptance of and willingness to pay for influenza vaccination among older adults. BMC Geriatrics 2015;15:136. [PUBMED: 26503289] [DOI] [PMC free article] [PubMed] [Google Scholar]
Wortley 2005 {published data only}
- Wortley P. Who's getting shots and who's not: racial/ethnic disparities in immunization coverage. Ethnicity & Disease 2005;15(2 Suppl 3):S3‐4‐S3‐6. [PubMed] [Google Scholar]
Wray 2009 {published data only}
- Wray RJ, Buskirk TD, Jupka K, Lapka C, Jacobsen H, Pakpahan R, et al. Influenza vaccination concerns among older blacks: a randomized controlled trial. American Journal of Preventive Medicine 2009;36(5):429‐34. [DOI] [PubMed] [Google Scholar]
Wright 2011 {published data only}
- Wright A, Poon EG, Wald J, Feblowitz J, Pang JE, Schnipper JL, et al. Randomized controlled trial of health maintenance reminders provided directly to patients through an electronic PHR. Journal of General Internal Medicine 2011;27(1):85‐92. [DOI] [PMC free article] [PubMed] [Google Scholar]
Wuorenma 1994 {published data only}
- Wuorenma J, Nichol K, Vonsternberg T. Implementing a mass influenza vaccination program. Nursing Management 1994;25(5):81. [PubMed] [Google Scholar]
Yoo 2006 {published data only}
- Yoo BK, Grosse S, Frick KD. Self‐selection and evaluation of influenza vaccination effectiveness among elderly. Vaccine 2006;24(40‐1):6374‐5. [DOI] [PubMed] [Google Scholar]
Young 1980 {published data only}
- Young S, Halpin T, Johnson D, Irvin J, Marks J. Effectiveness of a mailed reminder on the immunization levels of infants at high risk of failure to complete immunizations. American Journal of Public Health 1980;70(4):422‐4. [DOI] [PMC free article] [PubMed] [Google Scholar]
Zimmerman 2003a {published data only}
- Zimmerman RK, Raymund M, Janosky JE, Nowalk MP, Fine MJ. Sensitivity and specificity of patient self‐report of influenza and pneumococcal polysaccharide vaccinations among elderly outpatients in diverse patient care strata. Vaccine 2003;13‐4(1):1486‐91. [DOI] [PubMed] [Google Scholar]
Zimmerman 2003b {published and unpublished data}
- Zimmerman RK, Santibanez TA, Janosky JE, Fine MJ, Raymund M, Wilson SA, et al. What affects influenza vaccination rates among older patients? An analysis from inner‐city, suburban, rural, and Veterans Affairs practices. American Journal of Medicine 2003;114(1):31‐8. [DOI] [PubMed] [Google Scholar]
Zimmerman 2003c {published data only}
- Zimmerman RK, Nowalk MP, Raymund M, Tabbarah M, Hall DG, Wahrenberger JT, et al. Tailored interventions to increase influenza vaccination in neighborhood health centers serving the disadvantaged. American Journal of Public Health 2003;93(10):1699‐705. [DOI] [PMC free article] [PubMed] [Google Scholar]
Zimmerman 2004 {published data only}
- Zimmerman RK, Nowalk MP, Bardella IJ, Fine MJ, Janosky JE, Santibanez TA, et al. Physician and practice factors related to influenza vaccination among the elderly. American Journal of Preventive Medicine 2004;26(1):1‐10. [DOI] [PubMed] [Google Scholar]
Zwar 2016 {published data only}
- Zwar NA, Bunker JM, Reddel HK, Dennis SM, Middleton S, Schayck OC, et al. Early intervention for chronic obstructive pulmonary disease by practice nurse and GP teams: a cluster randomized trial. Family Practice 2016;33(6):663‐70. [DOI: 10.1093/fampra/cmw077] [DOI] [PubMed] [Google Scholar]
References to studies awaiting assessment
Hurley 2017 {published data only (unpublished sought but not used)}
- Hurley LP, Beaty B, Lockhart S, Gurfinkel D, Breslin K, Dickinson M, et al. Centralized vaccine reminder/recall to improve adult vaccination rates at an urban safety net health system. Journal of General Internal Medicine 2017;32(Suppl 2):S135‐6. [Google Scholar]
Additional references
Ashby‐Hughes 1999
- Ashby‐Hughes B, Nickerson N. Provider endorsement: the strongest cue in prompting high‐risk adults to receive influenza and pneumococcal immunizations. Clinical Excellence for Nurse Practitioners 1999;3(2):97‐104. [PubMed] [Google Scholar]
Atkins 2004
- Atkins D, Best D, Briss PA, Eccles M, Falck‐Ytter Y, Flottorp S, et al. GRADE Working Group. Grading quality of evidence and strength of recommendations. BMJ 2004;328(7454):1490. [DOI] [PMC free article] [PubMed] [Google Scholar]
Ballada 1994
- Ballada D, Biasio LR, Cascio G, D'Alessandro D, Donatelli I, Fara GM, et al. Attitudes and behavior of health care personnel regarding influenza vaccination. European Journal of Epidemiology 1994;10:63‐8. [DOI] [PubMed] [Google Scholar]
Calkins 1995
- Calkins E, Katz LA, Karuza J, Wagner A. The small group consensus process for changing physician practices: influenza vaccination. HMO Practice 1995;9(3):107‐10. [PubMed] [Google Scholar]
Cates 2013
- Cates CJ, Rowe BH. Vaccines for preventing influenza in people with asthma. Cochrane Database of Systematic Reviews 2013, Issue 2. [DOI: 10.1002/14651858.CD000364.pub4] [DOI] [Google Scholar]
CDC 2017
- Centers for Disease Control and Prevention. Flu vaccination coverage, United States, 2016‐17 influenza season. www.cdc.gov/flu/fluvaxview/coverage‐1617estimates.htm (accessed prior to 5 January 2018).
CDC 2018
- Centers for Disease Control and Prevention. The community guide. www.thecommunityguide.org/sites/default/files/assets/What‐Works‐Factsheet‐Vaccination.pdf (accessed 2 February 2018).
Clar 2015
- Clar C, Oseni Z, Flowers N, Keshtkar‐Jahromi M, Rees K. Influenza vaccines for preventing cardiovascular disease. Cochrane Database of Systematic Reviews 2015, Issue 5. [DOI: 10.1002/14651858.CD005050.pub3] [DOI] [PMC free article] [PubMed] [Google Scholar]
Demicheli 2014
- Demicheli V, Jefferson T, Al‐Ansary LA, Ferroni E, Rivetti A, Pietrantonj C. Vaccines for preventing influenza in healthy adults. Cochrane Database of Systematic Reviews 2014, Issue 3. [DOI: 10.1002/14651858.CD001269.pub5] [DOI] [PubMed] [Google Scholar]
Demicheli 2018
- Demicheli V, Jefferson T, Pietrantonj C, Ferroni E, Thorning S, Thomas RE, et al. Vaccines for preventing influenza in the elderly. Cochrane Database of Systematic Reviews 2018, Issue 2. [DOI: 10.1002/14651858.CD004876.pub4] [DOI] [PMC free article] [PubMed] [Google Scholar]
Dexter 2012
- Dexter LJ, Teare MD, Dexter M, Siriwardena AN, Read RC. Strategies to increase influenza vaccination rates: outcomes of a nationwide cross‐sectional survey of UK general practice. BMJ Open 2012;2(3):e000851. [10.1136/ bmjopen‐2011‐000851] [DOI] [PMC free article] [PubMed] [Google Scholar]
Dixon‐Woods 2004
- Dixon‐Woods M, Brown H, Arthur A, Matthews R, Jagger C. Organising services for influenza vaccination for older people. Journal of Health Services Research & Policy 2004;9(2):85‐90. [DOI] [PubMed] [Google Scholar]
Downs 1998
- Downs SH, Black N. The feasibility of creating a checklist for the assessment of the methodological quality both of randomised and non‐randomised studies of health interventions. Journal of Epidemiology and Community Health 1998;52(6):377‐84. [DOI] [PMC free article] [PubMed] [Google Scholar]
ECDC 2017
- European Centre for Disease Prevention and Control. Seasonal influenza vaccination in Europe. Vaccination recommendations and coverage rates in the EU Member States for eight influenza seasons: 2007–2008 to 2014–2015. Technical Report. Stockholm: ECDC, 2017. [DOI: 10.2900/153618; ISBN 978‐92‐9488‐076‐2] [DOI] [Google Scholar]
Fabacher 1994
- Fabacher D, Josephson K, Pietruszka F, Linderborn K, Morley JE, Rubenstein LZ. An in‐home preventive assessment program for independent older adults: a randomized controlled trial. Journal of the American Geriatrics Society 1994;42:630‐8. [DOI] [PubMed] [Google Scholar]
Fiore 2009
- Fiore AE, Shay DK, Broder K, Iskander JK, Uyeki TM, Mootrey G, et al. Prevention and control of seasonal influenza with vaccines: recommendations of the Advisory Committee on Immunization Practices (ACIP), 2009. Morbidity and Mortality Weekly Report. Recommendations & Reports 2009;58(RR‐8):1‐52. [PubMed] [Google Scholar]
Ginson 2000
- Ginson SH, Malmberg CM, French DJ. Impact on vaccination rates of a pharmacist‐initiated influenza and pneumococcal vaccination program. Canadian Journal of Hospital Pharmacy 2000;53:270‐5. [Google Scholar]
GRADEpro GDT 2014 [Computer program]
- GRADE Working Group, McMaster University. GRADEpro GDT. Hamilton (ON): GRADE Working Group, McMaster University, 2014.
Grohskopf 2014
- Grohskopf LA, Olsen SJ, Sokolow LZ, Bresee JS, Cox NJ, Broder KR, et al. Prevention and control of seasonal influenza with vaccines: recommendations of the Advisory Committee on Immunization Practices (ACIP) ‐ United States, 2014–15 influenza season. Morbidity and Mortality Weekly Report 2014;63(32):691‐7. [PMC free article] [PubMed] [Google Scholar]
Hak 2000
- Hak E, Hermens RPMG, Hoes AW, Verheij TJM, Kuyvenhoven MM, Essen GA. Effectiveness of a co‐ordinated nationwide programme to improve influenza immunization rates in the Netherlands. Scandinavian Journal of Primary Health Care 2000;18:237‐41. [DOI] [PubMed] [Google Scholar]
Higgins 2011
- Higgins JP, Green S (editors). Cochrane Handbook for Systematic Reviews of Interventions Version 5.1.0 (updated March 2011). The Cochrane Collaboration, 2011. Available from handbook.cochrane.org.
Ivers 2012
- Ivers N, Jamtvedt G, Flottorp S, Young JM, Odgaard‐Jensen J, French SD, et al. Audit and feedback: effects on professional practice and healthcare outcomes. Cochrane Database of Systematic Reviews 2012, Issue 6. [DOI: 10.1002/14651858.CD000259.pub3] [DOI] [PMC free article] [PubMed] [Google Scholar]
Jacobson 2005
- Jacobson Vann JC, Szilagyi P. Patient reminder and recall systems to improve immunization rates. Cochrane Database of Systematic Reviews 2005, Issue 1. [DOI: 10.1002/14651858.CD003941.pub2] [DOI] [PMC free article] [PubMed] [Google Scholar]
Jansen 2008
- Jansen AGSC, Sanders EAM, Nichol KL, Loon AM, Hoes AW, Hak E. Decline in influenza‐associated mortality among Dutch elderly following the introduction of a nationwide vaccination program. Vaccine 2008;26:5567‐74. [DOI] [PubMed] [Google Scholar]
Jha 2003
- Jha AK, Perlin JB, Kizer KW, Dudley RA. Effect of the transformation of the Veterans Affairs health care system on the quality of care. New England Journal of Medicine 2003;348(22):2218‐27. [DOI] [PubMed] [Google Scholar]
Joseph 2005
- Joseph C, Goddard N, Gelb D. Influenza vaccine uptake and distribution in England and Wales using data from the General Practice Research Database, 1989/90‐2003/04. Journal of Public Health 2005;27(4):371‐7. [DOI] [PubMed] [Google Scholar]
Kamal 2003
- Kamal KM, Madhavan SS, Amonkar MM. Determinants of adult influenza and pneumonia immunization rates. Journal of the American Pharmaceutical Association 2003;43(3):403‐11. [DOI] [PubMed] [Google Scholar]
Kelterman 2000
- Kelterman R, Allred CT, Frisch LE. Enhancing influenza immunization. Postcard and telephone reminders and the challenge of immunization site shift. Archives of Family Medicine 2000;9:368‐72. [DOI] [PubMed] [Google Scholar]
Kohlhammer 2007
- Kohlhammer Y, Schnoor M, Schwartz M, Raspe H, Schafer T. Determinants of influenza and pneumococcal vaccination in elderly people: a systematic review. Public Health 2007;121:742‐51. [DOI] [PubMed] [Google Scholar]
Krishna 2002
- Krishna S, Balas EA, Maglaveras N. Patient acceptance of educational voice messages: a review of controlled clinical studies. Methods of Information in Medicine 2002;41:360‐9. [PubMed] [Google Scholar]
LaForce 2017 [pers comm]
- LaForce M. Vaccination rates and study methods. Email reply to: RE Thomas 18 August 2017.
Lau 2012
- Lau D, Hu J, Majumdar SR, Storie DA, Rees SE, Johnson JA. Interventions to improve influenza and pneumococcal vaccination rates among community‐dwelling adults: a systematic review and meta‐analysis. Annals of Family Medicine 2012;10(6):538‐46. [DOI] [PMC free article] [PubMed] [Google Scholar]
Lefebvre 2011
- Lefebvre C, Manheimer E, Glanville J. Chapter 6: Searching for studies. Cochrane Handbook for Systematic Reviews of Interventions Version 5.1.0 [updated March 2011]. The Cochrane Collaboration, 2011. Available from handbook.cochrane.org.
MacDonald 1999
- MacDonald R, Baken L, Nelson A, Nichol KL. Validation of self‐report of influenza and pneumococcal vaccination status in elderly outpatients. American Journal of Preventive Medicine 1999;16(3):173‐7. [DOI] [PubMed] [Google Scholar]
McGovern 2008
- McGovern MP, Boroujerdi MA, Taylor MW, Williams DJ, Hannaford PC, Lefevre KE, et al. The effect of the UK incentive‐based contract on the management of patients with coronary heart disease in primary care. Family Practice 2008;25(1):33‐9. [DOI] [PubMed] [Google Scholar]
Nichol 1996
- Nichol KL, MacDonald R, Hauge M. Factors associated with influenza and pneumococcal vaccination behaviour among high‐risk adults. Journal of General Internal Medicine 1996;11:673‐7. [DOI] [PubMed] [Google Scholar]
Nichol 2001
- Nichol KL, Zimmerman R. Generalist and subspecialist physicians' knowledge, attitudes, and practices regarding influenza and pneumococcal vaccinations for elderly and other high‐risk patients: a nationwide survey. Archives of Internal Medicine 2001;61:2702‐8. [DOI] [PubMed] [Google Scholar]
OECD 2016
- OECD. Influenza vaccination rates. data.oecd.org/healthcare/influenza‐vaccination‐rates.htm (accessed prior to 5 January 2018).
Ohkusa 2005
- Ohkusa Y. Policy evaluation for the subsidy for influenza vaccination in elderly. Vaccine 2005;23(17‐8):2256‐60. [DOI] [PubMed] [Google Scholar]
Poole 2006
- Poole PJ, Chacko E, Wood‐Baker RWB, Cates CJ. Influenza vaccine for patients with chronic obstructive pulmonary disease. Cochrane Database of Systematic Reviews 2006, Issue 4. [DOI: 10.1002/14651858.CD002733.pub2] [DOI] [PubMed] [Google Scholar]
Remmen 2002
- Remmen R, Seuntjens R, Vriens V, Lesaffer C, Hermann I, Damme P, et al. Efficacy of influenza immunisation programmes: comparison of two European systems in one practice. European Journal of General Practice 2002;8(4):159‐62. [Google Scholar]
Review Manager 2014 [Computer program]
- Nordic Cochrane Centre, The Cochrane Collaboration. Review Manager (RevMan). Version 5.3. Copenhagen: Nordic Cochrane Centre, The Cochrane Collaboration, 2014.
Shalala 1993
- Shalala DE, Hutton E, Kidder D. Medicare influenza vaccine demonstration: Report to Congress. https://archive.org/details/medicareinfluenz00shal 1993:1‐29. [https://archive.org/details/medicareinfluenz00shal]
Shefer 1999
- Shefer A, Briss P, Rodewald L, Bernier R, Strikas R, Yusuf H, et al. Improving immunization coverage rates: an evidence‐based review of the literature. Epidemiology Review 1999;21(1):96‐142. [DOI] [PubMed] [Google Scholar]
Shojania 2010
- Shojania KG, Jennings A, Mayhew A, Ramsay C, Eccles M, Grimshaw J. Effect of point‐of care computer reminders on physician behaviour: a systematic review. Canadian Medical Association Journal 2010;182(5):E216‐25. [DOI] [PMC free article] [PubMed] [Google Scholar]
Siriwardena 2003b
- Siriwardena AN, Wilburn T, Hazelwood L. Increasing influenza and pneumococcal vaccination rates in high risk groups in one primary care trust as part of a clinical governance programme. Clinical Governance 2003;8(3):200‐7. [Google Scholar]
Thomas 2016
- Thomas RE, Jefferson T, Lasserson TJ. Influenza vaccination for healthcare workers who care for people aged 60 or older living in long‐term care institutions. Cochrane Database of Systematic Reviews 2016, Issue 6. [DOI: 10.1002/14651858.CD005187.pub5] [DOI] [PMC free article] [PubMed] [Google Scholar]
Wilkinson 2017
- Wilkinson K, Wei Y, Szwajcer A, Rabbani R, Zarychanski R, Abou‐Setta AM, et al. Efficacy and safety of high‐dose influenza vaccine in elderly adults: a systematic review and meta‐analysis. Vaccine 2017;35(21):2775‐80. [DOI: 10.1016/jvaccine.2017.03.092] [DOI] [PubMed] [Google Scholar]
Wrenn 1994
- Wrenn K, Zeldin M, Miller O. Influenza and pneumococcal vaccination in the emergency department. Journal of General Internal Medicine 1994;9:425‐9. [DOI] [PubMed] [Google Scholar]
References to other published versions of this review
Thomas 2010
- Thomas RE, Russell M, Lorenzetti D. Interventions to increase influenza vaccination rates of those 60 years and older in the community. Cochrane Database of Systematic Reviews 2010, Issue 9. [DOI: 10.1002/14651858.CD005188.pub2] [DOI] [PubMed] [Google Scholar]
Thomas 2014
- Thomas RE, Lorenzetti DL. Interventions to increase influenza vaccination rates of those 60 years and older in the community. Cochrane Database of Systematic Reviews 2014, Issue 7. [DOI: 10.1002/14651858.CD005188.pub3] [DOI] [PMC free article] [PubMed] [Google Scholar]