Abstract
Tissue stiffness is often linked to underlying pathology and can be quantified by measuring the mechanical transient transverse wave speed (TWS) within the medium. Time-of-flight methods based on correlation of the transient signals or tracking of peaks have been used to quantify the TWS from displacement maps obtained with ultrasound pulse-echo techniques. However, it is challenging to apply these methods to in vivo data because of tissue inhomogeneity, noise and artifacts that produce outliers. In this study, we introduce a robust and fully automated method based on dynamic programming to estimate TWS in tissues with known geometries. The method is validated using ultrasound bladder vibrometry data from an in vivo study. We compared the results of our method with those of time-of-flight techniques. Our method performs better than time-of-flight techniques. In conclusion, we present a robust and accurate TWS detection method that overcomes the difficulties of time-of-flight methods.
Keywords: Wave tracking, Time-of-flight, Dynamic programming, Ultrasound vibrometery, Bladder, Wall stiffness
INTRODUCTION
The stiffness of tissue has been associated with underlying pathology of various medical conditions. Increase in tissue stiffness is associated with age and pathogenic processes and is due mainly to an increase in connective tissue (Liao and Schaefer 2007; Nenadic et al. 2013a, 2013b). For example, increase in bladder stiffness results in decreased bladder capacity, which may cause lower urinary tract symptoms and incontinence (Nenadic et al. 2013a, 2013b). Therefore, characterization of tissue stiffness for body organs is of clinical interest.
Quantitative ultrasound shear wave elastography has emerged as a non-invasive technique for assessment of tissue stiffness based on radiation force excitation and tracking of the induced shear waves (Bercoff et al. 2004; Nightingale et al. 2003; Pengfei et al. 2012). Application of such techniques has been reported to be highly reproducible and accurate in assessment of malignancies in different organs (Bonnefous and Pesqué 1986; Denis et al. 2015a, 2015b; Gregory et al. 2015; Mehrmohammadi et al. 2015; Palmeri et al. 2008; Tanter et al. 2008; Urban et al. 2012). Although tracking of transient shear waves in large organs, such as breast and liver, is possible with minor effects from surrounding tissue heterogeneity, structured media such as arteries, heart and bladder pose an additional difficulty, as tracking algorithms should capture wave dynamics along confined anatomic trajectories (Maksuti et al. 2016). These methods should be able first to detect such geometries from the acquired B-mode images and then to track the induced transient transverse waves along the estimated trajectory.
An example of this situation is ultrasound bladder vibrometry (UBV) (Mehrmohammadi et al. 2013; Nenadic et al. 2013a, 2013b). The bladder operates through complex coordination of musculoskeletal, neurologic and psychological functions that allow filling and emptying of bladder content. The relaxation and contraction of detrusor muscles, smooth muscles of the bladder wall, is the primary effector of continence. UBV has been introduced as a non-invasive technique for assessment of bladder wall mechanical properties versus bladder volume. This method employs focused ultrasound to tap the bladder wall and excite transient transverse waves on the wall. As these waves are at frequencies around tens to hundreds of cycles per seconds, an imaging speed of a few thousand frames per second is essential to fully capture the dynamics of these waves. Hence imaging techniques such as plane wave imaging are methods of choice that provide a sufficient imaging frame rate. However, the quality of plane wave imaging is significantly inferior to that of conventional line-by-line scanning (Couture et al. 2012). Hence both wall detection and tracking of transient waves become challenging tasks.
So far, mainly time-of-flight (TOF) methods, such as the time-to-peak (TTP) method (Palmeri et al. 2008) and cross-correlation (Xcorr) technique (McLaughlin and Renzi 2006; Tanter et al. 2008), have been used to quantify transient transverse wave speed (TWS) from displacement maps obtained with ultrasound pulse-echo techniques (Hasegawa and Kanai 2006; Nenadic et al. 2013a, 2013b). In TOF techniques, the transient wave arrival time is determined at multiple spatial locations for a window by assuming a fixed direction of propagation. The TWS is then calculated by fitting a regression line to data points. However, it is challenging to apply these methods to in vivo data because of tissue motion, low displacement signal-to-noise ratio (SNR), spatial tissue inhomogeneities and artifacts. These might cause failure in detection of accurate TWS because of the presence of gross outliers.
To deal with the influence of gross outliers, Wang et al. (2010) used a model fitting algorithm, the random sample consensus (RANSAC) (Fischler and Bolles 1981), to estimate TOF shear wave speed from ultrasonically tracked displacements in liver data. In this method, TOF TTP was measured as input points to the algorithm. Afterward, a trial solution was found by randomly selecting a subset of points to fit the model and iteratively updated by a cost function until finding the best fit. Although this method has been found to be robust in the presence of outliers, the RANSAC algorithm depends critically on a threshold parameter that is used to distinguish between inlier and outlier data. Furthermore, this parameter must be determined before processing the entire data set. In another study, Rouze et al. (2012) investigated the influence of such parameters as the shear wavelength of excitation, the kernel size used for shear wave speed calculation and the method used to determine the wave arrival time for accuracy of TOF shear wave speed estimation. They concluded that superior results are obtained using narrower excitation widths and arrival time estimators that detect the leading edge of the propagating wave.
In the work described here, we studied wave speed estimation for the special application in UBV to overcome the limitations of conventional TOF methods. Here, we address two problems. First, an automatic segmentation method is introduced for capturing the anatomic geometry of the underlying tissue from low-quality plane-wave images. The method is based on a dynamic programming approach, which penalizes large deviations from a known geometry. The second problem is speed calculation. Once the wave trajectory is obtained, the speed of transient waves is calculated along those geometries using spatial-temporal displacement data. To verify the performance of these methods, tracking of mechanical transient transverse waves in is performed in UBV applications. Data acquired from an in vivo UBV study were used to test both the robustness of the wall detection and the wave tracking capabilities of the proposed techniques.
METHODS
Data acquisition
The UBV study was conducted under a protocol approved by the Mayo Clinic institutional review board. Informed consent was obtained from all patients before the study. To obtain in vivo data, we used plane-wave ultrasound imaging both to locate the bladder wall and to track induced waves along the wall (such waves may be modeled as a Lamb wave). Data were collected using a Verasonics V1 ultrasound system with 128 channels (Verasonics, Redmond, WA, USA) equipped with a C4-2 curved array transducer that has 128 elements (Verasonics). To create acoustic radiation forces using the C4-2 probe, a depth-variable aperture size was used to maintain a constant F-number of 1 throughout the tissue depth. Safety tests were performed in a degassed water tank with a calibrated needle hydrophone (HGL020, Onda, Sunnyvale, CA, USA) before the patient studies to meet the Food and Drug Administration’s mechanical index and temperature index limits.
The focus of radiation force was manually set at the bladder wall, and excitation of a 600-μs tone burst was used to induce a transient wave in the bladder wall. Detection pulses were transmitted at a pulse repetition frequency of 2.0 kHz with a center frequency of 3 MHz. Ultrasound raw data in in-phase/quadrature format were collected using Verasonics’ plane-wave imaging with three-angle compounding. The displacement map of the tissue was derived from radiofrequency echo data using an autocorrelation technique (Hasegawa and Kanai 2006) after conversion from in-phase/quadrature data provided by the Verasonics system.
Data were collected during a urodynamic study (UDS) of a patient’s bladder. UDS is a clinical procedure in which a catheter is placed through the urinary channel into the bladder for the purpose of filling the bladder with a fluid at incrementally increasing volumes. At each volume, bladder detrusor pressure is measured via two pressure sensors. The relationship between detrusor pressure and volume is studied to assess bladder compliance. In our study, we analyzed two separate data sets. Data set I consisted of eight different bladder-filling volumes with multiple acquisitions (at least two acquisitions per volume) at each volume (a total of 18 acquisitions) for one patient to assess the intra-patient performance of our method. Data set II consisted of one volume per nine patients to test the inter-patient performance of our method. We used a computer with an Intel i3 dual core processor with 3.3-GHz clock speed and 16 GB memory to process our data.
Dynamic programming
Dynamic programming (DP) is a technique for solving numerous problems by successively finding locally optimal solutions (Akkus et al. 2012, 2015). DP algorithms enable one to find an optimal connective path through a graph of nodes. In image processing, the graph is generally a matrix of cost values related to an image. Each node has a cost, and the optimal path is searched through the graph of nodes—the path for which the sum of the costs is minimal. The step size, which is the maximum distance between two nodes in consecutive columns, is selected based on desired connectivity. In Figure 1 is an example of a DP search for a 1-D path. On the left (Fig. 1a), we see the nodes of the cost matrix, and the connectivity between the nodes when going from left to right. Each node has maximum of three predecessors in the previous column. Each node has a cost that is derived from an image-related cost function. In Figure 1b, the cumulative cost for each node is calculated from left to right. In the leftmost column, the cumulative cost is the cost of the node itself. In the next column, for each node, the predecessors are compared and the one with lowest cumulative cost is chosen. The cost of the node itself is added to this lowest one to obtain the cumulative cost for the current node. From left to right, all columns of cumulative costs are filled. In the cost matrix on the right side (Fig. 1c), the optimal path is found by taking the node in the last column with the lowest cumulative cost and going from right to left using back-propagation. The minimal cumulative costs are in color, and the optimal path connects minimal cumulative costs. This results in a globally optimal path.
Fig. 1.
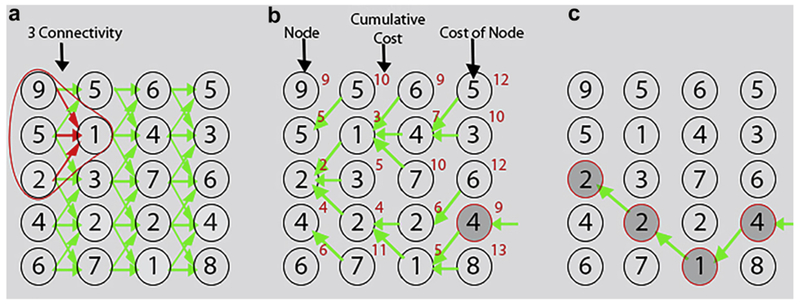
Example of automated DP search for a 1-D path. (a) Original cost matrix with its connectivity graph. (b) Cost matrix with cumulative cost. (c) The optimal path found by backtracking. DP = dynamic programming.
Note that a simple forward search for the neighbor with lowest cost would not find the optimal path with lowest cost 9, but a suboptimal path with cost 10. DP has been widely used in medical image segmentation (Akkus et al. 2015) and tracking (Akkus et al. 2012; Hoogi et al. 2012). It provides robust solutions and enforces spatial or temporal continuity. In our case, we used DP to search for an optimal path for bladder wall detection and transient wave tracking while enforcing spatial and temporal continuity. DP was implemented using MATLAB (Version R2014b, The MathWorks, Natick, MA, USA).
Bladder wall detection
In this step, we detect the bladder wall in the averaged B-mode image over F = 50 frames (~25 ms) using dynamic programming (Akkus et al. 2012). The bladder wall appears as the brightest structure in the B-mode image (Fig. 2). First, we normalize the image intensities between 0 and 1 by dividing to its maximum intensity value. Second, we obtain the inverted image () by subtraction of all image intensities from maximum intensity value (1) and use it as a cost matrix. As explained in the 1-D DP search and outlined in the equation
| (1) |
where x and y are spatial coordinates, Δ is step size and p is a parameter that adjusts the strength of the penalty for each step, we calculate the cumulative cost (C) from left to right in the cost matrix and detect the optimal path for bladder wall in the B-mode image by minimizing the cost function. We defined the step size (Δ) as 1 pixel (256 μm) as the wall has continuity in the image and is not expected to change more than a pixel from column to column.
Fig. 2.
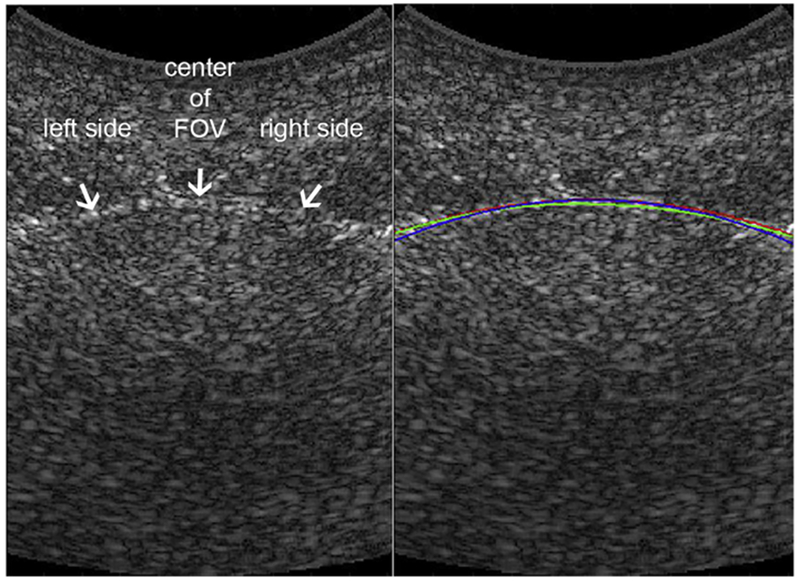
Tracking of bladder wall in B-mode image. Left: B-Mode image with arrows pointing to the bladder wall. Right: B-Mode image with color curves tracking bladder wall. Blue curve: Manual wall tracing (for Z.A.). Red curve: manual wall tracing (for M.C.). Green line: Automated dynamic programming tracking result. The ultrasound clutter inside the bladder is due to the system’s low signal-to-noise ratio. FOV = field of view.
Penalty strength p = 5 was empirically set to a 20% additional penalty to node cost for each step as a smoothness constraint. After detecting the optimal path for the bladder wall with DP, we fit a fourth-order polynomial, as is deemed reasonable to capture bladder wall curvature, to DP results to obtain a smooth wall.
Transient wave tracking
After locating the bladder wall, we create a transient wave displacement map for the bladder wall as a function of time and distance, as seen in Figure 3. In each column of the displacement map are the bladder wall displacements obtained by comparing two consecutive B-mode frames over time using autocorrelation technique (Bonnefous and Pesqué 1986; Luo and Konofagou 2010). In this displacement map (D), we define our problem as searching for the optimal path for the propagating transient wave over time while enforcing spatial and temporal continuity. We did this by minimizing the cost function defined by
| (2) |
where t is time, y is distance, Δ is step sizes and is the cost matrix. P(δ), a penalty function, is different for the left PL(δ) and right PR(δ) parts of the wall and is defined as
| (3) |
where β adjusts the strength of the penalty, and N is neutralization cost (a high cost to prevent that direction).
Fig. 3.
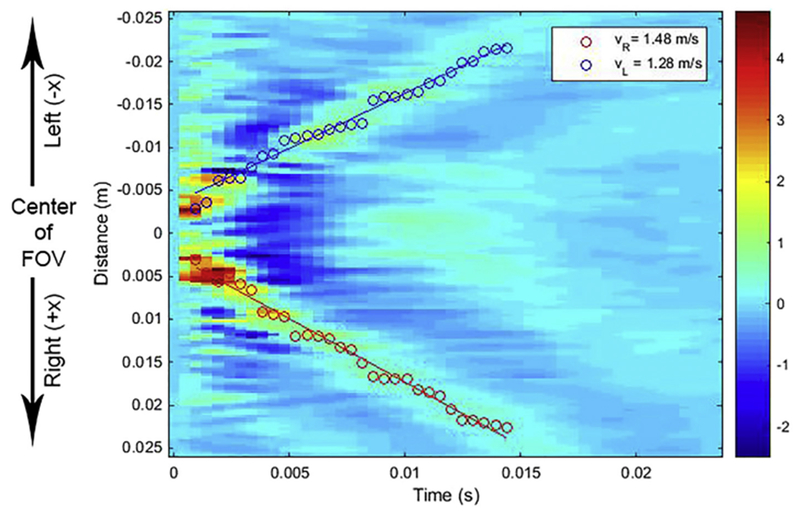
Displacement map indicating wave propagation in the bladder wall. Red-green signal indicates the positive displacement of the transient wave propagating over time. Blue signal indicates the negative displacement of the transient wave propagating over time. Overlaid red circles represent the path points detected by dynamic programming for the right side of the wall; and blue circles, for the left side of the wall. Red and blue lines are regression lines. FOV = field of view.
For the left side of the bladder (see Figs. 2 and 3) with respect to the center of the field of view (FOV), we apply a high penalty (N=F*1) to steps toward the right side of the bladder (+x direction, as illustrated in Fig. 3), as radiation force is applied to the center of the FOV, and the transient wave propagates to the negative (−x) direction on the left side of the bladder wall, as illustrated in Figure 3, and is not expected to propagate in the positive (+x) direction, the right side of the wall. For the right side of the bladder (see Figs. 2 and 3) with respect to the center of the FOV, we apply a high penalty to steps toward the left side of the bladder (−x direction, see Fig. 3), because the transient wave propagates to the positive (+x) direction on the right side of the bladder and is not expected to propagate in the negative (−x) direction. We set the maximum step size (Δ) to 10 pixels (2.6 mm) between two consecutive time points. This corresponds to a velocity of 5.34 m/s, which is higher than the maximum velocity of transient waves available in our data set. In the exponential penalty part of function P(δ), the strength of the penalty (β) was set as 103. This means that it applies about 1% penalty to the node cost when it reaches the maximum step. This enforces the temporal smoothness for impulse wave tracking. These values of parameters were empirically set and are not hard penalties that cause over smoothing.
In the next step, we corrected the distances in the displacement map for the curvature of the bladder wall by calculating the arc length ds in the x−y Cartesian coordinate image plane, .
As a final step, we take into account only the optimal wave path points detected with DP until the transient wave reaches the left and right ends of the bladder wall in the image and fitted a regression line to these points. The slope of the regression line was considered the TWS.
Evaluations
Using in vivo UBV data sets I and II, we evaluated the performance of our automated method by comparing its results with those of manual tracking, which was considered the reference standard. Two independent observers (Z.A., M.C.) manually tracked the peak of the transient wave in the displacement map and fit a linear regression line to manual tracking points to estimate the TWS for data set I. The reference standard (“ground truth” [GT]) was obtained as the average of manual TWS results. For data set II, we had only one observer’s manual tracing (Z.A.) and considered that as ground truth. To avoid possible observer bias, manual peak tracking was performed before using the automated method. Root mean square error (RMSE) was calculated between the automated results and ground truth. We also compared our proposed method with conventional TOF methods, such as TTP and Xcorr. Furthermore, to measure the robustness of our proposed method, we added Gaussian noise with zero mean and variance σnoise2, where σnoise2=σdata2/10SNR/10, to an in vivo data set and measured the TWS for a range of SNRs (from 10 to 0 dB) with our method and TOF methods and compared the results. In addition, as an instructive example of application in UBV, we present plots of TWS versus bladder volume and versus detrusor pressure that were collected during the UDS procedure as described in our prior publications (Mehrmohammadi et al. 2013; Nenadic et al. 2013a, 2013b).
To evaluate the TWS for the right and left sides of the bladder wall, we calculated the error (ERL) between the right TWS (TWSR) and left TWS (TWSL) estimates, where ERL = (TWSR−TWSL)/(TWSR + TWSL).
To validate the performance of the automated wall detection method, we compared the automated DP results with manual ground truth for 18 in vivo measurements from the same patient. Similar to the aforementioned case, in each case, the ground truth was obtained as the average of manual wall tracking (y′) by two independent observers (Z.A., M.C.) using B-mode images. The RMSE (= , where x, y′ and y are image spatial coordinates) between the automated results (y) and ground truth was calculated.
RESULTS
The RMSE ± standard deviation between automated wall tracking by DP and the ground truth averaged over 18 acquisitions is on the same order as the RMSE between two observers (inter-observer [IO] variability), as seen in Table 1. An example of automated wall tracking can be seen in Figure 2. It takes less than a second (~0.72 s) to detect the bladder wall from B-mode images using DP.
Table 1.
RMSE between two observers and between AWT and GT
| Wall tracking | RMSE (mm) |
|---|---|
| Between two observers | 0.44 ± 0.24* |
| Between AWT and GT | 0.65 ± 0.27 |
AWT = automated wall tracking; GT = ground truth; RMSE = root mean square error.
Mean ± standard deviation.
The median and interquartile range of TWS estimates over 18 acquisitions for manual wave tracking for each observer, the TTP method and the Xcorr technique are listed in Table 2. TTP underestimates the TWS compared with ground truth, whereas the Xcorr technique overestimates the TWS values, as seen in Table 2. In the last row of Table 2 are the TWS errors between right and left sides of the bladder wall over 18 acquisitions for each method. Table 3 compares the RMSEs of DP, TTP and Xcorr with the ground truth and RMSE between two observers (Z.A. and M.C.), which is the inter-observer variability, for data sets II and I. It takes about half a second (~0.5 s) to estimate TWS using DP.
Table 2.
Transient wave speed over 18 acquisitions for the two observers’ (Z.A. and M.C.) manual tracking and GT, TTP and Xcorr techniques*
| Transient wave speed (m/s) | ||||||
|---|---|---|---|---|---|---|
| Manual tracking |
||||||
| Z.A. | M.C. | Ground truth | Dynamic programming | Time to peak | Cross-correlation | |
| Left | ||||||
| Median | 1.69 | 1.64 | 1.69 | 1.6 | 1.6 | 3.19 |
| IQR | 1.48–2.32 | 1.45–2.32 | 1.48–2.32 | 1.52–2.41 | 0.26–1.78 | 2.11–4.50 |
| Right | ||||||
| Median | 1.66 | 1.66 | 1.63 | 1.58 | 1.34 | 1.98 |
| IQR | 1.50–2.46 | 1.46–2.53 | 1.50–2.50 | 1.28–2.33 | 0.83–1.69 | 1.55–5.47 |
| ERL | 0.01 ± 0.08* | −0.02 ± 0.10 | −0.02 ± 0.08 | 0.03 ± 0.11 | −0.08 ± 0.69 | 0.67 ± 2.41 |
ERL = error between right and left parts of the wall from center of field of view; IQR = inter-quartile range (IQR) for left and right parts of the wall from the center of field of view.
Mean ± standard deviation.
Table 3.
Root mean square errors between two observers (Inter-observer), between DP tracking and GT, between TTP results and GT and between Xcorr results and GT for transient wave speed estimation in data sets I and II
| Data set | Bladder wall | Root mean square error (m/s) |
|||
|---|---|---|---|---|---|
| Inter-observer | DP vs. GT | TTP vs. GT | Xcorr vs. GT | ||
| I | Left | 0.14 ± 0.09* | 0.20 ± 0.22 | 1.0 ± 1.40 | 4.23 ± 7.42 |
| Right | 0.15 ± 0.14 | 0.22 ± 0.22 | 1.01 ± 1.54 | 1.90 ± 2.29 | |
| II | Left | — | 0.13 ± 0.18 | 1.14 ± 1.06 | 2.00 ± 1.25 |
| Right | — | 0.17 ± 0.13 | 1.37 ± 0.72 | 3.43 ± 3.97 | |
DP = dynamic programming; GT = ground truth; TTP = time to peak; Xcorr = cross-correlation.
Mean ± standard deviation.
It is instructive to see how TWS changes with volume and detrusor pressure. Figure 4 is a scatterplot of TWS, separately averaged for the left and right waves in the bladder wall versus bladder volume, illustrating the rise in TWS with volume. Figure 5 is a scatterplot of TWS, separately averaged for the left and right waves in the bladder wall versus bladder detrusor pressure, illustrating the rise in TWS with pressure. There is a significant correlation between bladder volume and both the left TWS (Pearson correlation r = 0.821, p = 0.013) and the right TWS (r = 0.823, p = 0.012). There is also a significant correlation between detrusor pressure and both the left TWS (r = 0.918, p = 0.001) and the right TWS (r = 0.953, p = 0.000).
Fig. 4.
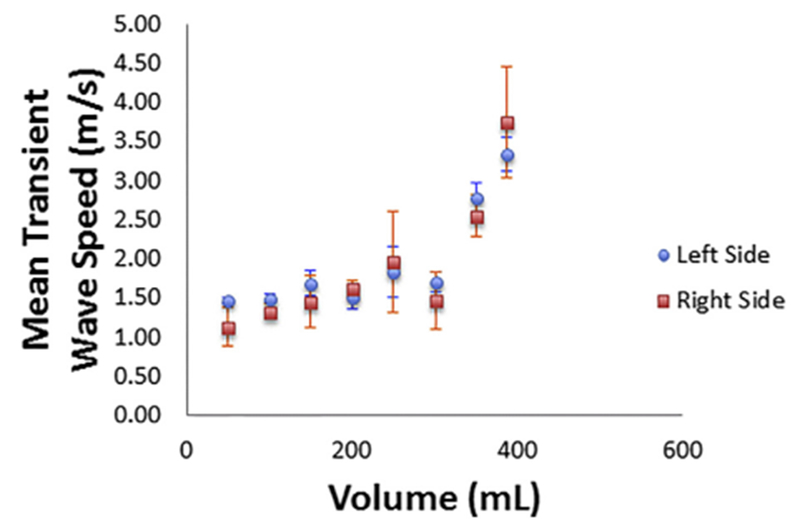
Plot of averaged transient wave speed for the left and right sides of the bladder wall versus bladder volume for 18 different acquisitions at 8 volumes.
Fig. 5.
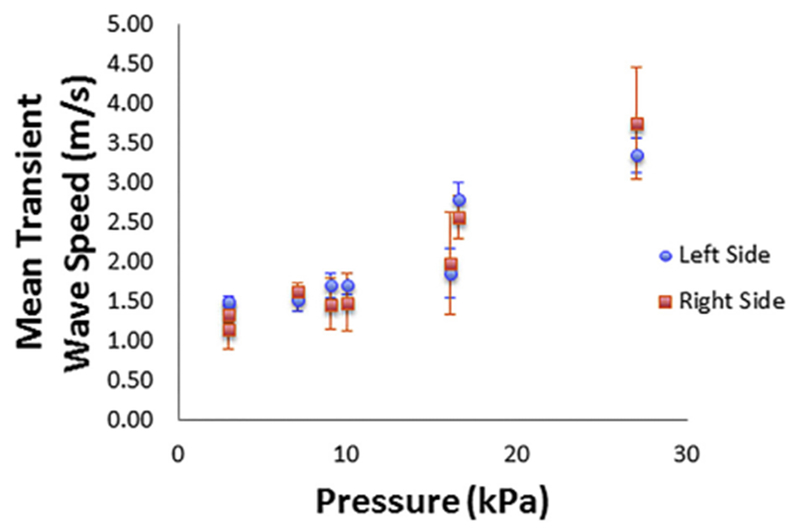
Plot of the averaged transient wave speed for the left and right sides of the bladder wall versus detrusor pressure in the bladder for 18 different acquisitions at 8 volumes.
Figure 6 illustrates the RMSEs for degraded displacement maps with added Gaussian noise for a range of SNR values (from 10 to 0 dB). The RMSEs for DP and TTP are on the same order as inter-observer variability for SNRs from 10 to 6 dB. However, the error for TTP increases between 6 and 0 dB, whereas the error remains consistently low for DP. Comparisons for Xcorr are not included in this plot because the error values for Xcorr are too high, as outlined in Table 2. In Figure 7 are a noise-added displacement map with 0-dB SNR and the results of tracking the transient waves with the DP method.
Fig. 6.
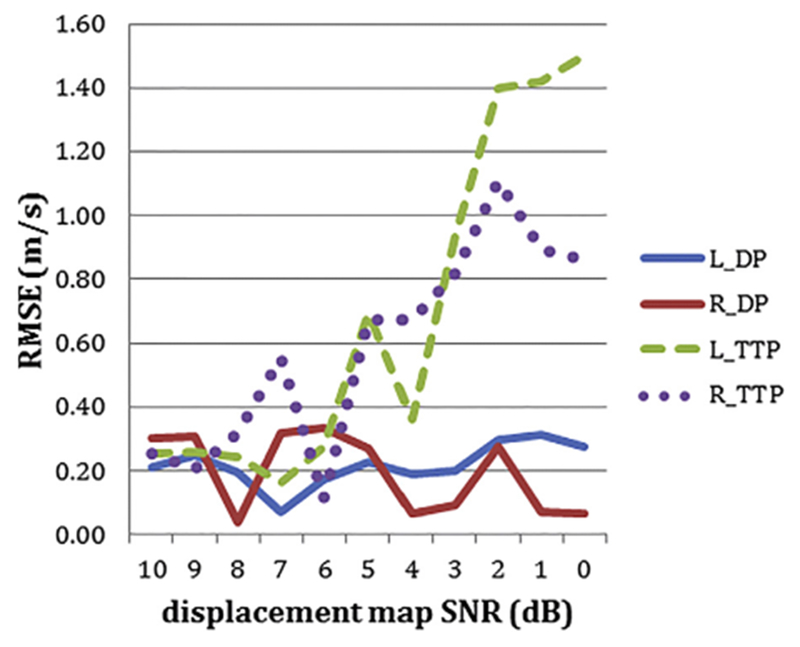
RMSE for degraded displacement maps with Gaussian noise for a range of SNR. Blue line: TWS obtained with dynamic programming. Red line: Right TWS obtained with dynamic programming. Green dashed line: Left TWS obtained with time to peak method. Purple dotted line: Right TWS obtained with time to peak method. RMSE = root mean square error; SNR = signal-to-noise ratios; TWS = left transient wave speed.
Fig. 7.
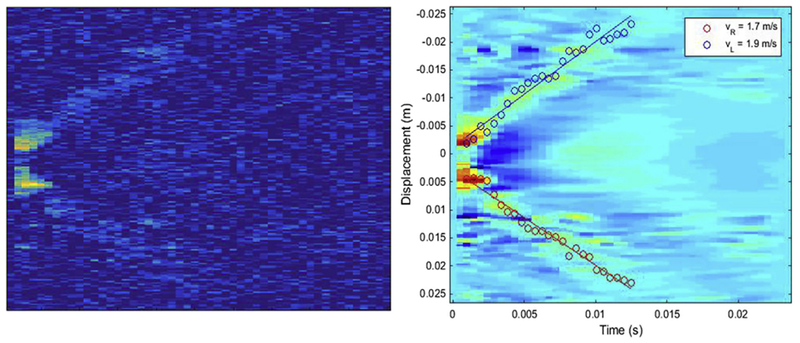
Left: Displacement map with signal-to-noise ratio of 0 dB after adding Gaussian noise. Right: Results of tracking transient waves using the image on the left. The results are overlaid on the original (no noise) displacement map.
DISCUSSION
We have described a method for estimating the TWS, with the particular application in ultrasound bladder vibrometry. In the literature, the use of TOF methods for estimation of the transient or shear wave speed is well established. However, the application of TOF methods to in vivo data for estimating TWS is challenging because of the presence of outliers resulting from such sources as noise, artifacts, tissue motion and tissue inhomogeneity. Therefore, TOF methods are not suitable for accurate estimation of TWS for in vivo bladder data.
Here, we considered the average of tracking by two observers as the ground truth. As seen in Table 1, our automated wall tracking method based on DP is as good as manual tacking by human observers, as the average RMSEs between our method and the ground truth are on the same order as the inter-observer variability. As long as the bladder wall is visible and the brightest structure in the B-mode image and there are no severe artifacts, our wall tracking method will successfully detect the bladder wall. As plane-wave imaging is used for the acquisition of B-mode images, the SNR is inherently low in comparison with conventional ultrasound B-mode images. Improvement of B-mode image SNR with compounding techniques could make our method more robust to noise and artifacts.
As seen in Table 2, the magnitudes of estimated TWS are on the same order for both manual wave tracking and our automated DP method. However, the TTP method underestimates and the Xcorr technique overestimates the TWS compared with ground truth because of the presence of outliers resulting from noise and artifacts. As seen in Table 3, the TWS calculation method based on DP is as good as human manual tracking results in intra-patient data (data set I), as well as across patients (data set II). The TOF-based TTP technique performs better than the TOF-based Xcorr technique based on the measured errors. We speculate that the slight variations between right and left measurements of TWS by GT (ERL = −0.02 ± 0.08) and by DP (ERL = 0.03 ± 0.11) are due mainly to experimental errors as there is no physical justification for a difference between the left and right measurements. However, the large variations in right and left measurements of TWS by TTP (ERL = −0.08 ± 0.69) and Xcorr (ERL = 0.67 ± 2.41) are probably due to suboptimal tracking by these two methods.
As an instructive example, Figures 4 and 5 illustrate the rise in TWS obtained by our DP-based method versus bladder volume and bladder detrusor pressure. The rise in TWS results from elevation of bladder wall elasticity at higher volumes and higher detrusor pressures, as described in previous studies on UBV (Mehrmohammadi et al. 2013; Nenadic et al. 2013a, 2013b). As explained under Data Acquisition, the UBV method can be implemented in a suitable medical ultrasound system (e.g., Verasonics V1 system) for clinical use, and the measured TWS results could potentially be used as a biomarker to differentiate non-invasively between healthy and unhealthy bladder wall tissues.
Figures 6 and 7 illustrate that our DP-based method is robust to noise and provides accurate results.
A limitation of this study is that we used the manual reference standard as the ground truth for the validation of our method. This could be a suboptimal reference for this purpose. However, this choice was deemed appropriate in the absence of a gold standard method for this type of measurement (Amador et al. 2011).
Although in this study we focused on bladder vibrometry, the DP-based method presented here could be applied to other organs with a layered structure, such as vessels and heart wall. Also, the DP TWS estimation method employed in this work can be used to estimate wave speed in shear wave elastography of organs with non-layered structures.
CONCLUSIONS
We described a fully automated, robust and accurate method based on DP for estimating TWS in UBV. The method overcomes the challenges in estimation of TWS from in vivo bladder data and performs better than conventional TOF methods. The proposed DP-based TWS could potentially be used in other applications, such as shear wave elastography of different organs.
Acknowledgments—
This study was supported by National Institutes of Health (NIH) Grants R01 DK99231, R01 CA148994, R01 EB17213 and R01 CA174723. The content is solely the responsibility of the authors and does not necessarily represent the official views of the NIH.
REFERENCES
- Akkus Z, Carvalho DD, van den Oord SC, Schinkel AF, Niessen WJ, de Jong N, van der Steen AF, Klein S, Bosch JG. Fully automated carotid plaque segmentation in combined contrast-enhanced and Bmode ultrasound. Ultrasound Med Biol 2015;41:517–531. [DOI] [PubMed] [Google Scholar]
- Akkus Z, Hoogi A, Renaud G, ten Kate GL, van den Oord SCH, Schinkel AFL, de Jong N, van der Steen AFW, Bosch JG. Motion compensation method using dynamic programming for quantification of neovascularization in carotid atherosclerotic plaques with contrast enhanced ultrasound (CEUS) In: Bosch JG, Doyley MM, (eds). Medical imaging 2012: Ultrasonic imaging, tomography, and therapy, 8320. San Diego, CA: SPIE; 2012. p. 83200C. [Google Scholar]
- Amador C, Urban MW, Chen S, Chen Q, An KN, Greenleaf JF. Shear elastic modulus estimation from indentation and SDUV on gelatin phantoms. IEEE Trans Biomed Eng 2011;58:1706–1714. [DOI] [PMC free article] [PubMed] [Google Scholar]
- Bercoff J, Tanter M, Fink M. Supersonic shear imaging: a new technique for soft tissue elasticity mapping. IEEE Trans Ultrason Ferroelectr Freq Control 2004;51:396–409. [DOI] [PubMed] [Google Scholar]
- Bonnefous O, Pesqué P. Time domain formulation of pulse-Doppler ultrasound and blood velocity estimation by cross correlation. Ultrason Imaging 1986;8:73–85. [DOI] [PubMed] [Google Scholar]
- Couture O, Fink M, Tanter M. Ultrasound contrast plane wave imaging. IEEE Trans Ultrason Ferroelectr Freq Control 2012;59:2676–2683. [DOI] [PubMed] [Google Scholar]
- Denis M, Bayat M, Mehrmohammadi M, Gregory A, Song PF, Whaley DH, Pruthi S, Chen SG, Fatemi M, Alizad A. Update on breast cancer detection using comb-push ultrasound shear elastography. IEEE Trans Ultrason Ferroelectr Freq Control 2015a;62: 1644–1650. [DOI] [PMC free article] [PubMed] [Google Scholar]
- Denis M, Mehrmohammadi M, Song P, Meixner DD, Fazzio RT, Pruthi S, Whaley DH, Chen S, Fatemi M, Alizad A. Comb-push ultrasound shear elastography of breast masses: Initial results show promise. PLoS One 2015b;10:e0119398. [DOI] [PMC free article] [PubMed] [Google Scholar]
- Fischler MA, Bolles RC. Random sample consensus: A paradigm for model fitting with applications to image analysis and automated cartography. Commun ACM 1981;24:381–395. [Google Scholar]
- Gregory A,Mehrmohammadi M, Denis M, Bayat M, Stan DL, Fatemi M, Alizad A. Effect of calcifications on breast ultrasound shearwave elastography: An investigational study. PLoS One 2015;10:e0137898. [DOI] [PMC free article] [PubMed] [Google Scholar]
- Hasegawa H, Kanai H. Improving accuracy in estimation of artery-wall displacement by referring to center frequency of RF echo. IEEE Trans Ultrason Ferroelectr Freq Control 2006;53:52–63. [DOI] [PubMed] [Google Scholar]
- Hoogi A, Akkus Z, van den Oord SCH, ten Kate GL, Schinkel AFL, Bosch JG, de Jong N, Adam D, van der Steen AFW. Quantitative analysis of ultrasound contrast flow behavior in carotid plaque neovasculature. Ultrasound Med Biol 2012;38:2072–2083. [DOI] [PubMed] [Google Scholar]
- Liao LM, Schaefer W. Cross-sectional and longitudinal studies on interaction between bladder compliance and outflow obstruction in men with benign prostatic hyperplasia. Asian J Androl 2007;9:51–56. [DOI] [PubMed] [Google Scholar]
- Luo J, Konofagou EE. A fast normalized cross-correlation calculation method for motion estimation. IEEE Trans Ultrason Ferroelectr Freq Control 2010;57:1347–1357. [DOI] [PMC free article] [PubMed] [Google Scholar]
- Maksuti E, Widman E, Larsson D, Urban MW, Larsson M, Bj€allmark A. Arterial stiffness estimation by shear wave elastography: Validation in phantoms with mechanical testing. Ultrasound Med Biol 2016;42: 308–321. [DOI] [PubMed] [Google Scholar]
- McLaughlin J, Renzi D. Shear wave speed recovery in transient elastography and supersonic imaging using propagating fronts. Inverse Probl 2006;22:681–706. [Google Scholar]
- Mehrmohammadi M, Nenadic IZ, Urban MW, Greenleaf JF, Alizad A, Husmann DA, Mynderse LA, Fatemi M. Ultrasound bladder vibrometry for evaluation of bladder compliance: Preliminary in vivo results. J Acoust Soc Am 2013;134:4011. [Google Scholar]
- Mehrmohammadi M, Song P, Meixner DD, Fazzio RT, Chen S, Greenleaf JF, Fatemi M, Alizad A. Comb-push ultrasound shear elastography (CUSE) for evaluation of thyroid nodules: Preliminary in vivo results. IEEE Trans Med Imaging 2015;34:97–106. [DOI] [PMC free article] [PubMed] [Google Scholar]
- Nenadic I, Mehrmohammadi M, Urban MW, Alizad A, Greenleaf JF, Fatemi M. In vivo patient measurements of bladder elasticity using ultrasound bladder vibrometry (UBV). Conf Proc IEEE Eng Med Biol Soc 2013a;2013:113–116. [DOI] [PubMed] [Google Scholar]
- Nenadic IZ, Qiang B, Urban MW, Vasconcelo LHD, Nabavizadeh A, Alizad A, Greenleaf JF, Fatemi M. Ultrasound bladder vibrometry method for measuring viscoelasticity of the bladder wall. Phys Med Biol 2013b;58:2675–2695. [DOI] [PubMed] [Google Scholar]
- Nightingale K, McAleavey S, Trahey G. Shear-wave generation using acoustic radiation force: In vivo and ex vivo results. Ultrasound Med Biol 2003;29:1715–1723. [DOI] [PubMed] [Google Scholar]
- Palmeri ML, Wang MH, Dahl JJ, Frinkley KD, Nightingale KR. Quantifying hepatic shear modulus in vivo using acoustic radiation force. Ultrasound Med Biol 2008;34:546–558. [DOI] [PMC free article] [PubMed] [Google Scholar]
- Pengfei S, Heng Z, Manduca A, Urban MW, Greenleaf JF, Shigao C. Comb-push ultrasound shear elastography (CUSE): A novel method for two-dimensional shear elasticity imaging of soft tissues. IEEE Trans Med Imaging 2012;31:1821–1832. [DOI] [PMC free article] [PubMed] [Google Scholar]
- Rouze NC, Wang MH, Palmeri ML, Nightingale KR. Parameters affecting the resolution and accuracy of 2-D quantitative shear wave images. IEEE Trans Ultrason Ferroelectr Freq Control 2012; 59:1729–1740. [DOI] [PMC free article] [PubMed] [Google Scholar]
- Tanter M, Bercoff J, Athanasiou A, Deffieux T, Gennisson JL, Montaldo G, Muller M, Tardivon A, Fink M. Quantitative assessment of breast lesion viscoelasticity: Initial clinical results using Supersonic Shear imaging. Ultrasound Med Biol 2008;34: 1373–1386. [DOI] [PubMed] [Google Scholar]
- Urban MW, Chen S, Fatemi M. A review of shearwave dispersion ultrasound vibrometry (SDUV) and its applications. Curr Med Imaging Rev 2012;8:27–36. [DOI] [PMC free article] [PubMed] [Google Scholar]
- Wang MH, Palmeri ML, Rotemberg VM, Rouze NC, Nightingale KR. Improving the robustness of time-of-flight based shear wave speed reconstruction methods using RANSAC in human liver in vivo. Ultrasound Med Biol 2010;36:802–813. [DOI] [PMC free article] [PubMed] [Google Scholar]


