Abstract
Aging-associated decrease in internal anal sphincter (IAS) tone (AADI) is a major contributor in the rectoanal incontinence (RI). To determine the pathogenesis of AADI, we investigated the effect of aging on GPCR activation and related downstream signaling. We particularly investigated two GPCRs that characterize IAS smooth muscle cells (SMCs): thromboxane A2 and angiotensin II type 1. Two groups of Fischer 344 rats (6-month-old [young group] and 26-month-old [old group]) were employed to determine the GPCR function by isometric contraction, the expressions of GPCRs, and their downstream regulatory signaling proteins (regulator of G-protein signaling 2, RGS2; GPCR Kinase 5, GRK5; and β-arrestin, Arrb2) using RT-PCR, qPCR, and western blot analyses. We used reversible biotinylation to monitor the GPCR trafficking using SMCs. Aging selectively attenuated thromboxane A2 and Ang II-induced IAS contraction. RT-PCR, qPCR, and WB data revealed a significant decrease in the expressions of the GPCRs and increase in the expression of RGS2, GRK5, and Arrb2. The increased GPCR internalization and decreased recycling under aging were validated by reversible biotinylation. We conclude that downregulation of GPCR, accompanied by upregulation of regulatory proteins, plays an important role in receptor desensitization and may be important underlying mechanisms of RI in certain aging patients.
Subject terms: Gastroenterology, Gastrointestinal diseases
Introduction
The myogenic basal tone in the internal anal sphincter (IAS) is crucial in rectoanal incontinence (RI)1–4. The causes of RI are multifactorial, but a leading cause in humans is an aging-associated decrease in the IAS tone (AADI) and compromise in the fibroelastic properties (FEP) of the IAS5–7. Little is known about the molecular mechanisms underlying these phenomena, and this has impeded the development of a specific and safe treatment for debilitating AADI-related RI5,8.
Recent studies from different laboratories have shown that in animals and humans, unique myogenic properties of the IAS smooth muscle cells (SMCs) are characterized by the renin-angiotensin system (RAS) and arachidonic acid (AA) pathways, mediated through angiotensin II (Ang II) and thromboxane A2 (TXA2) by AT1-R and TXA2-R, respectively, via the G-protein coupled receptors (GPCR)9–14. Further studies have shown that this local control provides an extracellular trigger for the activation of RhoA-associated kinase (RhoA/ROCK), a major molecular determinant of the basal IAS tone14–19.
A number of studies have hypothesized that prolonged aging-related GPCR stimulation may desensitize and thus significantly decrease GPCR mediated contractility20. It has been speculated that such desensitization may occur either when accelerated Gα hydrolysis inhibits GPCR signaling (by conversion of GTP to GDP) or because of actual GPCR downregulation primarily via GPCR internalization, subsequently all leading to the compromised GPCR recycling21.
Regulators of G-protein signaling (RGS; e.g., RGS2) play an important role in inhibiting GPCR signaling by accelerating Gα hydrolysis. In addition, other regulatory proteins GPCR kinases (GRKs) that phosphorylate the C-terminal tail of the GPCR have been shown to play an important role in GPCR inactivation/internalization/downregulation in different systems, specifically by recruiting β-arrestin (Arrb), which binds to the GPCR on the internal surface22–25.
Despite this significant progress in the field, a logical question related to the role of GPCR regulation in relation to AADI has not been addressed: What is the role of TXA2-R and AT1-R trafficking in causing AADI? To examine this question, we carried out GPCR functional analysis by examining the effects of GPCR activation before and after their respective and selective antagonists. In addition, the studies involved expression analyses of the GPCRs (TXA2-R and AT1-R) and downward regulatory proteins (RGS2, GRK5, and Arrb2) at transcriptional and translational levels via RT-PCR, qPCR, and western blot studies. To examine the issue of receptor trafficking for the role of GPCR internalization, we focused our studies on TXA2-R, using reversible biotinylation approach. Present studies advance understanding of the pathophysiology of the AADI-associated RI and provide guidance for development of targeted therapy.
Materials and Methods
Animals and internal anal sphincter (IAS) tissues preparation
We used two distinct age groups of Fischer 344 rats: 6-month-old (young group) and 26-month-old (old group). The Institutional Animal Care and Use Committee (IACUC) of Thomas Jefferson University approved the experimental protocols. All studies were performed in accordance with the Guide for the Care and Use of Laboratory Animals of the National Institutes of Health, USA.
Rats were euthanized by decapitation, and their anal canals were quickly removed and transferred to oxygenated (95% O2 + 5% CO2) Krebs physiological solution (KPS) of the following composition: NaCl 118.07 mM, KCl 4.69 mM, CaCl2 2.52 mM, MgSO4 1.16 mM, NaH2PO2 1.01 mM, NaHCO3 25 mM, and glucose 11.10 mM (37 °C). The IAS SM strips (~1 × 10 mm) from the circular smooth muscle (CSM) layer were isolated as per protocol used in our previous studies26.
Isometric tension measurement
Above prepared IAS SM strips from different age groups were transferred to 2 ml organ baths containing oxygenated KPS at 37 °C and employed for the isometric contraction studies as described previously15. All force data were monitored using force transducers (model Fort 10 g, WPI, Sarasota, FL) and Chart 4.1.2 via a PowerLab/8SP data-acquisition system (ADInstruments, Colorado Springs, CO). The IAS SM strips were allowed to equilibrate in the organ baths for 90 min for the steady development of the tone. (Spontaneous development of the tone, and its relaxant responses to appropriate electrical field stimulation parameters formulated the basis for distinguishing the IAS from the adjoining rectal SM strips11). The basal tone in the IAS was calculated with reference to the baseline determined at the beginning and at the end of each experiment with KPS containing 0 Ca2+. Cumulative concentration-response curves (CRC) for different agonists in the IAS SM strips were obtained before and after the respective antagonists and inhibitors27–29. We determined the CRC for U46619 (1 nM to 10 µM), and Ang II (0.1 nM to 1 µM) in the IAS in the absence and the presence of SQ29548 (0.1 µM) and losartan (0.1 µM), respectively. The range of concentrations for the agonists and antagonists was based on our previous studies11,12,14. The increases and decreases in IAS basal tone were expressed as absolute as well as the percentage of maximal contraction and relaxation by 100 µM bethanechol and 0 Ca2+, respectively.
To compare the relaxation and redevelopment kinetics for basal IAS tone of young group versus the old group, we determined the relaxing effects of Ca2+-free (0 Ca2+)-containing KPS and redevelopment of the tone with normal KPS26,30,31, as Ca2+ is the major determinant of the smooth muscle tone. Conversely, to compare the kinetics and rates of increase (g/min) in the IAS tone (or contraction), we used submaximally effective concentrations of U46619 (1 µM), Ang II (0.1 µM), and KCl (60 mM).
Isolation of smooth muscle cells (SMCs)
SMCs from the IAS were isolated as described previously with some modifications26,32. Briefly, IAS tissues from the CSM layer of the anal canal were cut into 1-mm cubes and incubated in oxygenated (95% O2 + 5% CO2) KPS that contains 0.1% collagenase type I and 0.01% soybean trypsin inhibitor at 37 °C for 3 h. The cell suspension was filtered through a 500 µm Nitex mesh. The tissue trapped was carefully removed and the filtrate containing the cells was centrifuged (350 g) for 10 min at room temperature. The cells in the pellet were resuspended in DMEM with fetal bovine serum (10%) and penicillin/streptomycin (5%) in 100-mm tissue culture dishes (Corning) at 37 °C and 5% CO2 in an incubator with regulated humidity.
RT-PCR and qPCR analyses
mRNAs were isolated from the IAS SMCs using Trizol reagent (ThermoFisher Scientific, Rockford, IL) according to the manufacturer’s instructions and dissolved in 40 µl of RNAase free water. The purity and concentration of total RNA were measured by a spectrophotometer at 260 nm and 280 nm. Ratios of absorption (260 nm: 280 nm) of all samples ranged from 1.8 to 2.0. First-strand cDNA synthesis was performed from 1 µg of total RNA using Sensiscript RT kit (Qiagen, Valencia, CA). Gene specific primers were designed for TXA2-R, AT1-R, RGS2, GRK5, Arrb2, AT1-R‐associated protein (ATRAP), hypoxanthine phosphoribosyl transferase 1 (HPRT), and GAPDH (Table 1). All primers were procured from Integrated DNA Technologies (Coralville, IA), and 2 µl of each cDNA sample was used as a template for performing qPCR using GoTaq Green Master Mix (Promega Corp., Madison, WI) and Eppendorf Mastercycler Personal (Fisher, Allentown, PA). The PCR cycle consisted of the following sequence: 94 °C for 5 min, 94 °C for 30 s (denaturation phase), 50 °C to 60 °C for 30 s (annealing phase), and 72 °C for 1 min (elongation phase), followed by final extension at 72 °C for 5 min with a repetition of 30 cycles. Both HPRT and GAPDH were used as internal controls33. We observed no significant change in expression of GAPDH with respect to HPRT, hence we used GAPDH as our control gene for further experiments. The PCR amplicons were separated on 1.5% (wt/vol) agarose gel containing Sybersafe stain and were visualized with blue light Transilluminator Ultraslim (Transilluminators, Atkinson, NH). The relative densities of TXA2-R, AT1-R, RGS2, GRK5, Arrb,2 and ATRAP were calculated by normalizing the band densities for each gene with that of GAPDH in RT-PCR. For qPCR assay, the relative fold changes in aging genes were normalized to corresponding young values, using 2−ΔΔCt method. All values were expressed as mean ± standard error of mean (SEM).
Table 1.
Primers used in the PCR for amplification of cDNA encoding TXA2-R, AT1-R, RGS2, GRK5, Arrb2, ATRAP, HPRT, and GAPDH in young versus old IAS SMCs.
| Primer | Sequence (5′-3′) | Accession No. | Anneal. Temp (°C) |
|---|---|---|---|
| TXA2-R-F | GAAGCAGACGGTTTGAGGGA | NC_005106.4 | 50 |
| TXA2-R-R | TCAGTTTCCCCCGTGAATCG | ||
| AT1-R-F | CTACAGCATCATCTTTGTGGTGGGA | NM_030985 | 52 |
| AT1-R-R | CGTAGACAGGCTTGAGTGGGACTT | ||
| RGS2-F | TGCGTACCCATGGACAAGAG | NM_053453.2 | 60 |
| RGS2-R | CTTCCTCAGGAGAAGGCTTGAT | ||
| GRK5-F | GCAACATGCTGCTCACCAAA | NM_030829.1 | 50 |
| GRK5-R | CGAAGGGAGGGTCCAACATC | ||
| Arrb2-F | CCACAAAAGGAACTCCGTGC | NM_012911.1 R | 52 |
| Arrb2-R | GGACGTTGACATTGAGGGGT | ||
| ATRAP-F | TGCTTGGGGCAACTTCACTATC | NM_001007654.1 | 50 |
| ATRAP-R | ACGGTGCATGTGGTAGACGAG | ||
| HPRT-F | GCGAAAGTGGAAAAGCCAAGT | NM_012583 | 52 |
| HPRT-R | GCCACATCAACAGGACTCTTGTAG | ||
| GAPDH-F | GGCTCATGACCACAGTCCAT | NM_017008.4 | 60 |
| GAPDH-R | CCCCTCCTGTTGTTATGGGG |
F: Forward segment; R: Reverse segment.
Western blot analysis
In order to determine the total levels of TXA2-R, AT1-R, RGS2, GRK5, Arrb2, and ATRAP in the basal state in the cytoplasm, and TXA2-R and AT1-R in the particulate fractions, we used the protein lysates from IAS SMCs. The culture plates (at 80% confluency of the SMCs) were lysed in ice cold RIPA buffer (1% Nonidet P-40, 1% SDS, 0.5% sodium deoxycholate, 50 mM Tris (pH 7.4), 1 mM sodium orthovanadate, 150 mM NaCl, and 1 mM EDTA, with freshly added protease and phosphatase inhibitors cocktail), followed by centrifugation (16,000 g for 10 min) for protein estimation of RGS2, GRK5, Arrb2, and ATRAP. The protein content in the lysates were determined by using a BCA kit from Pierce (Rockford, IL). The samples were then mixed with 2x sample buffer (125 mM Tris, pH 6.8, 4% SDS, 10% glycerol, 0.006% bromophenol blue, and 2% β-mercaptoethanol) and placed on a heat block for 5 min. The proteins extracts (30 μl containing 30 μg) of each sample were separated by 10% SDS-polyacrylamide gel (for RGS2, GRK5, Arrb2, and ATRAP) using GAPDH as the loading control. These separated proteins were transferred to a polyvinylidene fluoride (PVDF) membrane by overnight incubation at 4 °C. Same samples were loaded in different gels against different proteins for GAPDH, RGS2, GRK5, Arrb2, and ATRAP.
To determine the relative distribution of TXA2-R and AT1-R in membrane versus the cytosol, the 80% confluent IAS culture plates were lysed in ice-cold homogenization buffer (10 mM Tris, pH 7.5, 5 mM MgCl2, 2 mM EDTA, 250 mM sucrose, 1 mM dithiothreitol, freshly added protease and phosphatase inhibitors cocktail) as described previously6,10. This was followed by centrifugation (100,000 g for 30 min, 4 °C). The supernatants were used as the cytosolic fraction, and pellets resuspended in RIPA buffer centrifuged (800 g for 10 min) were collected as the particulate fractions34. The proteins were run on the polyacrylamide gel and transferred on PVDF membrane as explained above.
The membranes were blocked in Odyssey blocking buffer (LI-COR Biotechnology, Lincoln, NE) for 1 h at room temperature followed by three washings with TBST (0.1% Tween 20). The membranes were then incubated overnight in respective primary antibodies [anti-rabbit- AT1-R and TXA2-R (1: 500); RGS2 (1: 400); GRK5 (1: 4,000); Arrb2 (1: 200); ATRAP (1: 200), and anti-mouse GAPDH (1: 5,000)] at 4 °C. The membranes were washed with TBST thrice for 10 min each and incubated with IRdye-conjugated secondary antibodies (1: 5,000) for 1 h. The membranes were then scanned using Odyssey infrared scanner. The band intensities of different proteins were analysed as ratios of GAPDH using Image J1.41 (NIH, Bethesda, MD).
Internalization assay
The internalization of TXA2-R was analysed using cell-surface biotinylation approach as described by Ehlers35. In brief, rat IAS SMCs were biotinylated with the reversible membrane-impermeable derivative of biotin 0.5 mg/ml sulfo-NHSS-S-biotin (Pierce) for 30 min at 4 °C, as described by De Godoy and Rattan36. Biotin solution was replaced by fresh biotin at 15 min interval followed by washing in PBS2+ (PBS; 0.8 mM CaCl2, 1 mM MgCl2, pH 7.4). The cells were then incubated at 37 °C for 0 h, 1 h, and 3 h in serum free medium with or without U46619 (1 µM) to allow internalization of biotinylated cell-surface proteins. The cells were then cooled to 4 °C for 30 min to stop internalization and the remaining biotinylated proteins on the cell surface were stripped by treating the cells with quenching buffer (PBS2+; 100 mM glycine), followed by washing with neutralization buffer (50 mM glutathione, 75 mM NaCl, 10 mM EDTA, 1% BSA and 0.075 N NaOH).
Recycling assay
The recycling assay was conducted to analyse the fate of the internalized pool of TXA2-R generated by agonist-induced internalization. Following the internalization procedure as explained above, the cells were subjected to a second round of incubation for 1.5 h or 6 h in the presence of U46619 to allow reinsertion or degradation of the internalized biotinylated TXA2-R. The level of surface receptor density in each step of this protocol was then analysed to determine the level of recycling of the internalized receptors to the cell surface.
To investigate the role of lysosomes and proteasomes in the degradation of the endocytosed GPCRs, we examined the effect of their respective inhibitors chloroquine diphosphate37 and MG13238. The rationale was that the degrading role of these organelles could be determined by a reversal of the downregulated GPCR (TXA2-R) protein at cell surface level, by incubation of old rat IAS SMC with chloroquine or MG132 (both 10 μM) for 12 h prior to the receptor recycling assay. Chloroquine was obtained from Sigma (Sigma-Aldrich, St. Louis, MO) and MG132 from Cayman (Cayman Chemical, Ann Arbor, MI). The surface receptor density was then determined following the same biotinylation technique as explained before. Following this, the cells were immediately lysed with RIPA buffer for protein extraction. Biotinylated proteins were affinity-purified from cell lysates with streptavidin-agarose (InVitrogen, Carlsbad, CA) and loaded onto SDS-10% polyacrylamide gel. Western blot analysis was then performed as described above. Biotinylation data for TXA2-R in the aging were expressed on the basis of maximal density at the cell surface with respect to that in young at 0 min without stripping.
Immunofluorescence and confocal microscopy
Freshly isolated IAS SMCs were aliquoted in Eppendorf tubes, treated with biotin 0.5 mg/ml sulfo-NHSS-S-biotin, and then with U46619 in the same manner as described above. Thereafter, the nonspecific binding was blocked using 10% donkey serum and 1% BSA for 30 min, followed by incubation with Streptavidin-conjugated FITC (1: 400) in a humid chamber at 4 °C for 2 h; they were then washed three times in PBS2+. The cells were then smeared on a slide, air dried, and cover-slipped with ProLong Gold mounting medium (InVitrogen). Slides were kept overnight for appropriate polymerization of the mounting medium and then sealed with clear nail polish. Subsequently, the images were viewed under confocal microscope (Nikon A1R, Nikon Instruments, NY), and photographs were taken and analyzed with Image J1.41 (NIH, Bethesda, MD).
Statistical analysis
Values represent means ± SE from at least 4 independent experiments and plotted using Prism 5.1 (GraphPad Software, La Jolla, CA). Student’s unpaired t-test was used to compare 2 different groups. Statistical significance between multiple groups was tested using one-way ANOVA. Linear regression analysis was used to identify the significance in the difference between slopes of curves. P < 0.05 was considered to be statistically significant.
Results
Effect of aging on the kinetics of IAS smooth muscle basal tone in young versus old rats
Relaxation of basal IAS tone with KPS containing 0 Ca2+
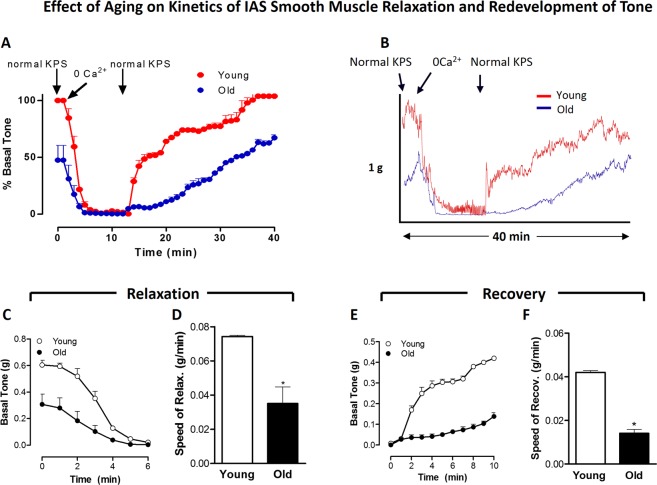
KPS containing 0 Ca2+ causes a rapid relaxation of the IAS followed by the redevelopment of its tone when replenished with normal KPS. Details of the overall time courses for these data comparing the IAS from young versus old rats are provided in Fig. 1A, and typical tracings are given in Fig. 1B. Basal IAS tone in these experiments was significantly less in the old rats (0.31 ± 0.08 g) than in the young rats (0.61 ± 0.03 g; P < 0.05; n = 4 in each group). Detailed analysis of the time-course for the initial relaxation reveal significant decreases in the speed of relaxation over 6 min, and for the steady redevelopment of tone over 10 min (Fig. 1C). Further comparison of relaxation rate (g/min) in the young versus old rats showed significant decrease in the speed of SM relaxation with age (P < 0.05; n = 4 in each group; Fig. 1C,D).
Figure 1.
Effect of aging on kinetics of relaxation (with 0 Ca2+) and redevelopment of basal IAS tone, following normal KPS. Overall time-course data of IAS relaxation and redevelopment of the smooth muscle (SM) basal tone (A) with typical tracing (B), detailed analyses of decrease in absolute tone (C), speed of relaxation with 0 Ca2+ (D), and redevelopment of tone (E), and the speed of the redevelopment of the basal tone (F) following normal KPS. Data show that aging significantly decreases the speed of relaxation and contraction during redevelopment of tone with 0 Ca2+ (*P < 0.05; n = 4).
Redevelopment of basal IAS tone following replenishment with normal KPS
Detailed analysis of these data was carried out following the redevelopment of the basal tone from 12 min (time of sustained maximal relaxation) to 40 min (time of maximal sustained redevelopment) following normal KPS (Fig. 1A). These data (Fig. 1E,F) revealed that aging significantly attenuates the speed of redevelopment of the basal tone in the IAS (P < 0.05; n = 4).
Effect of aging on the agonist (U46619, Ang II, and KCl)-induced IAS contraction kinetics in young versus old rats
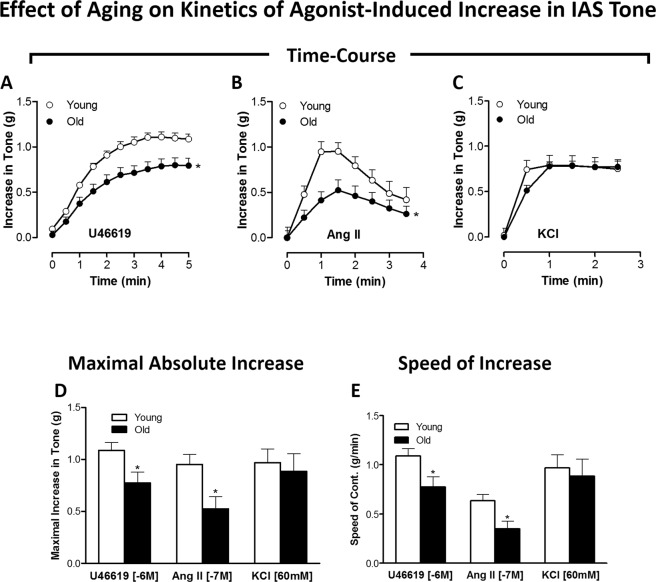
We compared the contractile responses following GPCR activation (using U46619 for TXA2-R; Ang II for AT1-R) versus non-GPCR activation (using KCl-induced depolarization) in the IAS from young versus old rats. Herein, we examined the time-course effects of single doses of these agonists (U46619, 1 µM; Ang II, 0.1 µM; and KCl 60 mM) (Fig. 2A–C). These data, combined with in-depth calculations of maximal absolute increase (Fig. 2D) and speed of contraction (Fig. 2E), showed that aging caused significant and selective decrease in the amplitude and speed of IAS SM contraction in response to the GPCR activation and not to K+-depolarization (P < 0.05, n = 4 in each group).
Figure 2.
Effect of aging on kinetics of agonist-induced increase in IAS tone: (GPCR versus K+ -depolarization). Time-course data for the IAS contraction with U 46619 (A), Ang II (B) and KCl (C), and the respective maximal increases in the IAS tone (D). Data show that in old rats compared to young rats, the GPCR-activated increases in the IAS tone are selectively and significantly reduced (*P < 0.05; n = 8). Further data analyses (E) reveal that aging significantly and selectively reduces the speeds in the GPCR- but not KCl-mediated IAS contraction (*P < 0.05; n = 8).
Altogether, the above data suggest that aging confers significant decrease in both the IAS tone in the basal and stimulated states and in the relaxant and contractile kinetics to GPCR activation.
Effect of aging on GPCR versus K+-depolarization concentration-response curves causing increase in IAS tone
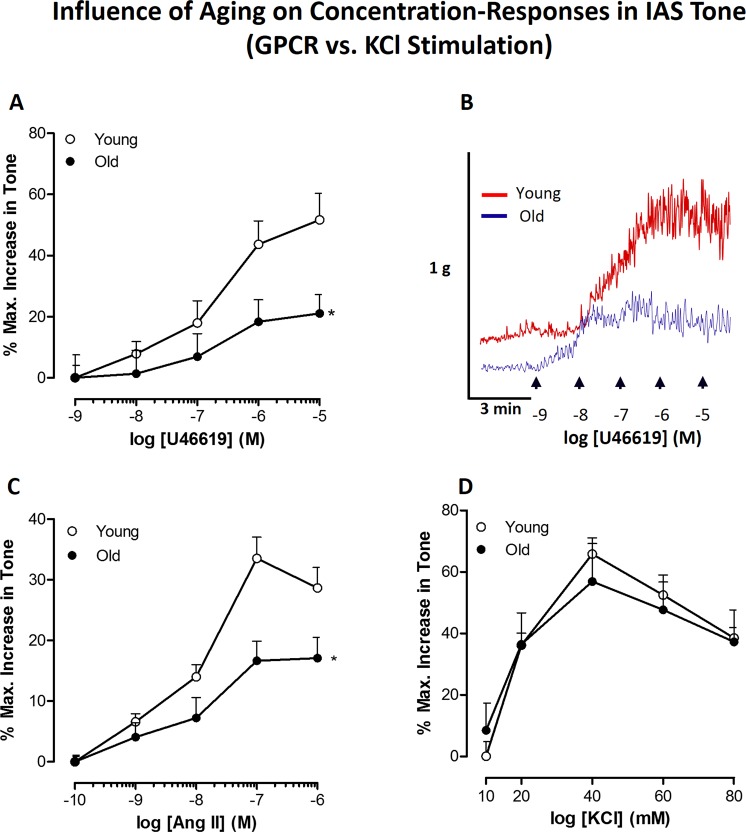
Data in Fig. 3A–C revealed significant rightward shifts in the concentration-response curves (CRC) for U 46619 (0.1 nM to 10 µM) and Ang II (1 nM to 1 µM) in the old versus young IAS (P < 0.05, n = 8). These data showed a significant decrease in maximal responses and potencies in the old rat compared to the young rat IAS (RIAS). However, the data revealed no significant differences in KCl-induced CRC (10 to 80 mM) in young versus old RIAS (Fig. 3D). Representative tracings of the force experiments with U46619 are given in Fig. 3B.
Figure 3.
Effect of aging on GPCR (TXA2-R and AT1-R) versus K+-depolarization stimulated concentration-response curves (CRC). Data with concentration-response curves for U46619 (A), and it’s corresponding typical tracings (B), Ang II (C), and KCl (D) show that aging causes significant rightward shifts in the GPCR-mediated but not KCl-mediated increase in the IAS tone (*P < 0.05; n = 8).
Effect of aging on the potency of selective antagonists SQ29548 and losartan in antagonizing the TXA2-R and AT1-R activation
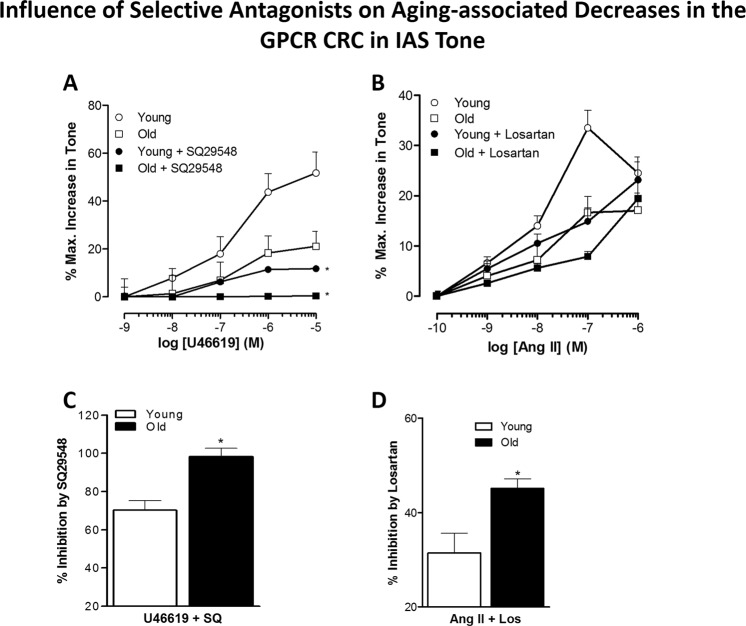
These experimental data showed that aging significantly increased the potencies of SQ29548 and losartan in antagonizing the increase in the IAS tone caused by GPCR activation (P < 0.05, n = 8; Fig. 4A,B). This concept was further confirmed by comparing how these antagonists inhibited GPCR responses (Fig. 4C,D). These data indicated a trend towards decrease in GPCR population in old versus young IAS, which may be partly responsible for the observed decreased responses to GPCR activation.
Figure 4.
Effect of aging on the potency of TXA2-R and AT1-R antagonists. Comparison of concentration-response curves for U46619 in the presence of SQ29548 (A) and for Ang II in the presence of losartan (B) show that aging significantly increases the blocking effects of the selective antagonists of their respective GPCR agonists (C,D) (*P < 0.05; n = 8). These data imply that aging may lead to a decrease in the GPCR population.
Expression analyses of GPCR in young versus old RIAS through RT-PCR, qPCR, and western blot
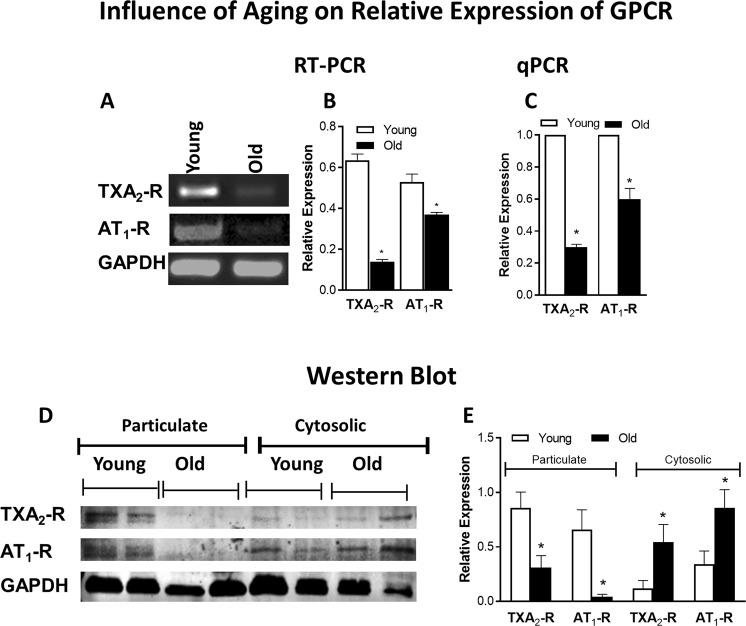
RT-PCR and qPCR analyses showed significantly low expressions of AT1-R and TXA2-R at gene level in the IAS of the old versus young RIAS (P < 0.05; n = 4; Fig. 5A–C).
Figure 5.
Influence of aging on relative expression of GPCR (TXA2-R and AT1-R) through RT-PCR, qPCR, and western blot (WB). A significant decrease in mRNA expression of TXA2-R and AT1-R under aging is evident through RT-PCR (A,B) and qPCR (C) in the RIAS from the old versus young rats (*P < 0.05; n = 4). WB analyses (D,E) also show a significant decrease in particulate fraction as well as increase in cytosolic fraction of TXA2-R and AT1-R expression under aging (*P < 0.05; n = 4). All values are compared with respect to GAPDH.
Western blot data resembled the PCR data in showing a significant decrease in the expression of active AT1-R and TXA2-R as determined in the particulate fractions of old versus young RIAS (P < 0.05; n = 4; Fig. 5D,E). Full gel/blot images for AT1-R, TXA2-R, and GAPDH are provided as Supplementary Data (Figs S1 and S2).
Expression analyses of GPCR downstream signaling proteins in young versus old RIAS through RT-PCR, qPCR, and western blot
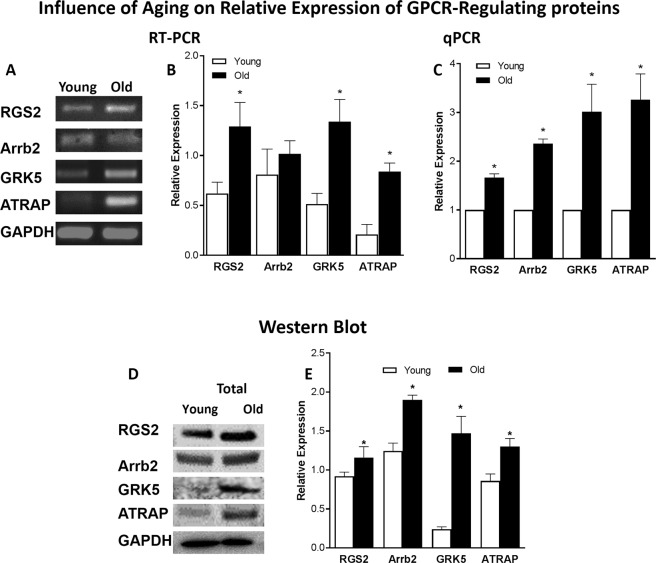
RT-PCR and qPCR analysis showed that mRNA expression of regulatory proteins RGS2, GRK5, Arrb2, and ATRAP was significantly higher in the old versus young RIAS (P < 0.05; n = 4; Fig. 6A–C). Translational data examined via western blot analyses also revealed that RGS2, GRK5, Arrb2, and ATRAP protein levels in the total lysate of RIAS were significantly increased in the old versus the young group (P < 0.05; n = 4; Fig. 6D,E). Even though, the expression of Arrb2 was unaltered under aging in RT-PCR, quantitative PCR showed a significant increase in it’s mRNA expression level (P < 0.05; n = 4; Fig. 6C). Full gel/blot images for RGS2, GRK5, Arrb2, ATRAP, and GAPDH are provided as supplementary data (Figs S3 and S4).
Figure 6.
Influence of aging on relative expression of GPCR signaling regulatory proteins (RGS2, Arrb2, GRK5, ATRAP) in RIAS. RT-PCR (A,B), qPCR (C), and WB analyses (D,E) show significant increase in the expressions of GPCR signaling regulatory proteins, RGS2, Arrb2, GRK5, ATRAP in the aging as compared with the young IAS SMCs (*P < 0.05; n = 4). Herein, those values are compared with respect to GAPDH for RT-PCR and WB, whereas qPCR values are normalized with respect to the data in young animals.
Effect of aging on TXA2-R trafficking using reversible biotinylation in young versus old
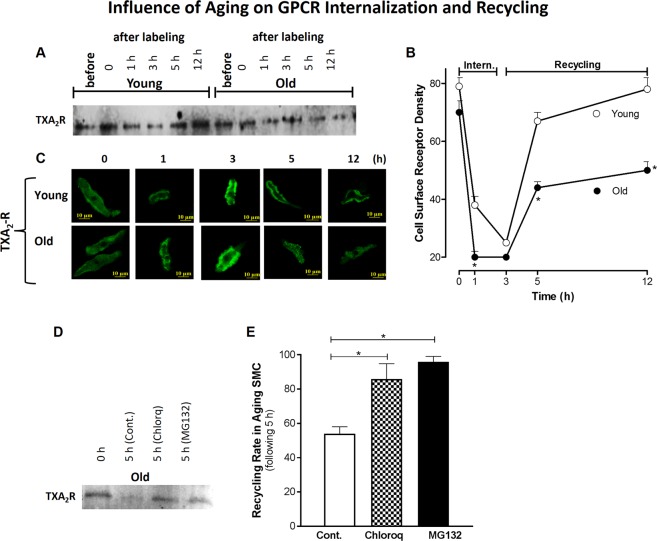
Since TXA2-R has been shown to play a predominant role in the basal IAS tone14, to examine details of the cellular trafficking, we concentrated our studies on the TXA2-R. The fate of TXA2-R (following respective GPCR activation) as a function of age was tracked down in the IAS SMC using reversible biotinylation following a time-course for serial internalization (0, 1, 3 h before) and recycling (1.5, 6 h after) (Fig. 7A,B). Data showed that TXA2-R density decreased significantly in old versus young RIAS SMC at 1 h (suggesting faster internalization) that plateaued at 3 h (P < 0.05; n = 4). Confocal microscopy data (C) also revealed that aging caused significantly less and slower recycling of the GPCR in the IAS SMC as determined at 5 h (P < 0.05; n = 4). Receptor biotinylation showed that MG132 and chloroquine (both 10 µM) in the aging RIAS SMCs during a course of 5 h period (3 h internalization + 0.5 h incubation at 4 °C for internalization stoppage + 1.5 h recycling) significantly increased receptor recovery inhibiting receptor loss of TXA2-R (P < 0.05; n = 4; Fig. 7D,E). Full blot images for TXA2-R trafficking in young versus old, and receptor recycling rate in the presence of MG132 and chloroquine through receptor biotinylation are provided in Supplementary Fig. S5A,B.
Figure 7.
TXA2-R trafficking in young versus old RIAS SMC by reversible biotinylation. IAS SMC membranous receptors were labeled using biotin and incubated with their respective agonists at 37 °C for varying amounts of time, after which the cells were lysed with RIPA. Biotinylated proteins affinity-purified from cell lysate using streptavidin-agarose monitored via WB (A,B) and confocal microscopy (C) show that aging induces faster internalization at early phase of receptor trafficking (represented after 1 h incubation) and slow recycling of cell-surface receptors. The receptor recycling rate was significantly increased (representing rescue from internalization) following pre-incubation of the aging RIAS SMC with chloroquine (lysomotoropic agent) and MG132 (proteasomal inhibitor) (both 10 μM), as determined by normalizing the cell surface receptor density at 0 h and 5 h time points (D,E) (*P < 0.05; n = 4).
Discussion
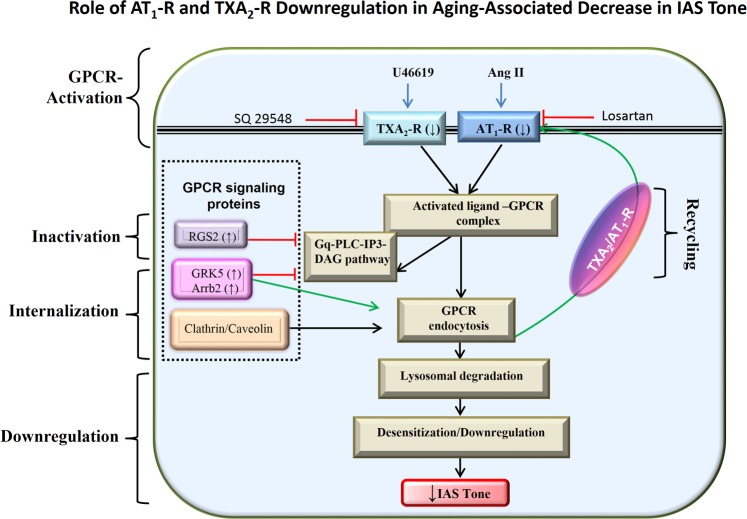
These studies for the first time demonstrate the role of autocrine GPCR dysregulation in aging-associated decrease in IAS tone (AADI), as illustrated in Fig. 8. The studies reveal that aging leads to: 1) A decrease in the GPCR (TXA2-R and AT1-R)-mediated IAS tone, and in the fibroelastic properties (FEP) of the SM which correlate with decrease in the GPCR expression at gene and protein levels; 2) An increase in the expression of GPCR downstream signalling regulatory proteins, RGS2, GRK5, and Arrb2; and 3) Downregulation and compromise in the GPCR recycling leading to a decrease in the IAS tone.
Figure 8.
Schematic representation of TXA2-R and AT1-R downregulation in aging-associated decrease in IAS tone. Normally, GPCRs such as TXA2-R and AT1-R bind to the respective endogenous ligands responsible for the IAS tone to stimulate smooth muscle contraction through the IP3-DAG cascade, and then with the action of regulatory proteins they may be endocytosed and recycled back to the membrane. However, an increase in the Regulator of G-protein Signaling (RGS2) during aging may inactivate this GPCR signaling by acceleration of Gα hydrolysis, converting GTP to GDP. GPCR kinase5 (GRK5) by phosphorylating cytoplasmic tail of receptor stimulates receptor internalization via β-arrestin (Arrb2). These events may lead to downregulation of receptors, and combined with the GPCR lysosomal/proteasomal degradation and slower recycling may lead to functional desensitization of GPCR signal transduction by reducing the number of membrane receptors. These events may be primarily responsible for the aging-associated decrease in the IAS tone by compromise in Ca2+/calmodulin/MLCK/RhoA/ROCK.
Our studies build on previously published studies6,39 to show that AADI may be mediated by decrease in the response to GPCR (TXA2-R and AT1-R) activation. This effect was established by the rightward shifts in the IAS contractile response to U46619 (TXA2 stable analogue) and Ang II. The specificity of these age-related effects was established by the lack of effects of aging on K+-depolarization-induced increase in the IAS tone, and by the competitive antagonism of the GPCR effects by their respective and selective antagonists, SQ29548 and losartan. These data imply an increased potency of these antagonists under aging. These data are consistent with the findings in the aging urinary bladder detrusor smooth muscle reporting a selective attenuation of the GPCR effects40–42.
Present data further revealed an aging-associated compromise in the FEP of the SM, as shown by the rightward shifts in the time-course data and rates of SM contractility following the GPCR activation with U46619 and Ang II. Interestingly, similar data for the effects of aging on time-course of relaxation and contractile responses, and their corresponding speeds, were obtained for the relaxation and redevelopment of the basal tone following 0 Ca2+ and its replenishment with normal KPS, respectively. Such data are in agreement with the previous data in other SM systems during aging43. It is conceivable that decrease in the basal tone and compromise in the FEP of the IAS, with respect to decreased GPCR activation during aging, is caused by the downregulation of the Ca2+/calmodulin/MLCK/RhoA/ROCK molecular control mechanism within the SMCs14,17,19,30,39,44.
A plausible explanation for the GPCR-associated AADI is downregulation of GPCR at the cellular membrane and the underlying downstream signaling, as suggested previously in different SM systems43,45. In support of this, western blot and PCR studies demonstrate that aging causes a significant decrease in the expressions of TXA2-R and AT1-R in the particulate fraction and mRNA in the IAS SMC. Interestingly, we observed an increased translocation of both TXA2-R and AT1-R from particulate to cytosol under aging, suggesting compromised response from the agonist stimulated Ca2+ sensitization. These data provide credence to the earlier hypothesis that TXA2 and Ang II biosynthesis are responsible for the basal myogenic IAS tone in animals and humans6,10,14,26,34.
Whether the decrease in GPCR downregulation during aging is solely responsible for the observed AADI or whether AADI also involves the post-activation GPCR signaling remains unclear. Typically, a balance between the regulation of GPCR activation, internalization (endocytosis), degradation, and recycling events may determine the final functional outcome of GPCR efficacy. This issue is relevant in the pathophysiology of AADI, since an inhibition of autocrine GPCR responsiveness may lead to the AADI and thus RI.
There is substantial literature to suggest that the regulators of G-protein signaling (RGS), especially RGS2, GPCR kinase (GRK), and β-arrestin (Arrb), play an important role in regulating post-activation GPCR signaling21,46,47. Accordingly, GRKs phosphorylate agonist-activated GPCR and then Arrb bind to these phosphorylated GPCR, leading to receptor internalization and desensitization48. Consequently, prolonged interaction of Arrb with GPCR may cause sustained downregulation. In support of these concepts, our data show that aging causes a significant increase in the expression profile of the above-stated downstream negatively operating GPCR signaling proteins RGS2, GRK5, and Arrb2, as determined via WB and RT-PCR and qPCR. Similar data has also been reported in other systems22–25. Whether GPCR downregulation is related to the further GPCR degradation in lysosomes or to distinct recycling pathways is not yet known. The marked increase in mRNA and protein expression of RGS2 that we found in our studies resembles the κ opioid receptor desensitization that has been documented in diabetic rat cardiomyocytes49. Present data implicate the presence of a phosphorylation-independent desensitization mechanism in the aging IAS, as reported in different systems50,51. Parallel studies revealing the increased expression profile of ATRAP in aging suggests an enhanced AT1-R internalization and desensitization that reduces AT1-R signaling in the IAS as reported in other systems52. For the present studies, GRK5, Arrb2, and RGS2 were selected as the regulatory GPCR signaling proteins of investigation because of their significant role in the regulation of the GPCR signaling in the gastrointestinal smooth muscle contractility53.
Our findings may explain that the age-related attenuated GPCR efficacy in AADI occurs due to increased expression of RGS2, GRK5, and Arrb2 leading to a higher basal phosphorylation and desensitization of the GPCRs. This concept is supported by earlier data elsewhere54. Future studies using knockout models of RGS2, GRK5, and Arrb2 in IAS followed by their correlations with the basal tone and contractile responses may further delineate the pathogenesis and the extent of involvement of these regulatory proteins in GPCR desensitization, endocytosis, or degradation in the AADI.
To examine, the role of GPCR endocytosis in intracellular trafficking for the compromised GPCR activation in AADI, we performed time-course studies on TXA2-R using a reversible biotinylation approach combined with western blot and confocal microscopy. These data reveal a faster endocytosis and slower recycling of the GPCR in aging IAS SMCs. These data may point to a compromise in recycled receptor density in the aging SMC and indicate endosomal degradation and desensitization of the GPCR. A partial reversal of these processes in the aging IAS SMCs using proteasomal inhibitors (e.g., MG132) and lysosomal inhibitors (e.g., chloroquine) further supports this concept37,38.
In conclusion, AADI may be partly attributed to TXA2-R and AT1-R downregulation via desensitization, lysosomal degradation, and compromised recycling of the GPCRs. RGS2, GRK5, and Arrb2 may play an important role in this process. Our findings on the molecular regulation of the GPCR in AADI have direct implications for understanding the pathophysiology of rectoanal incontinence in the elderly associated with the IAS dysfunction and for guiding the development of therapeutic interventions.
Supplementary information
Acknowledgements
These studies were supported by National Institutes of Diabetes and Digestive and Kidney Diseases Grant RO1DK035385, an institutional grant from Thomas Jefferson University and TJU SKCC Core facility grant NCI 5 P30 CA-56036. The authors are thankful to Dr. Maria Y Covarrubias, manager of SKCC Bioimaging Facility, for her assistance with confocal microscopy and immunofluorescence imaging, and to Jennifer Wilson for critical proof reading and valuable editorial suggestions.
Author Contributions
I.M., J.S., experimental design, data analysis, and manuscript draft; S.R., study design, data interpretation, and manuscript draft. All authors approved the final version of the manuscript.
Data Availability
All data generated and analyzed during the current study are available from the corresponding author on reasonable request.
Competing Interests
The authors declare no competing interests.
Footnotes
Publisher’s note: Springer Nature remains neutral with regard to jurisdictional claims in published maps and institutional affiliations.
Supplementary information
Supplementary information accompanies this paper at 10.1038/s41598-019-42894-4.
References
- 1.Culver PJ, Rattan S. Genesis of anal canal pressures in the opossum. Am. J. Physiol. Gastrointest. Liver Physiol. 1986;251:G765–G771. doi: 10.1152/ajpgi.1986.251.6.G765. [DOI] [PubMed] [Google Scholar]
- 2.Rattan S. The internal anal sphincter: regulation of smooth muscle tone and relaxation. Neurogastroenterol. Motil. 2005;17:50–59. doi: 10.1111/j.1365-2982.2005.00659.x. [DOI] [PubMed] [Google Scholar]
- 3.Mandaliya R, DiMarino AJ, Moleski S, Rattan S, Cohen S. Survey of anal sphincter dysfunction using anal manometry in patients with fecal incontinence: a possible guide to therapy. Ann. Gastroenterol. 2015;28:469–474. [PMC free article] [PubMed] [Google Scholar]
- 4.Bharucha AE, et al. Epidemiology, pathophysiology, and classification of fecal incontinence: state of the science summary for the National Institute of Diabetes and Digestive and Kidney Diseases (NIDDK) workshop. Am. J. Gastroenterol. 2015;110:127–136. doi: 10.1038/ajg.2014.396. [DOI] [PMC free article] [PubMed] [Google Scholar]
- 5.Bharucha AE, Rao SSC. An update on anorectal disorders for gastroenterologists. Gastroenterology. 2014;146:37–45. doi: 10.1053/j.gastro.2013.10.062. [DOI] [PMC free article] [PubMed] [Google Scholar]
- 6.Singh J, Kumar S, Krishna CV, Rattan S. Aging-associated oxidative stress leads to decrease in IAS tone via RhoA/ROCK downregulation. Am. J. Physiol. Gastrointest. Liver Physiol. 2014;306:G983–G991. doi: 10.1152/ajpgi.00087.2014. [DOI] [PMC free article] [PubMed] [Google Scholar]
- 7.Speakman CTM, et al. Abnormal internal anal sphincter fibrosis and elasticity in fecal incotninence. Dis. Colon Rectum. 1995;38:407–410. doi: 10.1007/BF02054231. [DOI] [PubMed] [Google Scholar]
- 8.Mazor Y, Jones M, Andrews A, Kellow JE, Malcolm A. Novel insights into fecal incontinence in men. Am. J. Physiol. Gastrointest. Liver Physiol. 2017;312:G46–G51. doi: 10.1152/ajpgi.00362.2016. [DOI] [PubMed] [Google Scholar]
- 9.Khaikin M, et al. The effect of topical anal captopril on resting anal pressure in healthy volunteers: the first human pilot study. Tech. Coloproctol. 2013;18:39–43. doi: 10.1007/s10151-013-0986-y. [DOI] [PubMed] [Google Scholar]
- 10.De Godoy MAF, Dunn SR, Rattan S. Evidence for the role of angiotensin II biosynthesis in the rat internal anal sphincter tone. Gastroenterology. 2004;127:127–138. doi: 10.1053/j.gastro.2004.03.056. [DOI] [PubMed] [Google Scholar]
- 11.De Godoy MAF, Rattan S. Autocrine regulation of internal anal sphincter tone by renin-angiotensin system: comparison with phasic smooth muscle. Am. J. Physiol. Gastrointest. Liver Physiol. 2005;289:G1164–G1175. doi: 10.1152/ajpgi.00115.2005. [DOI] [PubMed] [Google Scholar]
- 12.De Godoy MAF, Rattan N, Rattan S. COX-1 vs. COX-2 as a determinant of the basal tone in the internal anal sphincter. Am. J. Physiol. Gastrointest. Liver Physiol. 2009;296:G219–G225. doi: 10.1152/ajpgi.90485.2008. [DOI] [PMC free article] [PubMed] [Google Scholar]
- 13.De Godoy MAF, Rattan N, Rattan S. Arachidonic acid metabolites follow the preferential course of cyclooxygenase pathway for the basal tone in the internal anal sphincter. Am. J. Physiol. Gastrointest. Liver Physiol. 2009;296:G727–G734. doi: 10.1152/ajpgi.90707.2008. [DOI] [PMC free article] [PubMed] [Google Scholar]
- 14.Rattan S, Singh J, Kumar S, Phillips B. Nature of extracellular signal that triggers RhoA/ROCK activation for the basal internal anal sphincter tone in humans. Am. J. Physiol. Gastrointest. Liver Physiol. 2015;308:G924–G933. doi: 10.1152/ajpgi.00017.2015. [DOI] [PMC free article] [PubMed] [Google Scholar]
- 15.Rattan S, De Godoy MAF, Patel CA. Rho kinase as a novel molecular therapeutic target for hypertensive internal anal sphincter. Gastroenterology. 2006;131:108–116. doi: 10.1053/j.gastro.2006.03.043. [DOI] [PubMed] [Google Scholar]
- 16.Patel CA, Rattan S. Cellular regulation of basal tone in internal anal sphincter smooth muscle by RhoA/ROCK. Am. J. Physiol. Gastrointest. Liver Physiol. 2007;292:G1747–G1756. doi: 10.1152/ajpgi.00438.2006. [DOI] [PubMed] [Google Scholar]
- 17.Rattan S, Singh J. RhoA/ROCK pathway is the major molecular determinant of basal tone in intact human internal anal sphincter. Am. J. Physiol. Gastrointest. Liver Physiol. 2012;302:G664–G675. doi: 10.1152/ajpgi.00430.2011. [DOI] [PMC free article] [PubMed] [Google Scholar]
- 18.Rattan S, Benjamin P, Maxwell PJ., IV RhoA/ROCK-kinase: pathophysiologic and therapeutic implications in gastrointestinal smooth muscle tone and relaxation. Gastroenterology. 2010;138:13–18. doi: 10.1053/j.gastro.2009.11.016. [DOI] [PMC free article] [PubMed] [Google Scholar]
- 19.Rattan S. Ca2+/calmodulin/MLCK pathway initiates, and RhoA/ROCK maintains, the internal anal sphincter smooth muscle tone. Am. J. Physiol. Gastrointest. Liver Physiol. 2017;312:G63–G66. doi: 10.1152/ajpgi.00370.2016. [DOI] [PMC free article] [PubMed] [Google Scholar]
- 20.Derweesh IH, Wheeler MA, Weiss RM. Alterations in G-proteins and β-adrenergic responsive adenylyl cyclase in rat urinary bladder during aging. J. Pharmacol. Exp. Ther. 2000;294:969–974. [PubMed] [Google Scholar]
- 21.Mohan ML, Vasudevan NT, Gupta MK, Martelli EE, Naga Prasad SV. G-protein coupled receptor resensitization-appreciating the balancing act of receptor function. Curr. Mol. Pharmacol. 2012;5:350–361. doi: 10.2174/1874467211205030004. [DOI] [PMC free article] [PubMed] [Google Scholar]
- 22.Wang J, et al. Exacerbated cardiac fibrosis induced by beta-adrenergic activation in old mice due to decreased AMPK activity. Clin. Exp. Pharmacol. Physiol. 2016;43:1029–1037. doi: 10.1111/1440-1681.12622. [DOI] [PubMed] [Google Scholar]
- 23.Shi Y, et al. Altered expression of hepatic β-adrenergic receptors in aging rats: implications for age-related metabolic dysfunction in liver. Am. J. Physiol. Regul. Integr. Comp. Physiol. 2017;314:R574–R583. doi: 10.1152/ajpregu.00372.2017. [DOI] [PMC free article] [PubMed] [Google Scholar]
- 24.Schutzer WE, Reed JF, Bliziotes M, Mader SL. Upregulation of G protein-linked receptor kinases with advancing age in rat aorta. Am. J. Physiol. Regul. Integr. Comp. Physiol. 2001;280:R897–R903. doi: 10.1152/ajpregu.2001.280.3.R897. [DOI] [PubMed] [Google Scholar]
- 25.Liggett SB. Phosphorylation barcoding as a mechanism of directing GPCR signaling. Sci. Signal. 2011;4:e36. doi: 10.1126/scisignal.2002331. [DOI] [PubMed] [Google Scholar]
- 26.Singh J, Maxwell PJ, IV, Rattan S. Immunocytochemical evidence for PDBu-induced activation of RhoA/ROCK in human internal anal sphincter smooth muscle cells. Am. J. Physiol. Gastrointest. Liver Physiol. 2011;301:G317–G325. doi: 10.1152/ajpgi.00084.2011. [DOI] [PMC free article] [PubMed] [Google Scholar]
- 27.Moummi C, Rattan S. Effect of methylene blue and N-ethylmaleimide on internal anal sphincter relaxation. Am. J. Physiol. 1988;255:G571–G578. doi: 10.1152/ajpgi.1988.255.5.G571. [DOI] [PubMed] [Google Scholar]
- 28.Rattan S, Moummi C. Influence of stimulators and inhibitors of cyclic nucleotides on lower esophageal sphincter. J. Pharmacol. Exp. Ther. 1989;248:703–709. [PubMed] [Google Scholar]
- 29.Chakder S, Rattan S. [Tyr0]-Calcitonin gene-related peptide 28–37 (rat) as a putative antagonist of calcitonin gene-related peptide responses on opossum internal anal sphincter smooth muscle. J. Pharmacol. Exp. Ther. 1990;253:200–206. [PubMed] [Google Scholar]
- 30.Krishna CV, Singh J, Kumar S, Rattan S. Heme oxygenase-1 upregulation modulates tone and fibroelastic properties of internal anal sphincter. Am. J. Physiol. Gastrointest. Liver Physiol. 2014;307:G595–G601. doi: 10.1152/ajpgi.00159.2014. [DOI] [PMC free article] [PubMed] [Google Scholar]
- 31.Singh J, Mohanty I, Rattan S. In vivo magnetofection: a novel approach for targeted topical delivery of nucleic acids for rectoanal motility disorders. Am. J. Physiol. Gastrointest. Liver Physiol. 2018;314:G109–G118. doi: 10.1152/ajpgi.00233.2017. [DOI] [PMC free article] [PubMed] [Google Scholar]
- 32.Lin YM, et al. Pathogenesis of abdominal pain in bowel obstruction: role of mechanical stress-induced upregulation of nerve growth factor in gut smooth muscle cells. Pain. 2017;158:583–592. doi: 10.1097/j.pain.0000000000000797. [DOI] [PMC free article] [PubMed] [Google Scholar]
- 33.Silver N, et al. Selection of housekeeping genes for gene expression studies in the adult rat submandibular gland under normal, inflamed, atrophic and regenerative states. BMC Mol. Biol. 2008;9:64. doi: 10.1186/1471-2199-9-64. [DOI] [PMC free article] [PubMed] [Google Scholar]
- 34.Singh J, Rattan S. Role of PKC and RhoA/ROCK pathways in the spontaneous phasic activity in the rectal smooth muscle. Am. J. Physiol. Gastrointest. Liver Physiol. 2013;304:G723–G731. doi: 10.1152/ajpgi.00473.2012. [DOI] [PMC free article] [PubMed] [Google Scholar]
- 35.Ehlers MD. Reinsertion or degradation of AMPA receptors determined by activity-dependent endocytic sorting. Neuron. 2000;28:511–525. doi: 10.1016/S0896-6273(00)00129-X. [DOI] [PubMed] [Google Scholar]
- 36.De Godoy MAF, Rattan S. Translocation of AT1- and AT2-receptors by higher concentrations of angiotensin II in the smooth muscle cells of rat internal anal sphincter. J. Pharmacol. Exp. Ther. 2006;319:1088–1095. doi: 10.1124/jpet.106.108084. [DOI] [PubMed] [Google Scholar]
- 37.Dunmore BJ, et al. The lysosomal inhibitor, chloroquine, increases cell surface BMPR-II levels and restores BMP9 signalling in endothelial cells harbouring BMPR-II mutations. Hum. Mol. Genet. 2013;22:3667–3679. doi: 10.1093/hmg/ddt216. [DOI] [PMC free article] [PubMed] [Google Scholar]
- 38.Chen G, et al. MG132 proteasome inhibitor upregulates the expression of connexin 43 in rats with adriamycin-induced heart failure. Mol. Med. Rep. 2015;12:7595–7602. doi: 10.3892/mmr.2015.4337. [DOI] [PubMed] [Google Scholar]
- 39.Singh J, et al. Aging-associated changes in microRNA expression profile of internal anal sphincter smooth muscle: Role of microRNA-133a. Am. J. Physiol. Gastrointest. Liver Physiol. 2016;311:G964–G973. doi: 10.1152/ajpgi.00290.2016. [DOI] [PMC free article] [PubMed] [Google Scholar]
- 40.Gomez-Pinilla PJ, Pozo MJ, Camello PJ. Aging differentially modifies agonist-evoked mouse detrusor contraction and calcium signals. Age (Dordr.) 2011;33:81–88. doi: 10.1007/s11357-010-9163-7. [DOI] [PMC free article] [PubMed] [Google Scholar]
- 41.Pagala MK, Tetsoti L, Nagpal D, Wise GJ. Aging effects on contractility of longitudinal and circular detrusor and trigone of rat bladder. J. Urol. 2001;166:721–727. doi: 10.1016/S0022-5347(05)66050-8. [DOI] [PubMed] [Google Scholar]
- 42.Durlu-Kandilci NT, Denizalti M, Sahin-Erdemli I. Aging changes agonist induced contractile responses in permeabilized rat bladder. Age. 2015;37:9807. doi: 10.1007/s11357-015-9807-8. [DOI] [PMC free article] [PubMed] [Google Scholar]
- 43.Gittemeier EM, et al. Effects of aging and exercise training on the dynamics of vasoconstriction in skeletal muscle resistance vessels. Eur. J. Appl. Physiol. 2017;117:397–407. doi: 10.1007/s00421-017-3541-0. [DOI] [PubMed] [Google Scholar]
- 44.De Godoy MA, Rattan S. Role of rho kinase in the functional and dysfunctional tonic smooth muscles. Trends Pharmacol. Sci. 2011;32:384–393. doi: 10.1016/j.tips.2011.03.005. [DOI] [PMC free article] [PubMed] [Google Scholar]
- 45.Muller-Delp JM, Gurovich AN, Christou DD, Leeuwenburgh C. Redox balance in the aging microcirculation: new friends, new foes, and new clinical directions. Microcirculation. 2012;19:19–28. doi: 10.1111/j.1549-8719.2011.00139.x. [DOI] [PMC free article] [PubMed] [Google Scholar]
- 46.Zhang Y, et al. Regulator of G protein signaling 4 is a novel target of GATA-6 transcription factor. Biochem. Biophys. Res. Commun. 2017;483:923–929. doi: 10.1016/j.bbrc.2016.10.024. [DOI] [PMC free article] [PubMed] [Google Scholar]
- 47.Mahavadi S, Sriwai W, Huang J, Grider JR, Murthy KS. Inhibitory signaling by CB1 receptors in smooth muscle mediated by GRK5/beta-arrestin activation of ERK1/2 and Src kinase. Am. J. Physiol. Gastrointest. Liver Physiol. 2014;306:G535–G545. doi: 10.1152/ajpgi.00397.2013. [DOI] [PMC free article] [PubMed] [Google Scholar]
- 48.Abdullah N, Beg M, Soares D, Dittman JS, McGraw TE. Downregulation of a GPCR by β-arrestin2-mediated switch from an endosomal to a TGN recycling pathway. Cell. Rep. 2016;17:2966–2978. doi: 10.1016/j.celrep.2016.11.050. [DOI] [PMC free article] [PubMed] [Google Scholar]
- 49.Chen X, et al. G protein coupled receptor kinase-2 upregulation causes kappa-opioid receptor desensitization in diabetic heart. Biochem. Biophys. Res. Commun. 2017;482:658–664. doi: 10.1016/j.bbrc.2016.11.090. [DOI] [PubMed] [Google Scholar]
- 50.Kannarkat GT, et al. Age-related changes in regulator of G-protein signaling (RGS)-10 expression in peripheral and central immune cells may influence the risk for age-related degeneration. Neurobiol. Aging. 2015;36:1982–1993. doi: 10.1016/j.neurobiolaging.2015.02.006. [DOI] [PMC free article] [PubMed] [Google Scholar]
- 51.Ribas C, et al. The G protein-coupled receptor kinase (GRK) interactome: role of GRKs in GPCR regulation and signaling. Biochim. Biophys. Acta. 2007;1768:913–922. doi: 10.1016/j.bbamem.2006.09.019. [DOI] [PubMed] [Google Scholar]
- 52.Tamura K, et al. The physiology and pathophysiology of a novel angiotensin receptor-binding protein ATRAP/Agtrap. Curr. Pharm. Des. 2013;19:3043–3048. doi: 10.2174/1381612811319170010. [DOI] [PubMed] [Google Scholar]
- 53.Murthy KS. Signaling for contraction and relaxation in smooth muscle of the gut. Annu. Rev. Physiol. 2006;68:345–374. doi: 10.1146/annurev.physiol.68.040504.094707. [DOI] [PubMed] [Google Scholar]
- 54.Alemany R, et al. G protein-coupled receptor systems and their lipid environment in health disorders during aging. Biochim. Biophys. Acta. 2007;1768:964–975. doi: 10.1016/j.bbamem.2006.09.024. [DOI] [PubMed] [Google Scholar]
Associated Data
This section collects any data citations, data availability statements, or supplementary materials included in this article.
Supplementary Materials
Data Availability Statement
All data generated and analyzed during the current study are available from the corresponding author on reasonable request.


