

Abstract
Abstract. Oxygen free radicals (OFR) are produced in the course of acute pancreatitis (AP). In addition to injurious oxidative effects, they are also involved in the regulation of cell growth. The aim of the present study was to examine the relationship between the effectiveness of N‐acetyl‐l‐cysteine (NAC) to prevent the generation of OFR and the changes in the cell‐cycle pattern of acinar cells in the course of AP induced in rats by pancreatic duct obstruction (PDO). NAC (50 mg/kg) was administered 1 h before and 1 h after PDO. Flow‐cytometric measurement of OFR generation in acinar cells was carried out using dihydrorhodamine as fluorescent dye. Plasma amylase activity, pancreatic glutathione (GSH) content and TNF‐α plasma levels were also measured. The distribution of acinar cells throughout the different cell‐cycle phases was analysed at different AP stages by flow cytometry using propidium iodide staining. NAC administration reduced the depletion of pancreatic GSH content and prevented OFR generation in acinar cells of rats with PDO‐induced acute pancreatitis. As a result, AP became less severe as reflected by the significant improvement of hyper‐amylasaemia and maintenance of plasma TNF‐α levels at values not significantly different from controls were found. NAC administration inhibited progression of cell‐cycle phases, maintaining acinar cells in quiescent state at early PDO times. The protection from oxidative damage by NAC treatment during early AP, allows the pancreatic cell to enter S‐phase actively at later stages, thereby allowing acinar cells to proliferate and preventing the pancreatic atrophy provoked by PDO‐induced AP. The results provide evidence that OFR play a critical role in the progression of acinar cell‐cycle phases. Prevention of OFR generation of acinar cells in rats with PDO‐induced AP through NAC treatment, not only protects pancreas from oxidative damage but also promotes beneficial changes in the cell cycle progression which reduce the risk of pancreatic atrophy.
INTRODUCTION
Oxidative stress has been shown to be involved in the pathophysiology of acute pancreatitis (AP) (Schreck & Baeuerle 1991; Schoenberg et al. 1992; Rau et al. 2000; Weber & Adler 2001). The antioxidant capacity of cells is overwhelmed by large quantities of oxygen free radicals (OFR) produced at early stages of AP. They play an important role as mediators in pancreatic damage (Schoenberg et al. 1992; Rau et al. 2000) as well as second messengers amplifying the inflammatory response to other organs (Schreck & Baeuerle 1991; Weber & Adler 2001), eventually leading to systemic complications. However, besides their injurious effects, an increasing body of evidence supports the involvement of OFR in transduction cascades acting as signalling molecules in the regulation of physiological processes such as cell arrest, proliferation, senescence and cell death (Thannickal & Fanburg 2000; Dröge 2002; Martindale & Holbrook 2002). The signalling pathways by which OFR regulate cell growth have not been clearly established, but a large family of serine/threonine kinases referred to as mitogen‐activated protein kinases (MAPKs) has been identified as a key mediator in this regulation (Pagès et al. 1993; Dröge 2002; Torres 2003). Activation of MAPKs is elicited in response to several stimuli such as cytokines, growth factors, tumour promoters, hormones and oxidants (Dröge 2002; Torres 2003), and is required for cells to overcome the cell‐cycle checkpoint in the transition from G0/G1 into S‐phase (Pagès et al. 1993; Morisset et al. 1999). It is widely accepted that the exposure of mammalian cells to a pro‐oxidant environment leads to mitogenic activation (Burdon 1995). OFR would exert their effect both by direct oxidative modification of signal transduction molecules and indirectly by altering the general redox state of the cell (Thannickal & Fanburg 2000).
In line with this, increased OFR generation in acinar cells and subsequent oxidative damage reported by Uruñuela et al. (2002a), as well as activated cellular proliferation (De Dios et al. 2000) have been found at early stages of AP induced by pancreatic duct obstruction (PDO). Antioxidant treatments, N‐aceyl‐l‐cysteine (NAC) among them, have demonstrated their ability to inhibit cell growth (Kim et al. 2001; Kong et al. 2001; Kuruganti et al. 2002; Kyaw et al. 2002) and to exert a beneficial effect palliating AP symptoms, when administered at early stages (Schoenberg et al. 1992). NAC is an anti‐inflammatory and antioxidant molecule, acting as a direct OFR scavenger and a precursor for glutathione (GSH) biosynthesis (Cotgreave 1997).
Because occlusion of the biliary tract by passage of gallstones is the most common cause of AP in humans, we have chosen PDO as an experimental AP model, with the aim of studying the relationship between the effectiveness of NAC treatment in preventing the generation of OFR and the changes in the cell‐cycle pattern of pancreatic acinar cells throughout the different AP stages.
MATERIALS AND METHODS
Chemicals
NAC, collagenase type XI, soybean trypsin inhibitor (STI), amino acid mixture, bovine serum albumin (BSA), dihydrorhodamine‐123 (DHR), N‐2‐hydroxyethyl piperazine‐N′‐(2‐ethanesulphonic acid) (HEPES), glutathione, β‐nicotinamide adenine dinucleotide phosphate reduced form (NADPH), glutathione reductase type III, ethylenediamine‐tetraacetic acid (EDTA), 5,5′‐dithio‐bis(2‐nitrobenzoic acid) (DTNB), buprenorphine, propidium iodide (PI) and RNase were supplied by Sigma Chemical Co. (Madrid, Spain). Pharmingen (San Diego, CA, USA) supplied the ELISA kit for TNF‐α. Other standard analytical grade laboratory reagents were obtained from Merck (Darmstdat, Germany).
Animal groups
The animal experiments were performed according to the protocols approved by the Animal Care Committee of the University of Salamanca (Spain), in accordance with European Community guidelines on ethical animal research.
Male Wistar rats weighing 250–300 g were randomly divided into the following four groups, with four subgroups in each:
Group I Rats with pancreatic duct obstruction (PDO). After overnight fasting and under ether anaesthesia, a median laparotomy was performed and AP was induced by ligation of the common bile‐pancreatic duct at its distal portion, close to the exit to the duodenum. The abdominal wall was immediately closed in a double layer and animals were put back in their cages with free access to food and water. Subcutaneous injections of buprenorphine (0.2 mg/kg/8 h) provided post‐operative analgesia. PDO was maintained for 3 h (n = 12), 6 h (n = 12), 12 h (n = 12) and 24 h (n = 12).
Group II Sham‐operated rats (Sham), surgically treated as those of Group I but without ligation of the pancreatic duct. These were studied at the same time points of 3 h (n = 12), 6 h (n = 12), 12 h (n = 12), and 24 h (n = 12) after surgery.
Group III Rats receiving intraperitoneally NAC resuspended in distilled water (50 mg/kg) 1 h before ligation of the bile‐pancreatic duct followed by a new injection 1 h after ligating (NAC‐PDO). Studies were carried out at 3 h (n = 12), 6 h (n = 12), 12 h (n = 12) and 24 h (n = 12) after PDO was performed.
Group IV Sham‐operated rats receiving NAC as detailed for Group III (NAC‐Sham) and studied 3 h (n = 12), 6 h (n = 12), 12 h (n = 12) and 24 h (n = 12) after surgical procedure.
Different animal pools were used either for flow‐cytometric analysis or for the other assays.
Collection of samples
After overnight fasting, rats were anaesthetized with sodium pentobarbital (3 mg/100 g body weight, intraperitoneally) and median laparotomy was performed. Blood samples were obtained by cardiac puncture in order to determine plasma amylase activity and TNF‐α levels. Finally, the entire pancreas was removed and freed of fat and lymph nodes, either to determine the glutathione (GSH) content, for isolation of pancreatic acinar cells and subsequent analysis of cellular DNA content and OFR generation by flow cytometry, or for histological analysis.
Assays
Amylase activity was determined in plasma according to the method of Hickson (Hickson 1970). Pancreatic GSH content was measured after homogenizing the pancreas in 5% 5‐sulfosalicylic acid, using the specific technique described by Tietze (1969), based on the spectrophotometric monitoring of glutathione‐mediated reduction of DTNB at 412 nm. Plasma TNF‐α levels were measured using an enzyme‐linked immunosorbent assay (ELISA), strictly following the recommendations of the manufacturer.
Preparation of isolated cells
Pancreatic acinar cells were isolated as previously described by Uruñuela et al. (2002b). Briefly, after ligating the bile duct close to the liver, HEPES solution pH 7.4 containing collagenase (40 U/ml), 0.1 mg/ml STI, 100 mm NaCl, 5 mm KCl, 1 mm MgCl2, 1 mm CaCl2, 14 mm d‐glucose, 2 mm glutamine, 2% (w/v) BSA and 2% (w/v) amino acid mixture was perfused into the main pancreatic duct. After digestion of the pancreas with collagenase and following gentle pipetting through tips of decreasing diameter (3–1 mm), cells were filtered through a double layer of muslin gauze and then centrifuged at 30 g for 30 s at 4 °C. The supernatant was collected and centrifuged twice at 500 g, 5 min, 4 °C. The pellet was finally resuspended in HEPES buffer without collagenase at a concentration of 107 cells/ml. As previously shown by Uruñuela et al. (2002b), the labelling of isolated cells with specific antisera against digestive enzymes assessed the purity of the acinar cells as 99%.
Flow‐cytometric analysis of OFR generation in acinar cells
Oxidative stress in individual acinar cells was measured by using dihydrorhodamine‐123 (DHR), as previously reported by Uruñuela et al. (2002a). Briefly, a suspension of 100 µl of acinar cells was loaded with 25 mm DHR for 20 min at 4 °C in the dark. DHR easily crosses cell membranes and, upon oxidation by OFR, turns into rhodamine‐123 and becomes fluorescent (Rothe et al. 1991). After washing twice with HEPES buffer, the intracellular green fluorescence (Fl1) due to DHR dye was measured using the same FACScalibur dual laser flow cytometer described above. Leukocytes infiltrating the pancreas were excluded on the basis of their unique high light scatter properties (FSC/SSC). Cell Quest and Paint‐a‐Gate 3.0 software programs were used for data acquisition and analysis, respectively. A minimum of 10 000 cells were analysed in each experiment to obtain a mean value per individual cell. Cells from the different experimental groups were measured in parallel at each time point and changes in the intensity of fluorescence were expressed as percentages of values obtained each day in sham‐operated rats.
Flow‐cytometric analysis of DNA content in acinar cells
Cell DNA staining was performed as follows. A suspension of 100 µl of cells (107/ml) in HEPES buffer was fixed with 70% cool ethanol for at least 30 min at 4 °C. Afterwards, cells were centrifuged at 500 g for 3 min. Immediately, the supernatant was removed and the cell pellet was resuspended in a solution containing RNase (0.1 mg/ml) and propidium iodide (50 µg/ml) and maintained with gentle stirring at 4 °C in the dark for at least 30 min before the flow‐cytometric acquisition. For this, a dual laser FACScalibur flow cytometer (Becton‐Dickinson, San José, CA, USA) equipped with a doublet discrimination module and an argon‐ion laser emitting light at 488 nm and 15 mW was used. Calibration of the instrument was performed on a daily basis using Calibrite beads (Becton‐Dickinson). Leukocytes infiltrating the pancreas were also excluded. Software programs CellQuest and Paint‐A‐Gate 3.0 (Becton‐Dickinson) were used for data acquisition and analysis of the distribution of G0/G1‐, S‐, G2/M‐, and subG1‐phase cells, respectively. This analysis was performed on gated single cells after excluding cell doublets using the RFIT mathematical calculation model by means of the CELLfit software programme.
Apoptosis determination by FITC‐Annexin V/PI double staining
Cells undergoing apoptosis were detected by a double staining for FITC‐Annexin V binding and for cellular DNA using propidium iodide according to the method of Vermes et al. (1995). One hundred microlitres of a suspension of cells (107/ml) in HEPES buffer was incubated with FITC‐Annexin V at a final concentration of 1 µg/µl for 20 min in the dark. After centrifuging at 500 g for 3 min, the cell pellet was resuspended in a propidium iodide solution at a final concentration of 1 µg/µl. After 10 min in the dark, cells were analysed by flow cytometry. Apoptosis was considered for positive FITC‐Annexin V/negative PI cells.
Statistical analysis
Results are expressed as means ± SEM. Statistical analysis was carried out applying the analysis of variance (anova) followed by Scheffé test in order to establish differences between the experimental groups defined in each time period. P‐values lower than 0.05 were considered to be statistically significant.
RESULTS
As shown in Table 1, PDO induced a significant increase in plasma amylase activity from 3 h after PDO onwards, with maximal values at 12 h in both NAC‐treated and non‐treated PDO rats. Nevertheless, administration of the antioxidant significantly reduced hyper‐amylasaemia induced by PDO, displaying a greater effect within the first 6 h (P < 0.001).
Table 1.
Plasma amylase activity
| 3 h | 6 h | 12 h | 24 h | |
|---|---|---|---|---|
| Sham (n = 12) | 5.16 ± 0.21 | 4.21 ± 0.28 | 4.80 ± 0.54 | 5.26 ± 0.40 |
| NAC‐Sham (n = 12) | 4.71 ± 0.16 | 4.21 ± 0.36 | 4.22 ± 0.25 | 5.30 ± 0.47 |
| PDO (n = 12) | 10.39 ± 0.76 | 13.81 ± 1.37 | 15.94 ± 0.25 | 14.96 ± 1.55 |
| a, b P < 0.001 | a, b P < 0.001 | a, b P < 0.001 | a, b P < 0.001 | |
| NAC‐PDO (n = 12) | 7.19 ± 0.27 | 7.45 ± 0.66 | 12.15 ± 1.02 | 10.61 ± 0.44 |
| a P < 0.01 | a, b P < 0.05 | a, b P < 0.001 | a P < 0.001 | |
| b, c P < 0.001 | c P < 0.001 | c P < 0.05 | b, c P < 0.01 |
Values are expressed in U/dl as means ± SEM. n represents the number of animals in each group: sham‐operated rats (Sham), sham‐operated rats treated with NAC (NAC‐Sham), rats with PDO‐induced AP (PDO) and PDO rats treated with NAC (NAC‐PDO).
Significant differences vs. Sham;
b significant differences vs. NAC‐Sham and
c significant differences vs. PDO rats.
NAC administration significantly (P < 0.001) increased the pancreatic GSH content in sham‐operated rats. PDO‐induced acute pancreatitis significantly decreased GSH levels from 3 h onwards, reaching the lowest values 6 h after PDO. However, NAC‐treated PDO rats maintained control values 3 h after obstruction and, although GSH depletion at later AP stages was not completely prevented by NAC treatment, pancreatic GSH levels were found to be significantly higher (P < 0.01) in rats receiving NAC 6 h after PDO (Table 2).
Table 2.
GSH content in pancreas
| 3 h | 6 h | 12 h | 24 h | |
|---|---|---|---|---|
| Sham (n = 6) | 1.58 ± 0.07 | 1.72 ± 0.07 | 1.63 ± 0.04 | 1.52 ± 0.04 |
| NAC‐Sham (n = 6) | 1.82 ± 0.03 | 2.39 ± 0.12 | 2.46 ± 0.08 | 1.38 ± 0.06 |
| a P < 0.001 | a P < 0.001 | |||
| PDO (n = 6) | 1.14 ± 0.05 | 0.73 ± 0.05 | 1.13 ± 0.03 | 0.98 ± 0.04 |
| a P < 0.05 | a, b P < 0.001 | a, b P < 0.001 | a P < 0.001 | |
| b P < 0.01 | b P < 0.01 | |||
| NAC‐PDO (n = 6) | 1.71 ± 0.10 | 1.14 ± 0.05 | 1.16 ± 0.08 | 1.07 ± 0.10 |
| c P < 0.001 | a, b P < 0.001 | a, b P < 0.001 | a P < 0.01 | |
| c P < 0.01 | b P < 0.05 |
Values are expressed in µmol/g as means ± SEM. n represents the number of animals in each group: sham‐operated rats (Sham), sham‐operated rats treated with NAC (NAC‐Sham), rats with PDO‐induced AP (PDO) and PDO rats treated with NAC (NAC‐PDO).
Significant differences vs. Sham;
b significant differences vs. NAC‐Sham;
c significant differences vs. PDO rats.
Flow‐cytometric analysis of acinar cells after DHR labelling (Fig. 1) showed early and progressive increase in the fluorescence intensity following AP induction, although statistical significance (P < 0.05) was only reached 6 h after PDO. NAC administration prevented this increase and consequently, control values were found throughout the 24 h of PDO.
Figure 1.
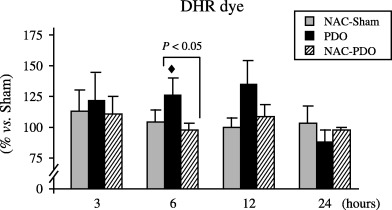
Flow‐cytometric measurement of OFR generation within pancreatic acinar cells, using DHR as fluorescent dye. Number of animals was six per group and experimental period. Results are expressed as percentages with respect to that obtained every day in sham‐operated group. Values are means ± SEM. Scheffè test following anova revealed significant differences vs. sham‐operated rats (◆, P < 0.05) as well as between NAC‐treated and non‐treated PDO rats (P < 0.05).
Figure 2 shows the changes in TNF‐α plasma levels observed over the 24 h following surgery. A slight increase was observed within the first 6 h after inducing AP by PDO, and statistical significance (P < 0.001) was reached 12 and 24 h after PDO. TNF‐α plasma levels were maintained in control values within 12 h following PDO in rats receiving NAC. In this experimental group, only a small increase was observed at 24 h, but the values did not significantly differ from those found in the sham‐operated group. Significantly lower TNF‐α plasma levels were found from 6 to 24 h after PDO in rats treated with NAC.
Figure 2.
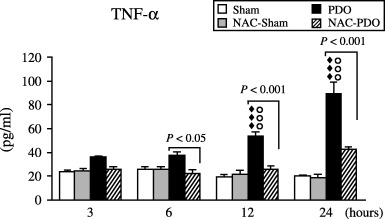
Plasma TNF‐α levels found in sham‐operated (Sham), NAC‐treated sham‐operated (NAC‐Sham), pancreatic duct obstruction (PDO) and NAC‐treated pancreatic duct obstruction (NAC‐PDO) groups over the 24 h following surgery. Values are means ± SEM. Number of animals was 12 per group and experimental period. Application of anova followed by Scheffè test showed statistically significant differences vs. Sham (◆◆◆, P < 0.001), vs. NAC‐Sham (○○○, P < 0.001) and vs. NAC‐PDO groups (P < 0.05; P < 0.001).
As shown in Fig. 3, NAC treatment caused a significant increase in G0/G1‐phase from 6 to 12 h after surgery both in NAC‐Sham and NAC‐PDO rats. The comparison between NAC‐treated and non‐treated PDO rats revealed significantly (P < 0.05) higher number of G0/G1‐phase cells in rats with AP receiving NAC. Concomitantly, significant decreases were observed in the percentage of G2/M‐phase cells of NAC‐treated rats and, as a consequence, significant differences (P < 0.05) were found between NAC‐treated and non‐treated PDO rats. Regarding S‐phase, no change was induced by NAC administration during early AP stages, but significant (P < 0.01) increases were found 24 h after PDO in rats receiving NAC up to values significantly higher than those of non‐treated PDO rats.
Figure 3.

Relative distribution of pancreatic acinar cells within the different phases of the cell cycle, established according to flow‐cytometric analysis of cellular DNA content using PI staining. Application of anova followed by Sheffè test showed significant differences vs. Sham (◆, P < 0.05; ◆◆, P < 0.01; ◆◆◆, P < 0.001), vs. NAC‐Sham (○○, P < 0.01) and vs. PDO rats (P < 0.05).
No significant variation was found in Sub G1‐phase (Fig. 3) and Annexin V staining (Fig. 4), thus indicating that apoptosis was not induced during 24 h PDO either in NAC‐treated or non‐treated rats.
Figure 4.
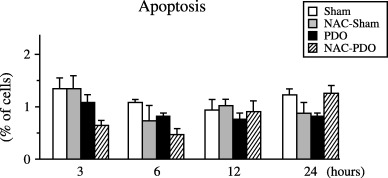
Percentage of apoptotic acinar cells measured as positive FITC‐Annexin V/negative PI found in sham‐operated (Sham), NAC‐treated sham‐operated (NAC‐Sham), pancreatic duct obstruction (PDO) and NAC‐treated pancreatic duct obstruction (NAC‐PDO) groups over the 24 h following surgery. Values are means ± SEM. Number of animals was six per group and experimental period. Application of anova followed by Scheffè test did not reveal statistical significant differences.
DISCUSSION
The deleterious effects of oxygen free radicals (OFR) at high and/or sustained levels in biological systems, and their involvement in a variety of diseases and in ageing have been widely studied (Schoenberg et al. 1992; Rau et al. 2000; Dröge 2002).
Recently, Uruñuela et al. (2002a) assessed the occurrence of excessive oxygen free radical production within pancreatic acinar cells, and the subsequent peroxidative damage to cell membranes in PDO‐induced AP. With regard to DHR‐dye, the present study has shown that NAC treatment prevented the enhanced acinar OFR generation after AP induction and, in view of the decreased plasma amylase activity, seems able to reduce the severity of the disease. Direct scavenging of OFR and effective l‐cysteine supply for glutathione (GSH) synthesis might represent two different routes achieved by NAC administration, counteracting the excessive OFR generation and depletion of cellular GSH content, hallmarks in the progression of AP. In accordance with this, NAC effectively delayed and blunted the release of TNF‐α into peripheral blood. TNF‐α is one of the most important pro‐inflammatory cytokines involved in the progression of local tissue damage during AP which contributes to the activation and amplification of the immune response (Norman 1998; Weber & Adler 2001; Frossard & Pastor 2002), thus leading to the appearance of systemic complications, usually responsible for AP‐associated mortality in humans. Inhibition of cytokine production by NAC has been found in different experimental settings (Winyard & Blake 1997; Demols et al. 2000; Kim et al. 2000) and sometimes correlates with the suppressive effect on activation of the transcription factor nuclear factor (NF) κB (Kim et al. 2000). NF‐κB regulates the expression of several genes, some encoding pro‐inflammatory mediators, and its activation has been observed in pancreatic acinar cells in response to OFR in vitro (Kim et al. 2000) and in vivo (Steinle et al. 1999) after AP induced by cerulein supramaximal stimulation. In both cases, NF‐κB activation was down‐regulated by NAC administration.
In addition to oxidative damage, OFR have demonstrated a regulatory role in cell proliferation. H2O2 and O2− were reported to be capable of increasing growth or growth response in different types of mammalian cells (Burdon 1995). However, the final outcome of OFR‐mediated signalling pathways varied from one cell type to another, depending on the primary reactive species generated and site of production, as well as the dosage and duration of treatment when OFR were exogenously added (Thannickal et al. 2000; Martindale & Holbrook 2002).
As regards the progression of pancreatic acinar cells throughout the different cell‐cycle phases, increased levels of mitosis have previously been reported 12 h after PDO (De Dios et al. 2000). Because cholecystokinin (CCK) is one of the most important mitogenic stimuli for rat pancreatic acinar cells (Ohlsson et al. 1995), such results could be explained by the significant increase in plasma CCK levels as a result of deprivation of pancreatic enzyme secretion into the duodenal lumen, as has been reported following the obstruction of the biliary tract (Toriumi et al. 1993; Shirohara & Otsuki 1997), and/or by the increase in OFR generation within acinar cells reported by Uruñuela et al. (2002a). Given the implication of OFR in mitogenic signalling pathways, anti‐proliferative effects should be expected after NAC administration. Accordingly, both in Sham and PDO rats, NAC treatment was seen to induce a significant increase in the proportion of cells in G0/G1‐phase up to 12 h, and a simultaneous decrease in the relative number of cells in G2/M‐phase. NAC has been shown to provoke inhibition of MAPK cascades in several cell types, including pancreatic acinar cells (Dabrowski et al. 2000; Kuruganti et al. 2002). The activation of these pathways is a key regulatory point in the cell cycle, which is required for the cell to leave the quiescent state and enter S‐phase (Pagès et al. 1993; Morisset et al. 1999). Accordingly, our results suggest that mitogenic stimulation due to both enhanced plasma CCK concentrations and OFR overproduction in acinar cells following AP might be inhibited by NAC administration, as both stimuli seem to make use of OFR‐dependent MAPKs activation in order to achieve the proliferative response. As a result, NAC has been shown to supress the proliferative response after AP induction and has promoted cell arrest at early PDO stages.
Cells were no longer actively proliferating 24 h after PDO induction, probably because they were progressively damaged in the course of PDO. Pancreatic atrophy has been reported 48 h after inducing AP by PDO, which develops with increased proportions of G0/G1‐phase cells and apoptosis (Walker 1987; De Dios et al. 2000). By contrast, cells from NAC‐treated PDO rats remained able to synthesize DNA, probably because they were effectively preserved from damage during early AP stages, when different pathological mechanisms involved in AP develop in this experimental model, as reported by 2002a, 2002b, 2002c). Cells could be freed from the arrest asserted by NAC at earlier AP stages and they may actively enter S‐phase at this PDO time point, probably in an attempt to restore the normal proliferation pattern. Mitosis might be expected at later stages when it would counteract the deletion of acinar cells found in rats with PDO‐induced AP (De Dios et al. 2000). This event could be favoured by CCK, whose plasma levels have been found increased for at least 3 days after the onset of gallstones‐induced acute pancreatitis (Shirohara & Otsuki 1997).
In this AP model, loss of acinar cells takes place mainly as a consequence of apoptotic processes, in which TNF‐α is involved (Gukovskaya et al. 1997). A significant increase in apoptotic cells was found 48 h after PDO (Walker 1987; De Dios et al. 2000); however, apoptosis would not be expected throughout the 24 h of PDO in NAC‐treated rats as TNF‐α concentration is not increased and acinar cells are protected from oxidative damage at earlier AP stages.
In conclusion, the results provide evidence that OFR play a critical role in the progression of cell‐cycle phases in pancreatic acinar cells. In parallel with the prevention of OFR generation, and therefore oxidative damage, NAC treatment maintained acinar cells in a quiescent state in early AP. These effects may combine together in the protection of the cells at early AP stages and consequently, would retain their ability to proliferate further in the course of AP. Furthermore, NAC reduced the inflammatory response during AP and, therefore, its severe consequences would also be delayed. As a result, administration of NAC could extend the time for effective removal of the obstruction and further recovery of the gland.
ACKNOWLEDGEMENTS
Thanks are due to Mark Anderson for the linguistic assistance. This study was funded by grants from Fondo de Investigacion Sanitaria, Spain (FIS, PI02/0163) and Junta de Castilla y León, Spain (JCL, SA123/03).
REFERENCES
- Burdon RH (1995) Superoxide and hydrogen peroxide in relation to mammalian cell proliferation. Free Radic. Biol. Med. 18, 775. [DOI] [PubMed] [Google Scholar]
- Cotgreave IA (1997) N‐acetylcysteine: pharmacological considerations and experimental and clinical applications. Adv. Pharmacol. 38, 205. [PubMed] [Google Scholar]
- Dabrowski A, Boguslowicz C, Dabrowska M, Tribillo I, Gabryelewicz A (2000) Reactive oxygen species activate mitogen‐activated protein kinases in pancreatic acinar cells. Pancreas 21, 376. [DOI] [PubMed] [Google Scholar]
- De Dios I, Uruñuela A, Pinto RM, Orfao A, Manso MA (2000) Cell‐cycle distribution of pancreatic cells from rats with acute pancreatitis induced by bile‐pancreatic obstruction. Cell Tissue Res. 300, 307. [DOI] [PubMed] [Google Scholar]
- Demols A, Van Laethem JL, Quertinmont E, Legros F, Louis H, Le Moine O, Deviere J (2000) N‐acetylcysteine decreases severity of acute pancreatitis in mice. Pancreas 20, 161. [DOI] [PubMed] [Google Scholar]
- Dröge W (2002) Free radicals in the physiological control of cell function. Physiol. Rev. 82, 47. [DOI] [PubMed] [Google Scholar]
- Frossard JL, Pastor CM (2002) Experimental acute pancreatitis: new insights into the pathophysiology. Front. Biosci. 7, 275. [DOI] [PubMed] [Google Scholar]
- Gukovskaya AS, Gukovsky I, Zaninovic V, Song M, Sandoval D, Gukovsky S, Pandol SJ (1997) Pancreatic acinar cells produce, release, and respond to tumor necrosis factor‐α. Role in regulating cell death and pancreatitis. J. Clin. Invest 100, 1853. [DOI] [PMC free article] [PubMed] [Google Scholar]
- Hickson JC (1970) The secretion of pancreatic juice in response to stimulation of the vagus nerves in the pig. J. Physiol. 206, 275. [DOI] [PMC free article] [PubMed] [Google Scholar]
- Kim H, Seo JY, Roh KH, Lim JW, Kim KH (2000) Suppression of NF‐κB activation and cytokine production by N‐acetylcysteine in pancreatic acinar cells. Free Radic. Biol. Med. 29, 674. [DOI] [PubMed] [Google Scholar]
- Kim BY, Han MJ, Chung AS (2001) Effects of reactive oxygen species on proliferation of Chinese hamster lung fibroblast (V79) cells. Free Radic. Biol. Med. 30, 686. [DOI] [PubMed] [Google Scholar]
- Kong G, Lee S, Kim KS (2001) Inhibition of rac1 reduces PDGF‐induced reactive oxygen species and proliferation in vascular smooth muscle cells. J. Korean Med. Sci. 16, 712. [DOI] [PMC free article] [PubMed] [Google Scholar]
- Kuruganti PA, Wurster RD, Lucchesi PA (2002) Mitogen activated protein kinase activation and oxidant signaling in astrocytoma cells. J. Neurooncol. 56, 109. [DOI] [PubMed] [Google Scholar]
- Kyaw M, Yoshizumi M, Tsuchiya K, Kirima K, Suzaki Y, Abe S, Hasegawa T, Tamaki T (2002) Antioxidants inhibit endothelin‐1 (1–31)‐induced proliferation of vascular smooth muscle cells via the inhibition of mitogen‐activated protein (MAP) kinase and activator protein‐1 (AP‐1). Biochem. Pharmacol. 64, 1521. [DOI] [PubMed] [Google Scholar]
- Martindale JL, Holbrook NJ (2002) Cellular response to oxidative stress: signaling for suicide and survival. J. Cell. Physiol. 192, 1. [DOI] [PubMed] [Google Scholar]
- Morisset J, Aliaga JC, Calvo EL, Bourassa J, Rivard N (1999) Expression and modulation of p42/p44 MAPKs and cell cycle regulatory proteins in rat pancreas regeneration. Am. J. Physiol. 277, 953. [DOI] [PubMed] [Google Scholar]
- Norman J (1998) The role of cytokines in the pathogenesis of acute pancreatitis. Am. J. Surg. 175, 76. [DOI] [PubMed] [Google Scholar]
- Ohlsson B, Axelson J, Sternby B, Rehfeld JF, Ihse I (1995) Time‐course of the pancreatic changes following long‐term stimulation or inhibition of the CCK‐A receptor. Int. J. Pancreatol. 18, 59. [DOI] [PubMed] [Google Scholar]
- Pagès G, Lenormand P, L’Allemain G, Chambard JC, Meloche S, Pouysségur J (1993) Mitogen‐activated protein kinases p42mapk and p44mapk are required for fibroblast proliferation. Proc. Natl. Acad. Sci. USA 90, 8319. [DOI] [PMC free article] [PubMed] [Google Scholar]
- Rau B, Poch B, Gansauge F, Bauer A, Nüssler AK, Nevalainen T, Schoenberg MH, Beger HG (2000) Pathophysiologic role of oxygen free radicals in acute pancreatitis: initiating event or mediator of tissue damage? Ann. Surg. 231, 352. [DOI] [PMC free article] [PubMed] [Google Scholar]
- Rothe G, Emmendorffer A, Oser A, Roesler J, Valet G (1991) Flow cytometric measurement of the respiratory burst activity of phagocytes using dihydrorhodamine 123. J. Immunol. Meth 138, 133. [DOI] [PubMed] [Google Scholar]
- Schoenberg MH, Büchler M, Helfen M, Beger HG (1992) Role of oxygen radicals in experimental acute pancreatitis. Eur. Surg. Res. 24, 74. [DOI] [PubMed] [Google Scholar]
- Schreck R, Baeuerle PA (1991) A role for oxygen radicals as second messengers. Trends Cell Biol. 1, 39. [DOI] [PubMed] [Google Scholar]
- Shirohara H, Otsuki M (1997) Plasma cholecystokinin levels in acute pancreatitis. Pancreas 14, 249. [DOI] [PubMed] [Google Scholar]
- Steinle AUM, Weidenbach H, Wagner M, Adler G, Schmid RM (1999) NF‐κB/Rel activation in cerulein pancreatitis. Gastroenterology 116, 420. [DOI] [PubMed] [Google Scholar]
- Thannickal VJ, Fanburg BL (2000) Reactive oxygen species in cell signaling. Am. J. Physiol. Lung Cell. Mol. Physiol. 279, 1005. [DOI] [PubMed] [Google Scholar]
- Thannickal VJ, Day RM, Klinz SG, Bastien MC, Larios JM, Fanburg BL (2000) Ras‐dependent and ‐independent regulation of reactive oxygen species by mitogenic growth factors and TGF‐beta1. FASEB J. 14, 1741. [DOI] [PubMed] [Google Scholar]
- Tietze F (1969) Enzymic method for quantitative determination of nanogram amounts of total and oxidized glutathione: applications to mammalian blood and other tissues. Anal. Biochem. 27, 502. [DOI] [PubMed] [Google Scholar]
- Toriumi Y, Samuel I, Wilcockson DP, Turkelson CM, Solomon TE, Joehl RJ (1993) Increased circulating cholecystokinin in obstruction‐induced acute pancreatitis. II. Pancreatic duct obstruction with and without bile duct obstruction. J. Surg. Res. 54, 132. [DOI] [PubMed] [Google Scholar]
- Torres M (2003) Mitogen‐activated protein kinase pathways in redox signaling. Front. Biosci. 1, 369. [DOI] [PubMed] [Google Scholar]
- Uruñuela A, Sevillano S, De La Mano AM, Manso MA, Orfao A, De Dios I (2002a) Time‐course of oxygen free radical production in acinar cells during acute pancreatitis induced by pancreatic duct obstruction. Biochim. Biophys. Acta 1588, 159. [DOI] [PubMed] [Google Scholar]
- Uruñuela A, Manso MA, Pinto R, Orfao A, De Dios I (2002b) Enzyme load in pancreatic acinar cells is increased in the early stages of acute pancreatitis induced by duct obstruction in rats. Clin. Sci. 98, 143. [PubMed] [Google Scholar]
- Uruñuela A, Manso MA, De La Mano AM, Sevillano S, Orfao A, De Dios I (2002c) Asynchronous impairment of calcium homoeostasis in different acinar cells after pancreatic duct obstruction in rat. Clin. Sci. 102, 615. [DOI] [PubMed] [Google Scholar]
- Vermes I, Haanen C, Steffens‐Nakken H, Reutelingsperger C (1995) A novel assay for apoptosis flow cytometric detection of phosphatidylserine expression on early apoptotic cells using fluorescein labelled Annexin V. J. Immunol. Meth. 184, 39. [DOI] [PubMed] [Google Scholar]
- Walker NI (1987) Ultrastructure of the rat pancreas after experimental duct ligation. I. The role of apoptosis and intraepithelial macrophages in acinar cell deletion. Am. J. Pathol. 126, 439. [PMC free article] [PubMed] [Google Scholar]
- Weber CK, Adler G (2001) From acinar cell damage to systemic inflammatory response: current concepts in pancreatitis. Pancreatology 1, 356. [DOI] [PubMed] [Google Scholar]
- Winyard PG, Blake DR (1997) Antioxidants, redox‐regulated transcription factors, and inflammation. Adv. Pharmacol. 38, 403. [DOI] [PubMed] [Google Scholar]