Abstract
Objectives: Peptide nucleic acid (PNA) probes hybridize to denatured telomeric sequences in cells permeabilized in hot formamide. In reported protocols, the hybridization was conducted in solutions with high formamide concentrations to avoid the DNA renaturation that can hamper binding of the oligo‐PNA probe to specific sequences. We postulated that telomeric DNA, confined in the nuclear microvolume, is not able to properly renature after hot formamide denaturation. Therefore, to improve hybridization conditions between the probe and the target sequences, it might be possible to add probe to sample after the complete removal of formamide.
Materials and methods: After telomeric DNA denaturation in hot formamide solution and several washes to remove the ionic solvent, cells were hybridized overnight at room temperature with human telomere‐specific PNA probe conjugated with Cy5 fluorochrome, Cy5‐OO‐(CCCTAA)3. After stringency washes and staining with ethidium bromide, the cells were analysed by flow cytometry and by using a confocal microscope.
Results: Using three continuous cell lines, different in DNA content and telomere length, and resting human peripheral blood T and B lymphocytes, we demonstrated that the oligo‐PNA probe hybridized to telomeric sequences after complete removal of formamide and that in the preserved nucleus, telomeric sequence denaturation is irreversible.
Conclusion: According to our experience, oligo‐PNA binding results is efficient, specific and proportional to telomere length. These, our original findings, can form the technological basis of actual in situ hybridization on preserved whole cells.
Introduction
Telomeres are specialized protective structures at chromosome ends, which undergo dynamic changes in each cell cycle (1). In all vertebrates they consist of tandem DNA repeats of the sequence d(TTAGGG) and associated proteins (2 ). Telomeres have emerged to be crucial cellular elements in ageing processes and various diseases including cancer. Flow FISH is one among the several methods available, each with characteristic advantages and disadvantages, for measuring the length of telomere repeats (3, 4).
A typical flow FISH procedure to hybridize telomeric sequences in whole cells with fluorescent oligo‐PNA probes consists of: (i) cell fixation/permeabilization and DNA denaturation at high temperature, in solutions containing the probe and with high formamide concentration; (ii) sample incubation at room temperature (RT) in the same solution; and (iii) many stringency washes (5, 6, 7, 8, 9, 10). Although the sample remains incubated with the probe at RT for several hours after denaturation, in this procedure, the high concentration of formamide interferes significantly with oligo‐PNA binding to specific sequences. Therefore, most of the probe is removed with the supernatant before the stringency washes are performed. On the other hand, previously described methods demand presence of the probe and formamide during sample denaturation and hybridization steps at RT due to the assumption that DNA would otherwise renature after high temperature DNA denaturation (11).
In contrast, we have postulated that telomeric DNA denatured in hot formamide cannot properly renature if constrained within the nuclear microvolume, and will mostly remain in single‐strand form even after complete removal of the formamide by washing the cells with phosphate‐buffered saline (PBS). This would be due not only to secondary intrastrand structure formation, but probably also to cross‐annealing among strands of repeated non‐coding (like telomeric sequences) and coding sequences. Repeated sequences represent most of the chromosomes (12), and thus hamper each other in the attempt to renature. According to this hypothesis, incubation of sample with probe and stringency washes could be performed under mild conditions (without formamide and at RT), thus increasing efficiency, specificity and proportionality of the binding of probe to target sequences, not hampered by presence of formamide.
In consequence of these considerations, we have developed an experimental protocol for measurement of telomere length in which Cy5‐OO‐(CCCTAA)3 probe was added to cells (formerly denatured with formamide at high temperature) after formamide removal and repeated washes in PBS.
Materials and methods
Cells
Hypodiploid human Burkitt’s lymphoma B‐cell line Ramos (ECACC cat. No. 85030802), near diploid (20% polyploidy) human Burkitt’s lymphoma B‐cell line Daudi (ECACC cat. No. 85011437) and near tetraploid human T‐cell leukaemia line 1301 (ECACC cat. No. 01051619) were purchased from Sigma‐Aldrich (Milan, Italy). Cells were maintained at 1 × 10⁵ to 1 × 10⁶ cells/ml and cultured in RPMI 1640 (Life Technologies, Milan, Italy) supplemented with antibiotics and 10% foetal calf serum (FCS; HyClone, Logan, UT, USA), at 37 °C in humidified atmosphere with 5% CO2. T and B lymphocytes were purified using Dynal Negative Isolation Kits (Dynal Biotech Asa, Oslo, Norway) from human peripheral blood mononuclear cells (PBMC) separated by isopycnic centrifugation on Lymphoprep (Axis‐Shield), from EDTA‐treated blood samples.
Cell permeabilization–denaturation, hybridization and stringency washes
Our protocol. A total of 3 × 10⁵ cells were washed with 0.15 m PBS, pH 7.2, containing 10% FCS and resuspended in 300 μl of denaturing solution containing 50% formamide (Invitrogen, Carlsbad, CA, USA), 10% FCS and 9 mm PBS. Samples were successively incubated for 10 min at RT, 15 min at 87 °C and 10 min at RT Cells were then centrifuged at 800 g for 3 min at 20 °C and washed twice at 800 g for 6 min at 20 °C with 1 ml of PBS containing 10% FCS; finally cells were resuspended in 0.5 ml of the same solution containing 20 nm PNA probe Cy5‐OO‐(CCCTAA)3 (Panagene, Daejeon 305‐510, Korea) and incubated overnight at RT in the dark with gentle rotation. Samples were then washed in PBS 10% FCS, resuspended for 10 min at RT in the same solution, washed again and finally incubated in 0.5 ml of PBS containing 10% FCS and 1 μg/ml of ethidium bromide (EB; Sigma‐Aldrich) for at least 30 min at RT in the dark, before acquisition.
Original flow FISH protocol. A total of 3 × 10⁵ cells were washed with 0.15 m PBS, pH 7.2, containing 10% FCS and resuspended in 300 μl of denaturing/hybridization solution containing 70% formamide, 10% FCS, 20 mm Tris–HCl, pH 7.0, and 20 nm PNA probe Cy5‐OO‐(CCCTAA)3. Samples were successively incubated for 10 min at RT, 10 min at 80 °C and overnight at RT in the dark with gentle rotation. Cells were then centrifuged at 800 g for 3 min at 20 °C, washed twice with centrifugation at 800 g for 6 min at 20 °C with 1 ml of washing buffer containing 70% formamide, 10mm Tris–HCl, pH 7.0, 10% FCS, 0.1% Tween 20 (Sigma‐Aldrich) and once with PBS containing 10% FCS and 0.1% Tween 20. Finally cells were resuspended in 0.5 ml of PBS containing 10% FCS and 1 μg/ml EB for at least 2 h at RT in the dark before acquisition.
Flow cytometry
Cells were analysed using a Becton Dickinson FACSCalibur cytometer equipped with a 15 mW, 488 nm, air‐cooled argon ion laser for excitation of EB (FL2) and with a 10 mW, 635 nm, red diode laser for excitation of Cy5 (FL4). Stability and sensitivity of the cytometer were checked before each acquisition session, by measuring intensity and variation coefficient of scatters and fluorescence signals of Nile Red microbeads (Becton Dickinson, Milan, Italy). FL4 detection was optimized by time delay calibration using APC microbeads (Becton Dickinson); singlets and doublets of the same microbeads were used to check linearity of FL4 detection. FSC‐H, SSC‐H and FL4‐H height signals, and FL2‐A area signals were collected after linear amplification. The suitable instrument setting did not require any compensation between FL2‐A and FL4‐H fluorescence channels. To improve resolution of DNA content and telomere length, it was necessary to set low flow rate (10–14 μl/min, 80–120 cells/s) and to acquire EB and Cy5 fluorescences as much as possible at the right hand side of the linear scale.
Samples were analysed using CELLQuest 3.3 software (Becton Dickinson); for deconvolution of FL2‐A and FL4‐H frequency distributions, ModFit LT 2.0 software was utilized (Verity Software House, Topsham, ME, USA).
Confocal microscopy
Cells prepared as described above, were mounted on to a microscope slide with VECTASHIELD Mounting Medium (Vector Laboratories, Burlingame, CA, USA) and fluorescence was analysed using a Leica confocal microscope (Laser Scanning TCS SP2) equipped with Ar/ArKr and HeNe lasers. Images were acquired utilizing the Leica confocal software. Laser lines were at 488 and 633 nm for excitation of EB and Cy5 respectively. EB and Cy5 fluorescences were collected using a 40× oil immersion objective lens. Cell analysis was performed, from beginning to end of fluorescence optical spatial series, each composed of 12 optical sections with step size of 1 μm.
Results
We used 1301, Ramos and Daudi human continuous cell lines and human peripheral blood T and B lymphocytes to optimize efficiency, specificity and proportionality of our procedure by parametric analysis of influence of the following variables: (i) formamide, probe and EB concentrations, (ii) temperatures and times of denaturation and hybridization, (iii) sample volume, (iv) cell concentration and (v) number of washes.
Efficiency
Efficiency was measured as ratio of Cy5 mean fluorescence intensity (MFI) of the sample treated according to our protocol and its negative control (autofluorescence + non‐specific binding). Negative control was obtained by treating a duplicate sample according to the complete protocol but replacing the high temperature step with RT incubation. Such a negative control is stoichiometrically stainable with EB (total DNA content) but stainable with Cy5 conjugated probe (telomeric DNA) only in a non‐specific way, as formamide at RT does not produce effective DNA denaturation. This allows calculating Cy5 MFI ratios between sample and its control, gating events in the same cell cycle phase (G1 + G0 events) on DNA content histograms. Note that our negative control, including both autofluorescence and non‐specific binding, results are more stringent than those reported in previously published protocols, where only autofluorescence is used as negative control (3, 4). Figure 1 illustrates different telomere lengths of the three cell lines (1301 > Ramos > Daudi), measured setting FL4‐H signal amplification so that Cy‐5 MFIs of negative controls were nearly identical for all cell lines; our measurements are consistent with average telomere lengths evaluated in these cells by terminal restriction fragments (TRFs) (4, 13).
Figure 1.
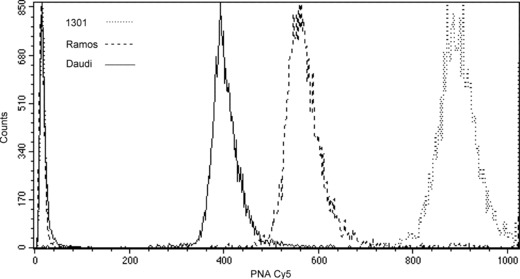
Hybridization efficiency. Overlaid Cy5 fluorescence histograms of G1 + G0 cells gated on EB fluorescence histograms (not shown) of 1301 (dotted lines), Ramos (dashed lines) and Daudi (continuous lines) cells. For each cell line, fluorescence of hybridized sample and its negative control is shown. Efficiency (hybridized MFI/negative control MFI) is: 888/20 for 1301; 558/19 for Ramos; 396/19 for Daudi.
With our method, we obtained mean efficiency ratios ranging from 20 to 45 for the three cell lines studied. These staining efficiencies are significantly higher than those that can be achieved following the original procedure (3) reported in the literature (Fig. 2a–d). Identical increase in staining efficiency was achieved with human lymphocytes (Fig. 2e,f, see below).
Figure 2.
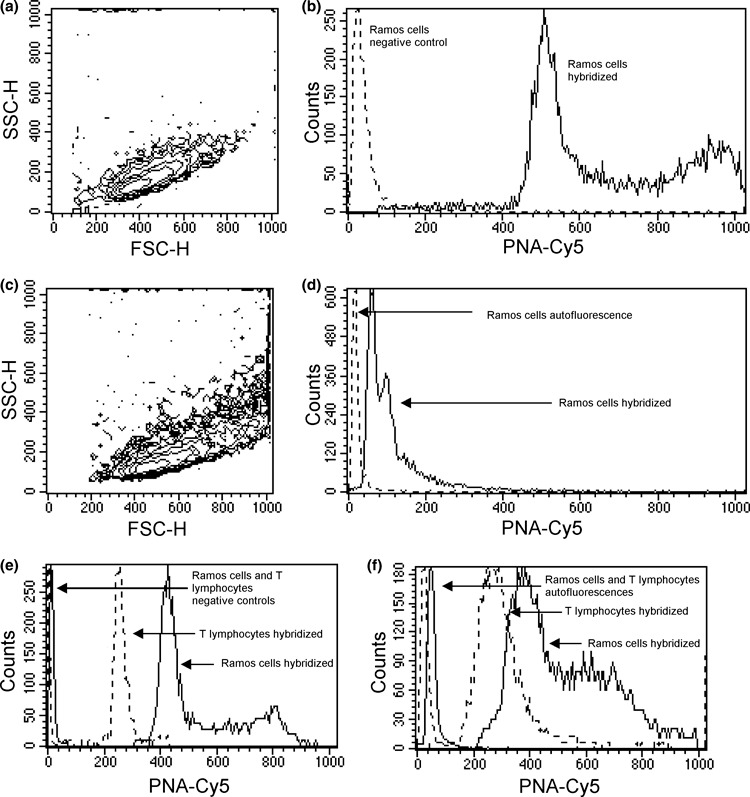
Comparison between typical results obtained with our and the original flow FISH procedure. FSC‐H versus SSC‐H contour graphs (a, c) show the better preservation of physical parameters of Ramos cells after our (a) and original flow FISH (c) treatment. Overlaid histograms (b, d) show the better PNA‐Cy5 staining efficiency obtained with our (b) and original flow FISH (d) procedure. Continuous lines correspond to hybridized samples, dashed lines correspond to our negative control (b) and original autofluorescence (d). Both samples were acquired using the same instrument setting. Overlaid histograms (e, f) show the better PNA‐Cy5 staining efficiency obtained with our (e) and original flow FISH (f) procedure on mixed samples of human T lymphocytes and Ramos cells. Continuous lines correspond to hybridized Ramos cells and their control, dashed lines correspond to hybridized lymphocytes and their control. With our procedure (e) the FL4‐H PMT voltage was 660, and with original flow FISH (f) the FL4‐H PMT voltage was 950.
Specificity
To verify cell localization and pattern distribution of the Cy5 PNA probe, confocal laser scanning microscopy was performed. Nuclear and cytoplasmic compartments of Ramos cells treated following our hybridization protocol and examined in bright field appeared well preserved (Fig. 3a). Figure 3b,c show, respectively, EB (total DNA) and Cy5 (telomeric DNA) fluorescences at nuclear level in the same cell. It is fully evident that EB fluorescence was distributed throughout the nucleus, while Cy5 fluorescence was restricted to fluorescence spots (‘foci’), as shown in Fig. 3d.
Figure 3.
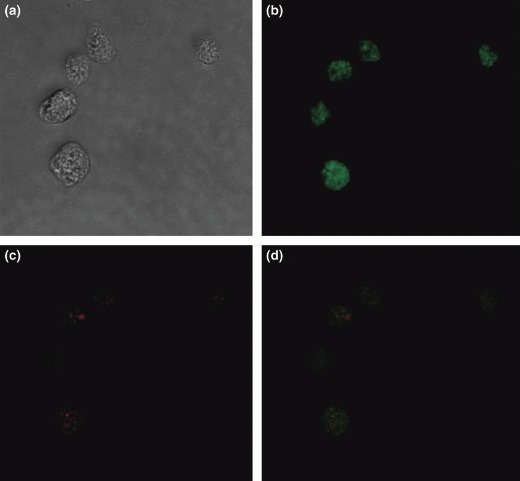
Laser scanning confocal microscopy. The image at this depth represents the section of the nucleus. Bright field microscopy of Ramos cells treated with hybridization protocol (a). Spread EB fluorescence (b) and spotted Cy5 fluorescence (c) in nuclei of the same cells. Overlayed EB and Cy5 fluorescences (d) indicating nuclear localization of the PNA probe.
By analysing total and telomeric DNA bivariate histograms (contour graphs of EB versus PNA‐Cy5 fluorescences), we observed different distributions of the events in distinct phases of the cell cycle. This finding prompted us to evaluate specificity of oligo‐PNA probe hybridization to telomeric sequences by deconvolution, using appropriate software, of frequency distributions of EB and Cy5 fluorescences. As illustrated in Fig. 4, the more samples had long telomeres the more distributions of total and telomeric DNA that appeared to be dissimilar. In 1301 cells, that had telomeres ranging from 25 to 80 kb (4, 14), S phase events calculated from the telomeric DNA histogram are little more than half the events calculated from the total DNA histogram. Most S cells were converted into G2 + M cells when the Cy5 histogram was deconvoluted, increasing G2 + M phase from 6% to 19%. When the same approach was applied to Ramos cells, that have TRFs shorter than 1301 cells (13), the difference in S% and G2 + M % phases between EB and Cy5 histogram results still present but less marked (S from 50% to 41%; G2 + M from 13% to 22%). For Daudi, a cell line with very short TRFs (13), deconvoluted histograms of total and telomeric DNA show cell cycle phases with moderate differences.
Figure 4.
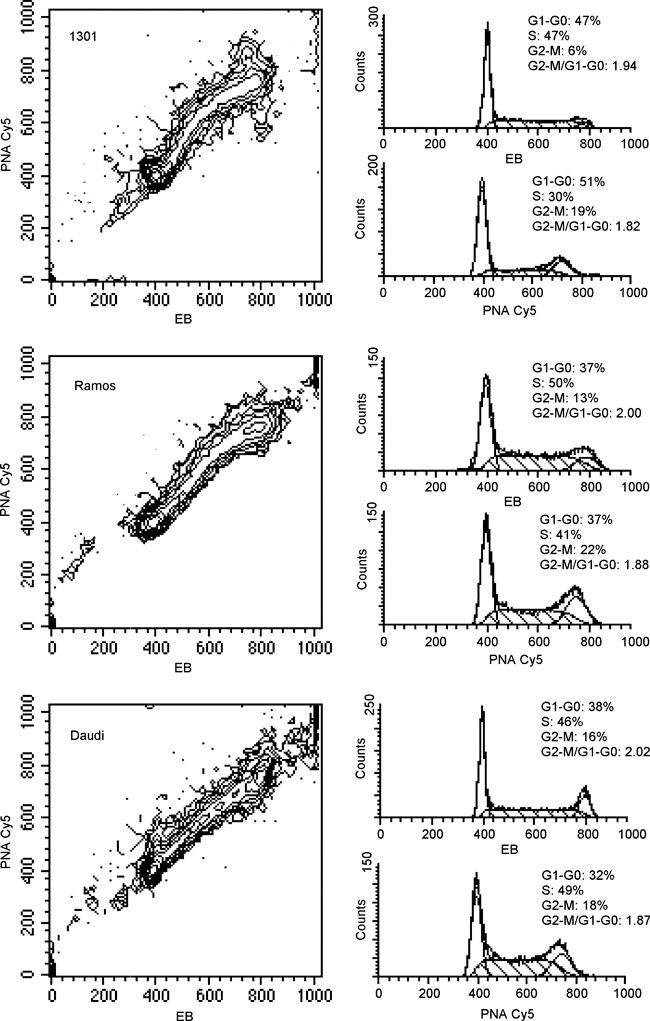
Hybridization specificity. Contour graphs (EB versus PNA‐Cy5) and corresponding to deconvoluted histograms of 1301, Ramos and Daudi cell lines acquired focusing events in comparable graph regions to have same data resolution. For each cell line, cell cycle phase percentages and G2 + M/G1 + G0 ratios are reported. Differences between S and G2 + M percentages, calculated on PNA‐Cy5 and EB frequency distributions, increase from Daudi to 1301 cells proportionally with telomere length.
Our results of divergences between EB and Cy5 frequency distributions were in agreement with reported different duplication kinetics of total and telomeric DNA (4, 15). Note that resolution of bivariate histograms achieved with our protocol could allow for accurate kinetic studies of telomere extension and duplication in proliferating cells.
Proportionality
Proportionality between PNA probe fluorescence emission and telomere length was evaluated by two different approaches.
First, assuming that within each cell line G2 + M cells contain double quantity of telomeric DNA over G1 + G0 cells, proportionality was assessed by the ratio of Cy5 MFI between G2 + M and G1 + G0 events, gated on stoichiometrically stained DNA histograms (Fig. 4). In repeated experiments, we obtained Cy5 MFI ratios of 1.85 ± 0.03 for the three cell lines; these values are significantly lower than the MFI ratios between G2 + M and G1 + G0 cells calculated from frequency distributions of EB fluorescence (2 ± 0.05, Fig. 4). As already reported (4), this might be due to evidence that telomere duplication is considerably faster than for other, genomic, DNA and so the G1 + G0 gate, drawn on EB histogram, could include some cells, which had started to replicate their telomeres. Other possible explanations could be less efficient hybridization of telomeric probe in G2 + M cells, and perhaps more likely, invariance of telomere length in cycling cells being a feature of the whole population and not of each cell in each cell cycle.
The second approach to evaluation of proportionality of probe binding was measurement of relative telomere length (RTL) in samples containing the three cell lines premixed, treated according to our protocol and acquired using a suitable instrument setting to gate G1 + G0 events. Figure 5b shows representative EB and Cy5 fluorescences of 1301, Ramos and Daudi cell lines, gated at FSC‐H versus SSC‐H bivariate histogram to exclude debris (Fig. 5a). RTLs were obtained by calculating Cy5 MFI ratios between G1 + G0 events, subtracted from the corresponding negative control MFI and normalized for DNA content of Ramos/1301 and Daudi/1301 cells. In repeated experiments, assigning to 1301 cells a telomere length of 25 kb (4), we measured RTL of Ramos cells as 15.75–18.25 kb (68 ± 5% of 1301) and of Daudi cells RTL as 11–12.5 kb (47 ± 3% of 1301). Notwithstanding our results being overally consistent with telomere sizes reported for these cell lines, it is important to note that these published measurements can hardly be considered as gold standards, as they have been obtained using different methods (16, 17, 18) that can be affected in different ways by the complexity of telomere organization (19).
Figure 5.
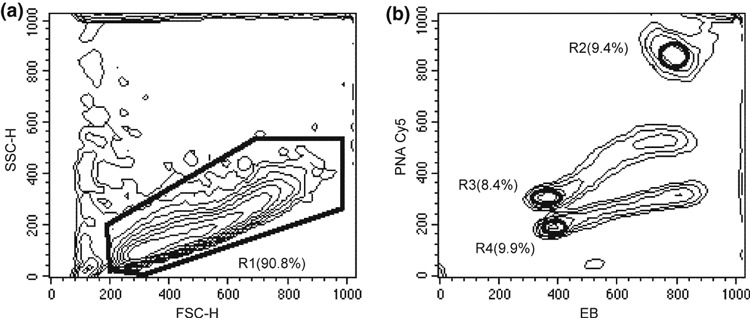
Hybridization proportionality. FSC‐H versus SSC‐H (a) and EB versus PNA‐Cy5 (b) contour graphs of 1301, Ramos and Daudi mixed cell lines. R1 gated EB and Cy5 fluorescences were acquired focusing events to gate G1 + G0 cells of 1301 (R2), Ramos (R3) and Daudi (R4) for measuring EB and Cy5 MFIs and calculating RTLs. In brackets, subset percentages are reported.
T and B lymphocytes
To evaluate resolution, reproducibility and cell recovery of our procedure, we treated samples of T and B peripheral blood human lymphocytes; these are extremely fragile and have only small differences in telomere lengths (20, 21). Figure 6 shows representative contour graphs obtained from T and B lymphocytes from a normal donor premixed with Ramos cells, as internal standard, and illustrates the approach used by us to calculate RTLs of human T and B lymphocytes. Assigning to G1 + G0 Ramos cells mean telomere length of 17 kb, after subtraction from corresponding negative control MFI and normalization for DNA content, we obtained mean values of 10.08 ± 0.57 kb for T cells and of 10.7 ± 0.45 kb for B cells of healthy donors.
Figure 6.
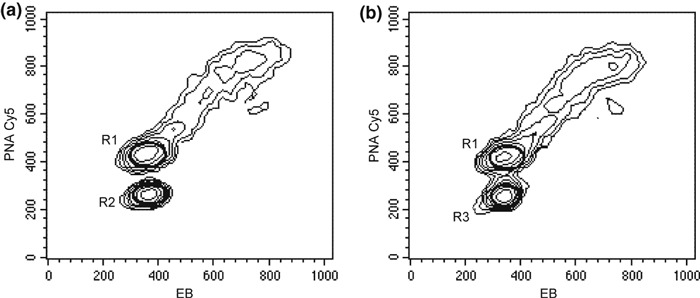
Lymphocyte hybridization. EB versus PNA‐Cy5 contour graphs of T lymphocytes mixed with Ramos cells (a) and B lymphocytes mixed with Ramos cells (b). Samples were acquired with the same instrument setting for all parameters. EB and Cy5 MFIs were measured gating G1 + G0 Ramos cells (R1) and T (R2) and B (R3) lymphocytes and RTLs were calculated as described in the text.
Please note that our approach achieves resolution of <0.5 kb and that lymphocyte telomere lengths measured by us are consistent with the ‘gold standard’ data reported by De Lange (22). Moreover, our measurements are in agreement with the notion of progressive telomere shortening as a function of donor age (23); we observed (Fig. 7) an age‐related reduction in telomere length in T and B cells from normal individuals aged 6–84 years. In addition, we were able to confirm pathological telomere shortening in T cells from patients with ataxia‐telangiectasia (Fig. 7), a genetic disorder characterized by chromosomal instability, hypersensitivity to ionizing radiation, neurological defects, immune deficiency and premature ageing (24).
Figure 7.
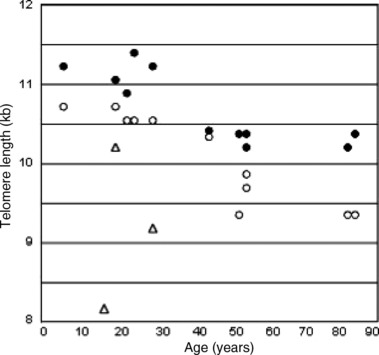
Telomeres in ageing and in disease. Telomere length (kb) in human lymphocytes was calculated by assuming a 17 kb mean telomere length in G1 + G0 Ramos cells. Closed circles, B cells from healthy subjects; open circles, T cells from healthy subjects; open triangles, T cells from three ataxia‐telangiectasia patients.
Reproducibility of Ramos G1 + G0 cells’ MFIs in the experimental sessions was 368 ± 21 for EB and 415 ± 17 for Cy5. Furthermore, our protocol allowed cell recovery of >80% for the cell lines and of >50% for lymphocytes. When compared to our procedure, original flow FISH treatment applied to human lymphocytes provided insufficient staining efficiency and consequently too little resolution between Ramos and lymphocyte telomere lengths (Fig. 2e,f). Moreover, lymphocyte recovery obtained with original flow FISH was very scarce (<20%) and the results could be invalidated by any systematic bias.
Discussion
Few molecules have been as intensely studied as DNA and adventure companions: DNA, RNA and PNA probes able to hybridize with specific sequences. Full knowledge of ‘in vitro’ behaviour of all these molecules (DNA and probes) has led researchers to underestimate importance of spatial dimensions in which the molecules react. We hypothesize that when genomic DNA is denatured within the nuclear microvolume, telomeric sequences at least cannot properly renaturate and remain accessible to specific probes. This finding allows us to change the problematic telomere hybridization on suspensions of whole cells in a simple, reproducibly and with a high resolving power procedure resembling antigen – antibody reactions.
Notwithstanding that the first ever paper reporting probe hybridization on suspensions of intact cells was published in 1988 (25), why are subsequent publications exploiting this approach so few? Before 1998, this was most likely due to limited manageability of RNA or DNA probes used for hybridization. From 1998 onwards (3, 4), more stable PNA probes were adopted, but authors used these probes with procedures similar to those previously used, as they did not take into account that genomic DNA organization (complexity and repeated sequences) prevents its proper renaturation, when it denatures in preserved cell nuclei. So it seems that all potential advantages deriving from application of a highly specific (26), stable, soluble but short probe are of no use, as in earlier studies, hybridization was conducted in formamide solutions.
Conversely, we have demonstrated that it is possible to hybridize PNA probes at RT after complete removal of ionic solvent, achieving first of all a significant increase in staining efficiency (at least one order of magnitude) of telomeric sequences. This gives rise to improvement in specificity, proportionality and resolution of the technique. Better conservative capability of our treatment allows increase in reproducibility and recovery of the assay, above all when analysis is performed on fragile cells such as lymphocytes. Moreover, our procedure, not requiring heating of formamide solution containing the probe, permits for use of oligo‐PNA conjugated with thermolabile fluorochromes.
Our protocol is much more user friendly as cell treatment requires few and simple solutions, and flow cytometric analysis does not need specific setting or fluorescence compensations. Furthermore, our method is also practicable for PNA probes specific to other DNA sequences and will be able to preserve further cell parameters (for example, surface and internal phenotypes), it could thus provide the technological basis for actual multiparametric flow cytogenomic.
References
- 1. Blackburn EH (2000) Telomere states and cell fates. Nature 408, 53–56. [DOI] [PubMed] [Google Scholar]
- 2. Moyzis RK, Buckingam JM, Cram LS, Dani M, Deaven LL, Jones MD et al. (1988) A highly conserved repetitive DNA sequence, (TTAGGG)n, present at the telomeres of human chromosomes. Proc. Natl. Acad. Sci. USA 85, 6622–6626. [DOI] [PMC free article] [PubMed] [Google Scholar]
- 3. Rufer N, Dragowska W, Thornbury G, Roosnek E, Lansdorp PM (1998) Telomere length dynamics in human lymphocyte subpopulations measured by flow cytometry. Nat. Biotechnol. 16, 743–747. [DOI] [PubMed] [Google Scholar]
- 4. Hultdin M et al. (1998) Telomere analysis by fluorescence in situ hybridization and flow cytometry. Nucleic Acids Res. 26, 3651–3656. [DOI] [PMC free article] [PubMed] [Google Scholar]
- 5. Plunkett FJ et al. (2001) The flow cytometric analysis of telomere length in antigen‐specific CD8+ T cells during acute Epstein‐Barr virus infection. Blood 97, 700–707. [DOI] [PubMed] [Google Scholar]
- 6. Batliwalla FM, Damle RN, Metz C, Chiorazzi N, Gregersen PK (2001) Simultaneous flow cytometric analysis of cell surface markers and telomere length: analysis of human tonsilar B cells. J. Immunol. Methods 247, 103–109. [DOI] [PubMed] [Google Scholar]
- 7. Schmid I et al. (2002) Simultaneous flow cytometric analysis of two cell surface markers, telomere length, and DNA content. Cytometry 49, 96–105. [DOI] [PubMed] [Google Scholar]
- 8. Cabuy E, Newton C, Roberts T, Newbold R, Slijepcevic P (2004) Identification of subpopulations of cells with differing telomere lengths in mouse and human cell lines by flow FISH. Cytometry A 62, 150–161. [DOI] [PubMed] [Google Scholar]
- 9. Potter AJ, Wener MH (2005) Flow cytometric analysis of fluorescence in situ hybridization with dye dilution and DNA staining (flow‐FISH‐DDD) to determine telomere length dynamics in proliferating cells. Cytometry A 68, 53–58. [DOI] [PubMed] [Google Scholar]
- 10. Baerlocher GM, Vulto I, De Jong G, Lansdorp PM (2006) Flow cytometry and FISH to measure the average length of telomeres (flow FISH). Nat. Protoc. 1, 2365–2376. [DOI] [PubMed] [Google Scholar]
- 11. Lauzon W, Dardon JS, Cameron DW, Badley AD (2000) Flow cytometric measurement of telomere length. Cytometry 42, 159–164. [DOI] [PubMed] [Google Scholar]
- 12. Faulkner GJ et al. (2009) The regulated retrotransposon transcriptome of mammalian cells. Nat. Genet. 41, 563–571. [DOI] [PubMed] [Google Scholar]
- 13. Mochida A et al. (2005) Telomere size and telomerase activity in Epstein‐Barr virus (EBV)‐positive and EBV‐negative Burkitt’s lymphoma cell lines. Arch. Virol. 150, 2139–2150. [DOI] [PubMed] [Google Scholar]
- 14. Jeyapalan JC, Saretzki G, Leake A, Tilby MJ, Von Zglinicki T (2006) Tumor‐cell apoptosis after cisplatin treatment is not telomere dependent. Int. J. Cancer 118, 2727–2734. [DOI] [PubMed] [Google Scholar]
- 15. Verdun RE, Karlseder J (2006) The DNA damage machinery and homologous recombination pathway act consecutively to protect human telomeres. Cell 127, 709–720. [DOI] [PubMed] [Google Scholar]
- 16. Baerlocher GM, Mak J, Tien T, Lansdorp PM (2002) Telomere length measurement by fluorescence in situ hybridization and flow cytometry: tips and pitfalls. Cytometry 47, 89–99. [DOI] [PubMed] [Google Scholar]
- 17. Counter CM et al. (1992) Telomere shortening associated with chromosome instability is arrested in immortal cells which express telomerase activity. EMBO J. 11, 1921–1929. [DOI] [PMC free article] [PubMed] [Google Scholar]
- 18. Jiang L et al. (2004) Telomere lengths in cloned transgenic pigs. Biol. Reprod. 70, 1589–1593. [DOI] [PubMed] [Google Scholar]
- 19. Mefford HC, Trask BJ (2002) The complex structure and dynamic evolution of human subtelomeres. Nat. Rev. Genet. 3, 91–102. [DOI] [PubMed] [Google Scholar]
- 20. Weng N, Levine BL, June CH, Hodes RJ (1995) Human naive and memory T lymphocytes differ in telomeric length and replicative potential. Proc. Natl. Acad. Sci. USA 92, 11091–11094. [DOI] [PMC free article] [PubMed] [Google Scholar]
- 21. Weng N, Granger L, Hodes RJ (1997) Telomere lengthening and telomerase activation during human B cell differentiation. Proc. Natl. Acad. Sci. USA 94, 10827–10832. [DOI] [PMC free article] [PubMed] [Google Scholar]
- 22. De Lange T et al. (1990) Structure and variability of human chromosome ends. Mol. Cell. Biol. 10, 518–527. [DOI] [PMC free article] [PubMed] [Google Scholar]
- 23. Weng N (2008) Telomere and adaptive immunity. Mech. Ageing Dev. 129, 60–66. [DOI] [PMC free article] [PubMed] [Google Scholar]
- 24. Metcalfe JA et al. (1996) Accelerated telomere shortening in ataxia telangiectasia. Nat. Genet. 13, 350–353. [DOI] [PubMed] [Google Scholar]
- 25. Bauman JGJ, Bentvelzen P (1988) Flow cytometric detection of ribosomal RNA in suspended cells by fluorescent in situ hybridization. Cytometry 9, 517–524. [DOI] [PubMed] [Google Scholar]
- 26. Martens UM et al. (1998) Short telomeres on human chromosome 17p. Nat. Genet. 18, 76–80. [DOI] [PubMed] [Google Scholar]


