

Abstract
Background
T‐wave heterogeneity (TWH) independently predicted cardiovascular mortality in Health Survey 2000 based on 12‐lead ECGs recorded at rest. We investigated whether TWH is elevated during exercise tolerance testing (ETT) in symptomatic diabetic patients with nonflow‐limiting coronary artery stenosis compared to control subjects without diabetes.
Methods
Cases were all patients (n = 20) with analyzable ECG recordings during both rest and ETT who were enrolled in the Effects of Ranolazine on Coronary Flow Reserve (CFR) in Symptomatic Patients with Diabetes and Suspected or Known Coronary Artery Disease (RAND‐CFR) study (NCT01754259); median CFR was 1.44; 80% of cases had CFR <2. Control subjects (n = 9) were nondiabetic patients who had functional flow reserve (FFR) >0.8, a range not associated with inducible ischemia. TWH was analyzed from precordial leads V4, V5, and V6 by second central moment analysis, which assesses the interlead splay of T‐waves about a mean waveform.
Results
During exercise to similar rate‐pressure products (p = .31), RAND‐CFR patients exhibited a 49% increase in TWH during exercise (rest: 49 ± 5 μV; exercise: 73 ± 8 μV, p = .003). By comparison, in control subjects, TWH was not significantly altered (rest: 52 ± 11 μV; ETT: 38 ± 5 μV, p = .19). ETT‐induced ST‐segment depression >1 mm (p = .11) and Tpeak‐Tend (p = .18) and QTc intervals (p = .80) failed to differentiate cases from controls.
Conclusions
TWH is capable of detecting latent repolarization abnormalities, which are present during ETT in diabetic patients with nonflow‐limiting stenosis but not in control subjects. The technique developed in this study permits TWH analysis from archived ECGs and thereby enables mining of extensive databases for retrospective studies and hypothesis testing.
Keywords: coronary artery disease, coronary flow reserve, diabetes, functional flow reserve, heterogeneity
1. INTRODUCTION
There is mounting evidence that symptomatic diabetic patients are at elevated risk for cardiovascular mortality prior to angiographically demonstrable progression to obstructive coronary artery disease (CAD) (Eranti et al., 2016; Yeung et al., 2012). Several factors appear to be responsible, including the presence of diffuse coronary atherosclerosis and microvascular and diastolic dysfunction (Paulus & Tschope, 2013). An important exacerbating factor is the coexistence of diabetic autonomic neuropathy, which impacts on the vasodilatory response of coronary resistance vessels due to increased sympathetic tone (Di Carli et al., 1999) and cardiac arrhythmias (Eranti et al., 2016).
Recent trials of patients with type 2 diabetes have demonstrated that drugs that decrease hemoglobin A1c to similar levels can differ in their impact on cardiovascular risk (Green et al., 2015; Marso, Bain, et al., 2016Marso, Daniels, et al., 2016;Scirica et al., 2013; Zinman et al., 2015). This finding provides evidence that cardiovascular risk control, not only glycemic control, is important in the medical management of patients with diabetes.
To date, no reliable ECG risk markers have been implemented in diabetic patients with nonflow‐limiting coronary artery stenosis. In the present investigation, we employed a direct measure of spatial and temporal repolarization heterogeneity using the newly developed method of second central moment analysis of the splay of precordial T waves about the calculated mean waveform. This index, referred to as T‐wave heterogeneity (TWH), has been extensively studied experimentally in intact animal models of acute myocardial ischemia and reperfusion and found to be a harbinger of malignant cardiac arrhythmias (Bonatti et al., 2014; Justo et al., 2016; Nearing & Verrier, 2003; Verrier & Huikuri, 2017; Verrier et al., 2013). In a large population survey, TWH was found to predict cardiovascular mortality (Kenttä et al., 2016).
The main hypothesis was that TWH would be capable of detecting nonuniformities of repolarization in symptomatic diabetic patients, particularly in the setting of exercise tolerance testing (ETT), when demand/supply relationships are challenged and sympathetic activity is enhanced. The utility of TWH in evaluating latent risk in this cohort was compared to contemporary markers of repolarization dispersion including Tpeak‐Tend and the QTc interval (Panikkath et al., 2011) as well as ST‐segment. We examined the prerandomization phase of the well‐characterized Effects of Ranolazine on Coronary Flow Reserve in Symptomatic Patients with Diabetes and Suspected or Known Coronary Artery Disease (RAND‐CFR) cohort (Shah et al., 2017). ETT‐induced changes in TWH were compared in nondiabetic control subjects with ≤50% coronary artery stenosis with fractional flow reserve (FFR) >0.8, a range not associated with inducible ischemia.
2. METHODS
Medical records from patients enrolled in RAND‐CFR study at Brigham & Women's Hospital (Boston, MA) were analyzed. The study and medical records review were approved by the Partners Healthcare Institutional Review Board. Nondiabetic patients who performed a treadmill ETT followed by coronary angiography that confirmed ≤50% coronary artery stenosis from 2010 to 2016 at the Beth Israel Deaconess Medical Center (Boston, MA) constituted the control arm. The medical records analysis was performed under a protocol approved by the Beth Israel Deaconess Medical Center's Institutional Review Board.
The cases consisted of all 20 subjects enrolled in the RAND‐CFR clinical trial whose ECGs during the no‐drug phase at both rest and exercise could be analyzed. Eligible patients had diabetes, stable angina and/or exertional dyspnea during supine bicycle stress testing with exercise tolerance of ≥3 metabolic equivalents, and perfusion sum stress score <4 assessed by initial positron emission tomography (PET). Patients were excluded if they had obstructive CAD (≥50% stenosis on invasive coronary angiography within the past year or on study protocol‐mandated screening coronary CT angiography), Seattle Angina Questionnaire score <100 and/or Rose Dyspnea Scale = 0, history of cardiomyopathy, moderate or severe valvular heart disease, uncontrolled hypertension, kidney disease, or a contraindication for ranolazine.
The control group consisted of all nine nondiabetic subjects screened from medical records who had completed a symptom‐limited treadmill ETT for suspected CAD over the past 5 years and in whom ≤50% coronary artery stenosis was subsequently confirmed by coronary angiography within 6 months after the ETT. Patients were excluded from the control group if they had any flow‐limiting lesions (FFR <0.80), >50% stenosis of 2 or 3 vessels, >70% stenosis of any coronary artery or >50% of the left main coronary artery, moderate‐to‐severe valvular disease, chronic kidney disease, history of myocardial infarction, or cardiomyopathy.
Cases performed a symptom‐limited supine bicycle stress test on a standard ramp protocol. Recordings of 12‐lead ECGs (25 mm/s, 10 mV/mm) were printed for 12 s during rest, peak exercise, immediately postexercise, and at 1 min of recovery. Blood pressure and heart rate were measured at each stage.
Patients from the control group performed a symptom‐limited treadmill ETT on a standard Bruce protocol with 3‐min interval recordings of 12‐lead ECGs, blood pressure, and heart rate. To exclude recordings with a high degree of motion artifact, stress ECGs (50 mm/s, 20 mV/mm) were analyzed for 6 s during the first 10 s of recovery while the subjects’ heart rates remained high.
Standard 12‐lead analog ECGs for all cases (25 mm/s, 10 mV/mm) and controls (50 mm/s, 20 mV/mm) were scanned with a high‐resolution scanner. Patients without a complete set of V4, V5, or V6 ECG leads, which are essential for TWH calculation, or whose tracings had significant noise artifact or baseline wander were excluded. Image processing software, “ECGScan” (AMPS‐LLC, New York, NY), was then used to extrapolate the ECG waveforms using an active contour modeling technique (Badilini, Erdem, Zareba, & Moss, 2005). The resulting digital waveforms were converted into .txt files that could be imported into spreadsheets for subsequent analysis (Figure 1).
Figure 1.
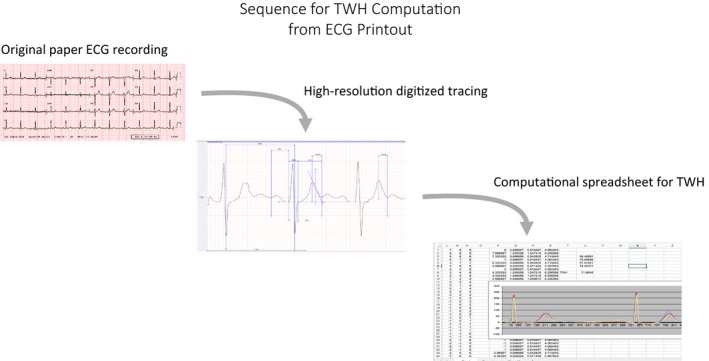
Procedure for T‐wave heterogeneity (TWH) calculation. See Methods section for details
Digital ECG files were imported into spreadsheets and leads V4, V5, and V6 were plotted and superimposed. Second central moment analysis (Nearing & Verrier, 2003, 2015), was performed on the JT interval to calculate TWH for every beat. The maximum splay in microvolts about the mean waveform from the J‐point to end of the T wave (JT interval) during rest and exercise was reported for each patient. Since TWH is measured over the entire JT waveform, it does not depend on the specific T‐wave endpoint as do time‐dependent indices of dispersion of repolarization such as Tpeak‐Tend or QTc intervals.
Following the methodology used in the Oregon Sudden Unexpected Death Study (Panikkath et al., 2011), Tpeak‐Tend and QT intervals were measured primarily on lead V5. If the amplitude of the T waves was <1.5 mm, lead V5 was excluded from the analysis, and measurements were performed on lead V4. If lead V4 was also not suitable, lead V6 was used instead. Tpeak‐Tend and QT intervals were measured for three consecutive beats and the mean was taken as the final value. Both Tpeak‐Tend and QT intervals were corrected for heart rate using Bazett's formula and are reported as Tpeak‐Tendc and QTc intervals.
For both the patients and the control group, ST‐segment measurements were taken directly from the physicians’ final clinical report of the ETT. An ETT was considered positive in patients with ST segment depression of ≥1 mm horizontal or downsloping configuration in two contiguous leads and three consecutive beats at 80 ms after the J‐point (Fihn et al., 2012).
In RAND‐CFR patients, coronary flow was measured using a PET‐CT scanner (Discovery RX or STE LightSpeed 64, GE Healthcare, Milwaukee, WI) in response to exercise using 13N‐ammonia as flow tracer. CFR was calculated as the ratio of left ventricular myocardial blood flow (ml/g/min) during stress compared to rest. To account for disparities in resting cardiac workload, we corrected the CFR value at rest by the rate‐pressure product, where a CFR <2.0 is considered to be hemodynamically significant (Kern et al., 2006). FFR was measured in control patients during cardiac catheterization using pressure wire assessment of identified narrowed segments in coronary arteries, using FFR >0.80 to determine absence of inducible ischemia (Kern et al., 2006).
Statistical analyses were performed using Excel. Data are reported as means ± standard error of the mean (SEM). All continuous variables were normally distributed according to Shapiro‐Wilk normality test. Statistical differences between cases and controls were calculated using 2‐tailed unpaired Student's t‐tests. TWH was evaluated during rest and exercise for every patient, and the results within each group were compared using paired Student's t‐tests. Bonferroni correction was performed for multiple comparisons within or between groups. Categorical variables were analyzed using Fisher's exact test. Two‐tailed p‐values <.05 were considered significant.
3. RESULTS
Subjects from the RAND‐CFR study all had diabetes (p < .001) and were older (p = .03) than the control group. Although the RAND‐CFR patients had a higher prevalence of hypertension (p = .03) than the control subjects, treatment achieved systolic and diastolic blood pressures within guidelines. Hyperlipidemia was present in 95% of cases with corresponding statin therapy (Table 1). Although resting heart rates were higher (p = .02) in the RAND‐CFR group, rate pressure products at rest (p = .39) and during ETT (p = .30) were similar to controls. The incidence of ETT‐based ST‐segment depression did not differ (p = .11) between the groups.
Table 1.
Patient characteristics
| Controls (n = 9) | Cases (n = 20) | p | |
|---|---|---|---|
| Age (years) | 57 ± 3 | 64 ± 1 | .03a |
| Sex (M/F) | 4/5 | 9/11 | 1.0 |
| BMI | 31 ± 2 | 34 ± 2 | .22 |
| Cardiovascular risk factors | |||
| Diabetes (n, %) | 0 | 20 (100%) | <.001a |
| Hypertension (n, %) | 3 (33%) | 16 (80%) | .03a |
| Smoking (n, %) | 4 (44%) | 11 (55%) | .70 |
| Hyperlipidemia (n, %) | 5 (56%) | 19 (95%) | .02a |
| Drug therapy | |||
| Beta‐blockers (n, %) | 4 (44%) | 13 (65%) | .42 |
| Calcium antagonists (n, %) | 0 | 5 (25%) | .15 |
| ACEI and/or ARB (n, %) | 1 (9%) | 16 (80%) | <.01a |
| Statins (n, %) | 4 (44%) | 19 (95%) | <.01a |
| Antiaggregants (n, %) | 5 (56%) | 15 (75%) | .40 |
| Nitrates (n, %) | 4 (44%) | 4 (20%) | .21 |
| Hemodynamics at rest | |||
| SBP (mm Hg) | 140 ± 7 | 127 ± 3 | <.05a |
| DBP (mm Hg) | 84 ± 3 | 64 ± 2 | <.001a |
| HR (beats/min) | 60 ± 3 | 72 ± 3 | .02a |
| RPP (beats/min × mm Hg) | 8,440 ± 621 | 9,155 ± 467 | .39 |
| Peak exercise | |||
| SBP (mm Hg) | 178 ± 8 | 175 ± 4 | .62 |
| DBP (mm Hg) | 84 ± 3 | 79 ± 3 | .92 |
| HR (beats/min) | 138 ± 6 | 128 ± 4 | .17 |
| RPP (beats/min × mm Hg) | 24,545 ± 1,387 | 22,784 ± 938 | .30 |
| ETT‐induced ST‐segment depression ≥1 mm | |||
| Positive | 5 | 4 | .11 |
| Negative | 4 | 14 | |
BMI, body mass index; ACEI, angiotensin‐converting enzyme inhibitors; ARB, angiotensin‐II receptor blockers. SBP, systolic blood pressure; DBP, diastolic blood pressure; HR, heart rate; RPP, rate pressure product; ETT, exercise tolerance test.
p < .05.
Corrected CFR values in the RAND‐CFR group ranged from 0.94 to 2.57 (median = 1.44), and 80% of the patients had CFR <2. The mean stenosis in the control group was 41 ± 6% and 100% of the subjects had FFR ≥0.80 (0.93 ± 0.02).
Representative digitized ECG tracings for a control subject and a RAND‐CFR patient are provided in Figure 2. At rest, TWH did not differ between RAND‐CFR patients and the control group (controls: 52 ± 11 μV; cases: 49 ± 5 μV; p = .80) (Figure 3). With exercise, TWH increased by 49% to 73 ± 8 μV (p = .003) in RAND‐CFR patients, while control subjects showed no change in TWH (to 38 ± 5 μV, p = .19) (Figures 3 and 4). More than 85% of RAND‐CFR patients registered exercise TWH values above the median of controls (32 μV) and 70% were above the 3rd quartile of controls (49 μV) (Figure 5). Exercise TWH values among RAND‐CFR patients compared to control subjects were found not to be affected by use of ACEI or ARB (p = .46) or by diastolic blood pressure (linear regression analysis, p = .25). TWH values at rest were not different before randomization and after placebo (no drug: 49 ± 5 μV, placebo: 46 ± 5 μV; p = .15), confirming reproducibility of the measurement. No statistically significant correlation between CFR and TWH was found during rest or exercise.
Figure 2.
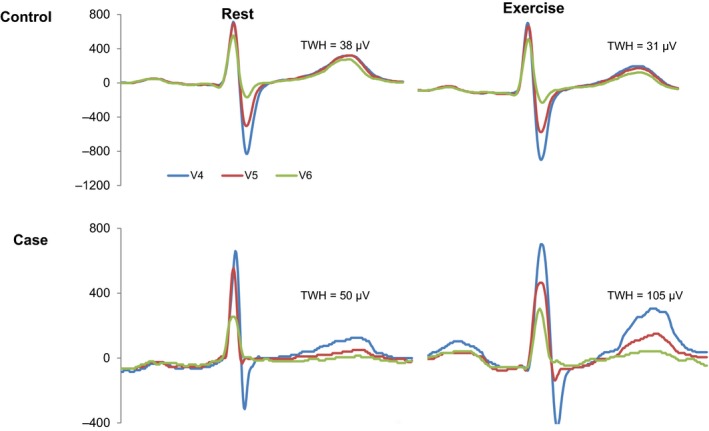
Digitized ECG tracings illustrate T‐wave heterogeneity (TWH) as interlead splay in repolarization morphology during rest and exercise in a representative control subject (upper panels) and a representative case (lower panels)
Figure 3.
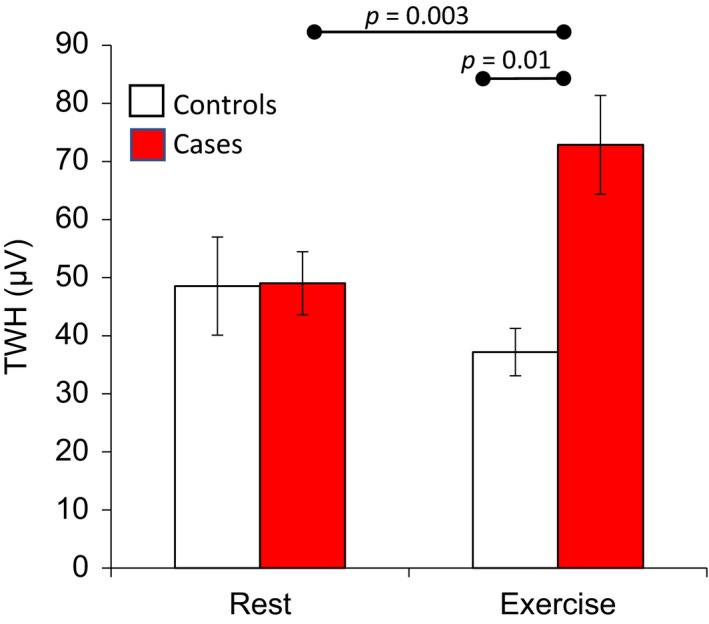
Absence of change in T‐wave heterogeneity (TWH) from rest to exercise in control subjects (open bars, n = 9, p = .19) compared to the significant, 49% increase in TWH in cases (filled bars, n = 20, p = .003)
Figure 4.
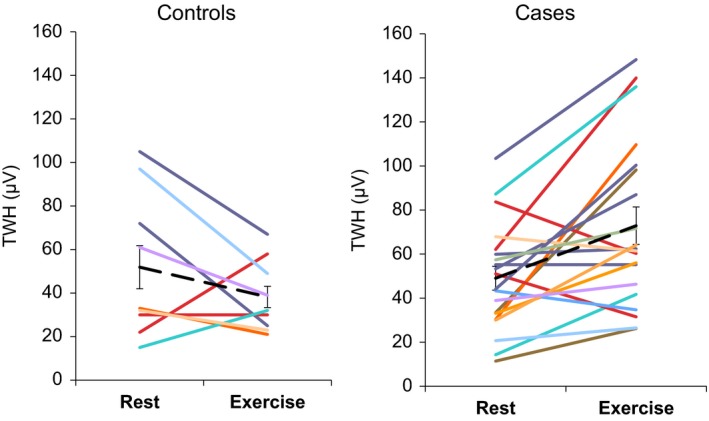
Change in T‐wave heterogeneity (TWH) from rest to exercise. Left panel: Data from nine control subjects. Right panel: Data from 20 cases. Dashed lines indicate group means
Figure 5.
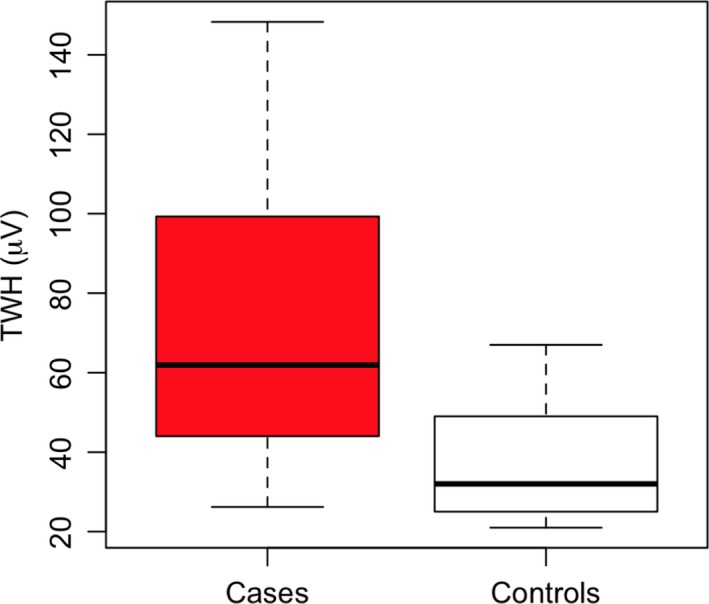
Box plot comparison by quartiles of range of T‐wave heterogeneity (TWH) levels in cases (n = 20, left) and in control subjects (n = 9, right) during exercise
Tpeak‐Tend values at rest did not differ between controls and the RAND‐CFR group (controls: 80.7 ± 6.2 ms; cases: 65.6 ± 1.6 ms; p = .06). Tpeak‐Tend did not change with exercise in either group (controls: 82.9 ± 16.8 ms, p = .7; cases: 70.3 ± 2.6 ms, p = .18) and the final exercise Tpeak‐Tend was not different between the two groups (p = .16). When corrected for heart rate, Tpeak‐Tendc was found to increase from rest to exercise in the RAND‐CFR group but not in the control group (control: from 80 ± 7 to 99 ± 15 ms, p = .07; cases: from 75.9 ± 3 to 89 ± 2.5 ms, p = .008). Tpeak‐Tendc did not differ between the two groups at either rest or exercise (p = .6 and p = .4 respectively).
QTc intervals did not differ between the two groups at rest (controls: 403 ± 15 ms; cases: 421 ± 9 ms; p = .28) and did not increase with exercise in the RAND‐CFR group (to 438.3 ± 6.3 ms, p = .24) or in the control group (to 440 ± 2 ms, p = .06). During exercise, QTc intervals also failed to discriminate cases from the control subjects (p = .80).
Of the 20 cases in the RAND‐CFR group, two did not have analyzable ST‐segments due to left bundle branch block and were therefore excluded from this subanalysis. Exercise‐induced ST‐segment depression ≥1 mm occurred in only four (22%) cases but in five (56%) controls. This finding suggests a high rate of false positive results in the controls, as FFR in all controls including these five individuals, four of whom were women, was >0.80.
4. DISCUSSION
The present study is the first to demonstrate a marked increase in exercise‐induced TWH in symptomatic diabetic patients with nonflow‐limiting coronary artery stenosis with diffuse atherosclerosis and/or microvascular dysfunction who were enrolled in the well‐characterized RAND‐CFR study (Shah et al., 2017). The increase in TWH was substantial (49%) from rest to ETT (49 ± 5 to 73 ± 8 μV, p = .003). The level achieved approaches the 80‐μV cutpoint associated with elevated risk for ventricular tachyarrhythmias and arrhythmic death (Tan et al., 2017). By comparison, nondiabetic control subjects with comparable degrees of nonflow‐limiting coronary artery stenosis but with FFR >0.8 exhibited no significant ETT‐induced change in TWH (rest: 49 ± 8 μV; ETT: 37 ± 4 μV, p = .18) at an equivalent rate‐pressure product. Contemporary indices of repolarization heterogeneity including Tpeak‐Tend and QTc failed to differentiate between cases and controls. The fact that most patients had abnormal CFR (with CFR <2 in 80%) as established by PET scanning while all control subjects had angiographically confirmed FFR >0.80, suggests a potential role of impaired supply‐demand mismatch (Kern et al., 2006) in the electrophysiologic basis for TWH.
Selection of the main ECG marker employed in the present study, TWH, was guided by results in preclinical studies of acute myocardial ischemia with and without concurrent adrenergic stimulation in large animal models (Bonatti et al., 2014; Justo et al., 2016; Nearing & Verrier, 2003; Verrier et al., 2013). Elevated levels of TWH were found to herald the onset of ventricular tachycardia and fibrillation. These findings are consistent with the observations that myocardial ischemia results in marked dispersion of action potential duration (Dilly & Lab, 1987) and nonuniformities of recovery of excitability (Han & Moe, 1964), changes highly conductive to malignant cardiac arrhythmias. Recently, the utility of TWH has been tested clinically and has been shown capable of detecting arrhythmia risk in diverse conditions including decompensated heart failure (Nearing et al., 2012), ischemic and nonischemic cardiomyopathies (Tan et al., 2017), and in a population survey (Kenttä et al., 2016). It is germane that in both the experimental and clinical settings, TWH provides early signs of myocardial electrophysiologic dysfunction preceding the development of TWA and arrhythmias (Nearing & Verrier, 2003, 2015; Nearing et al., 2012; Verrier & Huikuri, 2017).
The precise factors that may have contributed to the increase in TWH during exercise in the present cohort of symptomatic patients with diabetes are likely multifold, given the complexity of this disease condition. Among the most prominent are the presence of coronary microvascular dysfunction, diffuse atherosclerosis, changes in myocardial structure including myofibrillar disarray induced by recurrent ischemic episodes, and altered autonomic function (Di Carli et al., 1999; Eranti et al., 2016). That structural abnormalities are present in diabetic patients is supported by findings that QT dispersion, an indicator of heterogeneity of repolarization, is elevated during rest (Cardoso, Salles, Bloch, Deccache, & Siqueira‐Filho, 2001). Di Carli et al. (1999) and Carnethon, Golden, Folsom, Haskell, and Liao (2003) reported evidence of significant autonomic dysfunction in patients with diabetes, with predominance in sympathetic tone. Specifically, diabetes is associated with a decrease in high frequency (HF) heart rate variability (HRV) and increase in low/high (LF/HF) frequency HRV ratio. Elucidation of the relative contributions of each of these putative pathophysiologic mechanisms to exercise‐induced increases in TWH as observed in the present study will require systematic investigation.
In terms of ST‐segment changes during exercise, there was a relatively high incidence of false positives, as five (56%) controls had ST‐segment depression >1 mm, despite FFR >0.8, indicating the absence of inducible ischemia (Kern et al., 2006). Of the five control subjects with depressed ST segments, four were female, consistent with high rate of false‐positive results in women (Stoletniy & Pai, 1997). In these four female control subjects, TWH was unchanged during exercise, consistent with FFR in the normal range. This pattern of response is at variance among cases with impaired CFR, in whom there was a marked increase in TWH in response to exercise (Figures 3 and 4).
Other contemporary risk markers, including ST‐segment (Lakkireddy et al., 2005) and Tpeak‐Tend (Panikkath et al., 2011) and QT intervals did not change significantly in response to exercise either in the control or RAND‐CFR groups.
The main limitation of the current study is the relatively small size of the groups. However, the patients were carefully characterized by coronary angiography in the control subjects and by PET scan in cases. Two different ETT protocols were performed, namely, treadmill testing by control subjects and supine ergometry by the cases. However, the physiologic challenge during exercise was comparable given that the rate‐pressure products achieved did not differ (Table 1).
Thus, TWH disclosed latent repolarization abnormalities during ETT in symptomatic diabetic patients with diffuse atherosclerosis and/or microvascular dysfunction that are not present in nondiabetic control subjects during rest or exercise. The capacity of second central moment analysis to quantify TWH during ETT is an inherent advantage over other contemporary heterogeneity markers of sudden cardiac death risk, which are limited to use in patients in the resting state (Verrier & Huikuri, 2017). The new technique developed in the current study, which enables analysis of archived ECGs, permits mining of extensive databases for retrospective studies and hypothesis testing.
ACKNOWLEDGMENTS
We are grateful to Fabio Badilini, Ph.D., and his team for making available the image processing software, “ECGScan” (AMPS‐LLC, New York, NY), for use in this study. We thank Cliff Ashley, who provided technical support for accessing the ECG tracings of the control group.
Stocco FG, Evaristo E, Shah NR, et al. Marked exercise‐induced T‐wave heterogeneity in symptomatic diabetic patients with nonflow‐limiting coronary artery stenosis. Ann Noninvasive Electrocardiol. 2018;23:e12503 10.1111/anec.12503
This study was supported by a research grant from Gilead Sciences, Inc. (Foster City, CA, USA), to Beth Israel Deaconess Medical Center, RL Verrier, Principal Investigator. Drs. Nearing and Verrier are inventors of the method used to analyze T‐wave heterogeneity, with U.S. patent assigned to Beth Israel Deaconess Medical Center. None of the other authors has any conflicts of interest to disclose.
REFERENCES
- Badilini, F. , Erdem, T. , Zareba, W. , & Moss, A. J. (2005). ECGScan: A method for conversion of paper electrocardiographic printouts to digital electrocardiographic files. Journal of Electrocardiology, 38, 310–318. [DOI] [PubMed] [Google Scholar]
- Bonatti, R. , Garcia Silva, A. F. , Pereira Batatinha, J. A. , Sobrado, L. F. , Machado, A. D. , Varone, B. B. , … Verrier, R. L. (2014). Selective late sodium current blockade with GS‐458967 markedly reduces ischemia‐induced atrial and ventricular repolarization alternans and ECG heterogeneity. Heart Rhythm: the Official Journal of the Heart Rhythm Society, 11, 1827–1835. [DOI] [PubMed] [Google Scholar]
- Cardoso, C. , Salles, G. , Bloch, K. , Deccache, W. , & Siqueira‐Filho, A. G. (2001). Clinical determinants of increased QT dispersion in patients with diabetes mellitus. International Journal of Cardiology, 79, 253–262. [DOI] [PubMed] [Google Scholar]
- Carnethon, M. R. , Golden, S. H. , Folsom, A. R. , Haskell, W. , & Liao, D. (2003). Prospective investigation of autonomic nervous system function and the development of type 2 diabetes: The Atherosclerosis Risk in Communities study, 1987–1998. Circulation, 107, 2190–2195. [DOI] [PubMed] [Google Scholar]
- Di Carli, M. F. , Bianco‐Batlles, D. , Landa, M. E. , Kazmers, A. , Groehn, H. , Muzik, O. , & Grunberger, G. (1999). Effects of autonomic neuropathy on coronary blood flow in patients with diabetes mellitus. Circulation, 100, 813–819. [DOI] [PubMed] [Google Scholar]
- Dilly, S. G. , & Lab, M. J. (1987). Changes in monophasic action potential duration during the first hour of regional myocardial ischaemia in the anaesthetised pig. Cardiovascular Research, 21, 908–915. [DOI] [PubMed] [Google Scholar]
- Eranti, A. , Kerola, T. , Aro, A. L. , Tikkanen, J. T. , Rissanen, H. A. , Anttonen, O. , … Huikuri, H. V. (2016). Diabetes, glucose tolerance, and the risk of sudden cardiac death. BMC Cardiovascular Disorders, 16, 51. [DOI] [PMC free article] [PubMed] [Google Scholar]
- Fihn, S. D. , Gardin, J. M. , Abrams, J. , Berra, K. , Blankenship, J. C. , Dallas, A. P. , … Anderson, J. L. (2012). 2012 ACCF/AHA/ACP/AATS/PCNA/SCAI/ STS guideline for the diagnosis and management of patients with stable ischemic heart disease: A report of the American College of Cardiology Foundation/American Heart Association task force on practice guidelines, and the American College of Physicians, American Association for Thoracic Surgery, Preventive Cardiovascular Nurses Association, Society for Cardiovascular Angiography and Interventions, and Society of Thoracic Surgeons. Circulation, 126, e354–e471. [DOI] [PubMed] [Google Scholar]
- Green, J. B. , Bethel, M. A. , Armstrong, P. W. , Buse, J. B. , Engel, S. S. , Garg, J. , … Holman, R. R. (2015). Effect of sitagliptin on cardiovascular outcomes in type 2 diabetes. New England Journal of Medicine, 373, 232–242. [DOI] [PubMed] [Google Scholar]
- Han, J. , & Moe, G. K. (1964). Nonuniform recovery of excitability in ventricular muscle. Circulation Research, 14, 44–60. [DOI] [PubMed] [Google Scholar]
- Justo, F. , Fuller, H. , Nearing, B. D. , Rajamani, S. , Belardinelli, L. , & Verrier, R. L. (2016). Inhibition of the cardiac late sodium current with eleclazine protects against ischemia‐induced vulnerability to atrial fibrillation and reduces atrial and ventricular repolarization abnormalities in the absence and presence of concurrent adrenergic stimulation. Heart Rhythm: the Official Journal of the Heart Rhythm Society, 13, 1860–1867. [DOI] [PubMed] [Google Scholar]
- Kenttä, T. V. , Nearing, B. D. , Porthan, K. , Tikkanen, J. T. , Viitasalo, M. , Nieminen, M. S. , … Verrier, R. L. (2016). Prediction of sudden cardiac death with automated high throughput analysis of heterogeneity in standard resting 12‐lead electrocardiogram. Heart Rhythm: the Official Journal of the Heart Rhythm Society, 13, 713–720. [DOI] [PubMed] [Google Scholar]
- Kern, M. J. , Lerman, A. , Bech, J. W. , De Bruyne, B. , Eeckhout, E. , Fearon, W. F. , … Spaan, J. A. (2006). Physiological assessment of coronary artery disease in the cardiac catheterization laboratory: A scientific statement from the American Heart Association Committee on Diagnostic and Interventional Cardiac Catheterization, Council on Clinical Cardiology. Circulation, 114, 1321–1341. [DOI] [PubMed] [Google Scholar]
- Lakkireddy, D. R. , Bhakkad, J. , Korlakunta, H. L. , Ryschon, K. , Shen, X. , Mooss, A. N. , & Mohiuddin, S. M. (2005). Prognostic value of the Duke Treadmill Score in diabetic patients. American Heart Journal, 150, 516–521. [DOI] [PubMed] [Google Scholar]
- Marso, S. P. , Bain, S. C. , Consoli, A. , Eliaschewitz, F. G. , Jódar, E. , Leiter, L. A. , … SUSTAIN‐6 Investigators . (2016). Semaglutide and cardiovascular outcomes in patients with type 2 diabetes. New England Journal of Medicine, 375, 1834–1844. [DOI] [PubMed] [Google Scholar]
- Marso, S. P. , Daniels, G. H. , Brown‐Frandsen, K. , Kristensen, P. , Mann, J. F. , Nauck, M. A. , … LEADER Steering Committee; LEADER Trial Investigators . (2016). Liraglutide and cardiovascular outcomes in type 2 diabetes. New England Journal of Medicine, 375, 311–322. [DOI] [PMC free article] [PubMed] [Google Scholar]
- Nearing, B. D. , & Verrier, R. L. (2003). Tracking heightened cardiac electrical instability by computing interlead heterogeneity of T‐wave morphology. Journal of Applied Physiology, 95, 2265–2272. [DOI] [PubMed] [Google Scholar]
- Nearing, B. D. , & Verrier, R. L. (2015). Multilead template‐derived residua of surface ECGs for quantitative assessment of arrhythmia risk. Annals of Noninvasive Electrocardiology, 20, 273–281. [DOI] [PMC free article] [PubMed] [Google Scholar]
- Nearing, B. D. , Wellenius, G. A. , Mittleman, M. A. , Josephson, M. E. , Burger, A. J. , & Verrier, R. L. (2012). Crescendo in depolarization and repolarization heterogeneity heralds development of ventricular tachycardia in hospitalized patients with decompensated heart failure. Circulation: Arrhythmia and Electrophysiology, 5, 84–90. [DOI] [PMC free article] [PubMed] [Google Scholar]
- Panikkath, R. , Reinier, K. , Uy‐Evanado, A. , Teodorescu, C. , Hattenhauer, J. , Mariani, R. , … Chugh, S. S. (2011). Prolonged Tpeak‐to‐Tend interval on the resting ECG is associated with increased risk of sudden cardiac death. Circulation: Arrhythmia and Electrophysiology, 4, 441–447. [DOI] [PMC free article] [PubMed] [Google Scholar]
- Paulus, W. J. , & Tschope, C. (2013). A novel paradigm for heart failure with preserved ejection fraction: Comorbidities drive myocardial dysfunction and remodeling through coronary microvascular endothelial inflammation. Journal of the American College of Cardiology, 62, 263–271. [DOI] [PubMed] [Google Scholar]
- Scirica, B. M. , Bhatt, D. L. , Braunwald, E. , Steg, P. G. , Davidson, J. , Hirshberg, B. , … Raz, I. (2013). Saxagliptin and cardiovascular outcomes in patients with type 2 diabetes mellitus. New England Journal of Medicine, 369, 1317–1326. [DOI] [PubMed] [Google Scholar]
- Shah, N. R. , Cheezum, M. K. , Veeranna, V. , Horgan, S. J. , Taqueti, V. R. , Murthy, V. L. , … Di Carli, M. F. (2017). Ranolazine in symptomatic diabetic patients without obstructive coronary artery disease: Impact on microvascular and diastolic function (RAND‐CFR). Journal of the American Heart Association, 6, pii: e005027. [DOI] [PMC free article] [PubMed] [Google Scholar]
- Stoletniy, L. N. , & Pai, R. G. (1997). Value of QT dispersion in the interpretation of exercise stress test in women. Circulation, 96, 904–910. [DOI] [PubMed] [Google Scholar]
- Tan, A. Y. , Nearing, B. D. , Rosenberg, M. , Nezafat, R. , Josephson, M. E. , & Verrier, R. L. (2017). Interlead heterogeneity of R‐ and T‐wave morphology in standard 12‐lead ECGs predicts sustained ventricular tachycardia/fibrillation and arrhythmic death in patients with cardiomyopathy. Journal of Cardiovascular Electrophysiology. In press. [DOI] [PubMed] [Google Scholar]
- Verrier, R. L. , & Huikuri, H. V. (2017). Tracking interlead heterogeneity of R‐ and T‐wave morphology to disclose latent risk for sudden cardiac death. Heart Rhythm: the Official Journal of the Heart Rhythm Society. In press. [DOI] [PubMed] [Google Scholar]
- Verrier, R. L. , Pagotto, V. P. , Kanas, A. F. , Sobrado, M. F. , Nearing, B. D. , Zeng, D. , & Belardinelli, L. (2013). Low doses of ranolazine and dronedarone in combination exert potent protection against atrial fibrillation and vulnerability to ventricular arrhythmias during acute myocardial ischemia. Heart Rhythm: the Official Journal of the Heart Rhythm Society, 10, 121–127. [DOI] [PubMed] [Google Scholar]
- Yeung, C. Y. , Lam, K. S. , Li, S. W. , Lam, K. F. , Tse, H. F. , & Siu, C. W. (2012). Sudden cardiac death after myocardial infarction in type 2 diabetic patients with no residual myocardial ischemia. Diabetes Care, 35, 2564–2569. [DOI] [PMC free article] [PubMed] [Google Scholar]
- Zinman, B. , Wanner, C. , Lachin, J. M. , Fitchett, D. , Bluhmki, E. , Hantel, S. , … Inzucchi, S. (2015). Empagliflozin, cardiovascular outcomes, and mortality in type 2 diabetes. New England Journal of Medicine, 373, 2117–2128. [DOI] [PubMed] [Google Scholar]