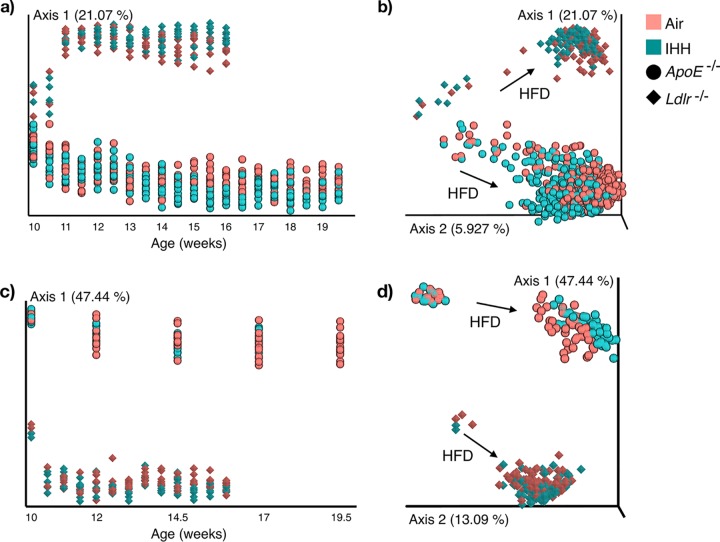
FIG 1.
Principal-coordinate analysis (PCoA) of the gut microbiome and metabolome in ApoE−/− and Ldlr−/− mouse models. (a and b) PCoA of the microbiome (16S rRNA sequencing) data using unweighted UniFrac distances. (c and d) PCoA of the metabolome (untargeted LC-MS/MS) data using Bray-Curtis distances. The ordination is visualized along the duration of treatment (starting at 10 weeks of age, with an interval of 0.5 week). Axis 1, principal coordinate 1; IHH, intermittent hypoxia and hypercapnia; HFD, high-fat diet.

