

Summary
Background
Treatment with tolerogenic dendritic cells (TolDC) is a promising, cell‐based strategy to regulate autoimmune diseases such as multiple sclerosis (MS) in an antigen‐specific way. This technique involves the use of TolDC from MS patients cultured in the presence of vitamin D3 (VitD3) and pulsed with myelin peptides to induce a stable hyporesponsiveness in myelin‐specific autologous T cells.
Aim
The purpose of this study was to analyze the in vivo effect of VitD3‐TolDC treatment on experimental autoimmune encephalomyelitis, an animal model of MS.
Methods
Bone marrow‐derived TolDC cultured in the presence of VitD3 and pulsed with peptide 40–55 of the myelin oligodendrocyte glycoprotein (MOG 40–55) were administrated preventively, preclinically, and therapeutically to EAE‐induced mice.
Results
We found that VitD3‐TolDC‐MOG treatment showed a beneficial effect, not only decreasing the incidence of the disease but also reducing the severity of the clinical signs mediated by induction of regulatory T cells (Treg), as well as IL‐10 production and reduction of Ag‐specific lymphoproliferation. Our results support VitD3‐TolDC‐peptide(s) treatment as a potential strategy to restore tolerance in autoimmune diseases such as MS.
Keywords: Dendritic cells, Experimental autoimmune encephalomyelitis, Regulatory T cells, Tolerance, Vitamin D3
Introduction
Multiple sclerosis (MS) is a chronic demyelinating autoimmune‐mediated disease affecting the central nervous system (CNS). Although the etiology of MS remains unknown, evidence obtained from animal models and patient studies indicate that myelin‐specific, autoreactive T cells play an important role in MS pathology 1, 2, 3.
Current approved therapies for MS patients consist of nonspecific immunomodulatory or immunosuppressive treatments that result in a decrease in the frequency of relapses, but have a limited effect on disease progression. In addition, as a consequence of their nonspecific mechanism of action, these therapies have various adverse effects. Thus, more effective and specific strategies to block the autoimmune reaction are needed 4. Toward this end, cell‐based therapies such as regulatory T cells (Treg), regulatory macrophages (Mreg), myeloid suppressor cells, and tolerogenic dendritic cells (DC) are novel, emerging strategies for inducing antigen‐specific tolerance 4, 5.
Dendritic cells are professional antigen‐presenting cells (APC), and as they are able to induce both effector responses and tolerance, they function as key regulators of the immune system 6. The tolerogenic response induced by DC is promoted by T‐cell antigen recognition under suboptimal costimulatory signaling and biased cytokine production. The resulting antigen‐specific tolerogenic mechanisms include induction of T‐cell anergy, promotion of Treg differentiation, and/or induction of T‐cell death 4, 7, 8. The promising therapeutic application of tolerogenic DC (TolDC) for autoimmune diseases and allograft rejection has triggered the generation of different strategies to produce TolDC including genetic manipulation or differentiation in the presence of biological or pharmacological agents 4, 9, 10. Our group has recently established an in vitro strategy to differentiate TolDC from peripheral blood monocytes of relapsing–remitting MS patients using the active form of vitamin D, 1α,25‐dihydroxyvitamin D3 (VitD3), as the tolerogenic agent. We have found that in vitro, VitD3‐TolDCs primed with myelin peptides are able to induce a stable hyporesponsiveness in both allogeneic and myelin‐specific autologous T cells 11.
With the aim to eventually translate this therapeutic approach to MS patients and initiate a phase I/IIa clinical trial, we investigated the in vivo effect of VitD3‐generated TolDC loaded with MOG40–55 peptide in experimental autoimmune encephalomyelitis (EAE), an animal model of MS. Our results demonstrate a beneficial effect of VitD3‐TolDC‐MOG in EAE by reestablishing specific tolerance to MOG, supporting their potential as tolerogenic therapy to restore tolerance in MS patients.
Material and Methods
Mice
Female C57BL/6J mice, 8–10 weeks old, were purchased from Harlan Laboratories (Italy). The mice were housed under standard light‐ and climate‐controlled conditions, with standard chow and water provided ad libitum. All experiments were performed in strict accordance with EU and governmental regulations (Generalitat de Catalunya, Decret 214/97 30th July). The Ethics Committee on Animal Experimentation of the “Germans Trias i Pujol” Research Institute approved all procedures described in this study (protocol number: 5315). Endpoint criteria were established to minimize suffering and ensure animal welfare.
Induction of EAE
Mice were anesthetized and then immunized subcutaneously with 100 μg of MOG40–55 (YRSPFSRVVHLYRNGK) (Institut de Recerca Biomèdica de Barcelona, IRBB, Barcelone, Spain), emulsified (1:1) in Freund's complete adjuvant containing 4 mg/mL of Mycobacterium tuberculosis (strain H37RA, Difco, Detroit, MI). In addition, 250 ng of pertussis toxin (Sigma Chemical, St. Louis, MO, USA) was injected intravenously at day 0 and 2.
Clinical Evaluation
All animals were weighed and examined daily for welfare and clinical signs according to the following criteria: 0, asymptomatic; 0.5, lost of distal half of tail tone; 1, lost of entire tail tone; 1.5, hindlimb weakness; 2, hindlimb paralysis; 2.5, hindlimb paraplegia; 3, forelimb weakness; 4, quadriparesia; 4.5, severe quadriparesis; 5, quadriplegia; and 6, death. Clinical evaluation was performed in a blinded manner by two different observers.
Generation of Bone Marrow‐Derived Dendritic Cells
Progenitor bone marrow cells were flushed from femur and tibias of C57BL/6 donor mice and were cultured in RPMI 1640 (PAA Laboratories) supplemented with 10% fetal bovine serum (FBS) (Gibco, Invitrogen, Carlsbad, CA, USA), 2 mM glutamine (Sigma Chemical), 100 IU/mL penicillin and streptomycin (Normon SA, Madrid, Spain and Laboratorio Reig Jofre, Sant Joan Despi, Spain, respectively), 1 mM sodium pyruvate (Biowest SAS, Nuaillé, France), and 50 μM β‐mercaptoethanol (Sigma, St. Louis, MO, USA). Bone marrow cells were derived from DC after 8 days in culture medium containing 1000 IU/mL of granulocyte‐macrophage colony‐stimulating factor (GM‐CSF; Prospec, Rehovot, Israel). TolDC were generated by adding 1 nM 1α,25‐dihydroxyvitamin D3 (Calcijex, Abbott Laboratories, IL, USA) to the culture medium. Cultures were refreshed on days 2, 4, and 6 by replenishment of half the volume of fresh medium supplemented with GM‐CSF and VitD3 for TolDC. On day 7, the maturation stimulus, 0.1 μg/mL lipopolysaccharide (LPS; Sigma), was added to the culture medium of mature DC (mDC) and TolDC, but not to immature DC (iDC). After 22–24 h, DC were pulsed with 10‐μM MOG40–55 (TolDC‐MOG) for 18 h or cultured with only medium (unpulsed TolDC).
In vivo Administration of Tolerogenic DC
Tolerogenic DC and TolDC‐MOG were washed twice with PBS after which cell viability was assessed by Annexin V and 7‐aminoactinomycin D (7‐AAD) staining. Mice received 2 or 4 doses of 106 viable TolDC‐MOG, TolDC, or PBS (vehicle) intravenously. Preventive treatment with TolCD‐MOG was administrated on days 2 and 5 postimmunization (pi); preclinical treatment was performed on days 5 and 9 pi and therapeutic on days 15, 19, 23, and 33 pi.
Cellular Tracking
Tolerogenic DC‐MOG were labeled with CellVue NIR815 dye (MTTI, PA, USA) following the manufacturer's instructions. Briefly, washed TolDC‐MOG were incubated with NIR815 for 5 min at room temperature and blocked by adding culture medium containing 20% FBS (1:1 v/v). After washing cells twice with PBS to eliminate unbound dye and FBS, cell viability was assessed by Annexin V and 7‐AAD staining. A total of 106 viable TolDC‐MOG‐NIR815 were administrated iv in EAE‐induced mice (n = 9) at day 5 pi. Imaging was performed in vivo at 0 and 24 h and ex vivo at 24 h, 48 h, 96 h, 7 days, and 14 days postadministration using a Pearl™ Impulse Imager (Li‐COR Biosciences, Lincoln, NE, USA). Signal from mice treated with PBS (vehicle, n = 8) was used as negative control.
Flow Cytometry
On day 8 of culture, iDC, mDC, and TolDC were stained for 25 min at room temperature with specific monoclonal antibodies (mAb) to determine the expression of the surface markers I‐Ab (MHC class II), CD86 (both from e‐Bioscience, San Diego, CA, USA), and CD40 on CD11c+‐gated cells (Becton Dickinson [BD] Pharmingen, San Diego, CA, USA).
For analysis of Treg, 0.5 × 10⁶ splenocytes were stained with anti‐CD3, CD4, CD25, and FoxP3 (all from BD Pharmingen) mAb following manufacturer's instructions. Cell viability and counting were calculated using Perfect‐Count Microspheres (Cytognos SL), Annexin V–allophycocyanin (APC) (Immunoltools, Friesoythe, Germany), and 7‐AAD (BD Pharmingen) staining.
Allogeneic Proliferative Response
To determine the stimulatory capacity of DC, either 2500 or 5000 iDC, mDC, or TolDC pulsed with MOG40–55, were incubated for 5 days with 105 allogeneic splenocytes (six replicas per each condition) from Balb/C mice (ratio 1/40 and 1/20, respectively), adding 1 μCi of [3H] methylthymidine (PerkinElmer, Waltham, MA, USA) for the last 8 hrs. Cells were harvested onto glass fiber filters, and [3H] methylthymidine incorporation was measured in a β‐scintillation counter (Trilux, Wallac).
Antigen‐Specific Proliferation and Cytokine Production
Mice from the preventive experiment (n = 8: TolDC‐MOG and n = 5: PBS [sham]) as well as a subgroup of 15 EAE‐induced mice treated preclinically (n = 5 for TolDC‐MOG, TolDC, and PBS), and therapeutically (TolDC‐MOG: n = 5, and n = 3 for TolDC and PBS) were euthanized on day 36, 12, and 46 pi for functional studies. Briefly, splenocytes were cultured in a 96‐well plate at 2 × 10⁵ cells/well in 200 μL of supplemented RPMI containing 5 μM MOG40–55 and either 5 μM of pokeweed mitogen (positive control) or culture medium (negative control). After 48 h of culture, 50 μL/well of supernatant was collected and stored for cytokine detection and 1 μCi/well of [3H]‐thymidine was added to each well for the last 18 h of culture. The stimulation index (SI) for each stimulus was calculated as the mean counts per minute (cpm) of antigen‐stimulated cultures divided by the mean cpm of the nonstimulated cultures.
The secretion of IL‐2, IL‐4, IL‐6, IFN‐γ, TNF‐α, IL‐17, and IL‐10 cytokines was quantified in the culture supernatants using the BD cytometric bead array mouse Th1/Th2/Th17 cytokine kit (BD) and Fortessa cytometer (BD) according to the manufacturer's instructions.
Statistical Analysis
Data were expressed as the mean ± standard deviation (SD) values unless otherwise stated. Statistical analyses were performed using Graphpad Prism version 6.00 for Windows (La Jolla, CA, USA). A Mann–Whitney or one‐way ANOVA with Dunnett's multiple comparisons test were applied to compare the mean values between 2 or ≥3 groups, respectively. For very small samples (n ≤ 3), an unpaired t‐test was performed 12. Fisher's exact test was used to compare qualitative variables. Differences were considered statistically significant when P < 0.05.
Results
Characterization of VitD3‐TolDC from C57BL/6
VitD3 treatment during DC differentiation generated TolDC showing a semimature phenotype with decreased expression of MHC class II, CD40, and CD86 molecules compared to mDC (MHC II: 75.65 ± 10.41%, CD40: 49.45 ± 8.07%, and CD86: 46.01 ± 9.74% of reduction compared to mDC expression levels; Figure 1A). In addition, functional analysis of VitD3‐TolDC revealed their poor stimulatory ability, exhibiting 68.51 ± 15.06% reduction of allogeneic proliferative response compared to mDC (Figure 1B). Data were obtained from five representative experiments.
Figure 1.

Characterization of VitD3‐TolDC from C57BL/6. Expression of CD40, CD86, and MHC‐II molecules on immature dendritic cells (DC) (iDC), mature DC (mDC), or tolerogenic DC (TolDC). Data are expressed as mean fluorescence intensity (MFI) (A). Allogeneic proliferation of splenocytes cocultured with iDC, mDC, or TolDC. Data are expressed as counts per minute (cpm) (B). Representative data from five independent experiments. Errors bars correspond to SEM.
Treatment with TolDC‐MOG40–55 Abrogates EAE Induction and Ameliorates Clinical Signs of the Disease
To determine the in vivo effect of TolDC loaded with MOG40–55 peptide in EAE, three different approaches were used: preventive (before immunization, on days −2 and 5 pi), preclinical (postimmunization, on days 5 and 12 pi), and therapeutic (after the onset of the disease; days 15, 19, 23, and 33 pi). When 106 TolDC‐MOG were administrated preventively, 75% of treated mice showed a lower incidence of EAE induction compared with the control group (25% vs. 100%; P = 0.021; Figure 2A). On the other hand, when TolDC‐MOG treatment was performed after EAE induction (preclinical and therapeutic approaches), the treated mice showed an ameliorated clinical course compared with both the control and unpulsed TolDC groups (Figure 2B,C). In accordance, cumulative score of TolDC‐MOG‐treated mice was significantly reduced preclinically (P = 0.051) and therapeutically (vehicle vs. TolDC‐MOG; P = 0.037 and TolDC vs. TolDC‐MOG; P = 0.037; Table 1). In the same way, the severity of mice treated therapeutically with TolDC‐MOG was only moderate compared with PBS‐ or unpulsed TolDC‐treated mice (vehicle vs. TolDC‐MOG; P = 0.027 and TolDC vs. TolDC‐MOG; P = 0.038; Table 1). Interestingly, individual analysis of the clinical effect on mice with established EAE revealed that TolDC‐MOG administration was able to either ameliorate clinical signs of EAE or abrogate EAE progression, as opposed to animals treated with TolDC or PBS, which rapidly reached high clinical scores (Figure 2D–F). Nevertheless, the effect of TolDC‐MOG was transient (5–6 days), with new doses of TolDC‐MOG being required to reestablish the beneficial effect of the therapeutic vaccine (Figure 2C,F).
Figure 2.
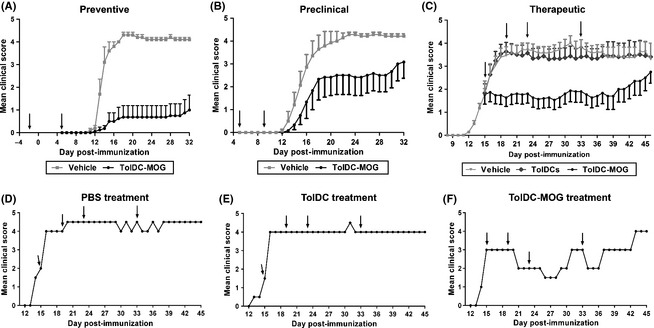
TolDC‐MOG treatment ameliorates experimental autoimmune encephalomyelitis (EAE). Clinical follow‐up of mice treated with 106 TolDC‐MOG, PBS (vehicle), or unpulsed TolDC preventively, on days −2 and +5pi, (PBS: n = 5 and TolDC‐MOG: n = 8) (A), pre‐clinically, on days +5 and +9pi, (PBS: n = 6 and TolDC‐MOG: n = 11) (B), and therapeutically, on days +15, +19, +23, +33pi, (PBS: n = 14, TolDC: n = 15 and TolDC‐MOG: n = 15) (C). Representative graph of clinical follow‐up from one individual mouse treated therapeutically (D), TolDC (E) and TolDC‐MOG (F). Arrows indicate days of 106 TolDC‐MOG, TolDC, or PBS administration. Error bars correspond to SEM.
Table 1.
Clinical data of experimental autoimmune encephalomyelitis (EAE) mice treated preclinically and therapeutically with tolerogenic DC (TolDC) and TolDC‐MOG
| Preclinical approach | Therapeutic approach | ||||
|---|---|---|---|---|---|
| Vehicle | TolDC‐MOG | Vehicle | TolDC | TolDC‐MOG | |
| Incidence (%) |
11/11 100 |
5/6 83.33 |
14/14 100 |
14/15 93.33 |
14/15 93.33 |
| Maximum score | 4.43 ± 0.2 | 3.25 ± 1.9 | 4.07 ± 1.2 | 3.83 ± 1.6 | 2.77 ± 1.6* |
| Cumulative scorea | 72.00 ± 12.5 | 42.67 ± 32.8 | 98.18 ± 35.1 | 96.57 ± 52.5 | 52.93 ± 47.5* |
| Disease onset (day) | 14.71 ± 2.6 | 15.80 ± 2.6 | – | – | – |
aMean of the sum of daily scores for each mouse. Data are expressed as mean ± SD. *P < 0.05 (comparison between both Vehicle–TolDC‐MOG and TolDC–TolDC‐MOG).
TolDC‐MOG Migrate to the Spleen
Image data obtained from mice receiving TolDC‐MOG labeled with NIR815 (n = 9) showed that following iv administration, the cells reached the lungs immediately after administration (Figure 3A). At 24 h postadministration, cells were found at a high concentration in the liver, with a moderate signal becoming visible in the spleen, where it increases after 48 h and remained elevated until day 7 postadministration (Figure 3A,B). A low level signal from TolDC‐MOG‐NIR815 cells was also detected in other irrigated organs and tissues such as thymus, lymph nodes, brain, kidneys, and bone marrow (Figure 3C).
Figure 3.
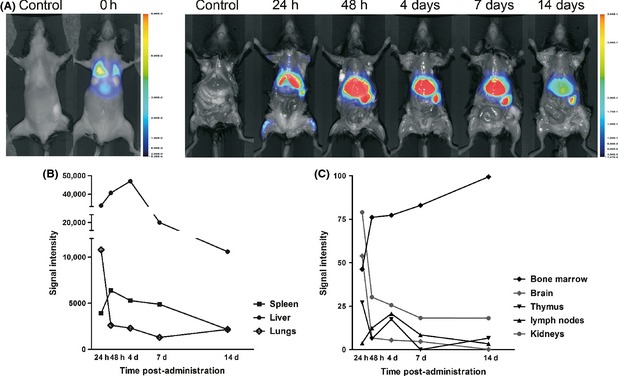
Migration of TolDC‐MOG after iv injection in mice with experimental autoimmune encephalomyelitis (EAE). Cellular tracking images from mice treated with TolDC‐MOG labeled with NIR815 dye (n = 9). Image acquisition is performed in vivo at 0 h and ex vivo at 24 h, 48 h, 4 days, 7 days, and 14 days postadministration (A). Signal intensity from spleen, lungs, liver, brain, thymus, lymph nodes, bone marrow, and kidneys are obtained ex vivo at different time points (B, C). Signal from mice treated with PBS (n = 8) is used as negative control. The images are representative results from at least two independent experiments.
Reduced Antigen‐Specific Reactivity and Increased IL‐10 Secretion by Splenocytes of Mice Treated with TolDC‐MOG
Splenocytes were obtained on day 36 and 46 pi for preventive and therapeutic approaches, respectively, or on day 12 pi (during the inflammatory phase of the disease) in the preclinical approach. Results revealed that splenocytes of mice treated either with TolDC‐MOG or unpulsed TolDC showed a reduction in MOG‐specific proliferation (expressed as stimulation index, SI) compared with control mice, when treatment was administrated preventively (vehicle: 4.27 ± 2.65 vs. TolDC‐MOG: 0.97 ± 0.42, P = 0.003; n = 5 and n = 8, respectively), preclinically (vehicle: 1.51 ± 1.23 vs. TolDC: 0.73 ± 0.41 and TolDC‐MOG: 0.85 ± 0.16, ns; n = 4, n = 4 and n = 5, respectively), or after the onset of the disease (therapeutic approach) (vehicle: 4.07 ± 1.36 vs. TolDC: 1.16 ± 0.25, P = 0.022, n = 3 in each group; and TolDC‐MOG: 1.34 ± 0.30, P = 0.004, n = 5; Figure 4A).
Figure 4.
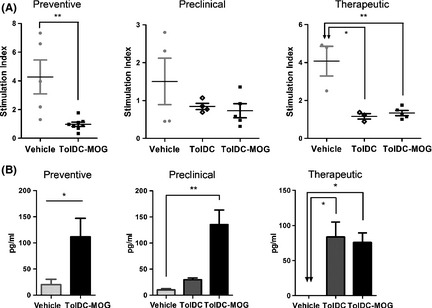
Reduced antigen‐specific reactivity and increased IL‐10 secretion of splenocytes from mice treated with TolDC‐MOG. (A) MOG‐induced proliferative response from mice treated preventively, preclinically, or therapeutically with PBS (vehicle), unpulsed TolDC, or TolDC‐MOG. The data are expressed as stimulation index (SI). (B) Analysis of the antiinflammatory cytokine IL‐10 secretion in supernatants of MOG‐stimulated splenocytes from mice treated preventively, preclinically, or therapeutically with PBS (vehicle), unpulsed TolDC, or TolDC‐MOG. Error bars correspond to SEM. *P < 0.05, **P < 0.01.
In addition, cytokine levels were analyzed in the supernatant of MOG‐stimulated splenocytes. Among all the cytokines analyzed, the most relevant result was exhibited by IL‐10 secretion. We found a significant increase in IL‐10 production related to TolDC‐MOG administration in all the treatment approaches, preventive (P = 0.019), preclinical (P = 0.008), and therapeutic (P = 0.036; Figure 4B). In the same way, splenocytes from mice treated therapeutically with unpulsed TolDC also showed higher levels of IL‐10 secretion compared to PBS‐treated mice (vehicle; P = 0.017), although no differences were found in the preclinical approach (Figure 4B). Furthermore, there were increased levels of secretion of the antiinflammatory cytokine IL‐4 for splenocytes derived from mice treated preventively or preclinically with TolDC‐MOG compared with both vehicle and TolDC groups (preventive, PBS vs. TolDC‐MOG: P = 0.045; and preclinical, PBS vs. TolDC‐MOG: P = 0.056 and TolDC vs. TolDC‐MOG: P = 0.032). When cytokine analysis was performed using restimulated splenocytes obtained on day 12 pi (preclinical approach), high and variable levels of cytokines related to the initiation of the inflammatory phase of the disease were detected. Consequently, we not only detected high levels of IL‐4 and IL‐10, but also IL‐6 in TolDC‐MOG‐treated mice when compared to the vehicle group (P = 0.056). Similarly, we found an increase IL‐2 in the supernatant of splenocytes from mice receiving TolDC‐MOG therapeutically as compared to PBS‐treated mice (P = 0.036), but there was no difference when compared with the unpulsed TolDC group.
Treg induction Following Antigen‐Specific TolDC Administration
The percentage of Treg (% of CD25+ FoxP3+ cells from the CD3+ CD4+ population) in splenocytes from mice of the different groups was analyzed ex vivo (prior to in vitro stimulation with MOG40–55; Figure 5A). Results revealed that mice receiving TolDC‐MOG treatment had increased the % of Treg cells as compared to control or TolDC‐treated mice in all the treatment approaches: preventive (day 32 pi, vehicle: 9.78 ± 3.6 vs. TolDC‐MOG: 38.1 ± 10.9, P = 0.002); preclinical (day 12 pi, vehicle: 11.86 ± 2.7, and TolDC: 12.18 ± 2.9 vs. TolDC‐MOG: 16.72 ± 2.2, P = 0.016, and P = 0.032, respectively); and therapeutic (day 46 pi, vehicle: 16.23 ± 5.4 and TolDC: 13.90 ± 1.2 vs. TolDC‐MOG: 20.38 ± 4.2, P = 0.393 and P = 0.036, respectively; Figure 5B–D). In relation to the analysis of the absolute numbers, we observed some variability in the number of CD3+ CD4+ lymphocytes among mice. Nevertheless, similar results were observed compared to percentages: preventive (day 32pi, vehicle: 489.20 ± 489.10 vs. TolDC‐MOG: 565.60 ± 337.80, P = 0.524); preclinical (vehicle: 1151.0 ± 314.20, and TolDC: 874.0 ± 249.0 vs. TolDC‐MOG: 1490.0 ± 254.30, P = 0.393, and P = 0.036, respectively); and therapeutic (day 46 pi, vehicle: 409.0 ± 147.20 and TolDC: 405.0 ± 122.70 vs. TolDC‐MOG: 551.40 ± 137.70, P = 0.151, P = 0.056, and P = 0.036, respectively).
Figure 5.
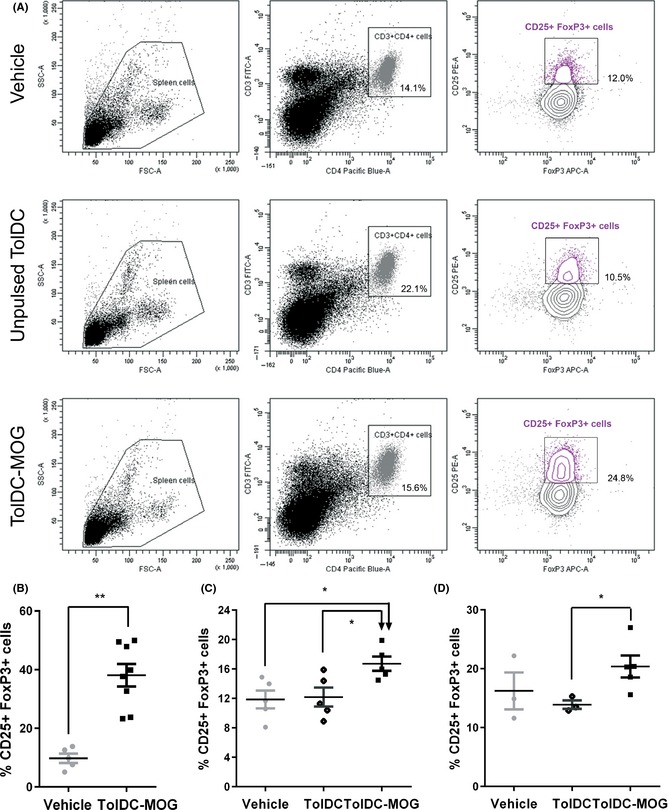
Increase Treg population in ex vivo splenocytes from mice receiving TolDC‐MOG. The percentage of CD25+ FoxP3+ cells (Treg) is calculated from the CD3+ CD4+ T‐cell population. Representative analysis of the % Treg in ex vivo splenocytes of PBS, TolDC, and TolDC‐MOG therapeutically treated mice (A). Percentage of Treg from ex vivo splenocytes of mice treated preventively (B), preclinically (C), or therapeutically (D) with PBS, unpulsed TolDC, or TolDC‐MOG. The error bars correspond to SEM. *P < 0.05, **P < 0.01.
Discussion
Tolerogenic DC are a promising immunosuppressive strategy to control pathogenic‐reactive T‐cell response in autoimmune diseases such as rheumatoid arthritis, type 1 diabetes, or MS 4, 10. Previous studies reported that bone marrow‐derived iDC pulsed with MOG35–55 are able to suppress EAE in an antigen‐dependent way 13, 14. However, although iDC might be a powerful immunotherapy strategy to treat MS and other autoimmune diseases, they are potentially pathogenic, as they could maturate in a proinflammatory environment and exacerbate autoimmune reactions. Consequently, important efforts have been devoted in the last years to generate mature DC with tolerogenic functions (TolDC). To date, several strategies have been developed to generate potent and stable TolDC in vitro from murine bone marrow or human peripheral blood mononuclear cells. These protocols consist in treating DC with immunosuppressive drugs or biological agents (such as antiinflammatory cytokines, dexamethasone, VitD3 and rapamycin) or modifying DC function by genetic engineering (transducing DC with viral vectors expressing immunoregulatory molecules or silencing immunostimulatory molecules) (reviewed in 4, 5, 8, 10, 15).
The generation of TolDC using VitD3 alters the phenotype and functionality of monocyte and bone marrow‐derived DC 11, 16, 17. In this study, we show that VitD3‐treated bone marrow‐derived DC induced a decrease in the levels of costimulatory molecules (CD80, CD40, and MHC II) and low T‐cell alloreactivity proliferation compared to mDC. This is in accordance with previous studies that have reported the efficacy of preventive or preclinical administration of a wide range of TolDC types in EAE 14, 18, 19, 20. Here, we demonstrated that iv administration of VitD3‐TolDC loaded with MOG40–55 peptide are capable of not only preventing, but also ameliorating the transient clinical signs of EAE when administrated to mice with clinical manifestations of the disease.
We performed cellular tracking experiments to determine the migratory capacity of TolDC after intravenous injection, the expected route of administration in a future clinical trial for MS patients. Results revealed that following iv injection, TolDC‐MOG migrate mainly to the lungs, liver, and spleen. Although the cell signal was also detected transiently in the brain, these results support that DC do not need to cross the blood–brain barrier to perform their function. Furthermore, the ex vivo analysis of splenocytes from treated mice showed that antigen‐specific reactivity was reduced in both TolDC‐ and TolDC‐MOG‐treated mice. However, in contrast to vehicle‐ or TolDC‐treated mice, only mice receiving TolDC‐MOG demonstrated an increase in the Treg population, which is in line with the amelioration of EAE clinical signs. These results suggest that one of the mechanisms of tolerance induction of TolDC‐MOG is the generation of Treg.
Our results are in agreement with previous studies reporting that the tolerogenic effect of iDC and TolDC in EAE‐ and collagen‐induced arthritis (CIA), respectively, require pulsing cells with auto‐antigens 13, 21. In contrast, using the acute EAE model, Farias et al. 22 found that preventive treatment with unpulsed VitD3‐TolDC was able to reduce antigen‐specific reactivity and EAE severity. Our data confirm that unpulsed VitD3‐TolDC have a tolerogenic effect, as we found that splenocytes from TolDC‐treated mice restimulated with MOG40–55 were able to reduce antigen‐specific reactivity and occasionally, also increase secretion of the antiinflammatory cytokine IL‐10. However, the in vitro tolerogenic effects of unpulsed TolDC were not sufficient to ameliorate the clinical signs of the chronic EAE model, which is characterized by an aggressive disease course. In contrast, treatment with VitD3‐TolDC‐MOG was found to be more potent than unpulsed VitD3‐TolDC, as it was able to improve the clinical course of EAE in vivo. Furthermore, when studied in vitro, reduced MOG reactivity and increased IL‐10 secretion were always found following antigen restimulation of splenocytes, while in ex vivo experiments, a high percentage of CD25+ FoxP3+ cells was detected in spleen cells. Although FoxP3 can be expressed by activated cells, functional results following antigen splenocytes restimulation revealed that animals treated with TolDC‐MOG had reduced proliferation against MOG, thus supporting a regulatory function of those cells. This results are in agreement with other studies that have also demonstrated that EAE suppression is related to Treg expansion and is mediated by TolDC in an antigen‐specific manner 23, 24. Moreover, clinical data has shown that the therapeutic effect of TolDC‐MOG is transient, meaning that repetitive administrations are required to obtain a stable clinical effect. Although we were not able to analyze if the Treg induction in TolDC‐MOG‐treated mice was also transient, the clinical score did not correlate with the percentage of Treg of each mice (data not shown); Therefore, we consider that Treg response plays an important role in controlling the autoreactive T‐cell response, but other mechanism or factors could be contributing to the regulatory effect triggered by TolDC‐MOG treatment,
Altogether, these results suggest that antigen‐specific DC‐based therapy using VitD3 could represent an advantageous strategy for MS patients. So far, phase I clinical trials have shown that the treatment with autologous TolDC is safe and well tolerated 25, 26. In the near future, studies establishing effective cell‐dosing (number of antigen‐specific TolDC and readministration timing) and identifying biomarkers to monitor tolerance induction will be crucial the steps to guarantee success of the therapy.
Conclusions
We have demonstrated that TolDC‐MOG (differentiated in the presence of VitD3) show a tolerogenic profile, demonstrated both by phenotype and in vitro functionality. When VitD3‐TolDC were administrated in mice with clinical signs of EAE, only antigen‐specific TolDC exhibited a beneficial effect in vivo by reducing disease incidence and ameliorating clinical symptoms. Furthermore, TolDC loaded with MOG peptide were able to increase the percentage of Treg cells, induce IL‐10 secretion, and reduce EAE severity. Taken together, these results can be considered a proof of concept that VitD3‐monocyte‐derived DC could be a potential specific cell‐based immunotherapy for MS patients.
Conflict of Interest
The authors declare no conflict of interest.
Acknowledgments
We want to acknowledge Marco Fernández for flow cytometry support, Ana García for her support with cellular tracking experiments, and Fernando Albericio and Gerardo Acosta for providing us with MOG40–55 peptide. This work was supported in part by Fondo de Investigación Sanitaria (FIS) PI11/02416, Ministry of Economy and Competition (Spain) and Fundación Salud 2000. The authors are members of the European Cooperation in Science and Technology (COST) Action BM1305: Action to Focus and Accelerate Cell‐based Tolerance‐inducing Therapies (A FACTT).
References
- 1. McFarland HF. Martin R Multiple sclerosis: A complicated picture of autoimmunity. Nat Immunol 2007;8:913–919. [DOI] [PubMed] [Google Scholar]
- 2. Noseworthy JH, Lucchinetti C, Rodriguez M, Weinshenker BG. Multiple sclerosis. N Engl J Med 2000;343:938–952. [DOI] [PubMed] [Google Scholar]
- 3. Fletcher JM, Lalor SJ, Sweeney CM, Tubridy N, Mills KH. T cells in multiple sclerosis and experimental autoimmune encephalomyelitis. Clin Exp Immunol 2010;162:1–11. [DOI] [PMC free article] [PubMed] [Google Scholar]
- 4. Van Brussel I, Lee WP, Rombouts M, et al. Tolerogenic dendritic cell vaccines to treat autoimmune diseases: Can the unattainable dream turn into reality? Autoimmun Rev 2014;13:138–150. [DOI] [PubMed] [Google Scholar]
- 5. Raich‐Regue D, Glancy M, Thomson AW. Regulatory dendritic cell therapy: From rodents to clinical application. Immunol Lett 2013;161:216–221. [DOI] [PMC free article] [PubMed] [Google Scholar]
- 6. Steinman RM, Hawiger D, Nussenzweig MC. Tolerogenic dendritic cells. Annu Rev Immunol 2003;21:685–711. [DOI] [PubMed] [Google Scholar]
- 7. Morelli AE, Thomson AW. Tolerogenic dendritic cells and the quest for transplant tolerance. Nat Rev Immunol 2007;7:610–621. [DOI] [PubMed] [Google Scholar]
- 8. Maldonado RA, von Andrian UH. How tolerogenic dendritic cells induce regulatory T cells. Adv Immunol 2010;108:111–165. [DOI] [PMC free article] [PubMed] [Google Scholar]
- 9. Thomson AW, Robbins PD. Tolerogenic dendritic cells for autoimmune disease and transplantation. Ann Rheum Dis 2008;67(Suppl 3):iii90–iii96. [DOI] [PubMed] [Google Scholar]
- 10. Hilkens CM, Isaacs JD, Thomson AW. Development of dendritic cell‐based immunotherapy for autoimmunity. Int Rev Immunol 2010;29:156–183. [DOI] [PubMed] [Google Scholar]
- 11. Raïch‐Regue D, Grau‐Lopez L, Naranjo‐Gomez M, et al. Stable antigen‐specific T‐cell hyporesponsiveness induced by tolerogenic dendritic cells from multiple sclerosis patients. Eur J Immunol 2012;42:771–782. [DOI] [PubMed] [Google Scholar]
- 12. Bland JM, Altman DG. Analysis of continuous data from small samples. BMJ 2009;338:a3166. [DOI] [PubMed] [Google Scholar]
- 13. Zhou F, Ciric B, Zhang GX, Rostami A. Immune tolerance induced by intravenous transfer of immature dendritic cells via up‐regulating numbers of suppressive IL‐10(+) IFN‐gamma(+)‐producing CD4(+) T cells. Immunol Res 2013;56:1–8. [DOI] [PMC free article] [PubMed] [Google Scholar]
- 14. Iruretagoyena MI, Sepulveda SE, Lezana JP, et al. Inhibition of nuclear factor‐kappa B enhances the capacity of immature dendritic cells to induce antigen‐specific tolerance in experimental autoimmune encephalomyelitis. J Pharmacol Exp Ther 2006;318:59–67. [DOI] [PubMed] [Google Scholar]
- 15. Hu J, Wan Y. Tolerogenic dendritic cells and their potential applications. Immunology 2011;132:307–314. [DOI] [PMC free article] [PubMed] [Google Scholar]
- 16. Piemonti L, Monti P, Sironi M, et al. Vitamin D3 affects differentiation, maturation, and function of human monocyte‐derived dendritic cells. J Immunol 2000;164:4443–4451. [DOI] [PubMed] [Google Scholar]
- 17. Ferreira GB, van Etten E, Verstuyf A, et al. 1,25‐Dihydroxyvitamin D3 alters murine dendritic cell behaviour in vitro and in vivo. Diabetes Metab Res Rev 2011;27:933–941. [DOI] [PubMed] [Google Scholar]
- 18. Menges M, Rossner S, Voigtlander C, et al. Repetitive injections of dendritic cells matured with tumor necrosis factor alpha induce antigen‐specific protection of mice from autoimmunity. J Exp Med 2002;195:15–21. [DOI] [PMC free article] [PubMed] [Google Scholar]
- 19. Xiao BG, Wu XC, Yang JS, et al. Therapeutic potential of IFN‐gamma‐modified dendritic cells in acute and chronic experimental allergic encephalomyelitis. Int Immunol 2004;16:13–22. [DOI] [PubMed] [Google Scholar]
- 20. Pettersson A, Ciumas C, Chirsky V, Link H, Huang YM, Xiao BG. Dendritic cells exposed to estrogen in vitro exhibit therapeutic effects in ongoing experimental allergic encephalomyelitis. J Neuroimmunol 2004;156:58–65. [DOI] [PubMed] [Google Scholar]
- 21. Stoop JN, Harry RA, von Delwig A, Isaacs JD, Robinson JH, Hilkens CM. Therapeutic effect of tolerogenic dendritic cells in established collagen‐induced arthritis is associated with a reduction in Th17 responses. Arthritis Rheum 2010;62:3656–3665. [DOI] [PubMed] [Google Scholar]
- 22. Farias AS, Spagnol GS, Bordeaux‐Rego P, et al. Vitamin D3 induces IDO+ tolerogenic DCs and enhances Treg, reducing the severity of EAE. CNS Neurosci Ther 2013;19:269–277. [DOI] [PMC free article] [PubMed] [Google Scholar]
- 23. Yeste A, Nadeau M, Burns EJ, Weiner HL, Quintana FJ. Nanoparticle‐mediated codelivery of myelin antigen and a tolerogenic small molecule suppresses experimental autoimmune encephalomyelitis. Proc Natl Acad Sci U S A 2012;109:11270–11275. [DOI] [PMC free article] [PubMed] [Google Scholar]
- 24. Hauben E, Gregori S, Draghici E, et al. Activation of the aryl hydrocarbon receptor promotes allograft‐specific tolerance through direct and dendritic cell‐mediated effects on regulatory T cells. Blood 2008;112:1214–1222. [DOI] [PubMed] [Google Scholar]
- 25. Giannoukakis N, Phillips B, Finegold D, Harnaha J, Trucco M. Phase I (safety) study of autologous tolerogenic dendritic cells in type 1 diabetic patients. Diabetes Care 2011;34:2026–2032. [DOI] [PMC free article] [PubMed] [Google Scholar]
- 26. Moreau A, Varey E, Bouchet‐Delbos L, Cuturi MC. Cell therapy using tolerogenic dendritic cells in transplantation. Transplant Res 2012;1:13. [DOI] [PMC free article] [PubMed] [Google Scholar]