

Abstract
Abstract. Viability and myogenesis from C2C12 muscle cells and L6 rat myoblasts were dose‐dependently stimulated by insulin. The metabolic inhibitors of phosphatidyl‐inositol‐3‐kinase (PI‐3K, LY294002) and of MAPKK/ERK kinase (MEK, PD98059) differently affected insulin‐stimulated myogenesis of the cells. After LY294002 and PD98059 treatment, viability deteriorated and apparently an additive effect of both metabolic inhibitors was observed, irrespective of the method of measurement (neutral red or MTT assay). These inhibitors were antagonistic in myogenesis. Our results confirm that insulin regulates cell viability by at least two distinct pathways, namely by PI‐3K‐ and MEK‐dependent signalling cascades. Both pathways are agonistic in cell viability, whereas PI‐3K rather than MEK supports insulin‐mediated myogenicity. Accordingly, inhibition of insulin action by LY294002, but not PD98059, was accompanied with a reduced level of Ser473‐phosphorylated Akt with additional loss of myogenin protein. Besides, repression of insulin signalling by either PI‐3K or MEK inhibitor diminished expression of selected subunits of the mitochondrial oxidative phosphorylation enzymes (OXPHOS). In turn, insulin raised and accelerated protein expression of subunits I and IV of mitochondrial cytochrome‐c oxidase (COX). In addition, the level of myogenin, the molecular marker of terminal and general muscle differentiation indices decreased if selected OXPHOS enzymes were individually blocked by rotenone, myxothiazol or oligomycin. Summing up, our results pointed to mitochondria as an essential organelle for insulin‐dependent myogenesis. Insulin positively affects mitochondrial function by induction of OXPHOS enzymes, which provide energy indispensable for the anabolic effect of insulin.
INTRODUCTION
Insulin plays a major role in skeletal muscle protein accretion. Also, there are significant data suggesting the involvement of insulin in synthesis of mitochondrial proteins (Huang et al. 1999; Stump et al. 2003). The latter remains to be better understood, since no specific insulin‐dependent signalling pathway has been shown to be involved in the above‐mentioned phenomenon.
Clonal cell lines C2C12 mouse satellite cells and L6 rat myoblasts, when stimulated by insulin or IGF‐1/2, align and fuse (Florini et al. 1993; Cassar‐Malek et al. 1999; Orzechowski et al. 2002). Depending on the concentration of ligand, which determines the specificity of ligation to a particular receptor, either ligand can act on IR and/or IGF‐1R to enable formation of muscle fibers. However, in in vitro studies, the concentration range of insulin is usually higher (1–10 nm) than that found in vivo (~0.1 nm). Thus, it is not easy to discriminate between the insulin effects mediated by IR but not IGF‐1R. In any case in the insulin receptor family, the molecular mechanisms of signal transduction are almost identical regardless of the receptor type. The crucial step in signal transduction upon induction of receptor protein tyrosine kinase (RPTK) by insulin or IGF‐1/2 is the activation of phosphatidyl‐inositol‐3‐kinase (PI‐3K)/Akt and/or MAPKK/ERK kinase (MEK)/MAPK cascade pathways (Kaliman et al. 1999). Transduction of signals to differentiate into myotubes is in part mediated by PI‐3K, which phosphorylates the inositol ring at the 3‐OH position, ensuing membrane assembly of PDK1 and PKB, a product of akt gene (PKB/Akt) (Kaliman et al. 1996; Sumitani et al. 2002). Subsequently, PKB/Akt is phosphorylated at two key regulatory sites (Thr308 and Ser473); both residues are necessary for full activation (Scheid et al. 2002). The PI‐3K cascade is thus thought to be important for myogenesis (Kaliman et al. 1996). RPTK‐ or IRS‐mediated PI‐3K activities are efficiently blocked by LY294002 (Vlahos et al. 1994; Kaliman et al. 1996). This inhibition results in reduced activity of Akt in myogenic cells (Sarbassov & Petersen 1998; Sumitani et al. 2002). Apart from that, differentiation of myocytes to muscle fibers is believed to be maintained by Ras/Raf/MEK/ERK1/2 pathway (Bennet & Tonks 1997; Sarbassov et al. 1997; Gredinger et al. 1998). MAPKK MEK phosphorylates its substrates ERK1/2 at threonine and tyrosine residues (Zheng & Guan 1993). A specific inhibitor of MEK activation PD98059 makes ERK1/2 incapable to act on its downstream targets (Dudley et al. 1995).
Muscle fibres are formed in a series of molecular events timely and spatially coordinated by muscle regulatory factors (MRF). Terminal differentiation is accompanied by transient expression of myogenin, a member of MRF family, the transcription factor essential for activation of muscle‐specific genes that brings about the structural and enzymatic changes that allow cells to fuse (Picard et al. 1998). An additional energy supply seems to be indispensable as the differentiation process is featured by accelerated anabolism resulting in higher demands for ATP. Muscle cells must activate mitochondria in order to keep energy in balance (Rochard et al. 2000). Furthermore, activated mitochondria pace myogenesis. Biogenesis of mitochondria has also been observed whenever muscle cells faced high energy expenditure, such as in thyroid hormone‐induced effects (Rodier et al. 1999) (for details see review paper by Wrutniak‐Cabello et al. 2001). In bovine satellite cells, similar to triiodothyronine (T3), insulin has displayed myogenic activity. However, a gradual mitochondrial dysfunction is observed when muscle insensitivity to insulin develops in type 2 diabetes (Kelley et al. 2002; Petersen et al. 2004). In such circumstances tissue substrate utilization, protein synthesis and muscle regeneration are impaired. It should be kept in mind that skeletal muscle mitochondria might contribute considerably to oxidative stress, either being activated in excess or by having decreased oxidative capacity (Hargreaves et al. 1999).
It has been reported by Hocquette et al. (2000) that during the last trimester of prenatal growth, skeletal muscles in fetal calf undergo metabolic differentiation to provide more oxidative fibres at the time of birth (for details see review paper by Picard et al. 2002). However, the mechanisms underlying the recruitment of glycolytic muscle fibres to switch to more oxidative fibres remain ambiguous. It has been suggested that at the end of pregnancy fetal muscle is shifted to the more oxidative type because of novel functions that are about to be undertaken by the muscles. This also points to the crucial role played by OXPHOS (oxidative phosphorylation) in active mitochondria, which will oxidize new substrates during the neonatal period and adulthood. In ex vivo studies performed on muscle samples, protein expression of both Ser473‐phosphorylated PKB/Akt and the subunit IV of COX, as well as the beta‐subunit of ATP synthase of OXPHOS, were directly proportional to the in utero age of the fetal calf (J.‐F. Hocquette, B. Gajkowska & P. Pawlikowska, unpublished). During the same time period, the average blood concentration of insulin was significantly higher in older than in younger foetuses (unpublished). These findings were so intriguing that in order to ascertain that muscle cells rather than other cell types are involved in insulin‐mediated effects in mitochondria, we decided to conduct in vitro studies on the clonal muscle cell lines. We thus aimed to check the hypothesis whether insulin activates mitochondria and if it does, how mitochondria affect insulin‐dependent myogenesis.
MATERIALS AND METHODS
Reagents
All reagents such as PD98059, LY294002, dimethyl sulphoxide (DMSO), Tris, 4‐(2‐hydroxyethyl)‐1‐piperazine‐ethanesulphonic acid (HEPES), ethylenediaminetetraacetic acid (EDTA), 2‐aminoethoxyethane‐N,N,N′,N′‐tetraacetic acid (EGTA), sodium chloride (NaCl) were cell culture tested of high purity, and unless otherwise stated, they were purchased from Sigma‐Aldrich Chemical Co. (St. Louis, MO, USA). Reagents for experimental applications were dissolved according to the manufacturers recommendations and were stored as stock solutions (1000‐fold the highest working concentration). Primary polyclonal rabbit antimyogenin IgG antibody, goat polyclonal anti‐Akt‐1 IgG antibody, rabbit anti‐P‐[Ser473 residue]‐Akt‐1 IgG antibody and secondary antibodies donkey antigoat, donkey antirabbit, were obtained from Santa Cruz Biotechnology (Santa Cruz, CA, USA). Alexa Fluor 488 chicken antirabbit and chicken antimouse antibodies for cytoimmunofluorescent studies, and primary monoclonal anti‐COX I subunit and anti‐COX IV subunit antibodies, were obtained from Molecular Probes (Eugene, OR, USA). Other reagents were purchased as stated in the description of the respective methods (see succeeding text). Protein content was assayed by the Bradford method (Bio‐Rad Laboratories; Hercules, CA, USA). Sodium dodecyl sulphate (SDS) 10% (w/v), Sequi‐Blot PVDF Membrane 0.2 µm and all reagents for immunoblotting were also obtained from Bio‐Rad Laboratories. Sera, media and antibiotics were from Gibco Life Technologies (Paisley, UK).
Cell culture
Mouse C2C12 myoblastic cells and L6 rat myoblasts were purchased from the European Collection of Animal Cell Cultures (ECACC) and were grown at 37 °C in a controlled humidified 5% CO2 atmosphere. They were cultured to the exponential phase of population growth (10% FBS/DMEM) designed as growth medium (GM) and was supplied with the antibiotic–antimycotic mixture (Penicillin G sodium salt 50 IU/ml, streptomycin sulphate 50 µg/ml; gentamycin sulphate 20 µg/ml; fungizone–amphotericin B 1 µg/ml). Cells were seeded at 5000 cells/cm2 in 100 mm diameter Petri dishes, 96‐flatwell plates (for cell viability studies) or on coverslips located in 35 mm diameter Petri dishes (for cyto immunofluorescence and fluorescence studies) until they reached confluence. Then cells were guided to the transition phase by replacement of 10% (v/v) FBS/DMEM medium by 2% (v/v) horse serum HS/DMEM medium, the designated differentiation medium (DM), with antibiotic–antimycotic mixture alone or additionally supplemented with experimental reagents.
Experimental procedure
Each day cells were washed twice in phosphate buffered saline (PBS) with Ca2+ and Mg2+ (PBS+). During propagation, medium was changed every other day until cells reached 100% confluence. Confluent cells (myoblasts of the same cell density fully covering the surface of the dish) were then guided to post‐mitotic status, and differentiation and fusion were initiated by replacing GM with DM. In the above‐mentioned conditions, C2C12 and L6 muscle cells easily approach differentiation status, thus we were able to follow up the modifications of the differentiation process during the five or during the 10 subsequent days of incubation, respectively. During the study, freshly prepared media with or without the experimental factors were changed every 24 h for the C2C12 satellite cells or every 48 h in culture for the L6 myoblasts. All reagents were dissolved in either DMSO or in distilled‐deionized water. With regard to DMSO as solvent, the lowest DMSO concentration (0.1% v/v) in DM was used in the control system, whereas for other treatments fresh DM became the control system (Ctrl). Exactly 30 min prior to the application of water‐soluble reagents, DMSO‐dissolved reagents were added.
Treatments
Studies were conducted with the use of metabolic inhibitors, namely LY294002 and/or PD98059, to examine the effect of insulin on myogenesis and to delineate the insulin‐mediated signalling pathways that result in myotube formation. Dose–response curves were drawn for each inhibitor, including both control and insulin‐treated C2C12 muscle cells during five consecutive days of myogenesis. Furthermore, in order to assess the role of mitochondria in insulin‐mediated myogenesis, selected mitochondrial enzymes of the respiratory chain were inhibited, as well as the translation of mitochondrial proteins.
To estimate the effect of two different inhibitors of the insulin‐dependent signal transduction pathway on C2C12 or L6 myoblasts, confluent cells were washed twice with PBS, and DM was added with or without 20 µm LY294002 and/or 50 µm PD98059. Inhibitors were both dissolved in DMSO as stock solutions and were added as 0.1% (v/v) of final volume. Similarly, the effects of chloramphenicol (0.1 mg/ml) and further mitochondrial respiratory chain inhibitors – oligomycin (1 ng/ml), rotenone (10 µm), myxothiazol (1 µm) – were studied on differentiation and viability of the C2C12 cells. Insulin (1, 10 nm) was added to cell cultures after 30 min preincubation with inhibitors. Each medium was replaced with fresh medium every 24 h.
Cell viability
Assessment of cell viability, based on mitochondrial function, was determined by the ability of cells to convert soluble MTT (3‐(4,5‐dimethylthiazol‐2‐yl)‐2–5‐diphenyltetrazolium bromide) into the insoluble purple formazan reaction product. This was performed with minor modifications to the protocol described by Jacobson et al. (1994). C2C12 mouse muscle satellite cells were plated and cultured with GM in 96‐well flat‐bottomed plates until they reached confluence. Then, cells were switched to a post‐mitotic status by incubation in DM. Wells were immersed in DM (Ctrl) and experimental media for 1, 2, 3, 4 and 5 days. For this assay, during the last 4 h of incubation time, the media were replaced by MTT solution (0.5 mg/ml in DMEM without phenol red, sterilized by filtration). The MTT solution was then aspirated and formazan was instantly dissolved by addition of 100 µL DMSO. In all cases, cells were examined under phase‐contrast microscope before application of MTT to visually assess the degree of cell death (MTT uptake at 590 nm, percentages of initial control value on the first day of experiment). Percentage cell viability (MTT conversion into purple formazan, in comparison with control value of 2% HS/DMEM or 0.1% DMSO in 2% HS/DMEM) indicates rates of mitochondrial respiration or activity of mitochondrial dehydrogenases.
Alternatively, cell viability was determined on the basis of lysosomal uptake of neutral red dye. C2C12 cells were grown in 96‐well flat‐bottomed plates in GM. After reaching confluence, cells were switched to a post‐mitotic status by incubation in DM. Wells were immersed with DM (Ctrl) and experimental media for 1, 2, 3, 4 and 5 days (neutral red uptake at 550 nm, percentages of initial control value on the first day of experiment). For the last 1 h of incubation, these media were replaced by 50 µl neutral red reagent (5 mg/ml in PBS, sterilized by filtration). After incubation, the medium was aspirated and cells were washed twice with PBS. Cell monolayers were allowed to dry at ambient room temperature, and neutral red accumulated within lysosomes of living cells was dissolved by addition of 100 µl DMSO (70% in H2O). Absorbance (550 nm) in each well was measured by ELISA reader type Anthos 2010 (LABTEC Instruments, Austria). Results were expressed as percentage of initial control value (100% = 2% HS/DMEM on the first day of experiment).
Myotube formation
Cell cultures were also analysed morphologically after fixing and staining with Giemsa reagent. Mononuclear myocytes (spindle shaped) and multinuclear (3–10 myonuclei per myotube) cells as well as (10 > myonuclei per myotube) myotubes were identified using phase‐contrast microscope (Olympus BX‐20) in 10 randomly chosen microscopic fields. Apart from morphologically, the alternative method for evaluation of the rate of myotube formation was chosen.
Fusion index
Cells were grown on coverslips placed in 35 mm diameter Petri dishes. Experimental media were supplemented with nuclear stain Hoechst 33342 (bis‐benzimide; 100 µg/ml stock solution) to obtain the working solution (2 µg/ml). Cells were incubated for 15 min at 37 °C and then a mixture consisting of methanol : acetic acid (3 : 1) was added for 3 min (McKeague et al. 2003). Hoechst‐staining cells were viewed by fluorescent microscopy (Olympus BX‐60) and were compared with the same field by contrast phase highlighting. Cells were considered myotubes if they contained at least three nuclei within their cytoplasm. Numbers of nuclei within myotubes in 10 randomly selected fields were counted on each replicate slip, and the average number of all nuclei per field was calculated for each slip. Three independent experiments were performed. The fusion index was defined as the relation between the number of nuclei within myotubes and the average of the whole number of nuclei multiplied by 100%.
Cytoimmunofluorescence studies
Demonstration of the presence and intracellular location of certain regulatory proteins were based on immunocytochemical detection performed by two‐step reactions. At appropriate times, cells grown on glass coverslips were washed twice with ice‐cold PBS, fixed with methanol‐free 0.25% (w/v) paraformaldehyde in PBS for 10 min (20 °C). After three washes with PBS, cells were immersed in 70% methanol for 20 min at 4 °C. Subsequently, cells were washed twice in PBS supplemented with 1% (w/v) bovine serum albumin (PBS‐BSA). To evaluate the expression of myogenin protein, cells were immersed in 500 µl of sterile primary rabbit antimyogenin IgG antibody solution (1 : 200 (v/v) 4 µg/ml, Santa Cruz, in 1% PBS‐BSA with 0.02% (w/v) sodium azide) and were incubated for 60 min at 37 °C. Expression of the two selected protein subunits (I and IV) of COX was studied by using mouse anti‐COX I subunit and mouse anti‐COX IV subunit, IgG antibodies (4 µg/ml, Molecular Probes). Rabbit anti‐IgG antibody (Santa Cruz) served as the isotype negative control. Cells were washed five times (5×) with PBS, supplemented with 1% (w/v) bovine serum albumin (PBS‐BSA), they were then immersed in 500 µl of secondary (Alexa Fluor 488) chicken–antirabbit IgG or (Alexa Fluor 488) chicken–antimouse IgG (Molecular Probes) diluted 1 : 500 (v/v) 1 µg/ml in 1% PBS‐BSA with 0.02% (w/v) sodium azide and were incubated for 60 min at 4 °C. Cells were treated with 7′‐aminoactinomycin D (AAD; 5 µg/ml H2O, 20 min, 20 °C, in the dark) for nuclear DNA staining prior to microscopic evaluation. After a subsequent double wash with PBS, coverslips were placed on slides, covered with a drop of mounting medium (Mowiol, Calbiochem‐Novabiochem Co. La Jolla, CA, USA). Cells were observed under a confocal microscope (FV‐500 Confocal system (Olympus Poland, Warsaw, Poland)).
Visualization by confocal microscopy
C2C12 muscle cells or L6 rat myoblasts were propagated on glass coverslips and were treated (or untreated) with experimental factors present in DM. On the particular culture day, cells were washed twice with PBS+ (including Ca2+ and Mg2+) and the whole procedure of immunofluorescence examination was carried out in accordance with normal protocols. Immunostained cells were visualized using FV‐500 Confocal system (Olympus Poland, Warsaw, Poland). Fluorescence excitation was provided by 488 nm and 543 nm He‐Ne laser beams. Fluorescence was measured using a dichroic mirrors and filters for 525 nm for Alexa Fluor 488 and 610 nm for AAD. Acquired data were stored in a series of 12 bit grey images separately for each channel and were coloured artificially by appropriate software. Images were gathered as single slides.
Ultrastructural studies
Cells were fixed in 2% paraformaldehyde and 2.5% glutaraldehyde in 0.1 m sodium cacodylate buffer (pH 7.4) for 2 h at 4 °C. Next, they were washed with the same buffer and were post‐fixed in 1% OsO4 in 0.1 m sodium cacodylate buffer for 1 h. Afterwards, cells were dehydrated in graded ethanols. The C2C12 myoblasts were embedded in Epon 812 resin. After embedding and curing, ultrathin sections were cut and were mounted on formvar‐coated nickel grids; they were air dried and were stained for 10 min in 4.7% uranyl acetate and for 2 min in lead citrate. The sections were examined and photographed with a JEOL 1200XE electron microscope.
Sample preparation for electrophoresis and immunoblotting
Cells were grown in 100 mm diameter culture Petri dishes. At various times (from one to five subsequent days for mouse C2C12 satellite cells or on the second, fourth, sixth, eighth and tenth day of experimentation for the L6 myoblasts), cells were washed twice with PBS, scraped off the substrate in PBS and centrifuged. Cell pellets were stored at −80 °C to the end of the experiment. Cell pellets were resuspended in 400 µl of ice‐cold buffer (10 mm HEPES pH 7.9; 10 mm KCl; 0.1 mm EDTA; 0.1 mm EGTA; 1 mm DTT; 0.5 mm PMSF), then were incubated on ice for 15 min, after which 25 µl of a 10% solution of Igepal CA‐630 was added. After centrifugation, supernatants containing cytoplasm were transferred to fresh tubes and were stored at −20 °C. Nuclear pellets were resuspended in 200 µl RIPA buffer (1 × PBS; 1% Igepal CA‐630; 0.5% sodium deoxycholate; 0.1% SDS; aprotinin, available as a liquid from Sigma‐Aldrich Chemical Co.; 30 µl added to 1 ml of buffer; 1 mm sodium orthovanadate) and were passed through a 21‐gauge needle. PMSF (0.1 mg/ml) was added and cells were incubated for 30 min on ice. After centrifugation, nuclear lysates were stored at −80 °C until the time of analysis. Soluble protein concentrations in the cytoplasmic as well as in the nuclear fraction were determined by a protein–dye‐binding method (Bradford 1976) with a commercial reagent (Bio‐Rad Laboratories).
Electrophoresis and immunoblotting
Equal amounts of sample protein (50 µg or 30 µg) isolated from treated (see previous text) or untreated (Ctrl) mouse C2C12 or L6 muscle cells, at subsequent days of experiment, were resolved by sodium dodecyl sulphate–polyacrylamide gel electrophoresis (SDS–PAGE) followed by Western blotting. Electrotransfer of proteins to PVDF membranes (0.2 µm) was performed for 1 h at 100 V and followed by overnight blocking (4 °C) in TBS buffer (20 mm Tris, 500 mm NaCl, pH 7.5) supplemented with 5% non‐fat powdered milk. Membranes were stained with Poinceau S dye to check equal and homogeneous loading. After washing in TBS with 0.05% Tween 20 (TBST), the membranes were immunostained by standard methods provided by the manufacturer (Santa Cruz). They were probed with a primary antibody goat anti‐Akt1/2 polyclonal antiserum or rabbit anti‐Ser473‐phospho‐Akt polyclonal antiserum or rabbit antimyogenin polyclonal antiserum (Santa Cruz), or mouse anti‐COX I subunit and mouse anti‐COX IV subunit, IgG antibodies (4 µg/ml, Molecular Probes) for 1 h at 20 °C or overnight at 4 °C, washed three times in TBST and were further incubated with the secondary donkey antirabbit or donkey antigoat or donkey antimouse antibody conjugated with horseradish peroxidase (see ‘Reagents’ section). Membranes were reprobed also with goat polyclonal anti‐β‐actin antibody to normalize protein level. The blots were developed using the enhanced chemiluminescence (ECL) detection system (Amersham International, Aylesbury, UK) according to the manufacturer's protocol. After exposure photographs were taken on a Kodak DC 290 zoom digital camera and were scanned and analysed using the Kodak EDAS 290/Kodak 1D 3.5 system. If necessary, in order to study the expression of different proteins, membranes were sequentially stripped and reprobed with antibodies against proteins of similar molecular weight according to the manufacturer's protocol (Amersham International, Aylesbury, UK).
Statistical analysis
Results were statistically evaluated with one‐way anova and Tukey's multiple range test when compared to control treatments, or by two‐way anova with Benferroni post‐test to compare replicate means between the treatments. These analyses were performed using graphpad prism™ version 3.03 software (GraphPad Software Inc., San Diego, CA, USA). In order to show quantitative differences, arbitrary units, percentage of initial control value (experimental value/initial control value × 100), at each time point were used. Means that differ highly significantly (P < 0.01) are indicated by appropriate font typing. Means that differ statistically between the treatment means and the reference treatment are marked with asterisks (*P < 0.05; **P < 0.01; ***P < 0.001). Each experiment was carried out in triplicate and was repeated at least twice.
RESULTS
Insulin stimulates viability of C2C12 muscle cells mediated by PI‐3K‐ and MEK‐dependent pathways
Concentrations of 1 and 10 nm of insulin were used to draw dose–response curves. In these studies, cell viability rose dose‐dependently in response to insulin when assessed on the basis of mitochondrial respiration (MTT assay) or integrated lysosomes (neutral red) (P < 0.001). Viability curves that illustrated MTT reduction of formazan had two peaks at 10 nm of insulin, whereas the lysosomal contents of neutral red peaked later upon insulin treatment. Insulin stimulated cell viability, although the respective plots vary in slopes according to the method used. These results emphasize the importance of using a variety of methods to determine the percentage of viable cells. Additionally, in control conditions, the significant rise in the reducing potency of muscle cells was found at the final phase of myogenesis (fifth day), whereas no time‐dependent accumulation of neutral red in lysosomes was observed (Fig. 1, P > 0.05). Upon insulin treatment (10 nm), viability measured by the MTT assay peaked earlier than that assessed by neutral red (Fig. 1, P < 0.01). With respect to metabolic inhibitors, our previous studies (Kwiecińska et al. 2005) have shown that both LY294002 and PD98059 are moderately cytotoxic to C2C12 muscle cells. Additional studies have indicated that prior to myotube formation either inhibitor antagonizes insulin activity and almost completely abrogates the effects of insulin on cell viability at a concentration of 50 µm and at 20 µm for PD98059 and LY294002, respectively (Fig. 1, P < 0.001). Furthermore, during concomitant use of the above‐mentioned inhibitors, slightly additive negative effects on cell viability were observed (Fig. 1, P < 0.05). The inhibitory effect of PD98059 on cell viability disappeared at the onset of myotube formation (third to fifth day, P > 0.05).
Figure 1.
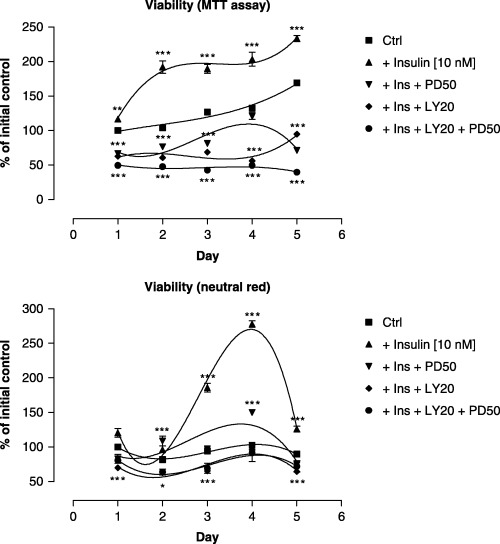
Viability assay of C2C12 cells in the presence of insulin and inhibitors of insulin signalling. Polynomial regression curves third order. Top: MTT assay; bottom: neutral red. Effect of insulin (10 nm, solid triangles), PD98059 (50 µm) being present 30 min prior to insulin (10 nm) addition (closed triangles upside down), LY294002 (20 µm) being present 30 min prior to insulin (10 nm) addition (closed diamonds), or PD98059 (50 µm) and LY294002 (20 µm) both being present 30 min prior to insulin (10 nm) addition (closed circles), Ctrl (DM, solid squares). Each experiment was performed in eight replicates and repeated at least twice with similar results.
Increased viability provoked by insulin treatment is associated with accelerated myogenesis
The above‐mentioned insulin‐mediated changes went along with elevated expression of myogenin, a transcription factor that is crucial to trigger terminal differentiation of myoblasts and muscle satellite cells (2, 4). Simultaneously, upon insulin treatment the number of nuclei found in myotubes (myonuclei) increased substantially (Fig. 3, P < 0.01). In turn, based on the morphological criteria, inhibition of PI‐3K by the respective inhibitor (LY294002) impeded insulin‐mediated myogenesis (Fig. 2). This observation was corroborated by the highly significant drop in the number of myonuclei (Fig. 3, P < 0.001). At the molecular level, myogenesis could not proceed; no myogenin protein could be detected during five subsequent days of simultaneous LY294002 treatment (Fig. 2). Unlike LY294002, the MEK inhibitor PD98059 promoted insulin‐dependent myogenin protein expression (Fig. 2). However, PD98059 treatment neither decreased nor increased insulin‐dependent formation of myotubes (Fig. 3, P > 0.05). On the contrary, insulin‐ and/or PD98059‐dependent myogenin protein expression almost completely disappeared after addition of LY294002 (Fig. 2). Clearly, the latter was accompanied by a lower number of myotubes present (Fig. 3, P < 0.001).
Figure 2.
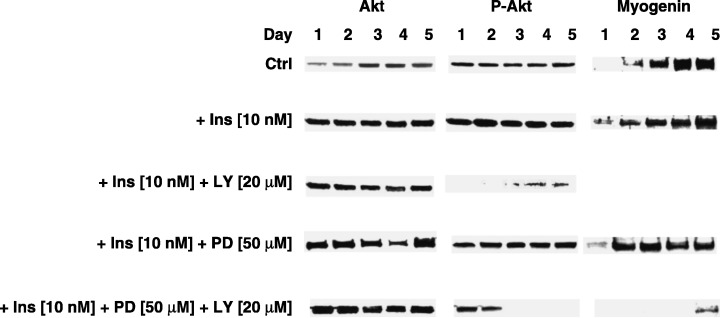
Western blot analysis of Akt, Ser473‐phospho‐Akt, and myogenin protein expression in C2C12 muscle cells during five subsequent days of experiment. From top to bottom: effect of insulin (10 nm), PD98059 (50 µm) being present 30 min prior to insulin (10 nm) addition, LY294002 (20 µm) being present 30 min prior to insulin (10 nm) addition, or PD98059 (50 µm) and LY294002 (20 µm) both being present 30 min prior to insulin (10 nm) addition. Each experiment was repeated at least twice with similar results.
Figure 4.
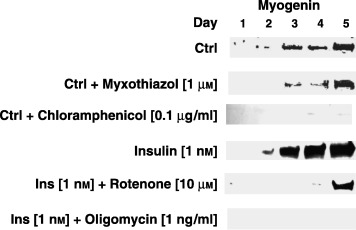
Western blot analysis of myogenin protein expression in C2C12 muscle cells during five subsequent days of experiment. From top to bottom: control, myxothiazol (1 µm), effect of chloramphenicol (0.1 mg/ml), insulin (1 nm), rotenone (10 µm) being present 30 min prior to insulin (1 nm) addition, or oligomycin (1 ng/ml) being present 30 min prior to insulin (1 nm) addition. Nuclear protein extracts (50 µg of protein per sample) isolated from treated (see the text) or not (Ctrl) mouse C2C12 muscle cells at each day of experiment were resolved by sodium dodecyl sulphate–polyacrylamide gel electrophoresis (SDS–PAGE) followed by Western blotting with rabbit antimyogenin polyclonal antiserum. After washing and additional blotting with secondary HRP‐conjugated donkey antirabbit antiserum, the blots were detected with ECL reagent (see Material and Methods). All antibodies were from Santa Cruz, CA. Each experiment was repeated at least twice with similar results.
Figure 3.
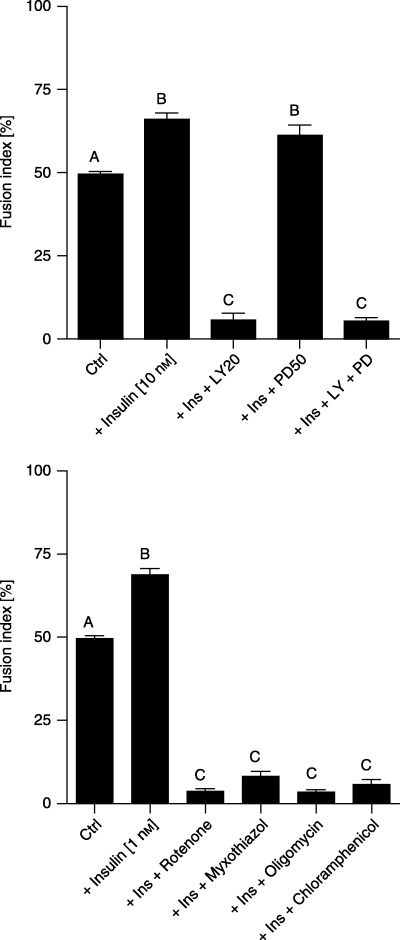
Bar charts representing fusion indices calculated at the third day of the experiment on the basis of nuclei scored in C2C12 muscle cells and myotubes. Top: effect of insulin (10 nm), PD98059 (50 µm) being present 30 min prior to insulin (10 nm) addition, LY294002 (20 µm) being present 30 min prior to insulin (10 nm) addition, or PD98059 (50 µm) and LY294002 (20 µm) both being present 30 min prior to insulin (10 nm) addition. Bottom: effect of insulin (1 nm), rotenone (10 µm) being present 30 min prior to insulin (1 nm) addition, myxothiazol (1 µm) being present 30 min prior to insulin (1 nm) addition, oligomycin (1 ng/ml) being present 30 min prior to insulin (1 nm) addition or chloramphenicol (0.1 mg/ml) being present 30 min prior to insulin (1 nm) addition. Bars that differ statistically significantly at least at level of 0.01 are ticked by different capital letter. Each experiment was performed in eight replicates and repeated at least twice with similar results.
Both insulin‐dependent myogenesis and viability are accompanied by the elevated expression of PKB/Akt protein kinase, phosphorylated at Ser473 residue
By use of Western blotting, we decided to examine intracellular signalling of insulin. Total and Ser473‐phosphorylated (active) forms of Akt1/2 protein kinase (P‐Akt) were separated and immunoblotted. The rationale for the selection of the respective insulin concentrations originated from the preliminary studies. At 10 nm, the remarkable response of muscle cells to insulin was observed in the expression of Ser473‐phosphorylated (active) form of PKB/Akt. Higher concentration of LY294002 (20 µm) was a choice substantiated by the efficacy of phosphorylation inhibition of PKB/Akt. A moderate decline in the expression of total Akt1/2 was observed exclusively if cell viability dropped significantly (Fig. 2). Otherwise, the average expression of Akt1/2 protein kinase did not differ from that in control sets. This was not the case when phospho‐Akt levels were determined by Western blot. The PI‐3K inhibitor (LY294002) dramatically diminished and delayed insulin‐dependent phospho‐Akt expression in C2C12 muscle cells. This effect was also observed in the presence of PD98059, which has been previously shown to decrease viability prior to myotube formation; however, in turn it promoted myogenin expression in untreated (Kwiecińska et al. 2005) and insulin‐treated C2C12 cells (Fig. 2).
Activity of mitochondrial enzymes of the respiratory chain affects insulin‐dependent myogenin protein expression and myotube formation
A higher concentration of insulin (10 nm) was chosen to study insulin signalling whereas a lower (1 nm) concentration was used to verify the effect on mitochondria. Insulin at 1 nm caused evident ultrastructural modifications in mitochondria observed by electron microscopy (Fig. 5), suggesting that such concentration should be exploited in the molecular studies with the inhibitors of mitochondrial enzymes. As is clearly shown in 2, 6, myogenin protein expression was stimulated by insulin (1 nm). In contrast, wherever respiratory chain enzyme inhibitors were added (myxothiazol 1 µm, rotenone 10 µm or oligomycin 1 ng/ml), insulin could hardly induce myogenin protein expression (Fig. 4). To confirm the mediating role of insulin, at least at the level of protein synthesis, translation of mitochondrial proteins was specifically inhibited by chloramphenicol (0.1 mg/ml). This time no detectable levels of myogenin were found either (Fig. 4). Nonetheless, the examination of cell viability with neutral red did not show any signs of impaired viability upon treatment with respiratory chain enzyme inhibitors. Clearly, in the same conditions, respiration measured by the MTT assay in cultured muscle cells descended with a marked fall starting at day 3 (onset of differentiation, Fig. 7). Interestingly, the number of myonuclei substantially dropped (Fig. 3, P < 0.001) when mitochondrial respiration was delayed. These results illustrate well how reduced mitochondrial activity retards myogenesis.
Figure 5.
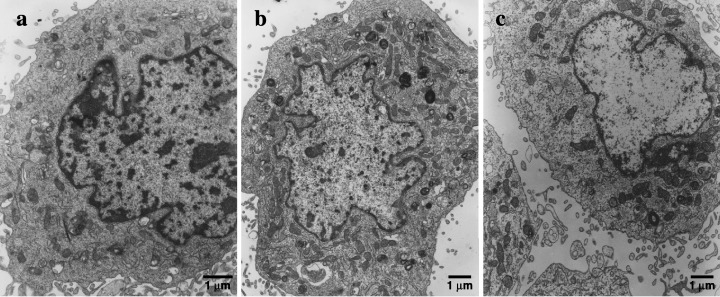
Ultrastructure of C2C12 muscle cells. Electron microscopy: evaluation of insulin‐mediated (10 nm) effect on morphological changes and spatial organization of mitochondria. (a) Control cell ultrastructurally unchanged with a large lacy nucleus, well‐developed endoplasmic reticulum, Golgi complex and mitochondria. (b) Insulin (10 nm) stimulates mitochondria to form a complex tubular network (multiple cross‐sections of mitochondria). (c) Effect of LY294002 (20 µm) being present 30 min prior to insulin (10 nm) addition abrogates insulin‐mediated effects on mitochondria. Each experiment was repeated at least twice with similar results. Bar – 1 µm.
Figure 6.
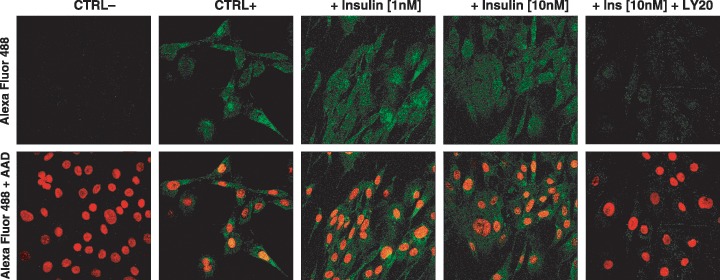
Images from confocal microscopy showing cytoplasmic and nuclear localization of myogenin protein in cell cultures of C2C12 muscle cells on the third day of experiment. Top panel: insulin induces myogenin protein expression in C2C12 muscle cells. Bottom panel: merged pictures of the same visual fields with nuclear DNA stained with AAD within the cells. From left to right: negative control (without primary antiserum, CTRL–), positive control (without insulin, CTRL+), effect of insulin (1 nm), effect of insulin (10 nm), effect of LY294002 (20 µm) being present 30 min prior to insulin (10 nm) addition. Images were gathered as single slides under 40× lens and 5× digital zoom. Typical results from two experiments are shown.
Figure 7.
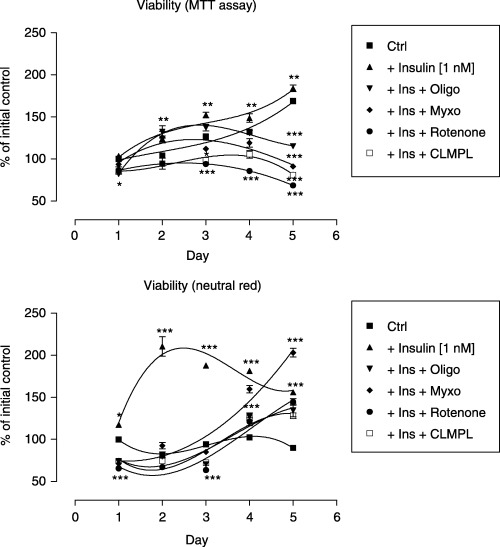
Viability assay of C2C12 cells in the presence of insulin and inhibitors of OXPHOS. Polynomial regression curves third order. Top: MTT assay; bottom: neutral red. Effect of insulin (1 nm, closed triangles) or oligomycin (1 ng/ml) being present 30 min prior to insulin (1 nm) addition (closed triangles upside down) or myxothiazol (1 µm) being present 30 min prior to insulin (1 nm) addition (closed diamonds) or rotenone (10 µm) being present 30 min prior to insulin (1 nm) addition (closed circles) or chloramphenicol (0.1 mg/ml) being present 30 min prior to insulin (1 nm) addition (open squares). Each experiment was performed in eight replicates and repeated at least twice with similar results.
Insulin accelerates and amplifies protein expression of subunits I and IV of mitochondrial COX in rat L6 muscle cells
In order to clearly demonstrate changes in the protein expression of OXPHOS, subunits I and IV of the mitochondrial COX were selected to evaluate effects of experimental factors in L6 rat myoblasts. Our previous findings have indicated that mitochondrial activity limits insulin‐dependent myogenesis from C2C12 muscle cells. It prompted us to investigate whether the reverse occurs. To do this, we initially determined the expression of subunits I and IV of mitochondrial COX in rat L6 muscle cells treated with increasing concentrations of insulin (1 or 10 nm). Insulin treatment augmented the level of these proteins and dose‐dependently accelerated the moment of their maximal expression (Fig. 8). Afterwards, we decided to add LY294002, the inhibitor of PI‐3K, which ceases insulin signalling at the level of PKB/Akt. During concomitant treatment, we observed that LY294002 delayed the summit of insulin‐dependent Ser473 phosphorylation of PKB/Akt (Fig. 8). Simultaneously, the expression of subunit I of mitochondrial COX dramatically dropped in C2C12 muscle cells and a significant fall in both protein subunits of COX was noticed in L6 rat myoblasts with LY294002 (Fig. 9a).
Figure 8.
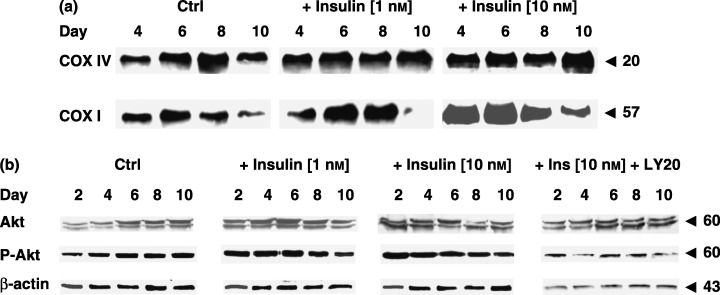
Effect of insulin (1, 10 nm) on the expression of nuclear encoded subunit IV and mitochondrial encoded subunit I of COX or Akt and Ser473‐phospho‐Akt in L6 muscle cells. (a) Western blot analysis of the nuclear encoded subunit IV and mitochondrial encoded subunit I of COX protein expression of mitochondrial COX in L6 muscle cells on the fourth, sixth, eighth and tenth day of experiment. (b) Western blot analysis of Akt and Ser473‐phospho‐Akt in L6 muscle cells on the second, fourth, sixth, eighth and tenth day of experiment. From left to the right: Ctrl, effect of insulin (1 nm) and insulin (10 nm). Each experiment was repeated at least twice with similar results.
Figure 9.
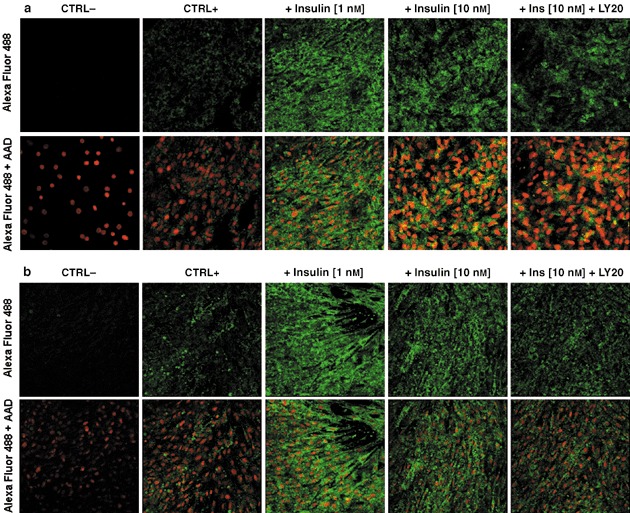
Images from confocal microscopy showing intracellular localization of subunit I (a) or subunit IV (b) of mitochondrial COX in cell cultures of L6 muscle cells on the sixth day of experiment. (a) Insulin induces subunit I protein expression of mitochondrial COX in L6 rat myoblasts. (b) Insulin induces subunit IV protein expression of mitochondrial COX in L6 rat myoblasts. Bottom panel: merged pictures of the same visual fields to show nuclei within the cells. From left: negative control (without primary antiserum, CTRL−), positive control (without insulin, CTRL+), effect of insulin (1 nm), effect of insulin (10 nm), effect of LY294002 (20 µm) being present 30 min prior to insulin (10 nm) addition. Images were gathered as single slides under 40× lens and 5× digital zoom. Typical results from two experiments are shown.
The more dynamic changes in protein expression upon insulin treatment were noticed in the mitochondria‐encoded rather than the nuclear‐encoded subunit of COX (Fig. 8). According to the immunofluorescence study, PI‐3K inhibition resulted in decreased expression of selected OXPHOS proteins (Fig. 9a,b). However, it remains to be established whether the stimulatory effect of insulin on mitochondria is mediated by signalling pathway(s) other than PI‐3K dependent.
DISCUSSION
Hitherto, some indications in humans have pointed to a link existing between muscle sensitivity to insulin, the biochemical differentiation of skeletal muscles and elevated oxidative capacity of mitochondria (Hocquette et al. 2000; Morio et al. 2001; Rimbert et al. 2004). Moreover, myogenic activity of insulin was previously reported by Cassar‐Malek et al. (1999). In in vitro experiments carried out on primary cultures of bovine myoblasts, insulin accelerated myogenesis by elevating the number of myonuclei and myotubes present. Since upon insulin treatment mitochondria were also affected, the assumption was formulated that mitochondria might contribute to the observed phenomenon. Furthermore, in adults and offspring of patients with type 2 diabetes (characterized by insulin resistance), the dysfunction of mitochondria in human skeletal muscles has been frequently reported (Kelley et al. 2002; Petersen et al. 2004). Finally, it appeared that insulin stimulates synthesis of mitochondrial rather than other (structural) proteins in skeletal muscles (Boirie et al. 2001).
Stimulation of cell viability and of myogenesis by insulin: respective roles of the different insulin signalling pathways
In our studies, the insulin dose‐dependent stimulation of both viability and myotube formation in C2C12 muscle cells was differently affected by the metabolic inhibitors of PI‐3K (LY294002) and MEK (PD98059). In respect to cell viability measured by two dissimilar methods (neutral red, MTT assay), we observed additive effects of both inhibitors on reduction of cell viability. These results suggest that insulin regulates cell viability by at least two separate pathways, namely by PI‐3K‐ and MEK‐dependent signalling cascades. In general, a straight and comprehensive picture might be drawn from the viability and myogenicity results obtained, when they are compared with the data from molecular examination in differentiating muscle cells. This shows the bidirectional control of myogenesis by insulin. First, insulin is a potent mitogen that by accelerated proliferation of undifferentiated muscle cells approximates the onset of myogenesis (Cassar‐Malek et al. 1999; Orzechowski et al. 2002). Second, insulin‐dependent stimulation of cell viability and myogenesis are dissociated between two different signalling pathways. The myogenic effect of insulin was mediated by PI‐3K (inhibited by LY294002, Fig. 6) and accelerated at molecular level by inhibition of MEK (PD98059), a dual specificity kinase, and upstream to MAPK ERK1/2 (Fig. 2). Summing up, it locates at least two insulin‐dependent signalling pathways that are antagonistic in respect to myogenesis but in turn are agonistic with regard to cell viability (Fig. 1). In contrast to PI‐3K pathway, which seems to be crucial for insulin‐mediated myogenesis and cell viability, just viability of muscle cells was stimulated by the insulin‐dependent MAPK pathway. The latter was limited, however, to the period of cell propagation rather than myotube formation (myogenesis) (Fig. 1). Similar observations have been found by others (Sarbassov et al. 1997; Sarbassov & Petersen 1998) who were led to nearly identical conclusions on the role of PI‐3K and MAPK ERK1/2 in myogenesis.
Inhibition of insulin action by LY294002 was monitored at the level of PKB/Akt, which is an indirect target of PI‐3K (Scheid et al. 2002), essential to support viability and myogenesis of muscle cells (Fig. 1, P < 0.01). The positive effects of insulin on viability and myogenesis were always accompanied by the elevated level of Akt, phosphorylated at Ser473 residue, whereas addition of LY294002 inhibitor led to delayed phosphorylation of Akt protein (Fig. 2, P < 0.01). PI‐3K and MEK inhibitors were highly specific, since no changes in the expression of P‐Akt were observed after individual PD98059 application, nor did concomitant use of both inhibitors affect the consequences of LY294002 action (Fig. 2, P > 0.05).
Stimulation of mitochondrial enzyme expression by insulin
Modulation of insulin action by metabolic inhibitors altered the expression of selected protein subunits of the mitochondrial respiratory chain enzymes (OXPHOS). Insulin raised and accelerated protein expression of subunits I and IV of the mitochondrial COX, which is in agreement with our hypothesis that by this route, insulin might play a decisive role in cellular energy production (Fig. 8). In contrast to insulin, the PI‐3K inhibitor lessened the expression of the above‐mentioned proteins that are known to be coded by genomic (subunit IV) and mitochondrial (subunit I) DNA, respectively (Fig. 9a,b). Delayed expression of P‐Akt protein in the insulin‐treated L6 muscle cells upon cotreatment with PI‐3K inhibitor was associated with the marked reduction of subunit I of the COX protein on the sixth day of experimental treatment (Fig. 9a). It is not clear, however, what is the exact molecular mechanism of insulin‐stimulated PI‐3K‐dependent protein expression of COX. In the short‐term (acute) study performed on primary cultures of muscle cells (Bijur & Jope 2003), insulin‐mediated activation of PKB/Akt caused intramitochondrial translocation of this serine‐threonine kinase, resulting in phosphorylation of several proteins including mitochondrial glycogen kinase synthase‐3 beta (GSK‐3β), which is known to be crucial for the genomic activity of insulin. It is well known that inactivation of GSK‐3β by PKB/Akt allows insulin to positively regulate its target genes (Grimes & Jope 2001). Thus, insulin by a PI‐3K‐dependent mechanism activates PKB/Akt that releases transcription and translation mechanisms from the GSK‐3β‐mediated repression. Whether this signalling pathway also activates genes coding for mitochondrial proteins is a matter of debate and needs more intensive investigation.
Mitochondria are intracellular organelles featured by a complex spatial organization with a network architecture determined by mitofusin proteins (Bach et al. 2003). Despite their role as a mitochondrial fusion proteins that allow mitochondria to form tubular structures, Mfn‐2 (mitofusin 2) protein has been reported to induce production of the subunits of complexes I, IV and V (Pich et al. 2005). Furthermore, recently, Bach et al. (2005) observed that along with the delayed myogenesis, insulin resistance in human skeletal muscles because of type 2 diabetes, obesity, weight loss or experimentally induced by tumour necrosis factor alpha and interleukin‐6 have all caused profound reduction in the expression of Mfn‐2 protein. In contrast, Mfn‐1/2 expression increased in human skeletal muscle in response to physical exercise (Cartoni et al. 2005). In addition to their regulatory role in mitochondrial fusion, Mfn proteins have also been shown to be essential for embryonic development (Chen et al. 2003). It should be emphasized that some years ago, Bakeeva et al. (1981) reported that in contrast to adulthood in embryonic stages, skeletal muscle mitochondria fuse to form tubular networks. Whether this phenomenon functions in response to insulin activity remains unknown and as yet is highly speculative. In any case, insulin is widely accepted to play a critical role in embryonic and fetal muscle growth. One has to bear in mind that in serum deprived cultured muscle cells autocrine and paracrine mechanisms are decisive for the commitment of muscle cells to fuse into myotubes (Sarbassov et al. 1997). It is of prime importance, therefore, that in our experiments insulin was present in concentrations far above those found physiologically, competing with the cytokines secreted intrinsically.
Mitochondria are essential for insulin‐mediated myogenesis
It has previously been reported that thyroid hormones stimulate mitochondria that in turn accelerate myogenesis (Rodier et al. 1999; Rochard et al. 2000). Moreover, some authors (Rochard et al. 2000; Bijur & Jope 2003) also have suggested a causal relationship between insulin action and mitochondrial activity. These presumptions are substantiated by the well‐known anabolic effect of insulin. It is clear from our studies that the insulin‐stimulated viability of muscle cells declined if activity of selected OXPHOS enzymes were individually inhibited (Fig. 7, P < 0.001). Even then, however, neither inhibitor appeared cytotoxic if assessed by neutral red (Fig. 7, P > 0.05). Thus, except for marked reduction, no differences were found in cell viability measured by MTT assay and expression of molecular markers of insulin action, regardless of OXPHOS system restricted (complex I or complex III or complex V inhibited by rotenone, myxothiazol or oligomycin, respectively). Overall, it was mitochondrial respiration rather than particular step‐limiting enzyme in respiratory cascade that was apparently fundamental for insulin‐dependent myogenesis. Limitations were equivocally relevant to insulin signalling (Fig. 2) with the resultant loss of myogenin (Fig. 4) and highly significant reduction in the number of myonuclei (Fig. 3).
Some molecular indices have pointed to energy homeostasis restraining muscle development as well as supporting muscle protein sythesis (Dennis et al. 2001; Tokunaga et al. 2004). It should be reminded that whenever in our studies mitochondrial function was depressed, the level of myogenin, the molecular marker of terminal differentiation of muscle cells also dropped (Fig. 4). These results are strikingly similar to those obtained with PI‐3K inhibitor that also markedly reduced insulin‐dependent myogenin protein (Fig. 2). mTOR is downstream to PI‐3K and PKB/Akt, but upstream to p70s6k, so we speculate that mitochondria are essential for insulin‐mediated protein synthesis. This might be a common feature and identity for other factors that positively regulate anabolic functions.
A deeper understanding of the role of mitochondria in insulin‐dependent myogenesis may have important implications for the prevention and treatment of diabetic myopathy. Recently, Mikula et al. (2005) showed that myogenesis from L6 rat myoblasts is accelerated by insulin and accompanied by induction of mitochondrial genes. Even though in non‐myogenic cells Ostrowski et al. (2004) have reported that insulin‐induced expression of mitochondrial uncoupling protein 2 is potentiated by ribonucleoprotein K. This study aims to better understand how modulators of mitochondrial functions could affect muscle growth and provide alternative systems to sustain myogenesis. The novel results brought by this study are the clear demonstration of mitochondrial role in insulin‐dependent myogenesis.
Summing up, the results obtained from our experiments support the working hypothesis that mitochondria play an indispensable role in insulin‐dependent myogenesis. Moreover, we have observed that insulin positively affects mitochondrial function by induction of OXPHOS enzymes. The latter provides energy that is essential for insulin to induce several biological reactions that are termed anabolic. It adds a further insulin‐dependent late metabolic effect mediated by oxidative phosphorylation, irrespective of the fast effects evoked by insulin sensitizers on mitochondrial ATP‐regulated potassium channels (mitoKATP channels), which have been shown to modulate mitochondrial oxidative phosphorylation in L6 muscle cells (Debska et al. 2002).
ACKNOWLEDGEMENTS
We are grateful to Dr Michal, Marck Godlewski for his kind assistance in confocal microscopy. Support for this work was partially provided by a grant no. 2 P06D 015 29 and grant no. 117/E‐385/SPB/COST/P‐06/DWM from the State Committee for Scientific Research in Poland. This study was performed in the frame of COST 925 Action on ‘The importance of prenatal events for postnatal muscle growth in relation to the quality of muscle based foods’.
REFERENCES
- Bach D, Naon D, Pich S, Soriano F, Vega N, Rieusset J, Laville M, Guillet C, Boirie Y, Wallberg‐Henricksson H, Manco M, Calvati M, Castagneto M, Palacin M, Mingrone G, Zierath JR, Vidal H, Zorzano A (2005) Expression of Mfn2, the Charcot‐Marie‐Tooth neuropathy type 2A gene, in human skeletal muscle: effects of type 2 diabetes, obesity, weight loss, and the regulatory role of tumor necrosis factor alpha and interleukin‐6. Diabetes 54, 2685–2689. [DOI] [PubMed] [Google Scholar]
- Bach D, Pich S, Soriano FX, Vega N, Baumgartner B, Oriola J, Daugaard JR, Lloberas J, Camps M, Zierath JR, Rabasa‐Lhoret R, Wallberg‐Henriksson H, Laville M, Palacin M, Vidal H, Rivera F, Brand M, Zorzano A (2003) Mitofusin‐2 determines mitochondrial network architecture and mitochondrial metabolism. J. Biol. Chem. 278, 17190–17197. [DOI] [PubMed] [Google Scholar]
- Bakeeva LE, Chentsov YS, Skulachev VP (1981) Ontogenesis of mitochondrial reticulum in rat diaphragm muscle. Eur. J. Cell Biol. 25, 175–181. [PubMed] [Google Scholar]
- Bennet AM, Tonks NK (1997) Regulation of distinct stages of skeletal muscle differentiation by mitogen‐activated protein kinases. Science 278, 1288–1291. [DOI] [PubMed] [Google Scholar]
- Bijur GN, Jope RS (2003) Rapid accumulation of Akt in mitochondria following phosphatidylinositol 3‐kinase activation. J. Neurochem. 87, 1427–1435. [DOI] [PMC free article] [PubMed] [Google Scholar]
- Boirie Y, Short KR, Ahlman B, Charlton M, Nair KS (2001) Tissue‐specific regulation of mitochondrial and cytoplasmic protein synthesis rates by insulin. Diabetes 50, 2652–2658. [DOI] [PubMed] [Google Scholar]
- Bradford MM (1976) A rapid and sensitive method for the quantification of microgram quantities of protein utilizing the principle of protein dye binding. Anal Biochem. 72, 248–254. [DOI] [PubMed] [Google Scholar]
- Cartoni R, Leger B, Hock MB, Praz M, Crettenand A, Pich S, Ziltener J‐L, Luthi F, Deriaz O, Zorzano A, Gobelet C, Kralli A, Russell AP (2005) Mitofusins 1/2 and ERRα expression are increased in human skeletal muscle after physical exercise. J. Physiol. 567 (1), 349–358. [DOI] [PMC free article] [PubMed] [Google Scholar]
- Cassar‐Malek I, Langlois N, Picard B, Geay Y (1999) Regulation of bovine satellite cell proliferation and differentiation by insulin and triiodothyronine. Domest. Anim. Endocrinol. 17, 373–388. [DOI] [PubMed] [Google Scholar]
- Chen H, Detmer SA, Ewald AJ, Griffin EE, Fraser SE, Chan DC (2003) Mitofusins Mfn1 and Mfn2 coordinately regulate mitochondrial fusion and are essential for embryonic development. J. Cell Biol. 160, 189–200. [DOI] [PMC free article] [PubMed] [Google Scholar]
- Debska G, Kicinska A, Skalska J, Szewczyk A, May R, Elger CE, Kunz WS (2002) Opening of potassium channels modulates mitochondrial function in rat skeletal muscle. Bioch. Biophys. Acta 1556, 97–105. [DOI] [PubMed] [Google Scholar]
- Dennis PB, Jaeschke A, Saitoh M, Fowler B, Kozma SC, Thomas G (2001) Mammalian TOR: a homeostatic ATP sensor. Science 294, 1102–1105. [DOI] [PubMed] [Google Scholar]
- Dudley DT, Pang L, Decker SJ, Bridges AJ, Saltiel AR (1995) A synthetic inhibitor of the mitogen‐activated protein kinase cascade. Proc. Natl Acad. Sci. USA 92, 7686–7689. [DOI] [PMC free article] [PubMed] [Google Scholar]
- Florini JR, Ewton DZ, Magri KA, Mangiacapra FJ (1993) IGFs and muscle differentiation. Adv. Exp. Med. Biol. 343, 319–326. [DOI] [PubMed] [Google Scholar]
- Gredinger E, Gerber AN, Tamir Y, Tapscott SJ, Bengal E (1998) Mitogen‐activated protein kinase pathway is involved in the differentiation of muscle cells. J. Biol. Chem. 273, 10436–10444. [DOI] [PubMed] [Google Scholar]
- Grimes CA, Jope RS (2001) The multifaceted roles of glycogen synthase kinase‐3β in cellular signaling. Prog. Neurobiol. 65, 391–426. [DOI] [PubMed] [Google Scholar]
- Hargreaves IP, Heales SJR, Land JM (1999) Mitochondrial respiratory chain defects are not accompanied by an increase in the activities of lactate dehydrogenase or manganese superoxide dismutase in paediatric skeletal muscle biopsies. J. Inherit. Metab. Dis. 22, 925–931. [DOI] [PubMed] [Google Scholar]
- Hocquette J‐F, Piot C, Jurie C, Picard B (2000) Metabolic differentiation of bovine cardiac and skeletal muscles during foetal development. Proceedings of International Congress of Myology, Nice, France, p. 85.
- Huang X, Eriksson K‐F, Vaag A, Lehtovirta M, Hansson M, Laurila E, Kanninen T, Olesen BT, Kurucz I, Koranyi L, Groop L (1999) Insulin‐regulated mitochondrial gene expression is associated with glucose flux in human skeletal muscle. Diabetes 48, 1508–1514. [DOI] [PubMed] [Google Scholar]
- Jacobson MD, Burne JF, Raff MC (1994) Programmed cell death and Bcl‐2 protection in the absence of a nucleus. EMBO J. 13, 1899–1910. [DOI] [PMC free article] [PubMed] [Google Scholar]
- Kaliman P, Canicio J, Testar X, Palacin M, Zorzano A (1999) Insulin‐like growth factor II, phosphatidylinositol 3 kinase, nuclear factor‐κB and inducible nitric‐oxide synthase define a common myogenic signaling pathway. J. Biol. Chem. 274, 17437–17444. [DOI] [PubMed] [Google Scholar]
- Kaliman P, Vinals F, Testar X, Palacin M, Zorzano A (1996) Phosphatidylinositol 3‐kinase inhibitors block differentiation of skeletal muscle cells. J. Biol. Chem. 271, 19146–19151. [DOI] [PubMed] [Google Scholar]
- Kelley DE, He J, Menshikova EV, Ritov VB (2002) Dysfunction of mitochondria in human skeletal muscle in type 2 diabetes. Diabetes 51, 2944–2950. [DOI] [PubMed] [Google Scholar]
- Kwiecińska P, Roszkiewicz B, Łokociejewska M, Orzechowski A (2005) Elevated expression of NF‐κB and Bcl‐2 proteins in C2C12 myocytes during myogenesis is affected by PD98059, LY294002 and SB203580. Cell Biol. Int. 29, 319–331. [DOI] [PubMed] [Google Scholar]
- McKeague AL, Wilson DJ, Nelson J (2003) Staurosporine‐induced apoptosis and hydrogen peroxide‐induced necrosis in two human breast cell lines. Br. J. Cancer. 88, 125–131. [DOI] [PMC free article] [PubMed] [Google Scholar]
- Mikula M, Dzwonek A, Hennig EE, Ostrowski J (2005) Increased mitochondrial gene expression during L6 cell myogenesis is accelerated by insulin. Int. J. Biochem. Cell Biol. 37, 1815–1828. [DOI] [PubMed] [Google Scholar]
- Morio B, Hocquette J‐F, Montaurier C, Boirie Y, Bounteloup‐Demange C, McCormack C, Fellmann N, Beaufrere B, Ritz P (2001) Muscle fatty acid oxidative capacity is a determinant of whole body fat oxidation in elderly people. Am. J. Physiol. Endocrinol. Metab. 280, E143–E149. [DOI] [PubMed] [Google Scholar]
- Orzechowski A, Łokociejewska M, Muras P, Hocquette J‐F (2002) Preconditioning with millimolar concentrations of vitamin C or N‐acetylcysteine protects L6 muscle cells insulin‐stimulated viability and DNA synthesis under oxidative stress. Life Sci. 71, 1793–1808. [DOI] [PubMed] [Google Scholar]
- Ostrowski J, Klimek‐Tomczak K, Wyrwicz LS, Mikula M, Schullery DS, Bomsztyk K (2004) Heterogenous nuclear ribonucleoprotein K enhances insulin‐induced expression of mitochondrial UCP2 protein. J. Biol. Chem. 279, 54599–54609. [DOI] [PubMed] [Google Scholar]
- Petersen KF, Dufour S, Befroy D, Garcia R, Shulman GI (2004) Impaired mitochondrial activity in the insulin‐resistant offspring of patients with type 2 diabetes. N. Engl. J. Med. 12, 664–671. [DOI] [PMC free article] [PubMed] [Google Scholar]
- Picard B, Depreux F, Geay Y (1998) Muscle differentiation of normal and double‐muscled bovine foetal myoblasts in primary culture. Basic Appl. Myol. 8, 197–203. [Google Scholar]
- Picard B, Lefaucheur L, Berri C, Duclos MJ (2002) Muscle fibre ontogenesis in farm animal species. Reprod. Nutr. Dev. 42, 415–431. [DOI] [PubMed] [Google Scholar]
- Pich S, Bach D, Briones P, Liesa M, Camps M, Testar X, Palacin M, Zorzano A (2005) The Charcot‐Marie‐Tooth type 2A gene product, Mfn2, up‐regulates fuel oxidation through expression of OXPHOS system. Hum. Mol. Genet. 14, 1405–1415. [DOI] [PubMed] [Google Scholar]
- Rimbert V, Boirie Y, Bedu M, Hocquette J‐F, Ritz P, Morio B (2004) Muscle fat oxidative capacity is not impaired by age but by physical inactivity: association with insulin sensitivity. FASEB J. 10, 1096–1104. [DOI] [PubMed] [Google Scholar]
- Rochard P, Rodier A, Casas F, Cassar‐Malek I, Marchal‐Victorion S, Daury L, Wrutniak C, Cabello G (2000) Mitochondrial activity is involved in the regulation of myoblast differentiation through myogenin expression and activity of myogenic factors. J. Biol. Chem. 275, 2733–2744. [DOI] [PubMed] [Google Scholar]
- Rodier A, Marchal‐Victorion S, Rochard P, Casas F, Cassar‐Malek I, Rouault J‐P, Magaud J‐P, Mason DY, Wrutniak C, Cabello G (1999) BTG1: a triiodothyronine target involved in the myogenic influence of the hormone. Exp. Cell Res. 249, 337–348. [DOI] [PubMed] [Google Scholar]
- Sarbassov D, Jones LG, Petersen CA (1997) Extracellular signal‐regulated kinase‐1 and ‐2 respond differently to myogenic and differentiative signaling pathways in myoblasts. Mol. Endocrinol. 11, 2038–2047. [DOI] [PubMed] [Google Scholar]
- Sarbassov D, Petersen CA (1998) Insulin receptor substrate‐1 and phosphatidylinositol 3‐kinase regulate kinase‐dependent and independent signaling pathways during myogenic differentiation. Mol. Endocrinol. 12, 1870–1878. [DOI] [PubMed] [Google Scholar]
- Scheid MP, Marignani PA, Woodgett JR (2002) Multiple phosphoinositide 3‐kinase‐dependent steps in activation of protein kinase B. Mol. Cell Biol. 22, 6247–6260. [DOI] [PMC free article] [PubMed] [Google Scholar]
- Stump CS, Short KR, Bigelow ML, Schimke JM, Nair KS (2003) Effect of insulin on human skeletal muscle mitochondrial ATP production, protein synthesis, and mRNA transcripts. Proc. Natl Acad. Sci. USA 100, 7996–8001. [DOI] [PMC free article] [PubMed] [Google Scholar]
- Sumitani S, Goya K, Testa JR, Kouhara H, Kasayama S (2002) Akt1 and Akt2 differently regulate muscle creatine kinase and myogenin gene transcription in insulin‐induced differentiation of C2C12 myoblasts. Endocrinology 143, 820–828. [DOI] [PubMed] [Google Scholar]
- Tokunaga C, Yoshino K, Yonezawa K (2004) mTOR integrates amino acid‐ and energy‐sensing pathways. Biochem. Biophys. Res. Commun. 313, 443–446. [DOI] [PubMed] [Google Scholar]
- Vlahos C, Matter WF, Hui KY, Brown RF (1994) A specific inhibitor of phosphatidylinositol 3‐kinase, 2‐[4‐morpholinyl]‐8‐phenyl‐4H‐1‐benzopyran‐4‐one [LY294002]. J. Biol. Chem. 269, 5241–5248. [PubMed] [Google Scholar]
- Wrutniak‐Cabello C, Casas F, Cabello G (2001) Thyroid hormone action in mitochondria. J. Mol. Endocrinol. 26, 67–77. [DOI] [PubMed] [Google Scholar]
- Zheng CF, Guan KL (1993) Cloning and characterization of two distinct human extracellular signal‐regulated kinase activator kinases, MEK1 and MEK2. J. Biol. Chem. 268, 11435–11439. [PubMed] [Google Scholar]