Abstract
Objectives
Human CAP10‐like protein 46 kDa (hCLP46), also known as Poglut1, has been shown to be an essential regulator of Notch signalling. hCLP46 is overexpressed in primary acute myelogenous leukaemia, T‐acute lymphoblastic leukaemia samples and other leukaemia cell lines. However, effects of hCLP46 overexpression, up to now, have remained unknown.
Materials and methods
In this study, we established stable 293TRex cell lines inducibly overexpressing hCLP46, and knocked down hCLP6 with a specific small interfering RNA to explore function of the protein in Notch signalling and cell proliferation.
Results
hCLP46 overexpression enhanced Notch1 activation in 293Trex cells in a ligand‐dependent manner, with increased Notch signalling enhancing Hes1 expression. We further verified that overexpression of hCLP46 inhibited proliferation of 293TRexs and was correlated with increases in cyclin dependent kinase inhibitors p21 and p27, whereas reduced hCLP46 expression moderately increased cell proliferation. In addition, p21 and p27 protein levels were higher when Notch signalling was activated by EDTA treatment.
Conclusions
Taken together, hCLP46 enhanced Notch activation and inhibited 293TRex cell proliferation through CDKI signalling.
Introduction
Previously we have identified hCLP46 (human Cap10‐like protein 46 kDa) in human acute myelogenous leukaemia, transformed from myelodysplastic syndrome CD34+ cells 1, and proved it to be a potential biomarker for leukaemia 2. Acar et al. have reported that Rumi is Drosophila homologue of hCLP46 and adds a glucose moiety to serine residues in Notch EGF repeats 3. Later, hCLP46 was also shown to be an O‐glucosyltransferase required for embryonic development and Notch signalling in mammals 1, 4. Lack of hCLP46 leads to impaired ligand‐induced Notch activation without affecting Notch ligand binding 2, 5. Recently, hCLP46 also has been proven to be an O‐xylosyltransferase and an inverting enzyme 6. These studies demonstrate the important role of hCLP46 in development and pathogenic outcome when misregulated in leukaemia.
Core components of Notch signalling are transmembrane ligands (Delta and Jagged) and receptors (Notch1‐4 in mammals) and transcription factor CSL (C‐promotor‐binding factor in mammals) 7. Notch receptors can be modified by two unusual forms of O‐glycosylation, O‐glucose and O‐fucose. Fringe glycosyltransferases (LFng, lunatic fringe; MFng, manic fringe; and RFng, radical fringe) extend O‐fucose on Notch by adding additional sugar moieties 8. In canonical Notch signalling, ligand–receptor interactions promote two proteolytic cleavage events in Notch receptors, which are separately mediated by ADAM (disintegrin and metalloprotease) and γ‐secretase 7, 9, 10, 11. Second cleavage releases the Notch intracellular domain, which subsequently translocates to the nucleus and associates with CSL to form a transcription complex that activates downstream target genes. Basic helix‐loop‐helix (bHLH) genes of HES/HEY families are best characterized Notch targets and the first genes demonstrated to have altered transcription following Notch activation, providing a key paradigm for unravelling the Notch pathway 11. Notch activation elicits diverse outputs, such as proliferation, apoptosis and cell fate decisions 12.
Cell cycle progression is governed by a series of cyclin‐dependent kinases (CDKs), which are in turn regulated by CDK inhibitors (CDKIs) 13. p21 and p27 proteins (Kip/Cip members of the CDKI family), are capable of binding to and inhibiting most cyclin/CDK complexes 13. Expression of p21 and p27 is dependent on up‐stream signalling events, such as Notch signalling 12.
Our previous work has suggested that overexpression of hCLP46 might be an early event in pathogenesis of acute myelogenous leukaemia (AML) and T‐acute lymphoblastic leukaemia (T‐ALL) 2; however, causative mechanisms are still largely unknown. Here, we aimed to explore molecular effects elicited by hCLP46 overexpression.
Materials and methods
Materials
hCLP46 open reading frame (ORF) was amplified by PCR and inserted into the pcDNA4/TO/Myc vector (T‐Rex System; Invitrogen, Carlsbad, CA, USA) using BamHI and XhoI sites incorporated into primers (underlined) (forward primer, 5′‐AAAGGATCCGCCACCATG GAGTGGTGGGCTAGC‐3′, and reverse primer, 5′‐ATCCTCGAGCGTAGTTCAGT TTTCAA‐3′). An expression construct encoding human Jagged1 (hJ1) in an LZRS‐linker‐IRES‐enhanced green fluorescent protein (eGFP) retrovirus and the empty vector (Emp) were kindly provided by Dr Leonor Parreira 14. All constructed plasmids were prepared using Plasmid Midi Kits (Qiagen, Hilden, Germany). hCLP46‐specific siRNA and negative‐control siRNA (Nc) were produced as previously described 5.
Antibodies against the following proteins were used: cleaved Notch1 (NICD, Val1744) and Myc‐tag (Cell Signaling Technology, Danvers, MA, USA); p21 and p27 (Santa Cruz Biotechnology, Santa Cruz, CA, USA); β‐actin (Proteintech Group, Chicago, IL, USA); and Hes‐1 (Aviva Systems Biology, San Diego, CA, USA). Anti‐rabbit and anti‐mouse horseradish peroxidase‐conjugated antibodies were also used (KPL, Gaithersburg, MD, USA).
Cell culture and transfections
293TRex and 293T cells (Invitrogen) were cultured in Dulbecco's modified Eagle's medium (DMEM; Gibco BRL, Gaithersburg, MD, USA) supplemented with 10% FBS. Cells were maintained at 37 °C under humidified conditions and 5% CO2. siRNA and plasmids were transfected using Lipofectamine 2000 (Invitrogen) according to the manufacturer's instructions.
Establishment of inducible hCLP46 cells
293TRex cells, which stably express the repressor of the Tet (tetracycline) operon, were transfected with pcDNA4/TO/myc‐hCLP46 and chosed for zeocin resistance. Individual clones were selected, expanded and tested for tetracycline‐inducible hCLP46 overexpression, by immunoblotting.
Immunoblotting
Cell lysates were prepared by resuspending cell pellets in lysis buffer containing 20 mm Tris‐HCl (pH 7.5), 150 mm NaCl, 0.25% NP‐40, 10% glycerol, 1 mm EDTA, 1 mm DTT, 5 mm sodium fluoride, 1 mm sodium orthovanadate, and 1 mm phenylmethyl sulphonylflouride. Equal amounts of protein were loaded on SDS‐PAGE gels, electrophoretically separated and transferred to PVDF membranes using standard procedures. Membranes were blocked with 5% non‐fat milk then probed with indicated antibodies overnight at 4 °C. Membranes were then washed and incubated for 1 h with horseradish peroxidase (HRP)‐conjugated secondary antibody at room temperature for 1 h. Signals were detected using a chemiluminescence detection system. Experiments were repeated at least three times.
Cell viability/proliferation
293TRex‐hCLP46 cells were inoculated in 24‐well culture plates (Greiner, Frickenhausen, Germany), and cell viability/proliferation was evaluated by reduction of MTT tetrazolium salt [3‐(4, 5‐dimethylthiazol‐2‐yl)‐2, 5‐diphenyltetrazolium bromide] (0.5 mg/ml) by viable cells to form purple formazan product after 4 h incubation. Experiments were performed in triplicate on days 1–7, as previously described 15, and repeated at least three times.
Apoptotic analysis of hCLP46‐overexpressing and down‐regulated 293Trex cells
Apoptosis was assessed using annexin V, a protein that binds to phosphatidylserine (PS) residues that become exposed on surfaces of apoptotic cells. Cells derived from stable cell lines, transfectants and controls were washed in PBS and stained with fluorescent isothiocyanate‐labelled annexin V and PI (Annexin V‐FITC Apoptosis Detection Kit; Biosea, Beijing, China). Cells were immediately analysed by fluorescence‐activated cell sorting (FACS; BD, San Jose, CA, USA) for PI+, PI−, annexin V+ and annexin V− cells, and the analysis was repeated to ensure accuracy of results. The experiments were performed in triplicate.
EDTA treatment of cells
EDTA treatment to activate Notch signalling was performed as previously described 8. Briefly, cells were washed once in PBS and incubated in either PBS or PBS containing 5 mm EDTA, for 10 min at 37 °C. After being washed three times in PBS, cells were incubated in DMEM + 10% FBS at 37 °C for 30 min, the protein level of NICD was analysed by immunoblotting. To measure EDTA‐induced p21 and p27 expression, incubation time was increased to 6 h before proteins were extracted.
Ligand‐dependent Notch signalling assay
A co‐culture experiment was utilized, as previously described 8. In brief, 293T cells were transfected with hJ1 or Emp, 43 h before co‐culturing, and 293TRex‐hCLP46 was administered with or without Tet as indicated. At time of co‐culture, hJ1 or Emp cells were removed by trituration in DMEM + 10% FBS and overlaid on 293TRex‐hCLP46 cells. Co‐cultures were incubated for 5 h at 37 °C.
Immunofluorescence
For immunostaining, cells were rinsed once in PBS and fixed for 15 min in 4% paraformaldehyde/PBS. Then they were rinsed three times in PBS and stained in DAPI for 15 min. After rinsing three times in PBS, permeabilization was achieved in 0.4% Triton X‐100/PBS for 20 min. Antibody (NICD, Val1744) incubation was performed in PBS for 1 h, following blocking in 10% serum/PBS for 10 min. After being rinsed in PBS, cells were incubated in FITC‐coupled goat anti‐rabbit IgG for 45 min, then rinsed three times in PBS. Confocal images were taken using a Confocal Laser Scanning Biological Microscope FV1000‐IX81 (Olympus, Tokyo, Japan).
RNA extraction and expression analysis
Total RNA from 293TRex cells that had undergone indicated treatment was isolated using Trizol (Invitrogen). For reverse transcription and polymerase chain reaction (RT‐PCR), first‐strand cDNA was synthesized from 1 μg of total RNA using the ReverTraAce®qPCR RT Kit (Toyobo, Osaka, Japan) according to the supplier's manual. Quantitative RT‐PCR was performed as described previously 2 using a QuantiTect™ SYBR green PCR method (Toyobo) and an Mx3000P instrument (Stratagene Laboratories, La Jolla, CA, USA). Sequences of primers for qPCR are listed in Table 1. Expression levels of detected genes were normalized to the internal control, β‐actin. Experiments were performed in triplicate and repeated at least three times.
Table 1.
Sequences of the primers for qPCR
| Gene | Forward primers | Reverse primers |
|---|---|---|
| p21 | 5′‐GGACAGCAGAGGAAGACCATGT‐3′ | 5′‐TTTCGACCCTGAGAGTCTCCAG‐3′ |
| p27 | 5′‐GGCTAACTCTGAGGACACGCAT‐3′ | 5′‐TGCAGGTCGCTTCCTTATTCC‐3′ |
| hCLP46 | 5′‐GATATCATGTATCCTGCTTG‐3′ | 5′‐TTTTCCATGGCCACTGTGCTG‐3′ |
| Hes1 | 5′‐TGATTTTGGATGCTCTGAAGAAAGATA‐3′ | 5′‐GCTGCAGGTTCCGGAGGT‐3′ |
| β‐actin | 5′‐GTGACGTGGACATCCGCAAAGAC‐3′ | 5′‐TCAAGAAAGGGTGTAACGCAACTAA‐3′ |
Statistical analysis
Differences between control and target data sets were determined using independent sample t‐tests, with P‐values less than or equal to 0.05 being considered statistically significant.
Results
Generation of a stable cell line overexpressing hCLP46
Stable zeocin‐resistant clones expressing high levels of hCLP46 on addition of Tet were isolated and characterized (Fig. 1a). Clone 1, which displayed pronounced induction of hCLP46, at both the protein and mRNA levels, only in the Tet‐treated cells (Fig. 1b and 1c), was called 293TRex‐hCLP46 and used in the subsequent experiments. hCLP46 was reproducibly increased to a similar level in the same concentration of Tet in 293TRex‐hCLP46 cells (Fig. S1).
Figure 1.
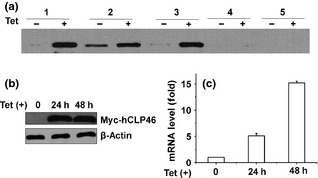
Generation of a stable cell line inducibly overexpressing hCLP 46. (a) Proteins from five 293TRex‐hCLP46 cell clones incubated in absence or presence of 0.5 μg/ml Tet, were subjected to immunoblotting analyses to detect exogenous hCLP46, using an anti‐Myc antibody. Protein level of exogenous hCLP46 (b) and mRNA level of hCLP46 (c) were assayed in clone 1 after 24 and 48 h of Tet induction.
hCLP46 enhanced Notch activation in a ligand‐dependent manner
Effects of hCLP46 overexpression on Notch signalling, particularly Notch1 activation, were examined. Increased levels of Notch1 intracellular domain (NICD) were detected in cells overexpressing hCLP46 (Fig. 2a). EDTA treatment acted as positive control to increase NICD levels 16 that did not alter obviously in cells with or without hCLP46 overexpression (Fig. 2a). Furthermore, hCLP46 had the ability to augment Jagged1‐induced Notch1 activation (Fig. 2c). Immunostaining results showed that hCLP46 increased NICD when cells were at high confluence (Fig. 2e), suggesting that overexpression of hCLP46 activated Notch1 signalling in a ligand‐dependent manner, in 293TRex cells. Consistently, protein and mRNA levels of Hes1, effector of Notch activation 17, were increased with hCLP46 overexpression (Fig. 3a and 3c) and reduced with hCLP46 knock‐down by specific siRNA (Fig. 3d and 3f). In 293TRex cells, hCLP46‐specific siRNA decreased mRNA level of hCLP46 to approximately 43% compared to NC (Fig. 3f). These results support the hypothesis that hCLP46 enhanced Notch activation in 293Trex cells.
Figure 2.
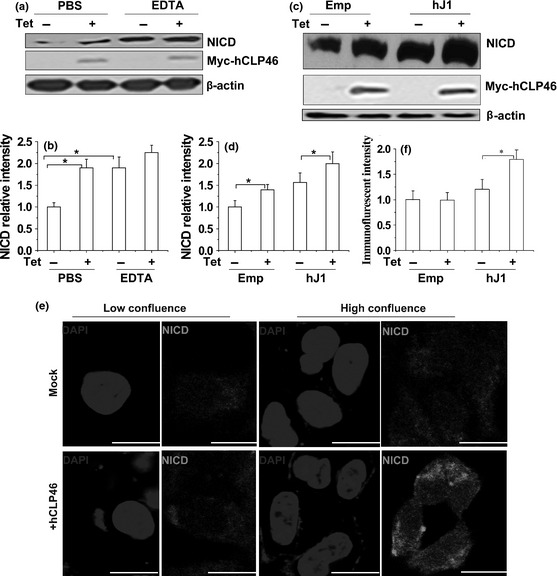
Overexpression of hCLP 46 enhanced Notch activation. (a) 293TRex‐hCLP46 cells were incubated for 48 h in absence (−) or presence (+) of 0.5 μg/ml Tet. Cells were treated with 5 mm EDTA or PBS and then cultured for additional 30 min. (c) 293TRex‐hCLP46 cells were incubated for 42 h in absence or presence of Tet and then co‐cultured for 5 h with 293T cells transfected with human Jagged1 (hJ1) or empty vector (Emp) for 36 h. Immunoblot band intensities were quantified using loading controls (b, d). (e) 293TRex‐hCLP46 cells were seeded at low confluence (low) or high confluence (high) and were incubated for 48 h in absence or presence of Tet. Green fluorescence indicates that NICD and nuclei were counterstained with DAPI (blue). Confocal images are representative of results obtained in three separate sets of experiments. Bar = 20 μm. Immunofluorescence intensities were quantified (f) and data represent mean ± SD of three independent experiments. *P ≤ 0.05.
Figure 3.
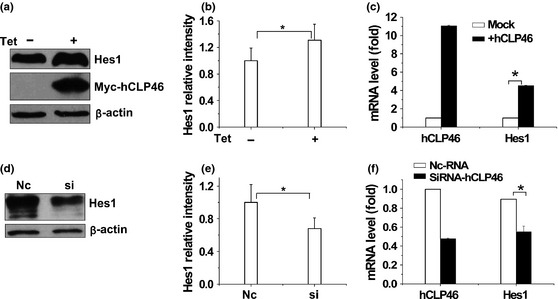
hCLP 46 regulated Notch signalling effector Hes1 expression. (a, c) 293Trex‐hCLP46 cells were incubated for 48 h in absence or presence 0.5 μg/ml Tet. (d, f) 293Trex‐hCLP46 cells were transfected with hCLP46‐siRNA (Si) or negative control‐RNA (Nc). Cells were then subjected to immunoblotting analyses to detect indicated proteins (a, d) and RT‐PCR to detect mRNAs (c, f). Immunoblot band intensities were quantified using loading controls (b, e). Data represent mean ± SD of three independent experiments. *P ≤ 0.05.
hCLP46 inhibited cell proliferation, and hCLP46 knock‐down promoted cell proliferation
It is interesting to note that hCLP46‐overexpressing cells had markedly lower population growth rates compared to control cells (Fig. 4a). We then examined expression of two cell proliferation regulators, CDKIs p21 and p27, and results showed that protein and mRNA levels of p21 and p27 were elevated in hCLP46‐overexpressing cells (Fig. 4b and 4d). Furthermore, down‐regulation of hCLP46 by specific siRNA, moderately but significantly increased growth rate (Fig. 5a) and led to decreases in p21 and p27 (Fig. 5b and 5d). These results suggest that hCLP46 might regulate proliferation of 293TRex cells, through CDKI signalling.
Figure 4.
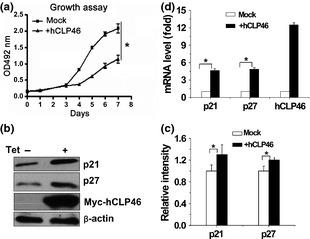
hCLP 46 inhibited cell proliferation and increased CDKIs p21 and p27. (a) 293Trex‐hCLP46 cells were incubated in absence or presence of 0.5 μg/ml Tet. At indicated time points, cells were harvested and incubated with MTT; absorbance at 492 nm was determined. All time points were assayed in triplicate. Cells were incubated for 48 h in absence or presence of Tet (b) and cell lysates were immunoblotted with indicated antibodies. (c) Immunoblot band intensities were quantified using loading controls. (d) Total RNA was subjected to RT‐PCR analysis for p21, p27 and hCLP46. Data represent mean ± SD of three independent experiments. *P ≤ 0.05.
Figure 5.
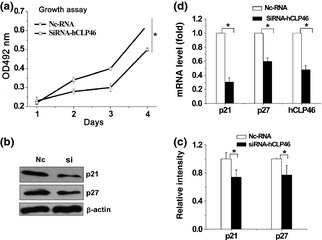
Inhibition of hCLP 46 promoted cell proliferation and reduced CDKIs p21 and p27. (a) 293Trex‐hCLP46 cells were transfected with hCLP46‐siRNA (Si) or negative control‐RNA (Nc); cells were harvested and incubated with MTT, and absorbance at 492 nm was determined. All time points were assayed in triplicate. (b) Cell lysates were immunoblotted with indicated antibodies. (c) Immunoblot band intensities were quantified against loading controls. (d) Total RNA was subjected to RT‐PCR analysis for p21, p27 and hCLP46. Data represent the mean ± SD of three independent experiments. *P ≤ 0.05.
hCLP46 did not influence cell apoptosis
To determine possible influence of hCLP46 on apoptosis, 293Trex cells induced with Tet or treated with siRNA‐hCLP46 were analysed by FACS. Fig. 6 shows that no significant alteration in apoptosis occurred when hCLP46 expression was up‐regulated or down‐regulated.
Figure 6.
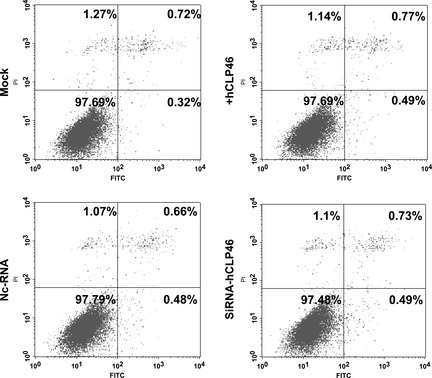
hCLP 46 had no significant effect on apoptosis. 293Trex‐hCLP46 cells were incubated in absence or presence of 0.5 μg/ml Tet or transfected with hCLP46‐siRNA (Si) or negative control‐RNA (Nc) for 48 h. Apoptosis was measured using annexin‐V and PI double staining. FITC axis denotes annexin‐V, and PI axis denotes PI.
Effects of hCLP46 on CDKI signalling were mediated through the Notch pathway
As Notch pathway signalling affects a variety of cell processes, we investigated whether hCLP46 played a role in CDKI signalling through Notch. To address this, we examined function of Notch activation on p21 and p27 expression and found accumulation of p21, p27 and Hes1 proteins when Notch was activated by EDTA treatment (Fig. 7). However, hCLP46 overexpression did not elicit this effect with EDTA treatment, which was consistent with release of NICD (Fig. 2a).
Figure 7.
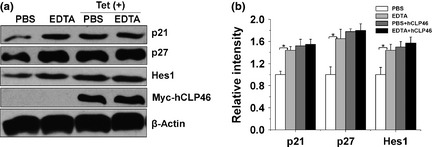
Effects of hCLP 46 on CDKI signalling were mediated through the Notch pathway. (a) 293TRex‐hCLP46 cells were incubated for 42 h in absence or presence of 0.5 μg/ml Tet, then treated with PBS or 5 mm EDTA. After treatment, cells were cultured for additional 6 h and analysed by immunoblotting with indicated antibodies. (b) Immunoblot band intensities were quantified against loading controls. *P ≤ 0.05.
Discussion
Using inducible overexpression and RNAi target reduction of hCLP46, we confirmed that aberrant hCLP46 expression could lead to deregulated Notch signalling and cell behaviour.
Deregulation of Notch can lead to development of haematological malignancies 7, 9, 10, 11. More than 50% of human T‐ALLs have activating mutations of Notch1 18, and both Notch1 and Jagged1 are overexpressed in AML 12. Here, our results indicated that overexpression of hCLP46 enhanced Notch1 activation (Figs 2, 3), which might provide a clue to explain high levels of hCLP46 in primary AML and T‐ALL samples.
Treating cells that express Notch receptors, with EDTA, resulted in shedding of the Notch extracellular domain and release of NICD 16. We have previously proven that down‐regulated hCLP46 does not affect cell surface expression of Notch1 receptors 5. Consistent with this finding, in present study we have shown that overexpression of hCLP46 did not alter EDTA‐induced NICD release (Fig. 2a). As EDTA‐induced Notch signalling was not significantly affected, we hypothesized that hCLP46 might regulate Notch signalling in a ligand‐dependent manner. Thus, we performed a co‐culture assay as previously described by Yang et al. 8, and compared effects of hCLP46 on Notch1 activation when cells were at low confluence and when they were highly confluent. Because presence of endogenous Notch ligands in 293T cells 19, when cells are highly confluent Notch receptors can be stimulated and activated by ligands on adjacent cells. The results showed that hCLP46 overexpression enhanced Notch1 signalling in a ligand‐dependent manner (Fig. 2c and 2e). Yang et al. had reported that Jagged1‐induced Notch1 signalling was enhanced by RFng and suppressed by LFng and MFng in 293T cells 8. Our results and previous studies demonstrate that Notch signalling is regulated by glycosylation and that fucosylation and glucosylation play different roles in modulating Notch signalling.
No significant apoptosis occurred when hCLP46 expression was up‐regulated or when it was reduced (Fig. 6). NaAsO2 treatment induced significant apoptosis in 293Trex cells (Fig. S2), indicating that our assay worked well. MTT assay measures cell proliferation level when reduction in cell viability caused by apoptosis or necrosis is excluded 20; results showed that hCLP46 expression affected 293Trex cell proliferation (Figs. 4a and 5a). Indeed, overexpression of hCLP46 resulted in significant inhibition of 293Trex proliferation (Fig. 4a), which could be a result of activation of Notch signalling (Figs 2, 3). Active Notch proteins, but not Hes1, cause profound population growth arrest associated with up‐regulation of p21 and p27 15, 21; in contrast, inhibition of Notch signalling by Notch1‐specific siRNA resulted in reduced p21 levels 22. In agreement with these studies, we showed that overexpression of hCLP46 caused increases in p21 and p27 (Fig. 4) and that knock‐down caused the reverse effect (Fig. 5), indicating involvement of hCLP46 in the CDKI pathway. However, Hes1 also has the ability to directly control cell proliferation by regulating expression levels of p21 and p27 23, 24. Because Hes1 protein was increased in hCLP46‐overexpressing cells and reduced in Hes1‐knocked‐down cells (Fig. 3), cell inhibition through Notch activation may be dependent on or independent of Hes1.
The inhibitory role of hCLP46 in 293TRex cell proliferation is contrary to our previous study, which showed that hCLP46 stimulated U937 human monocytic leukaemia cell proliferation 1. With repeated titration and expression studies, we believe that differences in results stem from existence of intrinsically different machinery between U937 and 293TRex cells, rather than from bias between the experiments. These results therefore indicate that function of hCLP46 in cell proliferation is highly dependent on cell type. The established theory is that Notch signalling can regulate gene transcription activation and repression and either block or promote cell population growth in a cell type‐specific manner 12. For example, Notch1 inhibits epidermal, endothelial and small lung cancer cell proliferation 21, 25, and active forms of Notch have been shown to have oncogenic activity in acute lymphoblastic T‐cell leukaemia and fibroblasts 26, 27. As 293 cells were derived from human embryonic kidney and U937 cells were derived from a lymphoma, specific functions of hCLP46 in these two cell lines is possibly due to context‐dependent Notch signalling. Additionally, in normal adult human tissues, hCLP46 is highly expressed in liver and is also expressed in low mitotic index tissues 1. Cell type‐dependent functions and different expression levels in normal tissues reveal the important role of hCLP46 in mammalian development, particularly in pathogenesis of hCLP46‐related haematological diseases 1, 2, 5.
On the basis of this study, we propose a role for hCLP46 in regulating 293Trex cell proliferation (Fig. 8). We provide evidence that hCLP46 exerts its function in a cell‐specific manner, which is useful to understand the mechanism leading to haematological tumorigenesis.
Figure 8.
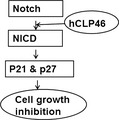
Schematic diagram of regulation of 293Trex cell proliferation by hCLP 46. hCLP46 increased expression of p21 and p27 through enhanced Notch signalling, leading to cell proliferation arrest in 293TRex cells.
Conflict of interest
The authors declare that there is no conflict of interest.
Supporting information
Figure S1. The expression of exogenous hCLP46 in 293Trex‐hCLP46 cell line. 293Trex‐hCLP46 cells were incubated for 48 h in the absence or presence of 0.5 μg/ml Tet. The experiments were repeated two times.
Figure S2. NaAsO 2 induced 293TRex cells apoptosis. 293Trex‐hCLP46 cells were incubated for 48 h or 24 h in the absence or presence of 8 μmol/l NaAsO2. Apoptosis was measured by annexin‐V and PI double staining. The FITC axis denotes annexin‐V, and the PI axis denotes PI. The experiments were performed in triplicate and repeated three times. Values represent an average of triplicate samples of a representative experiment.
Acknowledgements
We thank Prof. Dr Yuxiang Zhang for discussion and suggestions. This study was financially supported by grants awarded by the National Natural Science Foundation of China (31070727, 30670889 and 81273170), the National Science Technology Major Special Project on Major New Drug Innovation (2010ZX09401), the National “Twelfth Five‐Year” Plan for Science and Technology Support (2012BAI37B03), and the Major State Basic Research Program‐973 of China (2011CB503806).
References
- 1. Teng Y, Liu Q, Ma J, Liu F, Han Z, Wang Y et al (2006) Cloning, expression and characterization of a novel human CAP10‐like gene hCLP46 from CD34(+) stem/progenitor cells. Gene 371, 7–15. [DOI] [PubMed] [Google Scholar]
- 2. Wang Y, Chang N, Zhang T, Liu H, Ma W, Chu Q et al (2010) Overexpression of human CAP10‐like protein 46 KD in T‐acute lymphoblastic leukemia and acute myelogenous leukemia. Genet. Test. Mol. Biomarkers 14, 127–133. [DOI] [PubMed] [Google Scholar]
- 3. Acar M, Jafar‐Nejad H, Takeuchi H, Rajan A, Ibrani D, Rana N et al (2008) Rumi is a CAP10 domain glycosyltransferase that modifies Notch and is required for Notch signaling. Cell 132, 247–258. [DOI] [PMC free article] [PubMed] [Google Scholar]
- 4. Fernandez‐Valdivia R, Takeuchi H, Samarghandi A, Lopez M, Leonardi J, Haltiwanger R et al (2011) Regulation of mammalian Notch signaling and embryonic development by the protein O‐glucosyltransferase Rumi. Development 138, 1925–1934. [DOI] [PMC free article] [PubMed] [Google Scholar]
- 5. Ma W, Du J, Chu Q, Wang Y, Liu L, Song M et al (2011) hCLP46 regulates U937 cell proliferation via Notch signaling pathway. Biochem. Biophys. Res. Commun. 408, 84–88. [DOI] [PubMed] [Google Scholar]
- 6. Takeuchi H, Fernandez‐Valdivia RC, Caswell DS, Nita‐Lazar A, Rana NA, Garner T et al (2011) Rumi functions as both a protein O‐glucosyltransferase and a protein O‐xylosyltransferase. Proc. Natl Acad. Sci. USA 108, 16600–16605. [DOI] [PMC free article] [PubMed] [Google Scholar]
- 7. Bray SJ (2006) Notch signalling: a simple pathway becomes complex. Nat. Rev. Mol. Cell Biol. 7, 678–689. [DOI] [PubMed] [Google Scholar]
- 8. Yang LT, Nichols JT, Yao C, Manilay JO, Robey EA, Weinmaster G (2005) Fringe glycosyltransferases differentially modulate Notch1 proteolysis induced by Delta1 and Jagged1. Mol. Biol. Cell 16, 927–942. [DOI] [PMC free article] [PubMed] [Google Scholar]
- 9. Artavanis‐Tsakonas S, Rand MD, Lake RJ (1999) Notch signaling: cell fate control and signal integration in development. Science 284, 770–776. [DOI] [PubMed] [Google Scholar]
- 10. Tien AC, Rajan A, Bellen HJ (2009) A Notch updated. J. Cell Biol. 184, 621–629. [DOI] [PMC free article] [PubMed] [Google Scholar]
- 11. Milner LA, Bigas A (1999) Notch as a mediator of cell fate determination in hematopoiesis: evidence and speculation. Blood 93, 2431–2448. [PubMed] [Google Scholar]
- 12. Leong KG, Karsan A (2006) Recent insights into the role of Notch signaling in tumorigenesis. Blood 107, 2223–2233. [DOI] [PubMed] [Google Scholar]
- 13. Mainprize TG, Taylor MD, Rutka JT, Dirks PB (2001) Cip/Kip cell‐cycle inhibitors: a neuro‐oncological perspective. J. Neurooncol. 51, 205–218. [DOI] [PubMed] [Google Scholar]
- 14. Jaleco AC, Neves H, Hooijberg E, Gameiro P, Clode N, Haury M et al (2001) Differential effects of Notch ligands Delta‐1 and Jagged‐1 in human lymphoid differentiation. J. Exp. Med. 194, 991–1002. [DOI] [PMC free article] [PubMed] [Google Scholar]
- 15. Sriuranpong V, Borges MW, Ravi RK, Arnold DR, Nelkin BD, Baylin S et al (2001) Notch signaling induces cell cycle arrest in small cell lung cancer cells. Cancer Res. 61, 3200–3205. [PubMed] [Google Scholar]
- 16. Rand MD, Grimm LM, Artavanis‐Tsakonas S, Patriub V, Blacklow SC, Sklar J et al (2000) Calcium depletion dissociates and activates heterodimeric notch receptors. Mol. Cell. Biol. 20, 1825–1835. [DOI] [PMC free article] [PubMed] [Google Scholar]
- 17. Chiaramonte R, Calzavara E, Balordi F, Sabbadini M, Capello D, Serra A et al (2003) Differential regulation of Notch signal transduction in leukaemia and lymphoma cells in culture. J. Cell. Biochem. 88, 569–577. [DOI] [PubMed] [Google Scholar]
- 18. Weng AP, Ferrando AA, Lee W, Morris JP, Silverman LB, Sanchez‐Irizarry G et al (2004) Activating mutations of NOTCH1 in human T cell acute lymphoblastic leukemia. Science 306, 269–271. [DOI] [PubMed] [Google Scholar]
- 19. Ohata S, Aoki R, Kinoshita S, Yamaguchi M, Tsuruoka‐Kinoshita S, Tanaka H et al (2011) Dual roles of Notch in regulation of apically restricted mitosis and apicobasal polarity of neuroepithelial cells. Neuron 69, 215–230. [DOI] [PubMed] [Google Scholar]
- 20. Mosmann T (1983) Rapid colorimetric assay for cellular growth and survival: application to proliferation and cytotoxicity assays. J. Immunol. Methods 65, 55–63. [DOI] [PubMed] [Google Scholar]
- 21. Noseda M, Chang L, McLean G, Grim JE, Clurman BE, Smith L et al (2004) Notch activation induces endothelial cell cycle arrest and participates in contact inhibition: role of p21Cip1 repression. Mol. Cell. Biol. 24, 8813–8822. [DOI] [PMC free article] [PubMed] [Google Scholar]
- 22. Purow BW, Sundaresan TK, Burdick MJ, Kefas BA, Comeau LD, Hawkinson M et al (2008) Notch‐1 regulates transcription of the epidermal growth factor receptor through p53. Carcinogenesis 29, 918–925. [DOI] [PMC free article] [PubMed] [Google Scholar]
- 23. Murata K, Hattori M, Hirai N, Shinozuka Y, Hirata H, Kageyama R et al (2005) Hes1 directly controls cell proliferation through the transcriptional repression of p27Kip1. Mol. Cell. Biol. 25, 4262–4271. [DOI] [PMC free article] [PubMed] [Google Scholar]
- 24. Noda N, Honma S, Ohmiya Y (2011) Hes1 is required for contact inhibition of cell proliferation in 3T3‐L1 preadipocytes. Genes Cells 16, 704–713. [DOI] [PubMed] [Google Scholar]
- 25. Niimi H, Pardali K, Vanlandewijck M, Heldin CH, Moustakas A (2007) Notch signaling is necessary for epithelial growth arrest by TGF‐β. J. Cell Biol. 176, 695–707. [DOI] [PMC free article] [PubMed] [Google Scholar]
- 26. Sarmento LM, Huang H, Limon A, Gordon W, Fernandes J, Tavares M et al (2005) Notch1 modulates timing of G1‐S progression by inducing SKP2 transcription and p27 Kip1 degradation. J. Exp. Med. 202, 157–168. [DOI] [PMC free article] [PubMed] [Google Scholar]
- 27. Ellisen LW, Bird J, West DC, Soreng AL, Reynolds TC, Smith S et al (1991) TAN‐1, the human homolog of the Drosophila notch gene, is broken by chromosomal translocations in T lymphoblastic neoplasms. Cell 66, 649–661. [DOI] [PubMed] [Google Scholar]
Associated Data
This section collects any data citations, data availability statements, or supplementary materials included in this article.
Supplementary Materials
Figure S1. The expression of exogenous hCLP46 in 293Trex‐hCLP46 cell line. 293Trex‐hCLP46 cells were incubated for 48 h in the absence or presence of 0.5 μg/ml Tet. The experiments were repeated two times.
Figure S2. NaAsO 2 induced 293TRex cells apoptosis. 293Trex‐hCLP46 cells were incubated for 48 h or 24 h in the absence or presence of 8 μmol/l NaAsO2. Apoptosis was measured by annexin‐V and PI double staining. The FITC axis denotes annexin‐V, and the PI axis denotes PI. The experiments were performed in triplicate and repeated three times. Values represent an average of triplicate samples of a representative experiment.


