Abstract
Optimization and standardization of immunohistochemistry (IHC) protocols within and between laboratories requires reproducible positive and negative control samples. In many situations, suitable tissue or cell line controls are not available. We demonstrate here a method to incorporate target antigens into synthetic protein gels that can serve as IHC controls. The method can use peptides, protein domains, or whole proteins as antigens, and is compatible with a variety of fixation protocols. The resulting gels can be used to create tissue microarrays (TMAs) with a range of antigen concentrations that can be used to objectively quantify and calibrate chromogenic, fluorescent, or mass spectrometry-based IHC protocols. The method offers an opportunity to objectively quantify IHC staining results, and to optimize and standardize IHC protocols within and between laboratories. (J Histochem Cytochem 58:XXX–XXX, 2019)
Keywords: BCL2, epitope, formaldehyde, limit of detection, LOD, MYC, zinc
Introduction
Modern nucleic acid analysis methods and cooperative efforts such as the Cancer Genome Anatomy Project have exponentially advanced understanding of disease etiologies, subtypes, and therapeutic opportunities.1,2 Notwithstanding these invaluable insights, antibody-mediated detection of antigens in tissue sections, first implemented more than 75 years ago,3 is still essential to medical research and practice because it reveals the relative abundance of expressed proteins at cellular and subcellular resolution. More than 3 million antibodies are available for exploratory use in human studies (see https://www.antibodypedia.com/), and immunohistochemistry (IHC) assays for ALK, KIT/CD117, EGFR, HER2, and PD-L1 are approved companion diagnostics for use in the assessment of patients being considered for treatment with Food and Drug Administration (FDA)-approved therapies (see https://www.fda.gov/MedicalDevices/ProductsandMedicalProcedures/InVitroDiagnostics/ucm301431.htm). FDA-defined class II IHC assays for estrogen and progesterone receptors, and many other class I IHC assays evaluating cell lineage and functional status, are routinely employed in patient care decisions.
Despite the utility of IHC assays in defining appropriate patient care, tests for diagnostic, prognostic, or predictive biomarkers have the potential for harm arising from patient misclassification. The risk is 2-fold: An incorrect test result may lead to a missed opportunity for a patient to benefit from effective treatment; it may also expose the patient to potential side effects associated with inappropriate treatment. These risks underlie the FDA requirement for in vitro diagnostic assays to meet rigorous performance standards, including documented accuracy and reproducibility at the clinical diagnostic threshold (see https://www.fda.gov/downloads/MedicalDevices/DeviceRegulationandGuidance/GuidanceDocuments/UCM589083.pdf). As a diagnostic tool, an IHC assay is an unusually complex system including preanalytic tissue processing, antigen unmasking, antibody-antigen interactions, assay detection chemistry, data acquisition, and data interpretation. The choice of optimal assay conditions depends on factors including the abundance and dynamic range of the target antigen, the method used to evaluate the signal, and the intended diagnostic use of the assay result. To achieve reproducible results within and between laboratories, well-controlled processes are necessary at all stages. In both research and clinical settings, it is an ongoing goal to improve IHC quality control methods and tools.4–6
Implementing an accurate and reproducible IHC assay is challenging in part because the strength of the IHC signal is often non-linear with respect to the target antigen concentration, with a lower limit of detection (LOD) and an upper limit, above which the signal appears saturated.7,8 Work from Steven Bogen’s laboratory using well-characterized peptide IHC epitopes bound to glass beads has shown that, even in the absence of tissue-specific preanalytic variables, the dynamic range and shape of analytic response curves vary with assay conditions.9–11 At one extreme, assay conditions can produce a step-like response, with signal rising rapidly to a saturated level as antigen abundance increases above the lower LOD. With such conditions, antigen expression will appear nearly binary: absent below the detection threshold or fully present above it. At another extreme, assay conditions can result in graded signal intensity across a range of antigen abundance, allowing a semiquantitative assessment in that range. For different clinical diagnostic needs, both types of assays can be useful: maximally sensitive detection of lineage markers may aid diagnosis and therapeutic decision making, for instance in the characterization of a metastasis with a known or unknown primary tumor source. Conversely, identifying patients appropriate for specific targeted therapy (e.g., anti-HER2) may require the ability to measure antigen on a graded intensity scale, with the clinical threshold for treatment above the minimally detectable level. Because assay conditions affect both the detection thresholds and the shape of the curve relating antigen abundance to assay signal, precision and accuracy at clinical diagnostic thresholds require well-controlled assay performance.
These challenges are recurring themes in the literature and practice of IHC, and multiple strategies to better assess and control IHC assay performance have been developed. Fixed tissues sections are complex analytes, with multiple unknowns including the concentration, biochemical integrity, and accessibility of the target antigen, the abundance of related but non-target antigens and of non-specific binders of assay reagents. Assay sensitivity and specificity further depend on non-antigen variables including the assay buffers, primary and secondary antibodies, signal amplification steps, detection chemistry, and signal evaluation methods. Because the number of variables and the complex interactions among them are obstacles to rational a priori assay design, most IHC assays are optimized by experience-based empirical testing using subjective qualitative endpoints. To obtain consistent results within and between laboratories, well-characterized positive and negative controls are essential.4–8
Ideal IHC assay control samples would have a broad range of antigen expression in easily identifiable cell populations, be reproducible between samples, and be readily available to multiple laboratories. Archival tissues (e.g., tonsil, containing many lymphoid cell populations) provide such controls for many clinically useful lymphoid markers, and specific control tissues have been identified for other widely used antibodies.8 However, for many IHC targets, satisfactory control tissues are not readily available for several reasons: expression of the antigen may be very low, may vary unpredictably in morphologically similar cell populations, or may not span the diagnostic threshold found in the intended clinical samples. In these situations, it may be impossible to understand the dynamic range of antigen abundance detected by specific assay conditions, or to describe to new users the expression pattern and staining intensity expected in specific tissues or cell types. Most importantly, it may be impossible to evaluate reproducibly the staining intensity in a clinical test sample relative to a reliable reference sample.
Given these challenges, we focused on the opportunity to more precisely characterize an IHC assay independent of its performance on target tissues. We recognize that important variables critical to IHC assay performance are found only in tissues (e.g., clinical and biological context, warm and cold ischemia time, fixation conditions), and cannot be evaluated in simpler systems. However, other parameters affecting assay performance can be assessed independent of the biological and laboratory-induced variations inherent in tissue samples. As a result, the relationship between assay conditions, antigen abundance, and IHC signal can be evaluated with greater precision. The qualitative nature of typical IHC assays can be moved incrementally closer to the ideal of a well-controlled quantitative laboratory assay and the calibration of assay conditions within and between different sites can be made more feasible.
Multiple strategies to assess and control IHC assay performance independent of target tissues have been proposed. More than 45 years ago, Brandtzaeg12 described a method to create “artificial tissue” samples: millimeter-sized blocks of glutaraldehyde-fixed rabbit serum, into which human IgG fractions or whole serum were allowed to diffuse. This general technique was revisited and extended with apparent success over the next dozen years,13–16 but has also been described as prone to inhomogeneous and non-specific staining,17 and has seen little use in recent practice. Coprecipitation of bovine serum albumin (BSA) and human chorionic gonadotropin (HCG) by formol sublimate formed a sample, after centrifugation, in which IHC signal correlated with HCG content.18 In a study of protein extraction methods from formalin-fixed paraffin-embedded (FFPE) samples, “tissue surrogate” gels were made by mixing lysozyme or RNase A solutions with formaldehyde at room temperature.19 These authors noted that gel formation depended on protein concentration and isoelectric point. More widely used are clonal cell lines with variably well-characterized abundance of target proteins.20 These are invaluable in many settings, but cell line controls can show remarkably heterogeneous expression of specific targets in separate subclones, different passages of one clone, or even within one culture population,21 frustrating the goal of creating a homogeneous and reproducible standard. More recent valuable work by several investigators, notably those in the laboratory of Steven Bogen, has shown the utility of peptide epitopes or whole proteins chemically coupled to the surface of glass slides or to glass beads that replicate the three-dimensionality of cells in tissue.9–11,22–26 These efforts address many of the same concerns we consider here, and some of these techniques have been offered as tools to standardize routine IHC lab work processes.9,11,26
In this work, we reexplored the general concept demonstrated by Brandtzaeg,12 in which specific antigens are incorporated into carrier protein gels. We identified conditions that allow reproducible sample preparation at relatively low cost and using routine histology methods for a variety of antigens including whole proteins, recombinant protein domains, and small peptides. These synthetic controls can have carrier protein and antigen concentrations spanning the ranges found in human tissues. Because they are three-dimensional (3D) solids, they reproduce some of the procedural and spatial aspects relevant to staining and interpreting tissue sections. We demonstrate proof of concept applications relevant to research and clinical use, including IHC assay calibration and quality control.
Materials and Methods
Peptides and Proteins
Peptides were synthesized at >95% purity by New England Peptide (Gardner, MA), ABclonal Science (Woburn, MA), or CPC Scientific (Sunnyvale, CA). Amino acids 41–54 of the human BCL2 protein (UniProt P10415) were extended at the N-terminus by four amino acids including acetylated tyrosine to facilitate crosslinking with formaldehyde, and a spacer sequence, GSG (glycine–serine–glycine). The C-terminus included a GSG spacer sequence followed by cysteine-amide to facilitate crosslinking with formaldehyde27,28 or sulfhydryl-reactive reagents. The entire 22 amino acid peptide sequence is Ac-YGSGGAAPAPGIFSSQPGGSGC-amide. Additional peptides were synthesized containing sequences from the human MYC protein (UniProt P01106): Ac-YGSGNRNYDLDYDSVQPYFYGSGC-amide (amino acids 9–24); Ac-YGSGDSVQPYFYCDEEENFYGSGC-amide (amino acids 17–32); Ac-YGSGQQQSELQPPAPSEDIWGSGC-amide (amino acids 35–50); Ac-YGSGFELLPTPPLSPSRRSGGSGC-amide (amino acids 53–68). A negative control peptide-containing 13 amino acids from the first exon of human MCL1 (UniProt Q07820) was synthesized with the same N- and C-terminal sequence extensions described above. For some experiments, arginine, serine, or tyrosine replaced the N- and C-terminal amino acids in the peptides described above. Lyophilized peptides (aliquots of 10.0–10.8 mg at 95–96% purity, as documented by the vendor) were dissolved in a minimal volume of distilled water, DMSO, or dimethylformamide. The C-terminal 301 amino acids (amino acids 650 to 950) of the Kinase Suppressor of RAS 2 (KSR2; UniProt Q6VAB6) protein was expressed as a 701 amino acid N-term [His]6 tagged, maltose binding protein (amino acids 9–399) fusion construct (Genentech, South San Francisco, CA). The fusion protein was expressed as a baculovirus construct in Trichoplusia ni Tni Pro insect cells (Expression Systems; Davis, CA), then purified by sequential nickel-nitrilotriacetic acid affinity, amylose affinity, and Sepharose S200 size exclusion chromatography. Purified mouse IgG1 clone MOPC-31C (BD Pharmingen, San Jose, CA), rat IgG1 clone R3-34 (BD Pharmingen, San Jose, CA), and rabbit IgG clone DA1E (Cell Signaling Technology, Danvers, MA) were obtained commercially. BSA (Ultra Pure) was purchased from Cell Signaling Technology (Danvers, MA). Food-grade gelatin and dried egg whites were from Knox (Oakbrook, IL) and Judees Gluten Free (Columbus, OH), respectively.
Protein Matrix Gels
For most experiments reported here, 0.5 mL of solution containing the desired antigen in 25% (w/v) BSA/phosphate-buffered saline (PBS) was mixed in a 1.5 ml microfuge tube with an equal volume of 37% formaldehyde (Electron Microscopy Sciences; Hatfield, PA), heated for 10 min at 85C to coagulate the solution, then fixed overnight at room temperature. The final reagent concentrations were 12.5% (1.8 mM) BSA and 18.5% (6.2 M) formaldehyde. Peptide antigens had final concentrations of 2.5 × 10⁻⁸ M to 2.5 × 10⁻⁴ M in the fixed gels. Gels containing naïve mouse, rat, and rabbit IgG had a final concentration of 0.1 mg/ml (6.7 × 10⁻⁷ M) IgG. The human [His]6-MBP-KSR2 fusion protein had a final gel concentration of 0.5 mg/ml (6.3 × 10⁻⁶ M).
In tests of alternative protein gel materials, the protocol above was followed with 25% (w/v) egg white in deionized water replacing 25% BSA in PBS. In other experiments, the desired antigen was diluted in warm liquid 10% (w/v) gelatin in deionized water, cooled to 4C until solid, fixed in 10% neutral-buffered formalin (NBF) at room temperature for 2 days, then transferred to 70% ethanol for 2 days before standard tissue processing. Fixed gels were dehydrated through graded alcohols to xylene on a Sakura (Torrance, CA) Tissue-Tek VIP5 tissue processor, infiltrated with molten paraffin wax, embedded, sectioned at 4 µm thickness and adhered to Superfrost Plus positively charged microscope slides (Thermo Scientific, Runcorn, Cheshire, UK). Tissue sections were air dried overnight at room temperature before baking for 20 min at 70C.
In tests of alternative fixation protocols, formalin-free zinc fixative (Catalog number 550523, BD Pharmingen; San Jose, CA) was used in place of 37% formaldehyde and NBF in the protocols above. In other experiments, antigen in 25% BSA in PBS was solidified by heating for 10 min at 85C in the absence of formaldehyde. The solidified gel was then transferred to 10% NBF (VWR International, LLC, Radnor, PA), 4% paraformaldehyde (PFA; VWR International, LLC, Radnor, PA), or zinc fixative for overnight fixation at room temperature.
Tissue Microarray Construction
Tissue microarrays (TMA) were constructed using a TMA Grand Master tissue microarrayer (3DHISTECH, Ltd., Budapest, Hungary). Duplicate 1 mm diameter cores were punched from donor paraffin blocks containing the desired protein gels, then transferred to recipient paraffin blocks. Completed recipient TMA blocks were heated at 37C overnight, then at 70C for 10 min, before being cooled and sectioned.
Immunohistochemistry Staining
Primary antibodies used were mouse anti-human BCL2 clone 124 (Ventana Medical Systems; Tucson, AZ), rabbit anti-human BCL2 clone EPR17509 (Abcam; Cambridge, MA), rabbit anti-human BCL2 clone SP66 (Ventana Medical Systems, Tucson, AZ), rabbit anti-human BCL2 clone E17 (Abcam, Cambridge, MA), and rabbit anti-human MYC clone Y69 (Ventana Medical Systems, Tucson, AZ). The 146Nd- EPR17509 antibody was purchased from Fluidigm (South San Francisco, CA). A panel of 27 mouse hybridoma antibodies to the [His]6-MBP-human KSR2 fusion protein was generated at Chempartner (Shanghai, China). Biotinylated donkey antirabbit, rat, and mouse secondary antibodies were purchased from Jackson Laboratories. Staining protocol details are summarized in Table 1. Four µm paraffin sections were deparaffinized and rehydrated in xylene and graded alcohols. Staining was performed, within 3 weeks of sectioning, on the Ventana Benchmark XT, Ventana Discovery XT, Ventana Benchmark Ultra XT instruments (Ventana Medical Systems, Tucson, AZ), or the Dako Universal Autostainer (Agilent, Santa Clara, CA). Sections were pretreated with Cell Conditioning Solution 1 (CC1) (Ventana Medical Systems, Tucson, AZ) or Target Retrieval Solution, pH6 (Dako—Agilent Technologies, Santa Clara, CA), depending on the optimized antibody protocol. Slides stained on the Ventana instruments were detected with Ventana OmniMAP, Opti- and UltraView DAB Kits (Table 1) followed by Ventana hematoxylin and bluing reagents (Ventana Medical Systems, Tucson, AZ) for 4 min each. Fluorescent detection was fully automated on the Ventana Discovery Ultra platform using Ventana Discovery RED610, FAM and Cy5 Kits (Ventana Medical Systems, Tucson, AZ) for 16 min each. Slides run on the Dako Universal Autostainer were incubated in 3% H202 in PBS for 5 min, blocked with 10% normal donkey serum in 3% BSA in PBS for 30 min, followed by the primary antibody incubation for 1 hr at room temperature; the appropriate biotinylated donkey secondary antibody (Jackson Laboratories, West Grove, PA) was incubated for 30 min, detected with the Vectastain Elite ABC-HRP Kit (Vector Laboratories, Burlingame, CA) for 30 min, visualized with metal-enhanced diaminobenzidine (DAB) from Pierce (Waltham, MA) or Betazoid DAB from Biocare Medical (Pacheco, CA) for 5 min, and counterstained in Mayer’s hematoxylin (Rowley Biochemical, Danvers, MA) and Richard-Allen Scientific Bluing Reagent (Thermo Fisher Scientific, Waltham, MA) for 1 min each. Stained sections were dehydrated in graded alcohols to xylene before coverslipping. Immunofluorescent slides were coverslipped with Prolong Gold mounting media (Life Technologies, Carlsbad, CA).
Table 1.
IHC Protocols.
| Target | Antibody | Antibody Concentration (µg/ml) | Machine | Conditioning (Time, Temperature) | Antibody Incubation Time, Temperature | Detection |
|---|---|---|---|---|---|---|
| BCL2 (DAB) | 124 | RTU | Ventana Benchmark XT | CC1 standard (64 min, 100C) | 16 min 37C | UltraView DAB |
| BCL2 (IF) | 124 | RTU | Ventana Discovery ULTRA | CC1 standard (64 min, 100C) | 16 min 37C | Discovery RED610 Kit |
| BCL2 (Dual IF) | 124 | RTU | Ventana Discovery ULTRA | CC1 standard (64 min, 100C) | 16 min 37C | Discovery FAM Kit |
| BCL2 (DAB) | EPR17509 | 0.25 | Ventana Discovery XT | CC1 standard (64 min, 100C) | 60 min 37C | OmniMap DAB |
| BCL2 (DAB) | E17 | 2.12 | Ventana Discovery XT | CC1 mild (30 min, 100C) | 32 min 37C | OptiView DAB |
| BCL2 (DAB) | SP66 | RTU | Ventana Discovery XT | CC1 standard (64 min, 100C) | 16 min 37C | OptiView DAB |
| BCL2 (MS) | EPR17509–146Nd | 1, 5, 10 | Manual | Target pH 6 (20 min, 99C) | Overnight 4C | MS |
| MYC (DAB) | Y69 | RTU | Ventana Benchmark XT | CC1 standard (64 min, 100C) | 16 min 37C | OptiView DAB |
| MYC (Dual IF) | Y69 | RTU | Ventana Discovery ULTRA | CC1 standard (64 min, 100C) | 16 min 37C | Discovery Cy5 Kit |
| KSR2 (DAB) | Hybridoma antibodies | 5 | Dako Universal Autostainer | Target pH 6 (20 min, 99C) | 1 hr room temperature | ABC-HRP and DAB (Betazoid) |
| Rabbit IgG (DAB) | Polyclonal | 10 | Dako Universal Autostainer | Target pH 6 (20 min, 99C) | 1 hr room temperature | ABC-HRP and DAB (Pierce) |
| Rat IgG1 (DAB) | Polyclonal | 10 | Dako Universal Autostainer | Target pH 6 (20 min, 99C) | 1 hr room temperature | ABC-HRP and DAB (Pierce) |
| Mouse IgG1 (DAB) | Polyclonal | 10 | Dako Universal Autostainer | Target pH 6 (20 min, 99C) | 1 hr room temperature | ABC-HRP and DAB (Pierce) |
Parameters for IHC staining protocols are summarized. Abbreviations: IHC, immunohistochemistry; DAB, diaminobenzidine; RTU, ready to use, Ab concentration is not disclosed by the vendor; IF, immunofluorescence; MS, mass spectrometry.
Fluidigm Staining Procedure
Sections were baked at 70C for 30 min, deparaffinized, rehydrated in descending EtOH series, and pretreated with Target Retrieval Solution, pH6 (Dako—Agilent Technologies, Santa Clara, CA), blocked for 30 min in 10% donkey serum, 3% BSA in PBS, then incubated with 146Nd-EPR17509 in blocking buffer. Slides were incubated at 4C overnight in a humidified closed container, then rinsed three times in PBS, postfixed in 2% Glutaraldehyde/PBS for 5 min at 20C slides, rinsed in ddH20, dehydrated in increasing EtOH series, air dried, and stored at 20C until imaging.
Imaging Mass Spectrometry Analysis
TMA cores stained with 146Nd-labeled EPR17509 were analyzed in the Fluidigm Hyperion imaging mass spectrometer (South San Francisco, CA) by defining ablation regions of interest (ROI) of 150 µm square in each TMA core. The integrated ion counts for each ROI were converted to antibody mass using antibody standard data as described below.
Control aliquots of 1, 5, and 10 µg/ml 146Nd-labeled EPR17509 were prepared in 10% donkey serum in 3% BSA in PBS. One µL of each antibody concentration was spotted on a glass slide and air dried before being ablated in the Hyperion machine, ultraviolet (UV) laser intensity = 3, The integrated ion count for each antibody spot was used to calibrate the ion counts measured in ROIs from stained TMA cores.
Digital Image Acquisition and Analysis
Whole-slide brightfield images were acquired at a scanning resolution of 0.46 µm/pixel using the Hamamatsu (Bridgewater, NJ) Nanozoomer-XR digital slide scanner equipped with a 20× 0.75 NA objective lens. Brightfield imaging was performed in semiautomatic batch mode. The scan area and focus points were manually created for each slide before automated high resolution whole-slide imaging. Immunofluorescence whole-slide images were acquired using the Nanozoomer-XR or 3D Histech Pannoramic 250 scanner (using a 20× 0.8 NA objective lens with a resolution of 0.33 µm/pixel). On the Nanozoomer-XR system, illumination power of the fluorescent module was set at 50% and immunofluorescence signal was captured using a TRITC (tetramethylrhodamine isothiocyanate, antibody signal at 1× exposure, 3.4 ms photon collection, 1× gain), DAPI (4’,6-diamidino-2-phenylindole, autofluorescence at 2× exposure, 6.8 ms photon collection, 2× gain), and CFP filter (cyan fluorescent protein, autofluorescence at 4× exposure, 13.6 ms photon collection, 2× gain). Acquisition on the Pannoramic 250 system was performed using a CY5 (cyanine 5, antibody signal at 10 ms exposure, 1× gain), FITC (antibody signal at 2 ms exposure, 1× gain), DAPI (autofluorescence at 40 ms exposure, 1× gain), and CFP filter (autofluorescence at 200 ms exposure, 1× gain). Image analysis was performed using Matlab version 9.3. ROI on brightfield images were manually created and edited to exclude areas of the gel that had artifacts or were torn. Small holes or tears within the ROI were excluded using manual color thresholds. ROI for immunofluorescent images were either manually created or automatically generated when sufficient signal above background of the gel is available from the autofluorescence image by thresholding (on either the DAPI or CFP channel) and morphological filtering. ROI were transferred onto images acquired in the antibody-fluorochrome channel for intensity measurement. Average grayscale intensity was calculated in 8-bit depth for both brightfield and fluorescent images. Plotted y-axis values for average brightfield pixel intensity represent 255 minus average pixel grayscale intensity. Digital slide scan images are presented without alteration of the original intensity or contrast. Staining intensity profile quantification on lines drawn across donor block sections was assessed using the Analyze/Plot Profile function in ImageJ (version 1.52a; Wayne Rasband, see https://imagej.nih.gov/ij).
Statistical Analysis
Graphing was done with Prism GraphPad (version 7). Signal intensity data, corrected for glass slide background, were plotted versus the log10 of the formulated antigen concentration. Curve fitting used the variable slope four-parameter model constrained so that the bottom of the fitted curve was equal to the mean intensity of the no-antigen cores for each assay. Antigen concentration at half-maximum signal (ACHM) and Hill slope were calculated by the software.
Results
Formulation of Gels
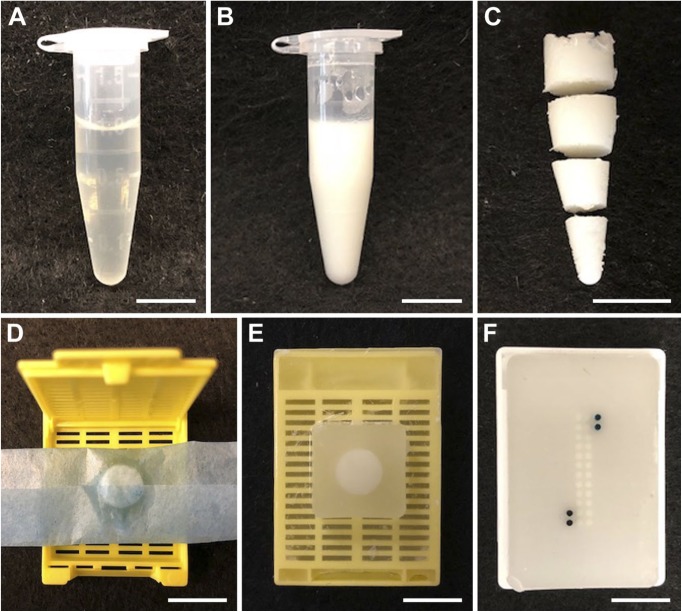
A number of carrier protein solutions were tested for their ability to form mechanically stable, uniform substrates. A solution of BSA in PBS (10–25% w/v) forms a semirigid gel when mixed with an equal volume of 37% formaldehyde and heated briefly to 85C. After further overnight fixation at room temperature, the gel can be processed into paraffin blocks from which TMAs can be created (Fig. 1). Other proteins tested, including chicken egg white (25% w/v) and collagen gelatin (10% w/v), formed mechanically stable gels that could be fixed, embedded in paraffin and sectioned with conventional histological techniques. Egg white protein formed gels that sectioned well and stained uniformly. Collagen gelatin was more difficult to work with when preparing samples, requiring heating to remain liquid, and sections prepared from gelatin blocks stained less uniformly than those prepared from either BSA or egg white protein (Supplemental Fig. 1). Unless otherwise noted, experiments reported below use the BSA/formaldehyde/heat protocol (final concentrations: BSA 12.5% w/v, formaldehyde 18.5% v/v; 10 min at 85C).
Figure 1.
Creation of BSA gel TMA samples. (A) Equal volumes of 25% BSA in PBS with the desired antigen at the appropriate concentration, and 37% formaldehyde are mixed in a 1.5 ml microfuge. (B) The solidified BSA/formaldehyde mixture, after heating at 85C for 10 min (C) The solidified BSA/formaldehyde gel, removed from the microfuge tube and sliced before paraffin embedding. (D) A sliced gel portion prepared for dehydration and paraffin processing. (E) A sliced gel portion embedded in a paraffin “donor block.” (F) A TMA created from various paraffin gel donor blocks. The darkest cores are orientation references containing black and green pigment. Scale bars are 1 cm. Abbreviations: BSA, bovine serum albumin; TMA, tissue microarray; PBS, phosphate-buffered saline.
Detection of Antigen in Gels
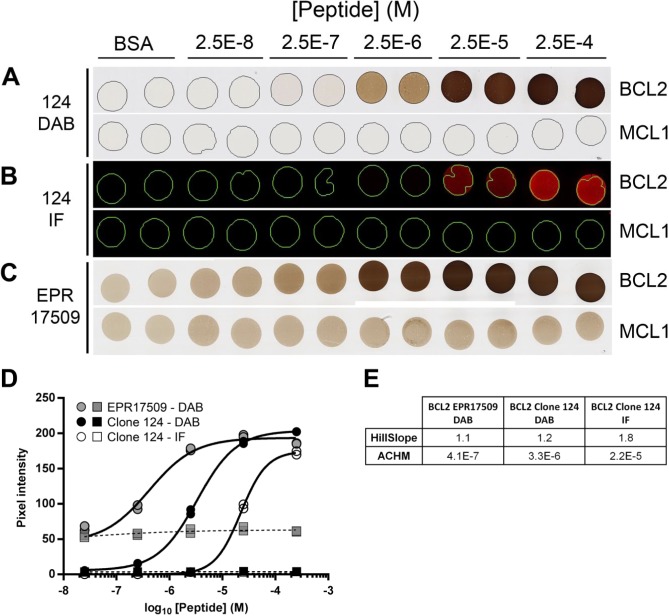
When incorporated in protein gels, synthetic peptides encoding an antibody target epitope can be detected using routine immunohistochemical and immunofluorescent procedures. Donor blocks containing target peptides have relatively homogeneous antigen distribution when assessed by chromogenic assays (Supplemental Fig. 2). A TMA can be constructed containing the desired antigens in a range of antigen concentrations. Figure 2 shows a TMA composed of duplicate cores containing either no added peptide, serial dilutions of a negative control peptide from the human MCL1 protein, or dilutions of peptide encoding amino acids 41–54 of the BCL2 protein. Parallel sections of this TMA were stained with four anti-BCL2 antibodies: clone 124, raised against the same peptide sequence used in the target peptide; SP66 and E17, both raised against peptide antigens C-terminal to the sequence in our reagent29 (see http://www.abcam.com/bcl2-alpha-antibody-sp66-n-terminal-ab93884.html); and EPR17509, raised against an undisclosed BCL2 peptide antigen (see https://www.abcam.com/BCL2-antibody-epr17509-hrp-ab209039.html). Separate slides were stained using chromogenic (all antibodies) and immunofluorescent (for clone 124 only) methods. As expected, SP66 and E17 did not react detectably with any core in the sections from this TMA (Supplemental Fig. 3). With both clone 124 and EPR17509, the signal in the TMA cores increased with increasing concentration of BCL2 peptide (Fig. 2A–C), consistent with a specific interaction between the antibody and antigen in the cores.
Figure 2.
BCL2 IHC on BCL2 peptide TMA. (A) A TMA section stained with anti-BCL2 clone 124 includes duplicate TMA cores containing no added peptide (BSA), a dilution series of peptide encoding amino acids 41–54 of the BCL2 protein, or a negative control peptide from the human MCL1 protein in the concentrations indicated. The images of BCL2 and MCL1 rows are different fields of view from the same TMA section. TMA cores are 1 mm in diameter. A serial section from the same TMA described in (A) is stained with anti-BCL2 clone 124 using immunofluorescent detection (B) or with anti-BCL2 clone EPR17509 using chromogenic detection (C). (D) Quantification of signal in individual cores containing BCL2 peptide (circles) or MCL1 peptide (squares), as illustrated in Panels A-C and detected with anti-BCL2 clone EPR17509 using DAB (gray symbols), or with anti-BCL2 clone 124 using DAB (black symbols) or IF reagents (open symbols). Peptide concentrations reported on the x-axis are as formulated in the control gel solutions before tissue processing. (E) The relevant parameters for the curves illustrated in (D). The HillSlope parameter conveys the steepness of the curve. Abbreviations: IHC, immunohistochemistry; TMA, tissue microarray; DAB, diaminobenzidine; IF, immunofluorescence; ACHM, antigen concentration at half-maximum signal.
Digital image quantification allows a more precise evaluation of the data (Fig. 2D). The fitted curves and the associated parameters reported in Fig. 2E quantify the minimum and maximum signal intensity, the dynamic range, the antigen concentration at which the signal is half-maximal (ACHM), and the steepness of the antigen concentration versus signal intensity curve in this range (HillSlope). With the conditions tested here, non-specific signal in cores containing no added peptide is 2.7% of the maximum detectable signal in the clone 124 chromogenic assay, 1000-fold lower than this in the fluorescent clone 124 assay, and 23% in the EPR17509 assay. In contrast, for EPR17509, the ACHM value, which reflects the relative sensitivity of the assay, is approximately 8-fold lower (i.e., more sensitive) than the ACHM for the chromogenic clone 124 assay, and more than 50-fold lower than the fluorescent clone 124 assay. The immunofluorescent clone 124 assay has a slope 50% to 75% steeper than either chromogenic assay, reflecting the narrower range of antigen concentration between the threshold of detection and maximum signal.
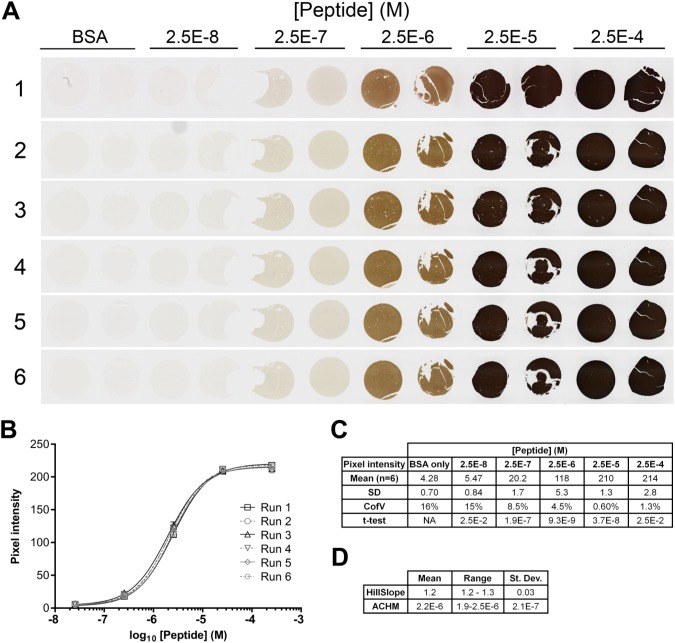
To assess the reproducibility of the peptide controls in repeated assays, a second BCL2 peptide TMA was constructed using a different lot of peptide and new donor paraffin blocks formulated to have the same target BCL2 peptide concentrations as those used to build the TMA in Fig. 2. Replicate sections of this second TMA were stained by two operators, on six separate days in a 6-month interval using the same anti-BCL2 clone 124 chromogenic IHC protocol used in Fig. 2. Quantitative digital image analysis of the stained sections showed the signal intensity for each core was highly reproducible (Fig. 3).
Figure 3.
Reproducibility of replicate sections. (A) Images from six serial sections of a single TMA containing duplicate TMA cores having no added peptide (BSA), or peptide encoding amino acids 41–54 of the BCL2 protein. Each slide was stained for BCL2 using clone 124 on six different days by two operators. Operator 1 stained run 1; operator 2 stained runs 2–6. TMA cores are 1 mm in diameter. (B) Quantification of the images illustrated in Panel A. The average signal from duplicate cores at each peptide concentration on each of the six TMA are shown. Error bars are 1 SD. (C) Summary pixel intensity data for BSA-only and peptide-containing cores illustrated in Panels A and B. The t-test values for each column are relative to the values at the next lowest peptide concentration. (D) The table summarizes the relevant parameters for the curves illustrated in (B). Abbreviations: TMA, tissue microarray; BSA, bovine serum albumin; ACHM, antigen concentration at half-maximum signal.
In parallel experiments, clone 124 was used to stain TMAs containing BCL2 peptide with or without prior antigen retrieval. Results (Supplemental Fig. 4) show that antigen retrieval improves signal strength approximately 6-fold but is not absolutely required.
Stability of Peptide Crosslinking in the Gel Matrix
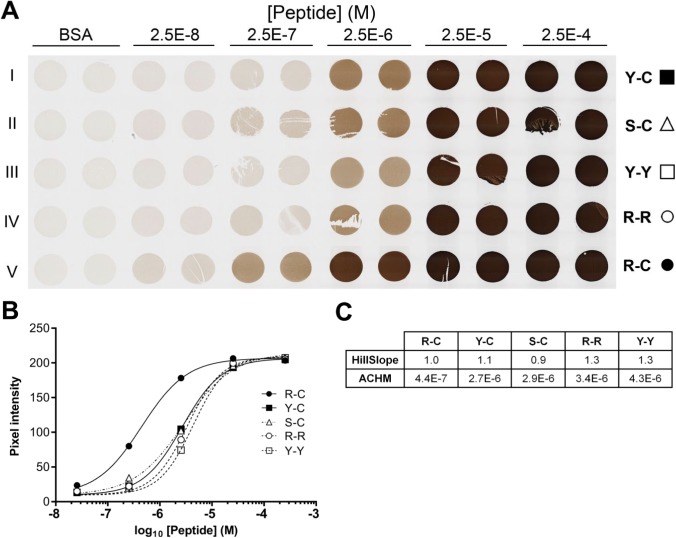
The concentration of peptide that is available to bind antibody will be reduced from the formulated value by three parameters: the efficiency of crosslinking the peptide to the protein matrix, the biochemical integrity of the peptide, and accessibility of the crosslinked peptide to antibody. We intended formaldehyde to crosslink BSA side chains to the target peptides by reaction with the N-terminal tyrosine and C-terminal cysteine included in the peptide sequence. Of the amino acids internal to the BCL2 peptide (A, F, G, I, P, Q, S), only glutamine has been reported to react with formaldehyde.27 To assess the effect of alternative N- and C-terminal amino acids on signal intensity, we tested four variants of the original BCL2 peptide (designated “Y-C”). The N-terminal tyrosine was replaced with serine (designated “S-C”), expected to be minimally reactive with formalin, or with arginine (designated “R-C”), reported to be 50% more reactive than tyrosine.27 Other variants included tyrosine or arginine at both the N- and C-termini (designated “Y-Y” and “R-R,” respectively). TMA cores containing serial dilutions of each peptide were prepared and stained as before. Results show a significantly higher signal for the peptide with N-terminal arginine (“R-C,” Fig. 4). The ACHM for this variant was 4.4 × 10⁻⁷ M peptide, 6-fold lower than the corresponding value for the original Y-C variant. The other variants showed a range of intensities similar to (S-C) or weaker than (R-R, Y-Y) the original Y-C variant. Notably, variants containing arginine or tyrosine at the N-terminus with cysteine at the C-terminus reacted more strongly than peptides with arginine or tyrosine at both ends.
Figure 4.
Alternative peptide N- and C-termini affect signal strength. (A) Images from a single TMA section containing duplicate BSA gel cores having no added peptide (BSA) or 22-amino acid peptides encoding amino acids 41–54 of the BCL2 protein (rows I–V) flanked by the three amino acid sequence, GSG, with alternative N- and C-terminal amino acids as indicated (e.g., the baseline BCL2 peptide sequence is designated “Y-C” to indicate N-terminal acetyl-tyrosine and C-terminal cysteine-amide). TMA cores are 1 mm in diameter. (B) Quantification of the images illustrated in (A). The average signal from duplicate cores at each peptide concentration are shown. Error bars, 1 SD, are smaller than the symbols. (C) The table summarizes the relevant parameters for the curves illustrated in (B). Abbreviations: TMA, tissue microarray; BSA, bovine serum albumin; GSG, glycine–serine–glycine; ACHM, antigen concentration at half-maximum signal.
Generalizability of the Method
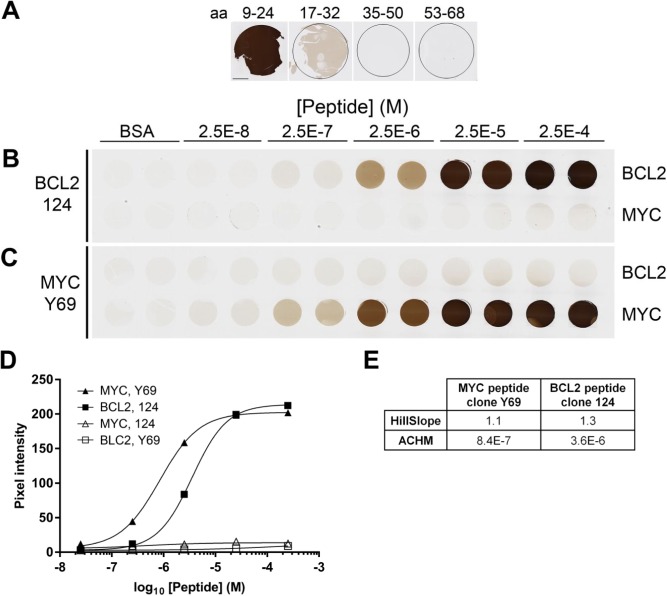
We asked if peptides containing epitopes for proteins other than BCL2 would react in a similar fashion. The anti-MYC antibody Y69 is reported to bind an epitope in the N-terminal 100 amino acids of the human MYC protein (see http://www.abcam.com/c-MYC-antibody-y69-ab32072.html). Candidate epitopes from this region were incorporated into BSA gels as described above and tested for Y69 binding. A peptide containing MYC amino acids 9–24 reacted strongly with the antibody, whereas other peptides reacted only weakly (aa 17–32) or not at all (aa 35–50 and aa 53–68) (Fig. 5 Panel A). A TMA was constructed containing duplicate cores, in the range of concentrations described earlier, of both the MYC aa 9–24 peptide and the BCL2 peptide. Chromogenic detection using anti-BCL2 clone 124 and anti-MYC clone Y69 showed a range of signal intensity, with no cross-reactivity to the non-target peptide (Panels B, C). Quantification of the resulting data (Panel D) shows the MYC protocol has a 4-fold lower ACHM than does the BCL2 protocol, with a similar HillSlope value. Dual immunofluorescent detection on the same TMA used in Fig. 5 was done using serial incubation with both anti-BCL2 and anti-MYC primary antibodies and appropriate detection reagents (Supplemental Fig. 5). Qualitative results (Panel A) showed the expected specificity with no cross-reactivity between either antibody and the non-target peptide. Isotype controls used in place of antigen-specific primary antibodies resulted in no signal (data not shown). Quantification of the resulting fluorescent data shows increased HillSlope parameters and increased replicate variability under the conditions tested, relative to the chromogenic protocol. These results confirm the utility of peptide antigens as IHC controls using diverse epitopes and detection protocols.
Figure 5.
BCL2 and MYC IHC. (A) Sections of donor blocks containing 2.5 × 10⁻⁴ M peptides from human MYC as indicated. (B, C) Replicate TMA sections stained with anti-BCL2 clone 124 (B) or anti-MYC clone Y69 (C) include duplicate cores formulated to contain no peptide (BSA), or peptides encoding BCL2 amino acids 41–54 and MYC amino acids 9–24. TMA cores are 1 mm in diameter. (D) Quantification of the images illustrated in (B) and (C). The average signal from duplicate cores at each peptide concentration are shown. Error bars, 1 SD, are smaller than the symbols in all cases. (E) The relevant parameters for the curves illustrated in (D). The scale bar in (A) is 1 mm. Abbreviations: IHC, immunohistochemistry; TMA, tissue microarray; BSA, bovine serum albumin; ACHM, antigen concentration at half-maximum signal.
Limit of Detection, Reproducibility
The quantitative data obtained allow determination of the LOD and reproducibility of the clone 124 BCL2 IHC assay. The experiments illustrated in Figs. 2 to 5 and Supplemental Fig. 4 represent 10 independent analyses, each with duplicate TMA cores containing no target peptide (blank) and six concentrations of BCL2 peptide. Supplemental Table 1 and Supplemental Fig. 6 summarize the data. According to an accepted clinical laboratory convention,30 the limit of blank (LOB = meanblank + 1.645 × SDblank) for these data is 8.0 pixel intensity units, corresponding to an interpolated peptide concentration of 5.4 × 10⁻⁸ M, and the LOD (LOD = LOB +1.645 × SDlow-positive sample) is 16 pixel intensity units, corresponding to an interpolated value of 2.3 × 10⁻⁷ M peptide. This concentration equates to a formulated antigen density of approximately 140 molecules per µm3 of gel. Consistent with these calculations, results of two-tailed t-test comparisons of data for cores with increasing BCL2 peptide concentrations (Supplemental Fig. 6B) show that cores with 2.5 × 10⁻⁸ M peptide (below the calculated LOD) are not significantly different from cores lacking peptide, whereas cores with 2.5 × 10⁻⁷ M peptide and higher (above the calculated LOD) are statistically different adjacent cores. Notably, signals in cores containing the two highest peptide concentrations are statistically different, despite the fact that the subjective intensity of these cores is similar.
Alternative Targets in BSA Gels—Antibody Validation
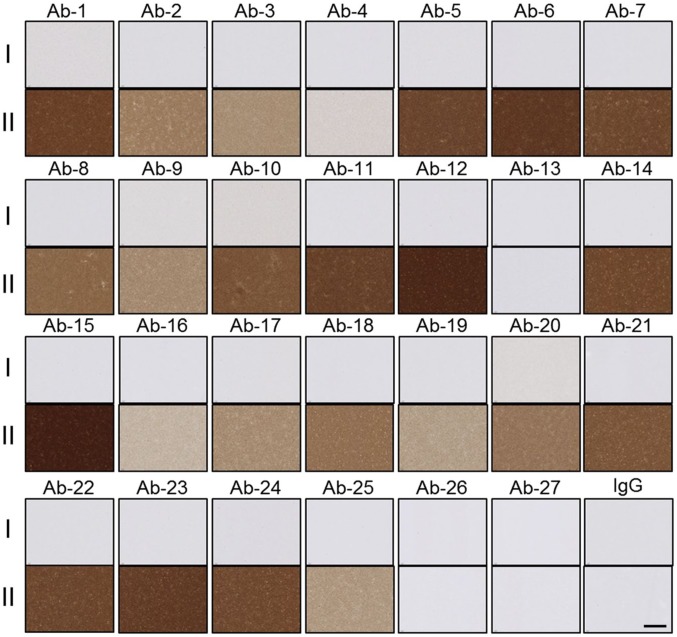
Because not all antibody targets are encoded in short linear peptides, we asked if larger protein domains and full-length proteins could also be detected in protein matrix gels. The C-terminal 301 amino acids of the human KSR2 protein, encoding the entire protein kinase domain, was incorporated into a BSA gel and used to evaluate antibodies generated from hybridoma candidate clones. Mice immunized with the KSR2 kinase domain were used to generate a panel of hybridoma antibodies that were prescreened by enzyme-linked immunosorbent assay (ELISA) for reactivity to the antigen. Candidate antibodies with positive ELISA reactivity were then screened on control samples of BSA gels with no added protein or with KSR2 antigen (0.5 mg/ml; 6.3 × 10⁻⁶ M). Staining distinguished hybridoma clones that react specifically with the KSR2 kinase domain in the formalin-fixed, paraffin-embedded format from those that react non-specifically or not at all. Several clones with notably strong and specific staining (Ab-5, Ab-6, Ab-7, Ab-11, Ab-12, Ab-15, and Ab-23; Fig. 6) were identified as candidates for more detailed follow-up in tissues. Anti-KSR2 antibodies Ab-5, Ab-6, Ab-7, Ab-11, and Ab-12 were further tested for reactivity against KSR2 protein with or without prior antigen retrieval. For all five antibodies, antigen retrieval was absolutely required for reactivity (Supplemental Fig. 7). This contrasts with the results with BCL2 peptides, for which antigen retrieval improves signal strength approximately 6-fold, but is not absolutely required (Supplemental Fig. 4).
Figure 6.
Anti-KSR2 antibody characterization. Images show reactivity of 27 ELISA-positive mouse anti-KSR2 antibodies and naive mouse IgG, against sections containing no KSR2 protein (rows I), or 6.3 × 10⁻⁶ M of the KSR2 kinase domain (rows II). The scale bar is 100 µm.
As a test of full-length proteins, a TMA containing 0.1 mg/ml (6.7 × 10⁻⁷ M) of rabbit, rat, and mouse full-length IgG incorporated into BSA gels was used as a technical control for IHC assays employing biotinylated donkey antirabbit, antirat, and anti-mouse secondary antibodies in detection steps. The results show the expected signal and specificity of the antirabbit, anti-mouse, and antirat secondary antibodies (Fig. 7). In this figure, incorporated rabbit IgG detected with donkey antirabbit IgG secondary antibody shows 136 units of pixel intensity. Assuming quantitative retention of the added rabbit IgG, 1 µm3 (10−15 L) of this sample contains 6.7 × 10⁻²² mol, or about 400 molecules of rabbit IgG.
Figure 7.
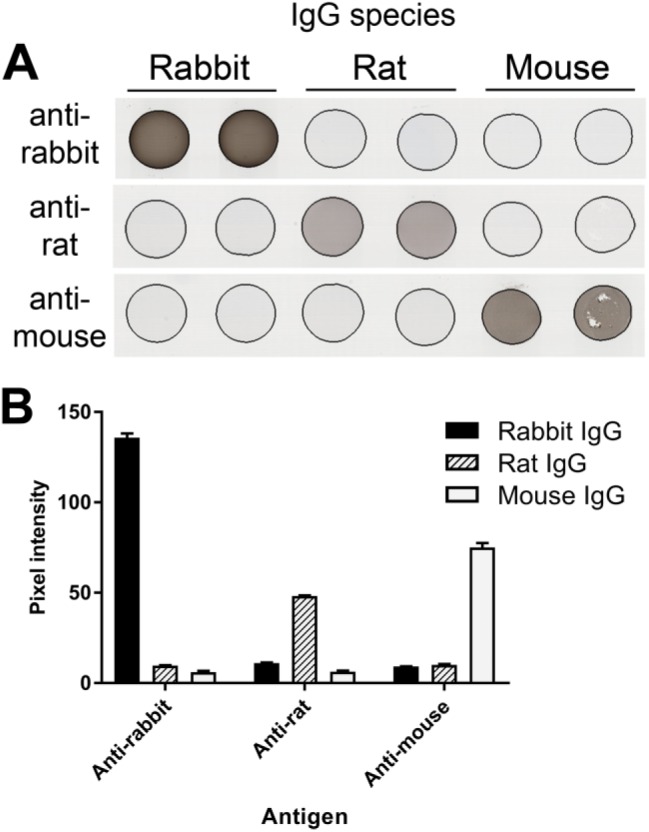
BSA gels with mouse, rat, and rabbit IgG. (A) Serial sections of a TMA composed of duplicate BSA gel cores containing either naive rabbit, rat, or mouse IgG (0.1 mg/ml; 6.7 × 10⁻⁷ M) were stained with donkey secondary antibodies specific to IgG from the indicated species. TMA cores are 1 mm in diameter. (B) Quantification of images illustrated in (A). For each species-specific antibody, signal in cores containing the target IgG is significantly higher than for cores containing the non-target IgGs (p<0.0001). Error bars are 1 SD. Abbreviations: BSA, bovine serum albumin; TMA, tissue microarray.
Alternative Fixatives for Making Gels
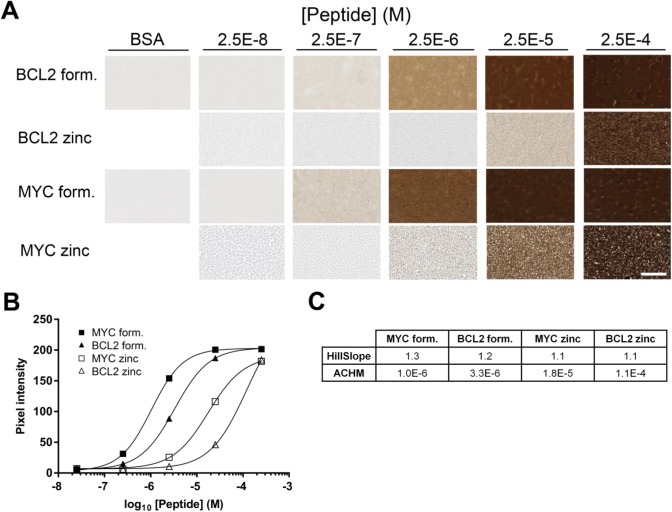
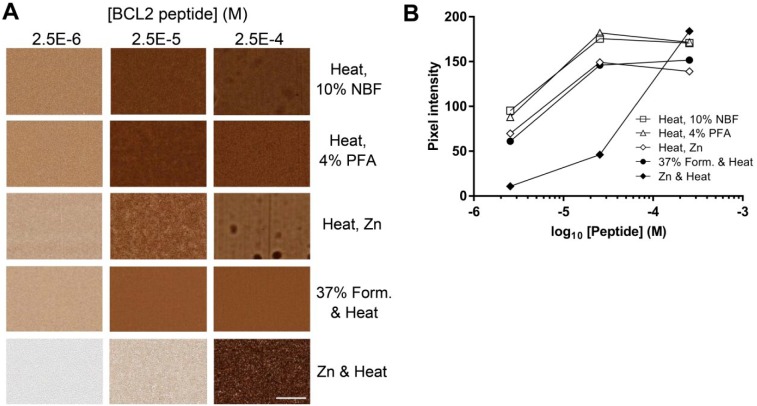
Because some epitopes are rendered non-reactive by formalin-containing fixatives, we tested a commercially available formalin-free zinc fixative as an alternative to the 37% formaldehyde used in previous experiments. Donor blocks containing BCL2 and MYC peptides in BSA gels were fixed with either formalin or zinc-based fixatives with heating to 85C (Fig. 8). For both BCL2 and MYC peptides, the signal was approximately 10-folds stronger with formaldehyde fixation than with zinc fixation during heating. The loss of signal strength correlated with heating in the presence of zinc. Alternative procedures in which BSA—antigen mixtures were heated to 85C in the absence of fixative, followed by fixation at room temperature in a variety of fixatives (4% paraformaldehyde, NBF, zinc-containing formalin-free fixative) resulted in comparable signal to our standard protocol (Supplemental Fig. 8). This demonstrates that the technique can accommodate a variety of fixatives, potentially broadening the range of epitopes and antibodies that could be used.
Figure 8.
IHC results in gels made with alternative fixatives. (A) Donor cores were prepared with BCL2 or MYC peptide by heating 10 min at 85C in the presence of 18.5% formaldehyde or 50% zinc fixative. Donor blocks were formulated to contain either no peptide (BSA), and peptides encoding either BCL2 amino acids 41–54 or MYC amino acids 9–24 at the indicated concentrations. Sections were stained with anti-BCL2 clone 124 or anti-MYC clone Y69 as appropriate. (B) Quantification of the images illustrated in (A). (C) The relevant parameters for the curves illustrated in (B). The scale bar in A is 50 µm. Abbreviations: IHC, immunohistochemistry; BSA, bovine serum albumin; ACHM, antigen concentration at half-maximum signal.
Fluidigm Hyperion Analysis
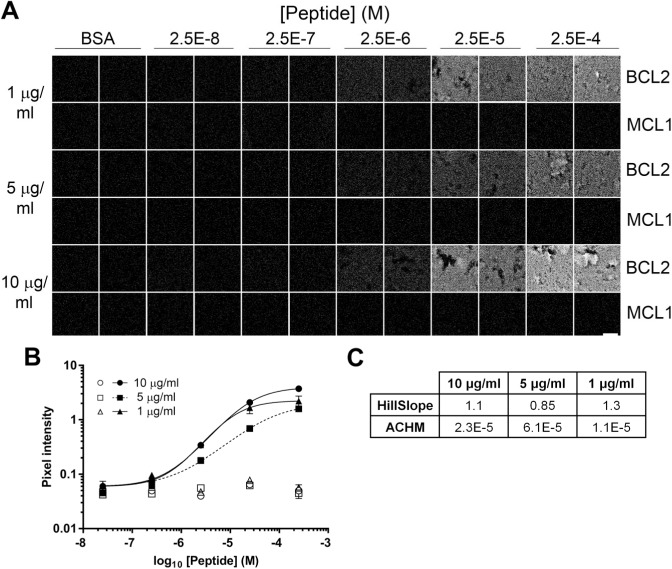
In the experiments reported above, we do not know the number of chromogen or fluorochrome molecules deposited for each molecule of antibody bound, so we cannot calculate the absolute concentration of epitope detected. To avoid this limitation, we tested a more quantitative direct detection procedure using the Hyperion mass spectrometry-based imager. Sections of the BCL2 peptide TMA were stained with 146Nd-labeled anti-BCL2 antibody EPR 17509, then analyzed by UV laser ablation and quantitative mass spectrometry. The TMA sample quantified was typically an area 150 µm square by 4 µm thick, containing 9 × 104 µm3. Results show a graded signal that increases as the BCL2 peptide concentration in the target increases (Fig. 9). The EPR17509 antibody signal in cores containing no peptide or in cores containing the negative control MCL1 peptide was less than 3% of the maximum signal.
Figure 9.
Fluidigm 146Nd-EPR17509 analysis of BCL2 peptide TMA. (A) Representative fields of view (150 µm square) of TMA sections stained with anti-BCL2 clone EPR17509 conjugated to a 146Nd mass spectrometry tag and imaged in a Fluidigm Hyperion scanning mass spectrometer. Duplicate TMA cores contain no added peptide (BSA), peptide encoding amino acids 41–54 of the BCL2 protein, or a negative control peptide from the human MCL1 protein in the concentrations indicated. (B) Quantification of the images illustrated in (A) Solid symbols: BCL2 peptide; open symbols: MCL1 negative control peptide. Error bars indicate 1 SD. (C) The table summarizes the relevant parameters for the curves illustrated in (B). The scale bar in A is 50 µm. Abbreviations: TMA, tissue microarray; BSA, bovine serum albumin; ACHM, antigen concentration at half-maximum signal.
The correlation between measured ion counts and antibody concentration was determined by analyzing known amounts of 146Nd-labeled antibody spotted directly onto glass slides. The resulting calibration data (Table 2) showed a ratio of approximately 340 antibody molecules per 146Nd ion detected. By comparing the amount of BCL2 peptide formulated in each TMA core sample with the amount of 146Nd-labeled anti-BCL2 antibody measured, we determined the fraction of BCL2 peptide that was detectable in the TMA cores. Results (Table 3) show that the amount of detectable BCL2 peptide increases with increasing peptide concentration, as expected. The results also show that the proportion of added BCL2 peptide that is detectable decreases as the antigen concentration increases; 1.4% of the added peptide is detectable at 2.5 × 10⁻⁷ M, whereas ~0.14% of added peptide is detected at 2.5 × 10⁻⁴ M.
Table 2.
Fluidigm Antibody Ion Quantification.
| 146Nd Ab Mass | 146Nd Ab Molecule Number | 146Nd Ion Counts From Control Spot | Ion Count Fold Change Versus 1 ng | Ab Molecule Per 146Nd Ion Count |
|---|---|---|---|---|
| 1 ng | 4E9 | 1.57E7 | NA | 254 |
| 5 ng | 2E10 | 8.09E7 | 5.17 | 247 |
| 10 ng | 4E10 | 7.91E7 | 5.03 | 506 |
The integrated ion counts recorded for one µL volumes containing 1, 5, and 10 µg/ml of 146Nd-EPR17509 are reported here.
Table 3.
Fluidigm Antibody Bound by BCL2 Peptide-containing Cores.
| [BCL2 Peptide] (M) | Integrated Ion Counts Per ROI
(SD) |
||||||||
|---|---|---|---|---|---|---|---|---|---|
| 10 µg/ml Ab | 5 µg/ml Ab | 1 µg/ml Ab | Mean Ion Count (SD) | Ion Count Above “None” | 146Nd Ab Detected Per ROI (mol) | Peptide Formulated Per ROI (mol) | 146Nd Ab/Peptide | p Value Group Versus “None” | |
| 2.5E-4 | 87,658 (418) | 36,224 (1357) | 50,639 (12,031) | 58,174 (26,532) | 56,997 | 3.20E-17 | 2.25E-14 | 0.14% | 2.26E-3 |
| 2.5E-5 | 44,033 (6616) | 15,836 (1015) | 38,037 (8290) | 32,635 (14,854) | 31,459 | 1.76E-17 | 2.25E-15 | 0.78% | 2.80E-3 |
| 2.5E-6 | 7372 (652) | 4099 (272) | 7725 (31) | 6399 (2000) | 5222 | 2.93E-18 | 2.25E-16 | 1.30% | 8.61E-4 |
| 2.5E-7 | 1653 (147) | 1385 (15) | 2179 (280) | 1739 (404) | 562 | 3.15E-19 | 2.25E-17 | 1.40% | 1.46E-2 |
| 2.5E-8 | 1478 (346) | 1021 (65) | 1432 (28) | 1310 (251) | 134 | 7.50E-20 | 2.25E-18 | 3.33% | 3.22E-1 |
| None | 1067 (125) | 1130 (71) | 1333 (31) | 1177 (139) | NA | NA | NA | NA | NA |
Ion count data from TMA cores containing BCL2 peptide at the indicated concentrations are correlated with ion count data per antibody molecule (from Table 2), and with the calculated mass of BCL2 peptide in each imaged core volume. Calculations show 0.14% to 1.4% of the formulated peptide molecules detectably bind antibody. Abbreviations: ROI, regions of interest; TMA, tissue microarray.
Discussion
We explore here conditions that allow the incorporation of target epitopes in the form of short linear peptides, protein domains, or entire proteins into homogeneous protein gels of known composition. Antigen-containing gels can be created using materials and methods available in any histology laboratory, and can be embedded and sectioned to produce uniformly stained samples. We demonstrate that the method is compatible with a variety of fixatives and with detection using chromogenic, immunofluorescent, and mass spectrometry-based methods. The choice of possible antigens is limited only by the availability of the target protein or knowledge of the linear epitope sequence. The ability to create synthetic controls of known composition offers the opportunity to more precisely characterize and control routinely used IHC protocols, independent of complicating factors inherent in heterogeneous tissue samples, and subjective human interpretations.
Antigens in synthetic gels, as in fixed tissues, must be immobilized while preserving antibody access and reactivity. We determine the antigen concentration added to the synthetic gels, but the amount of detectable antigen reflects variables that are less easily assessed: the fraction of added antigen retained in sections on a slide, the chemical integrity of the incorporated antigen, and the ability of antibody to access and bind the retained epitope. Multiple experimental factors affect these variables.
Because routine histology samples are prepared by formalin fixation, we focused our efforts on samples prepared with formaldehyde crosslinking. The concentration of formaldehyde in our standard procedure (18.5% final; 6.2 M) is 5-fold higher than used routinely in histology labs. This method is compatible with both antigen retention in the gels and with preservation of immunoreactivity. Antigens that require other fixatives can be accommodated. In alternative protocols, heat-denatured BSA-antigen mixtures that were postfixed in 10% NBF, 4% PFA, or zinc salts showed signal approximately comparable to that seen with our standard protocol. Other crosslinking strategies with highly selective chemistry, for instance, azide-alkyne addition, could be explored, and appropriate crosslinking chemistries could be applied to carbohydrate, lipid, or other chemical epitopes.
The majority of epitopes reactive in FFPE tissue sections are thought to be contained in relatively short peptide sequences22,24,26,31–33 amenable to the procedures we describe here. If unknown, linear epitopes can be identified by a variety of relatively high-throughput strategies.34–36 Synthetic peptides of any desired sequence and many recombinant proteins are available from commercial sources at relatively modest cost. We demonstrate here proof of concept detection of linear peptide epitopes from BCL2 and MYC using antibodies specific to each protein. We further demonstrate detection of full-length IgG and a 301-amino acid kinase domain from human KSR2.
The target epitope concentrations formulated and tested here span four orders of magnitude, from 2.5 × 10⁻⁸ M to 2.5 × 10⁻⁴ M, extending to the upper end of the range of protein concentrations found in tissue. At the high end of this range, average intermolecular distance is less than 20 nM, approaching the distance between the two arms of a full-length IgG molecule (~14 nM). Only very abundant proteins reach this density. For example, the cytoplasmic motor protein actin is present in skeletal muscle at 17 µg/mg tissue wet weight,37 equivalent to approximately 4 × 10⁻⁴ M. The transmembrane receptor HER2 is present in some breast tumor tissue with IHC 3+ signal at concentrations of ≥2000 amol (2 × 10⁻¹⁵ mol)/µg protein.38 Assuming a tissue protein concentration of 15% (w/v), this equates to 3 × 10⁻⁷ M HER2 averaged over the entire volume of the sample. The local concentration of HER2 protein in the outer cell membrane, a volume several hundred-fold less than the whole cell, will be correspondingly higher, in the range of 10−5 M to 10−4 M.
The protein concentration used in this procedure is in the range (7–25%) found in many tissues,39 and so reproduces some mechanical and biochemical tissue properties. However, these simplified synthetic gels do not reproduce the spatial relationships between proteins in tissues that may influence epitope reactivity with formaldehyde. The gels eliminate other challenges found in real tissue including proteins with cross-reactive epitopes, glycoproteins or other components that may limit antibody penetration, or molecules such as biotin that contribute to non-specific binding. Despite this, we demonstrate that antigens in the gels do reproduce some characteristics of epitopes found in native tissue environments, including sensitivity to antigen retrieval. For example, KSR2 kinase domain was detectable only with prior antigen retrieval, consistent with the behavior of many epitopes in FFPE tissue.
At 12.5% w/v (1.8 mM), BSA is in 7-fold molar excess relative to the highest concentration of peptide incorporated into the gels. The amino acids reported to be most highly reactive with formaldehyde (K, R, Y)40 comprise 18% of the BSA sequence and are present in more than 750-fold excess relative to the highest concentration of epitope used in these experiments. The molar content of K, R, and Y in BSA is higher than in egg white and gelatin. In particular, BSA contains 80% more lysine than chicken egg white proteins,41 and three times as much lysine as gelatin,42 facilitating the crosslinking by formalin of added peptide or protein antigens. Although the fraction of these side chains that are in conformations favoring formaldehyde crosslinking is unknown, heat denaturation of protein during preparation of the gels exposes amino acids that normally would be buried in the native structure.
To facilitate peptide crosslinking to BSA protein, we included tyrosine and cysteine at the N- and C-termini, respectively, as both are reported to react efficiently with formaldehyde or formaldehyde-modified amino side chains.27,28,40,43 Alternative terminal amino acids had a measurable impact on the detection of the target epitopes. Substitution of the N-terminal tyrosine by arginine improved detection, as revealed by a smaller ACHM value, of the BCL2 epitope by approximately 6-fold (Fig. 4). In contrast, a peptide with arginine at both N- and C-termini had a 7-fold lower signal (ACHM) relative to a peptide with arginine at the N-terminus only. Similarly, a peptide with tyrosine at both N-and C-termini showed 2-fold weaker signal than the peptide with tyrosine only at the N-terminus. These latter results are consistent with the report that cysteine was the most formaldehyde-reactive of 20 amino acids tested in the C-terminal position of a short peptide.28
Although precise characterization of the chemical bonding in our samples is outside the scope of this work, there are many possibilities. Monomeric peptides could bind by either end to lysine or other side chains of BSA. In addition, peptide monomers could form linear or branched multimers which could then crosslink to BSA. Non-productive reactions might also occur, either by intrapeptide side chain reactions (e.g., forming circular molecules that are not efficiently crosslinked to BSA) or by formaldehyde modification of amino acids that are critical for antibody binding to the epitope. Peptides of different sequences may have an altered balance between these paths with consequences for peptide retention, antibody accessibility, and reactivity.
The robust detectability of epitopes containing multiple formalin-reactive amino acids was not unexpected. We note that the BCL2 epitope (amino acids 41–54) has only one amino acid reported to react with formaldehyde: Q52.27,40 In contrast, the MYC epitope recognized by clone Y69 (amino acids 9–24) contains eight potentially reactive amino acids: N9, R10, N11, Y12, Y16, Q20, Y22, and Y24. As reported for residues in peptides from insulin40 and other sequences,28 potentially reactive side chains are variably modified by formaldehyde. In fact, the ACHM observed for Y69 binding to the MYC epitope was approximately 4-fold lower than for clone 124 binding to the BCL2 epitope, reflecting greater sensitivity of the MYC staining protocol despite the higher content of formalin-reactive amino acids in the target epitope. Consistent with this result, other epitopes containing formaldehyde-reactive amino acids, for instance, FKEL in Ki-6744 and others,31 are robustly detectable in formalin-fixed tissue.
Our work extends previous efforts to identify practical “artificial tissue” controls.12 Broadly, these efforts took two approaches. The first created glutaraldehyde-fixed gels into which target antigens, typically intact proteins (e.g., IgA, IgG, IgE), were allowed to diffuse for days or weeks.12,15,16 This required antigen in excess of the amount incorporated in the final sample and may have been challenging to control precisely. The second approach, most similar to the method we describe here, solidified a solution of carrier protein and antigen with a variety of fixatives.13,14,19 Different from these reports, we used heat-denatured BSA as the preferred gel matrix, we showed the method works well with short peptide antigens, and we designed peptides to favor chemical crosslinking by formaldehyde. Heat-denaturation of the carrier protein may favor antigen crosslinking by exposing chemically reactive but otherwise inaccessible carrier protein side chains. BSA is a particularly suitable substrate because it is readily available, inexpensive, and enriched in the amino acids most reactive with formaldehyde. The suitability of peptides as IHC controls has been studied in detail in Steven Bogen’s laboratory, with the identification and immobilization of peptides recognized by clinically relevant antibodies to ER, PR, HER2, and others.9–11,22–24,26,31 These and other authors34–36 demonstrated the utility of short linear peptides coupled to solid supports as surrogates for full-length proteins in many antibody-mediated detection systems. Based on studies documenting the relative reactivity of peptide amino acid side chains with formaldehyde, and parameters including steric accessibility that affect formaldehyde reactivity,27,28,40,43 we included amino acids and spacer sequences at both the N- and C-termini intended to favor formaldehyde-mediated crosslinking. Although our focus has been on formaldehyde-fixed samples, pilot studies with non-crosslinking fixatives show that other conditions can produce useful peptide and protein antigen synthetic controls. There are certainly many opportunities to further optimize the approaches we describe.
Applications for this technique are both qualitative and quantitative. Qualitatively, the technique allows ELISA-positive antibody candidates to be efficiently tested against the target epitope incorporated into formaldehyde-fixed protein gels (see Fig. 6). The subset of antibodies reactive in that format can be selected for further study in FFPE tissue. Similarly, the IgG secondary antibody controls illustrated in Fig. 7 are routinely included during antibody selection work in TMAs containing target antigen, tissue, or cell pellet cores. In the event that a candidate antibody does not stain the test samples, detectable signal in the core containing the appropriate IgG confirms that the reagents were dispensed correctly and that the secondary antibody and detection chemistry performed as expected. The controls confirm that the assay was technically satisfactory and that an antibody is, in fact, unreactive with the target antigen.
The most compelling application of these controls may be in the quantitative, objective evaluation, optimization, and calibration of IHC protocols intended for research and diagnostic uses. We demonstrate that quantitative parameters relevant to IHC assay performance in tissues—nonspecific background, LOD, dynamic range, ACHM, and Hill Slope—can be assessed with objectively definable precision in any laboratory with access to a digital slide scanner and basic image analysis capabilities. We demonstrate that these parameters can vary with different experimental conditions when using one antigen-antibody pair, with different antibodies detecting the same antigen and with different antibody/antigen pairs. For instance, measured ACHM values differed by more than 50-fold in the three BCL2 assays shown in Fig. 2. In a series of 10 replicate experiments with the clone 124 BCL2 assay, the calculated data parameters for log(ACHM) and HillSlope have coefficients of variation of less than 10%, but even higher precision may be possible. Our experiments used serial 10-fold dilutions of antigens across a physiological range (2.5 × 10⁻⁸ to 2.5 × 10⁻⁴ M), but the precision of ACHM and slope quantification could potentially be improved by including more samples between 10% and 90% of the dynamic range of the assay. We expect that by studying the correlation between protocol variables and the measured assay parameters, investigators will be able to adjust experimental conditions to meet the diagnostic needs of the assay. Because assay performance can be assessed more objectively and precisely than is possible by subjective human evaluation of tissues or cell pellets, the performance of assays can be tailored more precisely to the clinical need, and more rigorously controlled.
Hardware- and software-specific differences in digital slide scanners may result in different measured image intensities for samples with identical absorbances. Correlation of assays at different sites using different scanning hardware would require machine-specific intensity data to be normalized to a universal scale. For simplicity, we have not transformed the raw intensity values reported here to a universal scale, but a standard curve can be determined by imaging neutral density filters with a range of known optical densities.
Although the concentration of antigen added to the gels is known, the amount of antigen that is retained and available for antibody binding is less than the amount added. Three lines of evidence support this conclusion. First, anecdotal evidence indicates that epitope retention in the synthetic matrix is imperfect. In some experiments, DAB signal streaking is seen around gel sections containing high concentrations of peptide epitope. Gel sections with larger areas and higher concentrations of antigen show this effect most clearly. Adjacent sections of negative control gel on the same slide can become artifactually stained, apparently by free peptide that secondarily binds to the negative control BSA gel matrix. This may reflect either incomplete chemical crosslinking during gel formulation or reversal of effective crosslinking by antigen retrieval steps during the staining process. However, donor block samples show uniform staining across the diameter of the samples, with no evidence of diffusion of peptide from the edges of the block (see Supplemental Fig. 2), suggesting that peptide loss from the gel samples during staining is an insignificant fraction of the total. We note that the zinc-containing fixative, which does not form covalent intermolecular bonds, appears to perform as well as formaldehyde-containing fixatives in some conditions (see Supplemental Fig. 8). Second, as discussed before, amino acids at the N- and C-termini of the peptide antigens measurably affect signal intensity for a single peptide sequence (Fig. 4). Lastly, imaging mass spectrometry using direct detection of metal-labeled primary antibodies indicates only a fraction of added peptide is detectable. The lower limit of detectable BCL2 peptide in the Fluidigm assay (2.5 × 10⁻⁷ M peptide) corresponds to 150 molecules of antigen per µm3 of gel. However, only 0.14% to 1.4% of this amount of 146Nd -labeled antibody was detectable in the same volume of gel (Table 2). It remains to be determined to what extent the undetected epitope is due to incomplete retention of peptide in the matrix, incomplete epitope accessibility to the antibody, or chemical modification of the epitope by formaldehyde.
Synthetic controls with a range of antigen concentrations allow IHC staining protocols to be optimized, quantified, and controlled over time using a reproducible standard. The concept described here allows quality control of an IHC assay at a level intermediate between the two extremes of assessing the interaction between purified antibodies and antigens under controlled in vitro conditions and assessing antibody reactivity in tissue samples by empirical optimization. We emphasize that our approach does not obviate the need to understand and control tissue-specific preanalytic variable (e.g., warm and cold ischemia time, fixation conditions) that affect antigen detection in clinical samples. Because these control samples cannot predict precisely how native epitopes will react in tissue sections, we propose that they be used thoughtfully, in the context of other information, to optimize and standardize IHC protocols.
We foresee application of this method to ongoing quantitative immunohistochemical analyses. A synthetic antigen gel sample is homogeneous, has a uniform thickness, and contains a known number of epitope molecules, allowing correlation of signal intensity to antigen concentration. An on-slide TMA section including a useful range of epitope concentrations can easily fit adjacent to a diagnostic tissue section, permitting assay technical adequacy, or quantitative image analysis to be assessed on any slide. Because the components and procedures used in this method are completely defined, reagents created in different laboratories should, in principle, be functionally similar. We hope this approach will allow investigators to compare and calibrate protocols used in different laboratories, to communicate more clearly when describing qualitative staining endpoints, and ultimately, to more precisely control IHC assays used both in research and patient care decision making.
Acknowledgments
The authors thank Jeffrey Tom and Aimin Song for peptide synthesis advice and support, Genentech Protein Engineering for KSR2 domain expression and purification. The authors would also like to thank Joyce Lai and Scott Stawicki who work in Antibody Engineering, and Avinash Venkatanarayan for anti-KSR2 antibody generation; Margaret Solon for dual BCL2/MYC IF assay design; Shari Lau for experimental assistance; Wendy Lam and Rommel Arceo for TMA (tissue microarray) construction; Carmina Espiritu for histology support; Joanna Yung and Melissa Gonzalez Edick for digital scanning support; and Thinh Pham and Deb Dunlap for inspiration.
Supplemental Material
Supplemental Figure 1.
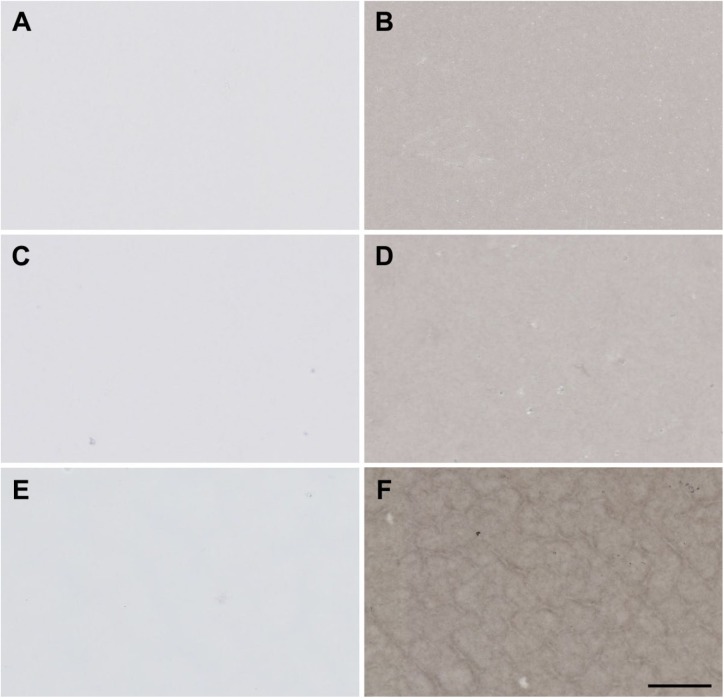
Gels composed of alternative protein matrices. Images show protein gels containing final concentrations (w/v) of 12.5% BSA (A, B), 12.5% egg white (C, D), or 10% gelatin (E, F) with either no other protein (A, C, E) or 0.1 mg/ml naive rabbit IgG (B, D, F). Sections were stained with donkey anti-rabbit IgG secondary antibody. The scale bar is 50 µm. Abbreviation: BSA, bovine serum albumin.
Supplemental Figure 2.
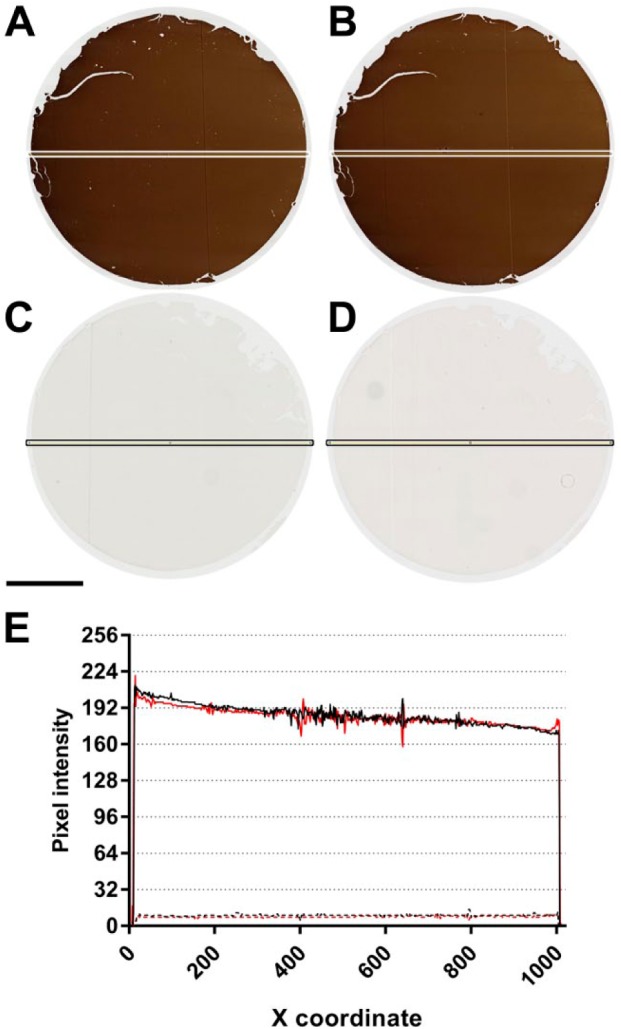
Donor block uniformity. Four µm-thick “donor block” sections of BSA gel containing 5 × 10⁻⁵ M BCL2 peptide (A, B) or no peptide (C, D) were stained with anti-BCL2 clone 124 in two separate experiments (Experiment 1: A, C; Experiment 2: B, D). Digital images of the stained sections were quantified along the horizontal axis using the Plot Profile function in ImageJ. Results are shown in (E). Experiments 1 and 2 are indicated in black and red, respectively. Data for BCL2 peptide and BSA-only control sections are indicated in solid and dashed lines, respectively. Line scans along the vertical axes of the same sections showed similar results (data not shown). The scale bar is 2 mm. Abbreviation: BSA, bovine serum albumin.
Supplemental Figure 3.
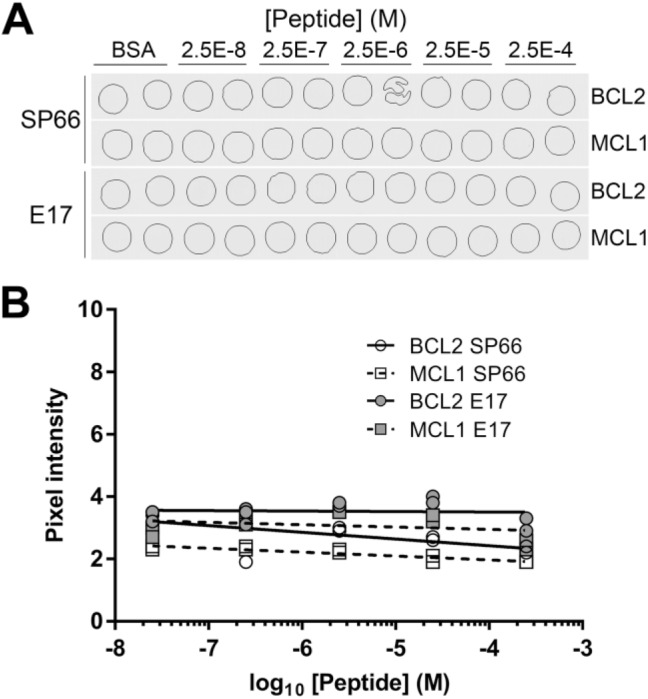
Alternative BCL2 antibodies. (A) Sequential sections of a single TMA contain BSA gel cores having no added peptide (BSA), peptide encoding amino acids 41–54 of the BCL2 protein, or a negative control peptide from the human MCL1 protein. Two slides were stained chromogenically for BCL2 antigen using anti-BCL2 clone SP66 or clone E17. TMA cores are 1 mm in diameter. (B) Quantification of the images illustrated in (A). Abbreviations: BSA, bovine serum albumin; TMA, tissue microarray.
Supplemental Figure 4.
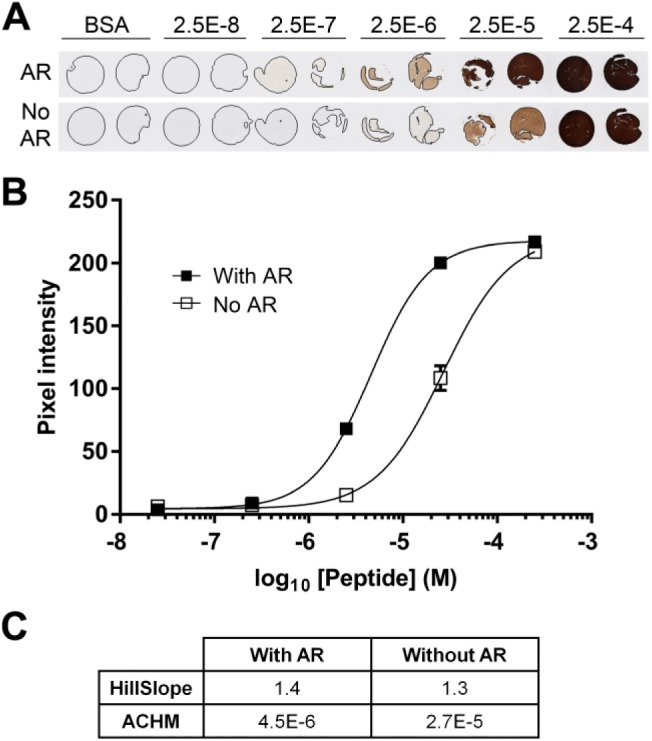
BCL2 peptide with and without antigen retrieval. (A) A TMA contains BSA gel cores having no added peptide (BSA), or peptides encoding amino acids 41–54 of the BCL2 protein at the indicated concentrations. Sections were stained with (AR) or without (No AR) prior antigen retrieval. TMA cores are 1 mm in diameter. (B) Quantification of the images illustrated in (A). The average signal from duplicate cores at each peptide concentration are shown. Error bars are ±1 SD. (C) The table summarizes the relevant parameters for the curves illustrated in (B). Abbreviations: TMA, tissue microarray; BSA, bovine serum albumin; ACHM, antigen concentration at half-maximum signal.
Supplemental Figure 5.
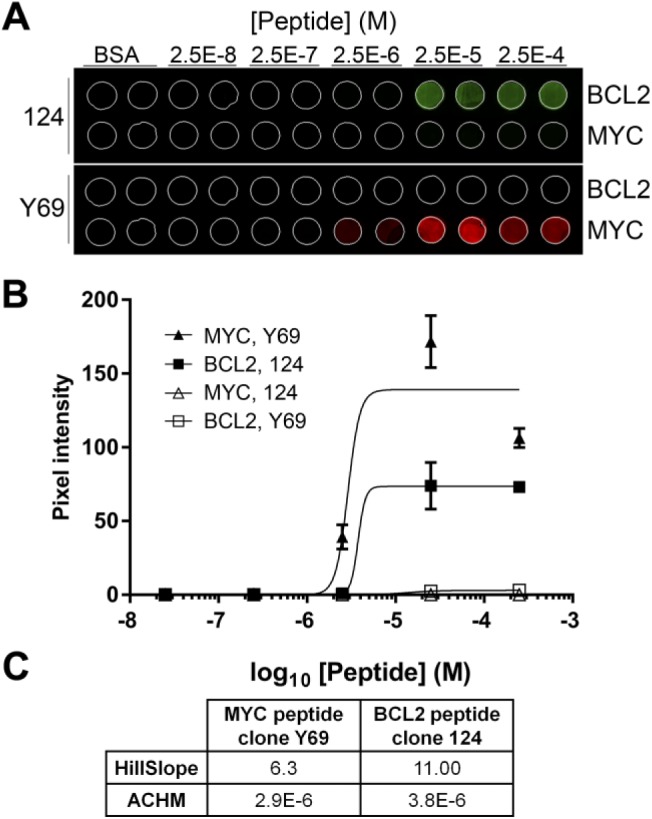
Dual MYC-BCL2 IF image analysis. (A) A single section from a TMA includes cores with no peptide (BSA), or with peptide encoding BCL2 amino acids 41–54 and MYC amino acids 9–24. The section was stained sequentially with both anti-BCL2 clone 124 and anti-MYC clone Y69, detected with Ventana Discovery FAM (BCL2; green) or Discovery Cy5 (MYC; red) kits, then imaged in the appropriate wavelengths for each fluorochrome. TMA cores are 1 mm in diameter. (B) Quantification of the images illustrated in Panel A. The average signal from duplicate cores at each peptide concentration are shown. Error bars are ±1 SD. (C) The table summarizes the relevant parameters for the curves illustrated in (B). Abbreviations: TMA, tissue microarray; BSA, bovine serum albumin; ACHM, antigen concentration at half-maximum signal.
Supplemental Figure 6.
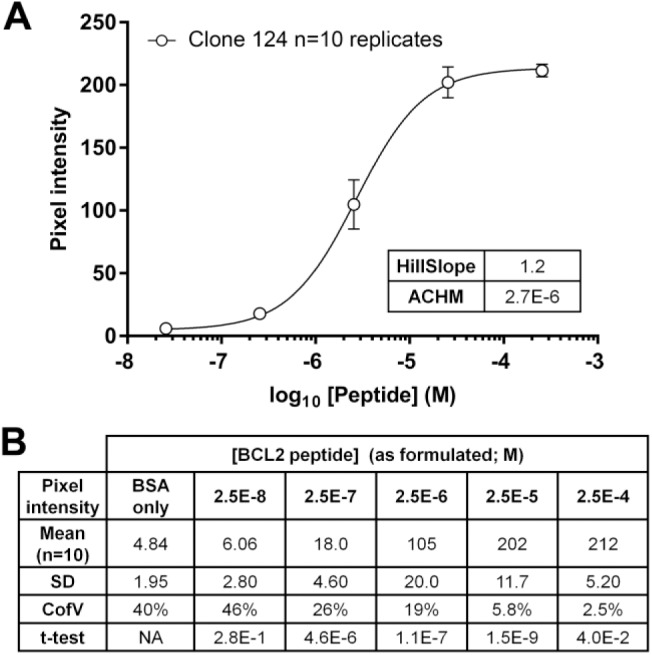
Aggregate anti-BCL2 clone 124 data. (A) Data from Fig. 2A, 3A, 4A(I), 5B, and Supplemental Fig. 4 (n=10 independent IHC assays, each with duplicate cores at each peptide concentration) were grouped and plotted. Error bars are ±1 SD (n=10). The table shows the relevant parameters for the curve. (B) Mean pixel intensity values. Data from the 10 individual BCL2 clone 124 IHC assays reported in Figs. 2, 3, 4, 5, and Supplemental Fig. 4 are listed; for each experiment, the means of duplicate TMA cores at each peptide concentration, corrected for the background intensity of the glass slide (19.2 ± 0.5 units), were used in the calculation. The t-test values for each column are relative to the values at the next lowest peptide concentration. Abbreviations: IHC, immunohistochemistry; TMA, tissue microarray; ACHM, antigen concentration at half-maximum signal; BSA, bovine serum albumin.
Supplemental Figure 7.
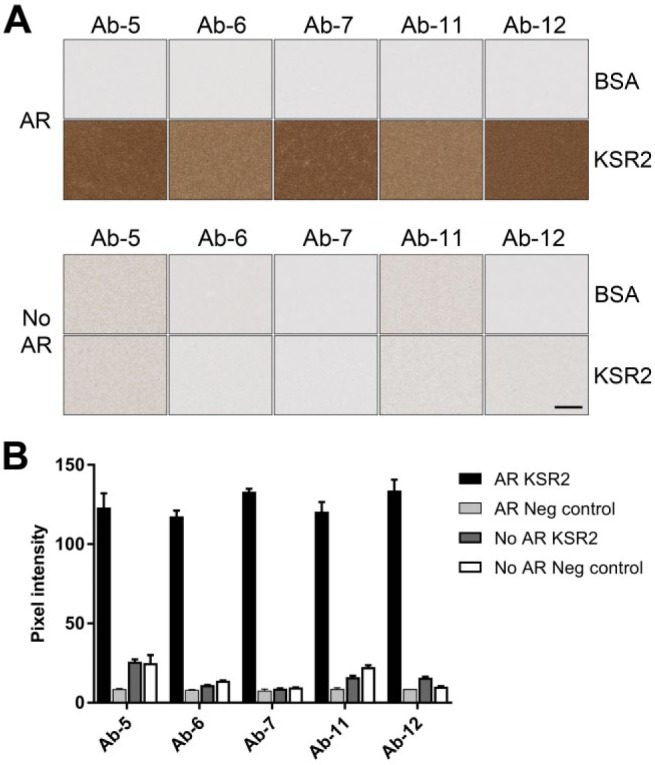
KSR with and without antigen retrieval. (A) Images show sections of BSA gel containing no protein (BSA) or 6.3 × 10⁻⁶ M KSR2 kinase domain (KSR2) stained with a selection of mouse anti-KSR2 mouse antibodies with (AR) or without (No AR) prior antigen retrieval. Scale bar = 50 µm. (B) Quantification of samples shown in (A). Abbreviations: KSR, Kinase Suppressor of Ras 2; BSA, bovine serum albumin.
Supplemental Figure 8.
Alternative fixation protocols. (A) BSA gels containing BCL2 peptide were prepared by heating to 85C in the absence of fixative, then fixed at room temperature in NBF (heat, NBF), 4% PFA (heat, 4% PFA), zinc-containing fixative (heat, Zn), or were heated to 85C in the presence of concentrated formaldehyde (37% formaldehyde and heat) or zinc-containing fixative (Zn and heat). (B) Quantification of images in (A). The scale bar is 50 µm. Abbreviations: BSA, bovine serum albumin; NBF, neutral-buffered formalin; PFA, paraformaldehyde.
Supplemental Table 1.
Clone 124 BCL2 IHC Assay Calculated Parameters for 10 Replicate Experiments.
| Log(ACHM) | ACHM | HillSlope | |
|---|---|---|---|
| Fig. 2A | −5.483 | 3.29E-6 | 1.17 |
| Fig. 3A(1) | −5.604 | 2.49E-6 | 1.20 |
| Fig. 3A(2) | −5.681 | 2.08E-6 | 1.27 |
| Fig. 3A(3) | −5.709 | 1.95E-6 | 1.20 |
| Fig. 3A(4) | −5.667 | 2.15E-6 | 1.23 |
| Fig. 3A(5) | −5.625 | 2.37E-6 | 1.26 |
| Fig. 3A(6) | −5.624 | 2.38E-6 | 1.25 |
| Fig. 4A | −5.569 | 2.70E-6 | 1.15 |
| Fig. 5B | −5.447 | 3.57E-6 | 1.30 |
| Supplemental Fig. 4 | −5.344 | 4.53E-6 | 1.40 |
| Mean | −5.575 | 2.75E-6 | 1.24 |
| SD | 0.116 | 8.11E-7 | 0.071 |
| Coefficient of variation | 2.1% | 29% | 5.8% |
The table summarizes the relevant parameters for the indicated experiments. TMAs shown in Figs. 2A, 4A(I), and 5B were made using BCL2 peptide lot 1. TMAs for the remaining experiments were made using BCL2 peptide lot 2. Abbreviations: IHC, immunohistochemistry; ACHM, antigen concentration at half-maximum signal; TMA, tissue microarray.
Footnotes
Competing Interests: The author(s) declared the following potential conflicts of interest with respect to the research, authorship, and/or publication of this article: The authors are employees of Genentech, Inc. and Roche stockholders.
Author Contributions: KJH performed the immunohistochemistry experiments, analyzed data, composed images, and wrote the manuscript, CAH created donor blocks and performed experiments on gel composition, HVN quantified scanned images, SR and SDL supported Fluidigm Hyperion experiments and analysis, LKR advised and supported many stages of the project, FVP analyzed data, composed figures, and wrote the manuscript.
Funding: The author(s) received no financial support for the research, authorship, and/or publication of this article.
Contributor Information
Kathy J. Hötzel, Department of Research Pathology, Genentech, Inc., South San Francisco, California
Charles A. Havnar, Department of Research Pathology, Genentech, Inc., South San Francisco, California
Hai V. Ngu, Department of Research Pathology, Genentech, Inc., South San Francisco, California
Sandra Rost, Department of Research Pathology, Genentech, Inc., South San Francisco, California.
Scot D. Liu, Department of Research Pathology, Genentech, Inc., South San Francisco, California
Linda K. Rangell, Department of Research Pathology, Genentech, Inc., South San Francisco, California
Franklin V. Peale, Department of Research Pathology, Genentech, Inc., South San Francisco, California.
Literature Cited
- 1. Gao Q, Liang WW, Foltz SM, Mutharasu G, Jayasinghe RG, Cao S, Liao WW, Reynolds SM, Wyczalkowski MA, Yao L, Yu L, Sun SQ; Fusion Analysis Working Group; Cancer Genome Atlas Research Network, Chen K, Lazar AJ, Fields RC, Wendl MC, Van Tine BA, Vij R, Chen F, Nykter M, Shmulevich I, Ding L. Driver fusions and their implications in the development and treatment of human cancers. Cell Rep. 2018;23(1):227–38. [DOI] [PMC free article] [PubMed] [Google Scholar]
- 2. Bailey MH, Tokheim C, Porta-Pardo E, Sengupta S, Bertrand D, Weerasinghe A, Colaprico A, Wendl MC, Kim J, Reardon B, Ng PK, Jeong KJ, Cao S, Wang Z, Gao J, Gao Q, Wang F, Liu EM, Mularoni L, Rubio-Perez C, Nagarajan N, Cortés-Ciriano I, Zhou DC, Liang WW, Hess JM, Yellapantula VD, Tamborero D, Gonzalez-Perez A, Suphavilai C, Ko JY, Khurana E, Park PJ, Van Allen EM, Liang H; MC3 Working Group; Cancer Genome Atlas Research Network, Lawrence MS, Godzik A, Lopez-Bigas N, Stuart J, Wheeler D, Getz G, Chen K, Lazar AJ, Mills GB, Karchin R, Ding L. Comprehensive characterization of cancer driver genes and mutations. Cell. 2018;173(2):371–85.e18. [DOI] [PMC free article] [PubMed] [Google Scholar]
- 3. Coons AH, Creech HJ, Jones RN, Berliner E. The demonstration of pneumococcal antigen in tissues by the use of fluorescent antibody. J Immunol. 1942;45(3):159–70. [Google Scholar]
- 4. True LD. Quality control in molecular immunohistochemistry. Histochem Cell Biol. 2008;130(3):473–80. [DOI] [PMC free article] [PubMed] [Google Scholar]
- 5. Hewitt SM, Baskin DG, Frevert CW, Stahl WL, Rosa-Molinar E. Controls for immunohistochemistry: the histochemical society’s standards of practice for validation of immunohistochemical assays. J Histochem Cytochem. 2014;62(10):693–7. [DOI] [PMC free article] [PubMed] [Google Scholar]
- 6. Howat WJ, Lewis A, Jones P, Kampf C, Pontén F, van der Loos CM, Gray N, Womack C, Warford A. Antibody validation of immunohistochemistry for biomarker discovery: recommendations of a consortium of academic and pharmaceutical based histopathology researchers. Methods. 2014;70(1):34–8. [DOI] [PMC free article] [PubMed] [Google Scholar]
- 7. Torlakovic EE, Nielsen S, Vyberg M, Taylor CR. Getting controls under control: the time is now for immunohistochemistry. J Clin Pathol. 2015;68(11):879–82. [DOI] [PMC free article] [PubMed] [Google Scholar]
- 8. Torlakovic EE, Nielsen S, Francis G, Garratt J, Gilks B, Goldsmith JD, Hornick JL, Hyjek E, Ibrahim M, Miller K, Petcu E, Swanson PE, Zhou X, Taylor CR, Vyberg M. Standardization of positive controls in diagnostic immunohistochemistry: recommendations from the International Ad Hoc Expert Committee. Appl Immunohistochem Mol Morphol. 2015;23(1):1–18. [DOI] [PubMed] [Google Scholar]
- 9. Vani K, Sompuram SR, Schaedle AK, Balasubramanian A, Bogen SA. Analytic response curves of clinical breast cancer IHC tests. J Histochem Cytochem. 2017;65(5):273–83. [DOI] [PMC free article] [PubMed] [Google Scholar]
- 10. Vani K, Sompuram SR, Schaedle AK, Balasubramanian A, Pilichowska M, Naber S, Goldsmith JD, Chang KG, Noubary F, Bogen SA. The importance of epitope density in selecting a sensitive positive IHC control. J Histochem Cytochem. 2017;65(8):463–77. [DOI] [PMC free article] [PubMed] [Google Scholar]
- 11. Sompuram SR, Vani K, Schaedle AK, Balasubramanian A, Bogen SA. Quantitative assessment of immunohistochemistry laboratory performance by measuring analytic response curves and limits of detection. Arch Pathol Lab Med. 2018;142(7):851–62. [DOI] [PubMed] [Google Scholar]
- 12. Brandtzaeg P. Evaluation of immunofluorescence with artificial sections of selected antigenicity. Immunology. 1972;22(1):177–83. [PMC free article] [PubMed] [Google Scholar]
- 13. Millar DA, Williams ED. A step-wedge standard for the quantification of immunoperoxidase techniques. Histochem J. 1982;14(4):609–20. [DOI] [PubMed] [Google Scholar]
- 14. Schipper J, Tilders FJ. A new technique for studying specificity of immunocytochemical procedures: specificity of serotonin immunostaining. J Histochem Cytochem. 1983;31(1):12–8. [DOI] [PubMed] [Google Scholar]
- 15. Valnes K, Brandtzaeg P, Rognum TO. Sensitivity and efficiency of four immunohistochemical methods as defined by staining of artificial sections. Histochemistry. 1984;81(4):313–9. [DOI] [PubMed] [Google Scholar]
- 16. Valnes K, Brandtzaeg P. Retardation of immunofluorescence fading during microscopy. J Histochem Cytochem. 1985;33(8):755–61. [DOI] [PubMed] [Google Scholar]
- 17. Shi SR, Liu C, Perez J, Taylor CR. Protein-embedding technique: a potential approach to standardization of immunohistochemistry for formalin-fixed, paraffin-embedded tissue sections. J Histochem Cytochem. 2005;53(9):1167–70. [DOI] [PubMed] [Google Scholar]
- 18. Shirasawa N, Yoshimura F, Miyashita E, Yashiro T, Sumi Y, Suzuki T. Quantification of immunohistochemical model sections. Cell Mol Bio 1983;29(4):327–9. [PubMed] [Google Scholar]
- 19. Fowler CB, Cunningham RE, O’Leary TJ, Mason JT. “Tissue surrogates” as a model for archival formalin-fixed paraffin-embedded tissues. Lab Invest. 2007;87(8):836–46. [DOI] [PubMed] [Google Scholar]
- 20. Mohd Omar MF, Huang N, Ou K, Yu K, Putti TC, Jikuya H, Ichikawa T, Nishimura O, Tan P, Salto-Tellez M. Molecular-assisted immunohistochemical optimization. Acta Histochem. 2010;112(6):519–28. [DOI] [PubMed] [Google Scholar]
- 21. Ben-David U, Siranosian B, Ha G, Tang H, Oren Y, Hinohara K, Strathdee CA, Dempster J, Lyons NJ, Burns R, Nag A, Kugener G, Cimini B, Tsvetkov P, Maruvka YE, O’Rourke R, Garrity A, Tubelli AA, Bandopadhayay P, Tsherniak A, Vazquez F, Wong B, Birger C, Ghandi M, Thorner AR, Bittker JA, Meyerson M, Getz G, Beroukhim R, Golub TR. Genetic and transcriptional evolution alters cancer cell line drug response. Nature. 2018;560(7718):325–30. [DOI] [PMC free article] [PubMed] [Google Scholar]
- 22. Sompuram SR, Kodela V, Ramanathan H, Wescott C, Radcliffe G, Bogen SA. Synthetic peptides identified from phage-displayed combinatorial libraries as immunodiagnostic assay surrogate quality-control targets. Clin Chem. 2002;48(3):410–20. [PubMed] [Google Scholar]
- 23. Sompuram SR, Kodela V, Zhang K, Ramanathan H, Radcliffe G, Falb P, Bogen SA. A novel quality control slide for quantitative immunohistochemistry testing. J Histochem Cytochem. 2002;50(11):1425–33. [DOI] [PubMed] [Google Scholar]
- 24. Bogen SA, Vani K, McGraw B, Federico V, Habib I, Zeheb R, Luther E, Tristram C, Sompuram SR. Experimental validation of peptide immunohistochemistry controls. Appl Immunohistochem Mol Morphol. 2009;17(3):239–46. [DOI] [PMC free article] [PubMed] [Google Scholar]
- 25. Atha DH, Manne U, Grizzle WE, Wagner PD, Srivastava S, Reipa V. Standards for immunohistochemical imaging: a protein reference device for biomarker quantitation. J Histochem Cytochem. 2010;58(11):1005–14. [DOI] [PMC free article] [PubMed] [Google Scholar]
- 26. Sompuram SR, Vani K, Tracey B, Kamstock DA, Bogen SA. Standardizing immunohistochemistry: a new reference control for detecting staining problems. J Histochem Cytochem. 2015;63(9):681–90. [DOI] [PMC free article] [PubMed] [Google Scholar]
- 27. Metz B, Kersten GF, Hoogerhout P, Brugghe HF, Timmermans HA, de Jong A, Meiring H, ten Hove J, Hennink WE, Crommelin DJ, Jiskoot W. Identification of formaldehyde-induced modifications in proteins: reactions with model peptides. J Biol Chem. 2004;279(8):6235–43. [DOI] [PubMed] [Google Scholar]
- 28. Toews J, Rogalski JC, Clark TJ, Kasta J. Mass spectrometric identification of formaldehyde-induced peptide modifications under in vivo protein cross-linking conditions. Anal Chim Acta. 2008;618(2):168–83. [DOI] [PubMed] [Google Scholar]
- 29. Adam P, Baumann R, Schmidt J, Bettio S, Weisel K, Bonzheim I, Fend F, Quintanilla-Martínez L. The BCL2 E17 and SP66 antibodies discriminate 2 immunophenotypically and genetically distinct subgroups of conventionally BCL2-“negative” grade 1/2 follicular lymphomas. Hum Pathol. 2013;44(9):1817–26. [DOI] [PubMed] [Google Scholar]
- 30. Armbruster DA, Pry T. Limit of blank, limit of detection and limit of quantitation. Clin Biochem Rev. 2008;29(Suppl 1):S49–52. [PMC free article] [PubMed] [Google Scholar]
- 31. Sompuram SR, Vani K, Hafer LJ, Bogen SA. Antibodies immunoreactive with formalin-fixed tissue antigens recognize linear protein epitopes. Am J Clin Pathol. 2006;125(1):82–90. [PubMed] [Google Scholar]
- 32. Kringelum JV, Nielsen M, Padkjær SB, Lund O. Structural analysis of B-cell epitopes in antibody: protein complexes. Mol Immunol. 2013;53(1–2):24–34. [DOI] [PMC free article] [PubMed] [Google Scholar]
- 33. Scalia CR, Gendusa R, Basciu M, Riva L, Tusa L, Musarò A, Veronese S, Formenti A, D’Angelo D, Ronzio AG, Cattoretti G, Bolognesi MM. Epitope recognition in the human-pig comparison model on fixed and embedded material. J Histochem Cytochem. 2015;63(10):805–22. [DOI] [PMC free article] [PubMed] [Google Scholar]
- 34. Buus S, Rockberg J, Forsström B, Nilsson P, Uhlen M, Schafer-Nielsen C. High-resolution mapping of linear antibody epitopes using ultrahigh-density peptide microarrays. Mol Cell Proteomics. 2012;11(12):1790–800. [DOI] [PMC free article] [PubMed] [Google Scholar]
- 35. Forsström B, Axnäs BB, Stengele KP, Bühler J, Albert TJ, Richmond TA, Hu FJ, Nilsson P, Hudson EP, Rockberg J, Uhlen M. Proteome-wide epitope mapping of antibodies using ultra-dense peptide arrays. Mol Cell Proteomics. 2014;13(6):1585–97. [DOI] [PMC free article] [PubMed] [Google Scholar]
- 36. Forsström B, Axnäs BB, Rockberg J, Danielsson H, Bohlin A, Uhlen M. Dissecting antibodies with regards to linear and conformational epitopes. PLoS One. 2015;10(3):e0121673. [DOI] [PMC free article] [PubMed] [Google Scholar]
- 37. Haus JM, Carrithers JA, Carroll CC, Tesch PA, Trappe TA. Contractile and connective tissue protein content of human skeletal muscle: effects of 35 and 90 days of simulated microgravity and exercise countermeasures. Am J Physiol Regul Integr Comp Physiol. 2007;293:R1722–7. [DOI] [PubMed] [Google Scholar]
- 38. Hembrough T, Thyparambil S, Liao WL, Darfler MM, Abdo J, Bengali KM, Hewitt SM, Bender RA, Krizman DB, Burrows J. Application of selected reaction monitoring for multiplex quantification of clinically validated biomarkers in formalin-fixed, paraffin-embedded tumor tissue. J Mol Diagn. 2013;15(4):454–65. [DOI] [PubMed] [Google Scholar]
- 39. Cole J. Assessing the calorific significance of episodes for human cannibalism in the Palaeolithic. Sci Rep. 2017;7:44707. doi: 10.1038/srep44707. [DOI] [PMC free article] [PubMed] [Google Scholar]
- 40. Metz B, Kersten GF, Baart GJ, de Jong A, Meiring H, ten Hove J, van Steenbergen MJ, Hennink WE, Crommelin DJ, Jiskoot W. Identification of formaldehyde-induced modifications in proteins: reactions with insulin. Bioconjug Chem. 2006;17(3):815–22. [DOI] [PubMed] [Google Scholar]
- 41. Kinoshita K, Shimogiri T, Ibrahim HR, Tsudzuki M, Maeda Y, Matsuda Y. Identification of TENP as the gene encoding chicken egg white ovoglobulin G2 and demonstration of its high genetic variability in chickens. PLoS One. 2016;11(7):e0159571. [DOI] [PMC free article] [PubMed] [Google Scholar]
- 42. Eastoe JE. The amino acid composition of mammalian collagen and gelatin. Biochem J. 1955;61:589–600. [DOI] [PMC free article] [PubMed] [Google Scholar]
- 43. Toews J, Rogalski JC, Kast J. Accessibility governs the relative reactivity of basic residues in formaldehyde-induced protein modifications. Anal Chim Acta. 2010;676(1–2):60–7. [DOI] [PubMed] [Google Scholar]
- 44. Kubbutat MH, Key G, Duchrow M, Schlüter C, Flad HD, Gerdes J. Epitope analysis of antibodies recognising the cell proliferation associated nuclear antigen previously defined by the antibody Ki-67 (Ki-67 protein). J Clin Pathol. 1994;47(6):524–8. [DOI] [PMC free article] [PubMed] [Google Scholar]


