

Abstract.
Implication of apoptosis in numerous physiological and pathological processes has resulted in the development of numerous methods to detect apoptosis, but none of them is adapted to all cell types. In this study, we induced apoptosis on murine immortalized astrocytes with urine from multiple sclerosis (MS) patients. Among techniques allowing the detection of apoptotic cells, only a few are adapted to adherent cells such as astrocytes. We compared several techniques (propidium iodide labelling and flow cytometry analysis, TUNEL and annexin V labelling in immunofluorescence, DNA ladder, ELISA tests to detect nucleosomes) in order to choose the method best adapted to our adherent cellular model and to discuss their practicability for the detection of apoptosis on adherent cells.
For technical course, propidium iodide labelling followed by flow cytometry analysis as a quantitative technique, and TUNEL in IF (easier and quicker than propidium iodide) as a semiquantitative test were both retained as best adapted to our case.
Moreover, in our model, we have observed that phosphatydilserine externalization and DNA fragmentation were concomittant after induction of apoptosis.
Techniques studied in this article would allow an enlarged study of the apoptotic mechanism in several pathologies by culture of adherent cells sensitive to apoptosis in vitro.
Introduction
Apoptosis or programmed cell death is one of the most fundamental biological processes in eukaryotes in which an individual cell dies by activating an intrinsic suicide mechanism. Apoptotic cell death is distinguished from necrosis by a number of morphological and biochemical criteria, such as nuclear compaction and chromatin condensation, modification of plasma membrane, DNA fragmentation, cell break into apoptotic bodies (Gerschenson & Rotallo 1992; Martin et al. 1996). During apoptosis, cells have the ability to self‐destruct when they are no longer needed or have become seriously damaged (Raff et al. 1993; Steller 1995). On the contrary, necrosis is a pathological form of cell death resulting from acute cellular injury, which is typified by rapid cell swelling and lysis (Thompson 1995).
Commonly, apoptosis takes place during the normal developmental program of an organism, for example during embryonic development and homeostatic regulation of normal tissue mass (Kerr & Harmon 1991). But it also occurs as a response to an insult (pathogenic, chemical or physical insult) (Wyllie, Kerr & Currie 1980; Keane et al. 1997). It is implicated in diseases (Ohsako & Elkon 1999) such as cancer (Sprecher et al. 1999), HIV infection (Cossarizza et al. 1999), infection by other viruses or pathogens (Wattre, Bert & Hober 1996; Kornfeld, Mancini & Colizzi 1999), auto‐immune diseases (Rosen & Casciola‐Rosen 1999) such as multiple sclerosis (Dowling et al. 1996; Lucchinetti et al. 1996; Dowling et al. 1997; Zang et al. 1999).
In multiple sclerosis, F. Rieger’s team (Rieger et al. 1996) found a cytotoxic factor in the cerebrospinal fluid (CSF) of multiple sclerosis patients in 1996. This factor induced programmed cell death of murine astrocytes in vitro. This toxicity was related to a 17‐kDa molecular weight protein. Given this small size, we supposed that glomerular passage of this protein was possible. Then, we identified gliotoxic activity associated with a protein with identical physico‐chemical characteristics in urine from MS patients. This urinary molecule called gliotoxin induced apoptosis on murine astrocytes in vitro. A high specificity of this urinary marker in MS was found (Malcus‐Vocanson et al. 1998). To detect this apoptotic activity, a flow cytometry method based on PI incorporation was used. It can be considered as our reference test.
However, according to Nakano (1997), the practice of employing only one or a few criteria to detect apoptosis is not recommendable. In the present study, we tested several techniques to detect astrocyte apoptosis after induction with MS patient urine. It was necessary to assess the performance of various techniques taking the astrocyte adherence characteristic into account.
Classification of cell death can be based on morphological or biochemical criteria (Wyllie et al. 1980). An apoptotic cell undergoes multiple and successive morphological changes, such as membrane blebbing, cell shrinkage, chromosomal condensation and DNA fragmentation. Annexin V allows labelling of apoptotic cells through the phospholipid asymmetry of their membrane (Adayev et al. 1998). Since activated endonucleases attack the cell’s genomic DNA at the linker regions that connect the nucleosomal units (Nakano 1997), the TUNEL technique labels the 3′OH DNA ends created during apoptosis by these specific endonucleases. An enzyme, terminal desoxynucleotidyl transferase, incorporates biotinylated dNTP to the 3′OH ends of the DNA (Negoescu et al. 1996). Moreover, degradation of DNA can produce DNA fragments in size multiples of 185–200 bp observed as a distinct ‘DNA ladder patern’ after electrophoresis of DNA extract from apoptotic cells (Wyllie 1980). DNA fragmentation is followed by release of nucleosomes onto the cytoplasm. These small DNA fragments can be extracted using an hypotonic buffer. Since apoptotic cells have a lower DNA content than normal cells, PI labelling leads to a characteristic sub‐G1 peak by flow cytometry (Lizard et al. 1996). These nucleosomes are captured and detected on an ELISA plate with specific antibodies against DNA and histones (Salgame et al. 1997).
The aim of this work was to compare these techniques to choose the best adapted to an adherent astrocytic cell line in vitro, after induction of apoptosis with MS urine. More generally, we have studied the practicability of investigated techniques to detect adherent cells apoptosis in vitro.
MATERIALS AND METHODS
Urine samples
Gliotoxic factor found in urine (Malcus‐Vocanson et al. 1998) was used as the apoptosis‐inducing factor. Urine was collected at two sites with the agreement of the donors, the Neurological Hospital of Lyon (France) and the Germaine Revel Medical Center (Saint‐Maurice sur Dargoire, France), a centre specialized in the rehabilitation of MS patients. For MS patients, urine was collected for a bacterial urinary test, and a small quantity was preserved for the test. No additional request of urine was made to the patients. Healthy donors from the lab staff gave urine spontaneously. All urine tested was selected taking into account clinical and therapeutical criteria: urine from patients with an uncertain diagnosis and/or potential interfering treatment were excluded. All selected urine induced reliable results (good reproducibility) with our reference test.
Total urine was heated 30 min at 56 °C and passed through 0.22 µm filter in order to eliminate potential bacterial and/or viral contamination. Each specimen was then added directly to cell‐culture wells.
Cell culture
The astrocytic cell line was obtained from Dr Rouget (Paris, France) (Galiana et al. 1990). CLTT 1–1, an SV40‐transformed murine astrocytic cell line was maintained in 50% Dulbecco’s Modified Eagle Medium containing glucose (4500 mg/ml), stabilized glutamine and sodium pyruvate (DMEM, Gibco Life Technologies SARL, Cergy, France), 50% HAM‐F12 containing stabilized glutamine (Gibco), supplemented with 10% FCS (Gibco) and 1% antibiotic‐antimycotic (10 000 units/ml penicillin G, 10 000 µg/ml streptomycin, 25 µg/ml amphotericin B, Gibco).
Jurkat T cells were used as a positive control for the ‘DNA ladder’ technique. Corresponding to acute human T cell leukaemia clone E6–1, they were obtained from the ATCC (American Type Culture Collection, LGC France SARL, Illkirch, France). They were cultured in suspension in 90% RPMI 1640 supplemented with 2 mm l‐glutamine, 10% heat treated FCS (all reagents from Gibco), and 0.25% penicillin‐streptomycin (50 000 U/ml, 25 mg/ml, bioMérieux SA, Marcy L’Etoile, France).
Both cell lines were cultured at 37 °C in the presence of 5% CO2/95% air, in a fully humidified atmosphere.
PI labelling and analysis by flow cytometry
This technique makes up the reference test of our laboratory for the astrocytic cell line CLTT 1–1 as it allowed the realization of the epidemiological study (Malcus‐Vocanson et al. 1998). The test was performed in six‐well tissue‐culture plates, using 20 000 cells/well in DMEM‐F12 + FCS (2 ml). After 24 h of culture, astrocytes being adherent to the support, we added urine in triplicate (50 µl/well) and cells with or without urine were incubated at 37 °C for 72 h. Then, the cell layer was subjected to a gentle dissociation method, followed by mechanical dissociation, using PBS‐EDTA (PBS 1X Gibco, EDTA 0.4 g/l; Sigma‐Aldrich Chimie SARL, St Quentin, France) supplemented with 20% trypsine‐EDTA (trypsine 10X Gibco 1/250, EDTA 1% Sigma) for 5 min at 37 °C. Three wells were put together. All centrifugation steps were performed at 18 °C and 1500 r.p.m. Cells were washed twice with PBS and fixed for one hour in 70% ethanol at −20 °C. After two washes, we extracted potential fragmented DNA using the extraction buffer (90% Na2HPO4 0.05 m, 10% citric acid 25 mm, 0.1% tween 20, all reagents from Sigma) for one hour at +4 °C. After two additional washes with PBS (cells can stay up to a night in PBS), propidium iodide (PI) 50 µg/ml and RNase 50 IU/ml (both from Sigma) were added on the cell pellet. After 15 min incubation, fluorescence was quantified using a flow cytometer (XL Coulter, Gagny, France), with a 488‐nm wavelengh of an ion laser as the excitation source. The red luminescence emission due to PI was separated using a long‐pass 630 nm filter. Normal cells displayed a cell cycle. In contrast, PI stained apoptotic cell nuclei at lower intensity than normal ones, they could be detected in a broad peak with lower fluorescence intensity than the diploid cells, the sub‐G1 peak. Necrotic fragments were excluded by appropriate gate and markers positioning.
TUNEL technique
Detection of apoptosis was performed on adherent astrocytes using terminal deoxynucleotidyl transferase (TdT‐mediated) dUTP nick end‐labelling (TUNEL) with an in situ cell death detection kit ‘fluorescent streptavidin’ (Dako, Trappes, France), following the manufacturer’s recommendations. After 24 h, cells (3000 cells/well) in eight‐chamber slides (Lab‐Tek, Nunc, Strasbourg, France) were exposed to urine in duplicate (12 µl/well) for 24, 48 and 72 h at 37 °C. Astrocytes were fixed for 10 min in acetone at room temperature. They were exposed to biotinylated‐16‐dUTP and terminal deoxynucleotide transferase for 45 min at 37 °C in a humidified chamber. After the washing steps, detection was performed using a FITC conjugated streptavidin molecule. Cells were counterstained with Evans Blue, and then visualized using an Olympus microscope at × 400 magnification using a 490‐nm emission filter to visualize the green FITC fluorescence and the red Evans Blue staining.
Annexin V‐FITC labelling
The test was performed in removable eight‐chamber slides (Lab‐Tek, Nunc), with 3000 cells/well. After 24 h of culture, we added urine in duplicate (12 µl/well), and cells were incubated at 37 °C for 24, 48 and 72 h. Cells were fixed in methanol‐acetone (V/V) for 10 min at −20 °C. Cells were incubated with 10 µl/ml annexin V‐FITC (Bender Medsystems, Souffelweyersheim, France) in HEPES buffer (10 mm HEPES/NaOH, 150 mm NaCl, 5 mm KCl, 1 mm MgCl2, 1,8 mm CaCl2, all reagents from Sigma) for 15 min at 37 °C, then incubated with PI at 20 µg/ml in HEPES buffer for 10 min at room temperature. Cells were then visualized using an Olympus microscope at × 400 magnification using a 490‐nm emission filter to visualize the green FITC fluorescence and a 580‐nm filter to detect the red PI staining.
Genomic DNA electrophoresis
We used the ‘Apoptotic DNA ladder kit’, from Boehringer Mannheim (Meylan, France). Astrocytes were cultured in 25 cm2 culture flasks (50 000 cells/flask). Urine was added after 24 h of culture, and cells were incubated for 24, 48, 72 and 96 h at 37 °C. Then, the cell layer was subjected to a gentle dissociation method, followed by mechanical dissociation using PBS‐EDTA supplemented with 20% trypsine‐EDTA (same concentrations as PI technique) for 5 min at 37 °C. Cells were lysed and the purification procedure was performed in compliance with the manufacturer’s recommandations.
Jurkat T cells were used to make a positive control of the technique. They were cultured in 24‐well flat‐bottom plates to a concentration of 106 cells/ml in RPMI +10% FCS (Gibco). Cycloheximide (Sigma) was used as a positive inducer of apoptosis on Jurkat T cells. It was added at 20 µg/ml and cells were incubated for 6 h at 37 °C. Cells were collected and lysed as for the astrocytes.
For agarose gel electrophoresis, 8 µl of extracted DNA were mixed with 2 µl loading buffer (0.25% bromophenol blue from Serva, 0.25% cyanol xylene from Serva, 30% glycerol from Prolabo, H2O). Samples were resolved on a 1% TBE agarose gel (Eurobio) during 90 min at 75 V and visualized by UV light after Gelstar staining (BioProducts). To determine molecular weight, ‘Smart Ladder’ (200–10 000 bp, Eurogentec) was used.
Cell death detection ELISA
These techniques are photometric enzyme immunoassays for the quantitative in vitro determination of cytoplasmic histone‐associated DNA fragments (mono‐and oligonucleosomes) after induced cell death. Two kits were used, both from Boehringer Mannheim, ‘Cell death detection ELISA’ and ‘Cell death detection ELISAPLUS’.
After 24 h, astrocytes cultured in 48‐well tissue‐culture plates were exposed for 72 h at 37 °C to urine in triplicate (10 µl/well). Tests were performed in compliance with the manufaturer’s recommendations with the exception of the lysis buffer that was tested alone or supplemented with 0.1% triton X‐100 to increase lysis of cells inside the wells. The lysis buffer was deposited directly on the cell layer, and incubated for 30 min at +4 °C. Well content was centrifuged at 5500 g at room temperature (20 000 g at +4 °C for ‘Cell death detection ELISA’). The resulting supernatant was used as sample for the kit. Firstly, antihistone antibody was fixed adsorptively onto the microtiter plate. Secondly, nucleosomes contained in the sample bound via their histone components to immobilized antihistone antibody. In the third incubation step, anti‐DNA peroxidase (POD) reacted with the DNA‐part of the nucleosome; all steps were followed by washes. The ‘Cell death detection ELISAPLUS’ kit contained an additional step to increase the sensitivity of the detection (streptavidin). The amount of peroxidase retained in the immunocomplex is determined photometrically with ABTS (2,2′‐azino‐di‐(3‐ethylbenzthiazoline sulphonate (6))), as a substrate. Absorbance was measured using a spectrophotometer at 405 nm, against substrate solution as the blank.
RESULTS
We compared all techniques described below in order to choose the method best adapted to detect apoptosis induced by urine from MS patients. Results were compared with those obtained with urine from healthy donors and in cellular controls without urine.
PI labelling and flow cytometry analysis
This technique was considered as the reference method in our laboratory for murine astrocytes. Cellular control allowed us to exclude the percentage of natural apoptosis. Gates and markers were previously positioned to remove necrotic fragments from the apoptotic population. We were able to distinguish three populations: normal cells, apoptotic cells and necrotic debris (Fig. 1). Due to action of the gliotoxic factor, the apoptotic population (i.e. excluding natural apoptosis) was converted into a percentage. Only samples with percentage 10% higher than the percentage of natural apoptosis (in cellular control) were considered as positive (Table 1). We only gave results after 72 h because we need enough cells to perform an FC analysis.
Figure 1.
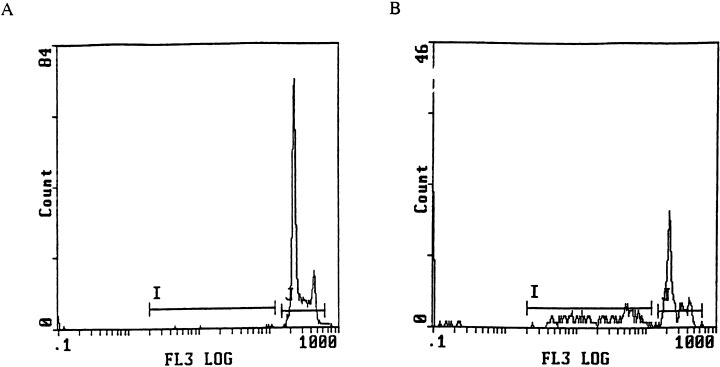
Histograms obtained after PI labelling and flow cytometry analysis of astrocytes, after fragmented DNA extraction. I demarcates sub‐G1 peak, so apoptotic cells, J demarcates cell cycle. (a) Cells after 72 h of incubation with urine from an healthy donor. 2% of natural apoptosis. (b) Cells after 72 h of incubation with urine from a MS patient. 43.8% of apoptosis, i.e. positive result. Necrosis has been eliminated by appropriate adjustments.
Table 1.
Quantification of apoptotic cells by PI labelling and flow cytometry analysis after addition of urine from MS patients (S) or healthy donors (D)
| Sample | Clinic | % apoptosis (excluding natural apoptosis) (72 h) | Interpretation (72 h) |
|---|---|---|---|
| S1 | MS | 15.1 | Positive |
| S2 | MS | 9.6 | Negative |
| S3 | MS | 41.8 | Positive |
| S4 | MS | 11.3 | Positive |
| S5 | MS | 20.1 | Positive |
| S6 | MS | 4.6 | Negative |
| S7 | MS | 24.7 | Positive |
| S8 | MS | 20.1 | Positive |
| S9 | MS | 5.4 | Negative |
| S10 | MS | 13.0 | Positive |
| D1 | healthy donor | 2.0 | Negative |
| D2 | healthy donor | 1.5 | Negative |
| D3 | healthy donor | 5.0 | Negative |
| D4 | healthy donor | 3.7 | Negative |
| D5 | healthy donor | 4.0 | Negative |
| D6 | healthy donor | 5.5 | Negative |
| D7 | healthy donor | 5.2 | Negative |
| D8 | healthy donor | 2.8 | Negative |
| D9 | healthy donor | 5.1 | Negative |
| D10 | healthy donor | 4.9 | Negative |
We considered result as positive when percentage of apoptotic cells was 10% higher than percentage of natural apoptosis in the cellular control.
Numerous samples had previously been tested with this technique, and we had demonstrated the high specificity of this technique (Malcus‐Vocanson et al. 1998, and manuscript submitted). Only a few samples were selected as examples in the present study.
For the two immunofluorescent labelling techniques which follow, we qualified results as positive when the number of cells labelled after addition of urine was 10% higher (in absolute terms) than with cellular control (e.g. control = 5%, positive test ≥ 15%).
TUNEL technique
We performed this technique directly on slides where cells had grown (lab‐tek) 24, 48 and 72 h after addition of urine. Apoptotic cells had a green nucleus (FITC) and live cells were red (Evans blue) (Fig. 2). Fluorescent labelling was easier to read than colourimetric labelling (data not shown) due to the colour contrast.
Figure 2.
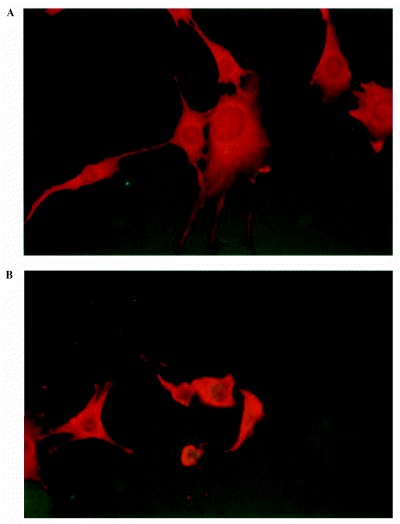
Astrocytes labelled by the TUNEL technique. Nuclei of apoptotic cells were green. Live cells were totally red. (a) Control cells after 72 h of culture. (b) Cells after 72 h of incubation with an MS urine. (× 400)
Apoptosis detection by TUNEL, performed after addition of the same urine from MS patients or healthy donors as for the PI labelling technique, correlated with our reference test 72 h after addition of urine. Wells without urine and with urine from healthy donors show less numerous apoptotic cells than wells with urine from MS patients (Table 2). This technique was easy to perform on lab‐tek and was not time consuming. It gave us semiquantitative information about potential apoptosis induced by urine. Some urine may induce more numerous apoptotic cells than others.
Table 2.
Apoptosis detection using TUNEL technique on astrocytes after addition of urine from MS patients (S) or healthy donors (D)
| Sample | Clinic | % apoptosis (excluding natural apoptosis) (72 h) | Interpretation (72 h) |
|---|---|---|---|
| S1 | MS | 44 | Positive |
| S2 | MS | 9 | Negative |
| S3 | MS | 34 | Positive |
| S4 | MS | 53 | Positive |
| S5 | MS | 25 | Positive |
| S6 | MS | 5 | Negative |
| S7 | MS | 71 | Positive |
| S8 | MS | 51 | Positive |
| S9 | MS | 11 | Negative |
| S10 | MS | 43 | Positive |
| D1 | healthy donor | 5 | Negative |
| D2 | healthy donor | 24 | Positive |
| D3 | healthy donor | 2 | Negative |
| D4 | healthy donor | 1 | Negative |
| D5 | healthy donor | 8 | Negative |
| D6 | healthy donor | 5 | Negative |
| D7 | healthy donor | 10 | Negative |
| D8 | healthy donor | 5 | Negative |
| D9 | healthy donor | 4 | Negative |
| D10 | healthy donor | 2 | Negative |
Annexin V‐FITC labelling
Urine was added 24 h after the beginning of culture, and cells were labelled 24, 48 and 72 h after induction (Fig. 3). Weak labelling appeared 48 h after addition of MS urine, and increased after 72 h. On the other hand, no labelling was observed using urine from healthy donors (Table 3). Nuclei were always stained by PI due to fixation which permeabilizes the membrane. Results of annexin V labelling were identical when performed before or after the fixation step (data not shown). Membranes labelled by annexin V‐FITC were not perturbed by the fixation.
Figure 3.
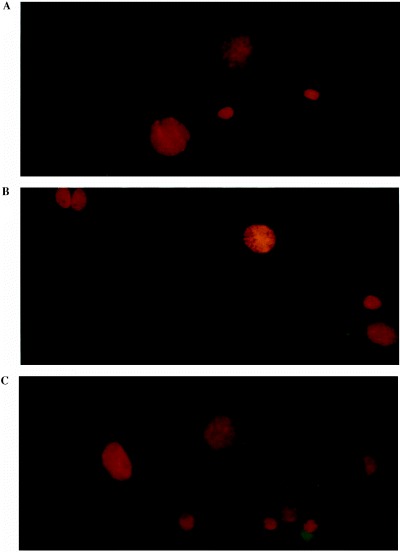
Astrocytes stained with Annexin V‐FITC and PI. Membranes of apoptotic cells were green. Nuclei of all cells were red, due to PI after a methanol‐acetone fixation. (a) Control cells after 48 h of culture. (b) Cells after 48 h of incubation with an MS urine. (c) Cells after 72 h of incubation with an MS urine. (× 400)
Table 3.
Annexin V labelling of astrocytes after addition of urine from MS patients (S) or healthy donors (D)
| Sample | Clinic | % apoptosis (excluding natural apoptosis) (72 h) | Interpretation (72 h) |
|---|---|---|---|
| S1 | MS | 42 | Yes (weak) |
| S2 | MS | 0 | No |
| S3 | MS | 33 | Yes (weak) |
| S4 | MS | 51 | Yes (weak) |
| S5 | MS | 45 | Yes (weak) |
| D1 | healthy donor | 0 | No |
| D2 | healthy donor | 0 | No |
| D3 | healthy donor | 0 | No |
| D4 | healthy donor | 0 | No |
| D5 | healthy donor | 0 | No |
DNA ladder
DNA extraction was performed 24, 48, 72 and 96 h after addition of urine. We did not obtain a DNA ladder typical of apoptosis at any time. During the first 72 h, DNA extraction followed by electrophoretic migration led to the same result whatever the samples were: cellular control, astrocytes incubated with MS urine and astrocytes incubated with control urine. We obtained three bands of approximately 600, 2000 and 10 000 bp. Later extractions of DNA, at between 72 and 96 h, led to a smear. A positive control provided in the kit was subjected to the same extraction protocol as the samples. After migration, we obtained a DNA ladder (Fig. 4a).
Figure 4.
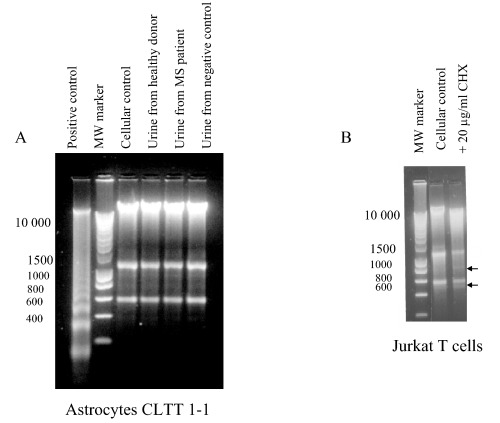
Conventional agarose gel electrophoresis of DNA from murine astrocytes CLTT 1–1 (a) and Jurkat T cells (b). (a) Astrocytes were analysed after 72 h of incubation with or without urine. (b) Jurkat T cells were analysed after 6 h of incubation with or without 20 µg/ml of cycloheximide (CHX). To determine molecular weight, ‘Smart Ladder’ (200–10 000 bp, Eurogentec) was used. Two arrows indicate supplementary bands in comparison with cellular control.
Moreover, we tested the Jurkat T cell line in order to check the test effectiveness and to control all technical steps, including lysis step. We used 20 µg/ml of cycloheximide (6 h, 106 cells/ml) as the apoptosis inducer. As described by Weis et al. (1995) we obtained a DNA ladder allowing the validation of our extraction protocol (Fig. 4b).
Therefore, after induction of apoptosis by MS urine, immortalized murine astrocytes did not show a ladder of DNA fragments typical of apoptosis.
ELISA tests
Detection of nucleosomes produced during DNA fragmentation was performed 48 and 72 h after addition of urine. No signal was detected, neither after 48 h of induction with urine, nor after 72 h. The addition of 0.1% of triton X‐100 detergent in lysis buffer did not improve results.
DISCUSSION
The main aim of this study was to compare several techniques to detect astrocytes apoptosis in vitro, with apoptosis being induced by urine from MS patients. Apoptosis detection has often been performed on cells in suspension in vitro (Dexter et al. 1994; Emoto et al. 1997; Pepper et al. 1998), or in situ on biopsy samples (Pender et al. 1991; Dowling et al. 1997; Frankfurt et al. 1997; Sprecher et al. 1999). This work, on the contrary, was realized on adherent cells in vitro.
These technical works would also allow an enlarged study of the apoptotic mechanism in several pathologies where adherent cells sensitive to apoptosis must be cultured to understand how apoptosis occurs.
The PI labelling of DNA followed by flow cytometry analysis constituted our reference test. Many samples of urine were tested with this technique. High sensitivity and specificity between detection of apoptosis and MS have been previously described (Malcus‐Vocanson et al. 1998). Numerous authors have already described the identification of a ‘sub‐G1’ peak to quantify apoptotic nonadherent cells (Nicoletti et al. 1991; Schmid, Uittenbogaart & Giorgi 1994; Lizard et al. 1997). We focused on the improvement of cell detachment from the support, which must be gentle in order to preserve frail apoptotic cells, but efficient enough to detach the complete cellular population. Appropriate adjustment to the cytometer gave a good differentiation between the different populations of cells: live, apoptotic and necrotic. Using a logarithmic scale instead of linear scale, it was easier to differentiate the main part of the necrotic population, as widely spread, and far from the apoptotic subpopulation and the cell cycle.
The TUNEL technique (IF reading) was classically used to detect apoptotic cells in culture or in tissue (Negoescu et al. 1996; Gavrieli et al. 1992; Thomas et al. 1995; Levy et al. 1998). This technique gave us quite a good correlation between the PI labelling (reference test) results and the presence of apoptotic cells labelled at 72 h. Simultaneously, this technique was tested with other astrocytic cell lines (human cell lines, immortalized or not), and a similar specificity was observed (data not shown). Using removable chamber slides (lab‐tek) to perform this technique on adherent cells, astrocytes kept their features, their astrocytic feet, were flat and attached to the support. A few labelled apoptotic cells were round but still attached to the support. Detection on lab‐tek provided a good practicability and easy observation of the cultured cells in immunofluorescence. The best results were probably obtained in IF with adherent cells in comparison with cells in suspension which require cells to be put down under slides before labelling. On our cellular model, in IF, we observed the morphology of live and apoptotic astrocytes and the DNA fragmentation associated with apoptosis by TUNEL labelling. But as described by other authors (Negoescu et al. 1996; Gavrieli, Sherman & Ben‐Sasson 1992; Thomas et al. 1995), other typical changes of apoptosis (chromatin condensation at the nuclear periphery, nucleolar disintegration, up to budding of the nucleus and cytoplasm into apoptotic bodies) were difficult to see with light microscopy. Electron‐microscopy would allow to see these changes, but this technique is too restricting to be tested in our context.
According to Grasl‐Kraupp and Thomas (Grasl‐Kraupp et al. 1995; Thomas et al. 1995), TUNEL is not specific of apoptosis. Necrosis and autolysis might generate a sufficiently high number of stainable DNA ends. However, in our opinion, this cautionary note was more important in tissue than in in vitro culture. In most cases, the morphology of our astrocytes in culture allowed us to eliminate other types of cell death, where membrane were dismantled, and intracytoplasmic components were dispersed.
An adaptation of this technique by flow cytometry could gave us more accurate quantitative results about induction of apoptosis by urine. Some tests have been made, but the TUNEL technique by flow cytometry was neither easier (same detachment step) than the PI labelling test (reference test), nor less time consuming. The TUNEL test needed more washes than PI, thereby inducing the loss of a larger number of cells. We concluded that the TUNEL technique by flow cytometry was less usable than the PI technique with our cellular model. On the other hand, reading of slides after IF labelling followed by image analysis might also give us quantitative results.
Gatti et al. (1998), who worked on several adherent cells, hightlighted a relation between maintenance of cell adhesion and annexin V‐test positivity: this labelling is only possible when cells are in the early stages of apoptosis. They also concluded that only cells with important morphological changes in the adhesion surface were annexin V‐tagged, so cells progressing through apoptosis but maintaining a ‘flat’ aspect were annexin V‐negative. In our model, astrocytes did not lose their adhesion feature, nor their astrocytic feet which contribute to keep cells attached to the support. The TUNEL labelling of apoptotic cells gave us images of widely spread astrocytes, with many feet, but we can observe DNA fragmentation. TUNEL labelling on culture supernatant showed that only a few cells (less than 1%) had detached from the support (data not shown). It therefore seemed that apoptotic astrocytes were subjected to few changes in their adhesion features, e.g. ‘flat aspect’, adhesion maintained, as Gatti described. This might explain, according to Gatti et al. the weak annexin V labelling we observed in astrocytes after induction of apoptosis by urine. In this context, labelling obtained with the TUNEL technique was easier to read than with annexin V technique.
Annexin V has often been used to detect apoptosis, either by cytometry or microscopy. We tried to use flow cytometry in order to obtain quantitative results, but even with gentle detachment of cells, membranes were too damaged to allow good labelling. No signal was detected by flow cytometry. Only one team described flow cytometry analysis after annexin V labelling on adherent cells (van England et al. 1996), which illustrated the difficulty of using flow cytometric techniques with adherent cells. Moreover, our astrocytes were naturally strongly adherent to the support and needed hard detachment.
Detection of the exposure of phosphatidylserine to the cell surface was used in early detection of apoptosis in many cellular models (Koopman et al. 1994; Rimon et al. 1997; Gatti et al. 1998; Levy et al. 1998). Authors agreed that externalization of phosphatidylserine occurred during the early stages of apoptosis. Depending on the cellular models, some autors described this phenomenon earlier than nuclear changes (Chan et al. 1998; Stuart et al. 1998), whereas others situated it after nuclear changes, at the same time as chromatin condensation and DNA fragmentation (Koopman et al. 1994). The comparison between TUNEL results and annexin V results (two qualitative methods) seemed to prove that in our cellular model, phosphatidylserine externalization and DNA fragmentation were concomittant, occurring 72 h after induction of apoptosis.
A ladder of nuclear DNA fragments is a typical feature of apoptosis, visible with many but not all cells (Walker et al. 1993). The kit used allowed rapid DNA extraction (1 hour), and visualization of the ladder on a conventional electrophoretic migration agarose gel. Despite intensive investigation, no evidence of the classical endonucleolytic cleavage pattern of DNA was found in murine immortalized astrocytes. Three bands were observed with all samples, including the cellular control, which meant there was not a regular DNA fragmentation. Later extractions (between 72 and 96 h) led to a smear typical of necrosis. Parallel to these tests, the results obtained with the Jurkat T cells proved the efficacity of the kit: nevertheless, regarding all the results we obtained with this kit (‘Apoptotic DNA ladder kit’) and in such model, the kit seems not to be highly efficient to highlight the DNA ladder described as typical of apoptosis. Considered to be an early critical event in cell death for many years (Wyllie 1980), it is now accepted that it is a later, dispensable event (1993a, 1993b; Walker & Sikorska 1997). Despite the typical staining observed in the nucleus of astrocytes by the TUNEL method, a DNA ladder cannot be detected on agarose gel after induction of apoptosis by urine from MS patients. Borde et al. (1995) and Chiesa et al. (1998) had found a typical ladder with astrocytes in culture using other means of apoptosis induction, which meant these negative results might be due to the cell line but not to the cell type. They could also be due to our method of induction of apoptosis.
Another explanation might be a lack of sensitivity, since this technique needed an important quantity of apoptotic cells. The cell population we studied consisted of live cells, cells at differents stages of apoptosis and cells undergoing secondary necrosis. The absence of synchronization of these different events prevented us from having enough cells at the same stage of apoptosis.
The detection of nucleosomes by an ELISA technique was described in some articles (Allen, Hunter & Argawal 1997; Salgame et al. 1997). As in the Boehringer Mannheim kits tested here, they used two antibodies against histone and DNA. They concluded this technique was more sensitive than the detection of apoptosis by DNA ladder fragmentation. In our cellular model, no signal was detected. The ELISA kits were performed with cell lysis directly inside the 48‐well plates. Astrocytes were adherent cells characterized by the reticulum they create with their astrocytic feet in vivo. A similar characteristic was also observed in culture in vitro. Actually, our cells got slighlty entangled and were strongly attached to the support. It made them more difficult to lyse than cells in suspension. We believed that the ability of the lysis buffer to reach cells was not optimal in comparison with cells in suspension. In order to improve the action of the lysis buffer, we tried to add triton X‐100 detergent, but it did not increase the efficiency of the buffer. Even with this simple modification, this test was not adapted to our cellular model. It was also possible that we had the same sensitivity problem as with the DNA ladder technique, due to the absence of cell synchronization.
In conclusion, chosen techniques must be adapted to the astrocyte adherence feature. Techniques using an immunofluorescent labelling, such as annexin V‐FITC or TUNEL, allowed good observation of the cells at single‐cell level, emphasized by the fact that our cellular model was characterized by a very late loss of adhesion. Contrary to Lassus and Hibner’s model (Lassus & Hibner 1998), both techniques by immunofluorescence were good semi‐quantitative methods to label apoptotic astrocytes. These results are sufficient for research purposes, but it would be necessary to quantify apoptosis more precisely in clinical biology for example. Therefore, it is important to know whether there is a decrease or an increase in the number of apoptotic cells during the therapeutic process. In the context of a study of adherent cells, several techniques could be used, however, they must be chosen according to the cell type and its features, but also according to the mode of induction.
Moreover, the kinetics of the different stages in apoptosis depend on the type of cells and the stimulus of apoptosis (Stuart et al. 1998). Several unusual features characterized murine immortalized astrocytes after induction of apoptosis by urine from MS patients. First, we observed that phosphatydilserine externalization and DNA fragmentation were concomittant and occurred 72 h after the induction of apoptosis. The time necessary for the apoptotic machinery was very long, 72 h, in comparison with the models usually described. Although apoptotic cells with stained nuclei were observed with the TUNEL technique, no DNA ladder was observed after agarose gel electrophoresis with astrocytes. These results emphasized the necessity of understanding the mechanism which occurred during apoptosis of astrocytes induced by urine from MS patients. To complete this study, identification of the molecule(s) associated with gliotoxic activity is in process. Knowledge of the sequence should facilitate the study of its activity.
Acknowledgements
The authors would like to thank Dr F. Rieger, Dr P. Rouget for providing astrocytic cell line, Neurological Hospital’s and Germaine Revel Medical Centre’s physicians for urine collection. We also would like to thank Françoise Touraine‐Moulin’s team (Department of Immunology, Neurological Hospital of Lyon) for the access to flow cytometer.
References
- Adayev T, Estephan R, Meserole S, Mazza B, Yurkow EJ, Banerjee P (1998) Externalization of phosphatidylserine may not be an early signal of apoptosis in neuronal cells, but only the phosphatidylserine‐displaying apoptotic cells are phagocytosed by microglia. J. Neurochem. 71, 1854. [DOI] [PubMed] [Google Scholar]
- Allen RT, Hunter WJ, Agrawal DK (1997) Morphological and biochemical characterization and analysis of apoptosis. J. Pharmacol. Toxicol. Met 37, 215. [DOI] [PubMed] [Google Scholar]
- Borde I, Evrard C, Galiana E, Rouget P (1995) A permanent glial cell line, immortalized with the adenovirus E1A gene, undergoes apoptosis in restrictive growth conditions. Biochem. Biophys. Res. Comm 207, 630. [DOI] [PubMed] [Google Scholar]
- Chan A, Reiter R, Wiese S, Fertig G, Gold R (1998) Plasma membrane phospholipid asymmetry precedes DNA fragmentation in different apoptotic cell models. Histochem. Cell Biol. 110, 553DOI: 10.1007/s004180050317 [DOI] [PubMed] [Google Scholar]
- Chiesa R, Angeretti N, Del Bo R, Lucca E, Munna E, Forloni G (1998) Extracellular calcium deprivation in astrocytes: regulation of mRNA expression and apoptosis. J. Neurochem. 70, 1474. [DOI] [PubMed] [Google Scholar]
- Cossarizza A, Mussini C, Borghi V et al. (1999) Apoptotic features of peripheral blood granulocytes and monocytes during primary, acute HIV infection. Exp Cell Res. 247, 304DOI: 10.1006/excr.1999.4387 [DOI] [PubMed] [Google Scholar]
- Dexter YS, Jiang S, Zheng L‐M, Ojcius DM, Young JD‐E (1994) Separate metabolic pathways leading to DNA fragmentation and apoptotic chromatin condensation. J. Exp Med. 179, 559. [DOI] [PMC free article] [PubMed] [Google Scholar]
- Dowling P, Husar W, Menonna J, Donnenfeld H, Cook S, Sidhu M (1997) Cell death and birth in multiple sclerosis brain. J. Neurol. Sci. 149, 1DOI: 10.1016/s0022-510x(97)05213-1 [DOI] [PubMed] [Google Scholar]
- Dowling P, Shang G, Raval S, Menonna J, Cook S, Husar W (1996) Involvement of the CD95 (APO‐1/Fas) receptor/ligand system in multiple sclerosis brain. J. Exp Med. 184, 1513. [DOI] [PMC free article] [PubMed] [Google Scholar]
- Emoto K, Toyama‐Sorimachi N, Karasuyama H, Inoue K, Umeda M (1997) Exposure of phosphatidylethanolamine on the surface of apoptotic cells. Exp Cell Res. 232, 430DOI: 10.1006/excr.1997.3521 [DOI] [PubMed] [Google Scholar]
- Van England M, Ramakers FCS, Schutte B, Reutelingsperger CPM (1996) A novel assay to measure loss of plasma membrane asymetry during apoptosis of adherent cells in culture. Cytometry 24, 131DOI: 10.1002/(sici)1097-0320(19960601)24:2<131::aid-cyto5>3.0.co;2-m [DOI] [PubMed] [Google Scholar]
- Frankfurt OS, Robb JA, Sugarbaker EV, Villa L (1997) Apoptosis in breast carcinomas detected with monoclonal antibody to single‐stranded DNA: relation to bcl‐2 expression, hormone receptors, and lymph node metastases. Clin. Cancer Res. 3, 465. [PubMed] [Google Scholar]
- Galiana E, Borde I, Marin P et al. (1990) Establishment of permanent astroglial cell lines, able to differentiate in vitro, from transgenic mice carrying the Polyoma virus large T gene: an alternative approach to brain cell immortalization. J. Neurosci Res. 26, 269. [DOI] [PubMed] [Google Scholar]
- Gatti R, Belletti S, Orlandini G, Bussolati O, Dall'Asta V, Gazzola GC (1998) Comparison of annexin V and calcein‐AM as early vital markers of apoptosis in adherent cells by confocal laser microscopy. J. Histochem. Cytochem. 46, 895. [DOI] [PubMed] [Google Scholar]
- Gavrieli Y, Sherman Y, Ben‐Sasson SA (1992) Identification of programmed cell death in situ via specific labeling of nuclear DNA fragmentation. J. Cell Biol. 119, 493. [DOI] [PMC free article] [PubMed] [Google Scholar]
- Gerschenson LE & Rotallo RJ (1992) Apoptosis: a different type of cell death. FASEB J. 6, 2450. [DOI] [PubMed] [Google Scholar]
- Grasl‐Kraupp B, Ruttkay‐Nedecky B, Koudelka H, Bukowska K, Bursch W, Schulte‐Hermann R (1995) In situ detection of fragmented DNA (TUNEL assay) fails to discriminate among apoptosis, necrosis, and autolytic cell death: a cautionary note. Hepathol 21, 1465. [DOI] [PubMed] [Google Scholar]
- Keane RW, Srinivasan A, Foster LM et al. (1997) Activation of CPP. 32 during apoptosis of neurons and astrocytes. J. Neurosci. Res. 48, 168DOI: 10.1002/(sici)1097-4547(19970415)48:2<168::aid-jnr9>3.0.co;2-a [DOI] [PubMed] [Google Scholar]
- Kerr JFR & Harmon BV (1991) Definition and incidence of apoptosis: an historical perspective. In: Apoptosis: the Molecular Basis of the Cell Death. Cur Comm Cell Mol Biol., 5.
- Koopman G, Reutelingspergerc PM, Kuijten GAM, Pals ST, Van Oers MHJ (1994) Annexin V for flow cytometric detection of phosphatidylserine expression on B cells undergoing apoptosis. Blood 84, 415. [PubMed] [Google Scholar]
- Kornfeld H, Mancino G, Colizzi V (1999) The role of macrophage cell death in tuberculosis. Cell Death Differ 6, 71. [DOI] [PubMed] [Google Scholar]
- Lassus P & Hibner U (1998) Detection and quantification of apoptosis in transiently transfected adherent cells. Nucl Acids Res. 26 (22), 5233DOI: 10.1093/nar/26.22.5233 [DOI] [PMC free article] [PubMed] [Google Scholar]
- Levy R, Benchaib M, Cordonier H, Souchier C, Guerin JF (1998) Annexin V labelling and terminal transferase‐mediated DNA end labelling (TUNEL) assay in human arrested embryos. Mol Hum Reprod 4, 775DOI: 10.1093/molehr/4.8.775 [DOI] [PubMed] [Google Scholar]
- Lizard G, Deckert V, Dubrez L, Moisant M, Gambert P, Lagrost L (1996) Induction of apoptosis in endothelial cells treated with cholesterol oxides. Am. J. Pathol 148, 1625. [PMC free article] [PubMed] [Google Scholar]
- Lizard G, Miguet C, Gueldry S, Monier S, Gambert P (1997) Mise en évidence de la fragmentation d’ADN par cytométrie en flux au cours de la mort cellulaire par apoptose. Ann. Pathol 17, 61. [PubMed] [Google Scholar]
- Lucchinetti CF, Brück W, Rodriguez M, Lassmann H (1996) Distinct patterns of multiple sclerosis pathology indicates heterogeneity in pathogenesis. Brain Pathol 6, 259. [DOI] [PMC free article] [PubMed] [Google Scholar]
- Malcus‐Vocanson C, Giraud P, Broussolle E, Perron H, Mandrand B, Chazot G (1998) A urinary marker for multiple sclerosis. Lancet 351, 1330. [DOI] [PubMed] [Google Scholar]
- Martin SJ, Finucane DM, Amarante‐Mendes GP, O'Brien GA, Green DR (1996) Phosphatidylserine externalization during CD 95‐induced apoptosis of cells and cytoplasts requires ICE/Ced‐3 protease activity. J. Biol. Chem 271, 28753. [DOI] [PubMed] [Google Scholar]
- Nakano R (1997) Apoptosis: gene‐directed cell death. Horm Res. 48, 2. [DOI] [PubMed] [Google Scholar]
- Negoescu A, Lorimier P, Labat‐Moleur F et al. (1996) In situ apoptotic cell labelling by the TUNEL method: improvement and evaluation on cell preparations. J. Histochem. Cytochem. 44, 959. [DOI] [PubMed] [Google Scholar]
- Nicoletti I, Migliorati G, Pagliacci MC, Grignani F, Riccardi C (1991) A rapid and simple method for measuring thymocytes apoptosis by propidium iodide staining and flow cytometry. J. Immunol. Meth 139, 271. [DOI] [PubMed] [Google Scholar]
- Oberhammer F, Fritsch G, Schmeid M et al. (1993a) Condensation of the chromatin at the membrane of an apoptotic nucleus is not associated with activation of an endonuclease. J. Cell Sci. 104, 317. [DOI] [PubMed] [Google Scholar]
- Oberhammer F, Wilson JW, Dive C et al. (1993b) Apoptotic death in epithelial cells: cleavage of DNA to 300 and/or 50 kb fragments prior to or in the absence of internucleosomal fragmentation. EMBO J. 12 (9), 3679. [DOI] [PMC free article] [PubMed] [Google Scholar]
- Ohsako S & Elkon KB (1999) Apoptosis in the effector phase of autoimmune diabets, multiple sclerosis and thyroiditis. Cell Death Differ 6, 13. [DOI] [PubMed] [Google Scholar]
- Pender MP, Nguyen KB, McCombe PA, Kerr JFR (1991) Apoptosis in the nervous system in experimental allergic encephalomyelitis. J. Neurol. Sci. 104, 81. [DOI] [PubMed] [Google Scholar]
- Pepper C, Thomas A, Tucker H, Hoy T, Bentley P (1998) Flow cytometry assessment of three different methods for the measurement of in vitro apoptosis. Leuk Res. 22, 439DOI: 10.1016/s0145-2126(98)00013-7 [DOI] [PubMed] [Google Scholar]
- Raff MC, Barres BA, Burne JF, Coles HS, Ishizaki Y, Jacobson MD (1993) Programmed cell death and the control of the cell survival: lessons from the nervous system. Science 262, 695. [DOI] [PubMed] [Google Scholar]
- Rieger F, Amouri R, Benjelloun N et al. (1996) Un facteur gliotoxique et la sclérose en plaques. C. R. Acad. Sci. (Paris) Life Sci. 319, 343. [PubMed] [Google Scholar]
- Rimon G, Bazenet CE, Philpott KL, Rubin LL (1997) Increased surface phosphatidylserine is an early marker of neuronal apoptosis. J. Neurosci Res. 48, 563DOI: 10.1002/(sici)1097-4547(19970615)48:6<563::aid-jnr9>3.0.co;2-8 [DOI] [PubMed] [Google Scholar]
- Rosen A & Casciola‐Rosen L (1999) Autoantigens as substrates for apoptotic proteases: implications for the pathogenesis of systemic autoimmune disease. Cell Death Differ 6, 6. [DOI] [PubMed] [Google Scholar]
- Salgame P, Varadhachary AS, Primiano LL, Fincke JE, Muller S, Monestier M (1997) An ELISA for detection of apoptosis. Nucl Acids Res. 25, 680DOI: 10.1093/nar/25.3.680 [DOI] [PMC free article] [PubMed] [Google Scholar]
- Schmid I, Uittenbogaart CH, Giorgi JV (1994) Sensitive method for measuring apoptosis and cell surface phenotype in human thymocytes by flow cytometry. Cytometry 15, 12. [DOI] [PubMed] [Google Scholar]
- Sprecher E, Bergman R, Meilick A, Kerner H, Manov L, Reiter I, Shafer Y, Maor G, Friedman‐Birnbaum R (1999) Apoptosis, Fas and Fas‐ligand expression melanocytic tumors. J. Cutan Pathol 26, 72. [DOI] [PubMed] [Google Scholar]
- Steller H (1995) Mechanisms and genes of cellular suicide. Science 267, 1445. [DOI] [PubMed] [Google Scholar]
- Stuart MCA, Damoiseaux JGMC, Frederik PM, Arends J‐W, Reutelingsperger CPM (1998) Surface exposure of phosphatidylserine during apoptosis of rat thymocytes precedes nuclear changes. EJCB 76, 77. [DOI] [PubMed] [Google Scholar]
- Thomas IB, Gates DJ, Richfield EK, O'Brien TF, Schweitzer JB, Steindler DA (1995) DNA End Labeling (TUNEL) in Huntington’s desease and other neurophathological conditions. Exp Neurol. 133, 265DOI: 10.1006/exnr.1995.1029 [DOI] [PubMed] [Google Scholar]
- Thompson CB (1995) Apoptosis in the pathogenesis and treatment of disease. Science 267, 1456. [DOI] [PubMed] [Google Scholar]
- Walker PR, Kokileva L, Leblanc J, Sikorska M (1993) Detection of the initial stages of DNA fragmentation in apoptosis. Biotechniques 15, 1032. [PubMed] [Google Scholar]
- Walker PR & Sikorska M (1997) New aspects of the mechanism of DNA fragmentation in apoptosis. Biochem. Cell Biol. 75, 287DOI: 10.1139/bcb-75-4-287 [DOI] [PubMed] [Google Scholar]
- Wattre P, Bert V, Hober D (1996) Apoptose et infections virales humaines. Ann. Biol. Clin. 54, 189. [PubMed] [Google Scholar]
- Weis M, Schlegel J, Kass GEN et al. (1995) Cellular events in Fas/APO‐1‐mediated apoptosis in JURKAT T lymphocytes. Exp Cell Res. 219, 699DOI: 10.1006/excr.1995.1281 [DOI] [PubMed] [Google Scholar]
- Wyllie AH (1980) Glucocorticoid‐induced thymocyte apoptosis is associated with endogenous endonuclease activation. Nature 284, 555. [DOI] [PubMed] [Google Scholar]
- Wyllie AH, Kerr JFR, Currie AR (1980) Cell death: the significance of apoptosis. Int. Rev. Cytol. 68, 251. [DOI] [PubMed] [Google Scholar]
- Zang YCQ, Kozovska MM, Hong J et al. (1999) Impaired apoptotic deletion of myelin basic protein‐reactive T cells in patients with multiple sclerosis. Eur J. Immunol. 29, 1692DOI: 10.1002/(sici)1521-4141(199905)29:05<1692::aid-immu1692>3.3.co;2-8 [DOI] [PubMed] [Google Scholar]