Abstract
Reverse genetic screens by RNA interference (RNAi) in model organisms such as the nematode Caenorhabditis elegans have provided numerous insights into gene function, thereby connecting genotype to phenotype. However, genes that contribute only subtly are often missed because relatively large numbers of measurements and reliable quantification are required to overcome experimental and biological noise that may mask subtle phenotypic effects. Here, we address this challenge by focusing on two phenotypes in C. elegans: growth and fat storage. We performed comprehensive RNAi knockdown of transcription factors (TFs), as these are known important regulators of biological processes during development and the maintenance of homeostasis. Microscopy images of TF knockdown animals stained with Oil-red-O (ORO) were captured and body size (proxy for growth) and ORO staining intensity (proxy for fat storage) were precisely quantified using a newly developed imaging tool we named IPPOME (Image Processing for Precise and Objective MEasurement). We found that a surprisingly large proportion of TFs contribute to growth and fat storage, but that most TFs have only subtle, yet significant effects. This study provides a blueprint for studies of other genes and phenotypes in C. elegans.
Keywords: C. elegans, fat storage, transcription factors, development, image analysis
Introduction
Model organisms have been indispensable to elucidate the functional contributions of genes to various phenotypes. Classical studies have used forward genetics to first identify targeted phenotypic perturbations followed by the identification of the causal mutation. In metazoan model systems such as Drosophila melanogaster and Caenorhabditis elegans, the studies of the relationship between genotype and phenotype have been revolutionized by large-scale RNA interference (RNAi) experiments in which the effect of the perturbation of each gene on a phenotype of interest is systematically tested. For instance, genome-scale RNAi screens in C. elegans have identified genes involved in a large range of developmental and physiological phenotypes (Ashrafi et al, 2003; Kamath et al, 2003; Watson et al, 2013). However, in these studies phenotypes are usually qualitatively assessed by eye and, as a result, are prone to capturing easy to observe, severe phenotypes and to be biased toward annotating genes that have profound phenotypic effects. For instance, initial RNAi screens focused on high-penetrance, easily observed phenotypes such as lethality and sterility. As a consequence, subtle phenotypes or subtle gene contributions have remained underreported. In order to uncover subtle gene contributions, phenotypes need to be measured quantitatively and using large numbers of animals to enable the use of statistics to more precisely measure genotype-to-phenotype associations and thereby mitigate the noise that is inherent to RNAi screens.
To quantitatively capture subtle phenotypes, visual screening is not sufficient, and computational image analysis needs to be employed. Several image-analysis tools are available for the study of C. elegans (Husson et al, 2012). However, most of these have limited applicability to genome-scale phenotypic screening due to: (i) Detectability: C. elegans are transparent, which renders precise automated delineation of the animal’s body edge from the background difficult. (ii) Noise: the background in each image contains noise, which may not be observed by visual inspection but can hamper computational analysis. (iii) Inconsistencies between images: images can vary in number, location, position and size of the animals to be detected. These limitations make it challenging to precisely quantify phenotypes without parameter adjustment between images. To overcome these issues, available tools often require experimental adaptations that reduce the accuracy in the quantification of phenotypic traits, such as imaging the animals in liquid cultures and/or using low-magnification to increase contrast, enabling discrimination between animals and background. Several programs, including ImageJ/Fiji (Schneider et al, 2012) and CellProfiler/Wormtoolbox (Wahlby et al, 2012), provide good options for image analysis. However, these programs require adjusting the settings of multiple parameters or thresholds to conduct precise quantifications per image, and these parameters often have to be readjusted for different images, even within images from the same experiment.
To unveil subtle but significant genotype-to-phenotype relationships, we performed an RNAi screen with a library of 854 of the 941 TFs, and combined this screen with a newly developed image analysis software tool and statistical analysis to precisely quantify changes in body size as a proxy for growth and in ORO staining as a proxy for fat content. We found that more than half of C. elegans TFs contribute significantly to growth, fat content, or both, and that most of these have subtle but significant effects.
Results
RNAi screen for transcription factors regulating growth and fat storage
We performed RNAi on 854 of the 941 (91%) known C. elegans TFs (Dataset EV1) (MacNeil et al, 2015; Reece-Hoyes et al, 2005). Many TFs cause embryonic lethality in the F1 generation when perturbed by RNAi in the P0 generation (Fraser et al, 2000; Piano et al, 2000). This precludes the identification of their contribution to post-embryonic phenotypes such as growth and fat content. To circumvent embryonic lethality, we subjected synchronized wild type L1 animals to TF RNAi, and measured body size and fat content in these animals when they reached the adult stage (Fig 1A). Animals were grown on bacteria expressing double stranded RNA for 58 hours at 20°C. Resulting adult animals were stained with ORO to visualize fat content (Arda et al, 2010; Soukas et al, 2009). RGB images were obtained for an average of 17 animals per TF per experiment, and each experiment was performed three independent times. As a first level of phenotypic annotation, images were analyzed visually to observe egg laying deficient (Egl), sterile (Ste), larval arrest (Lva) and protruding vulva (Pvl) phenotypes. Images were subsequently subjected to computational analysis to precisely quantify body size as a measure of growth and ORO staining intensity as a measure of fat content.
Figure 1-. Experimental pipeline and manual phenotype analysis.
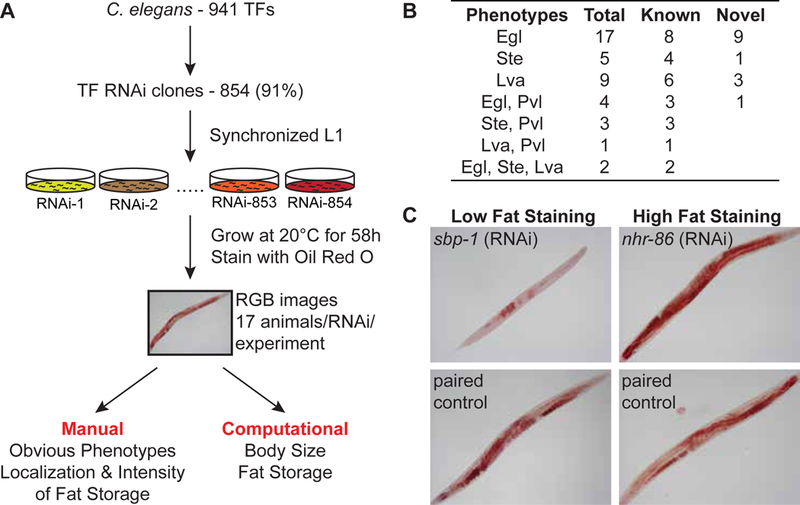
A Experimental pipeline. 854 out of 941 C. elegans TFs (91%) were knocked down individually by RNAi. Each experiment contained paired vector-fed animals (negative controls). Phenotypes including egg laying deficient (Egl), sterile (Ste), larval arrest (Lva), and protruding vulva (Pvl) were noted manually. For computational imaging, body size and fat content were quantified by IPPOME. All experiments were conducted blindly. Each TF was tested in three independent experiments, each containing on average 17 individual animals.
B Summary of all visually recorded phenotypes. Details of the corresponding RNAi to the TFs that causes these phenotypes are available in Dataset EV2.
C Example images of fat content phenotypes. Low levels of ORO staining upon sbp-1 (top left) knockdown and high levels of ORO staining in nhr-86 (top right) knockdown are shown compared to matched vector only negative controls.
We observed previously known phenotypes for multiple TFs, which validates the RNAi screen. For example, knockdowns of nhr-67, hlh-2, elt-2, and egl-43 displayed Egl, Ste, Lva, and Pvl phenotypes, respectively (Fig 1B, Dataset EV2) (Fernandes & Sternberg, 2007; Kamath et al, 2003; Karp & Greenwald, 2004; Trent et al, 1983). Additionally, we identified 14 TFs that were previously not known to display these phenotypes. Altogether, we observed Egl, Ste, Lva or Pvl phenotypes for 41 TFs (Dataset EV2). Thus, our screen not only identified known TF RNAi phenotypes, but also identified novel genotype-to-phenotype relationships.
Next, we asked whether the RNAi approach combined with ORO faithfully captured known fat-related TF knockdown phenotypes. The knockdown of sbp-1, the ortholog of human SREBP, is known to result in a dramatically reduced fat content (McKay et al, 2003; Walker et al, 2011) and we indeed captured this in our screen (Fig 1C). Similarly, we verified that knockdown of nhr-86 leads to an increase in fat content (Arda et al, 2010). Thus, gene knockdown by RNAi combined with ORO staining recapitulates known fat storage phenotypes.
IPPOME: an automated image-processing tool
It is extremely challenging, if not impossible, to correctly and precisely identify subtle changes in C. elegans body size and fat content by eye, especially for large numbers of individual animals. To facilitate the quantitative and accurate determination of subtle changes in these phenotypes, we developed an image-analysis platform that can be used for the precise measurement of various traits from microscopy images. We named this tool IPPOME (/I-poh-mey/ Image Processing for Precise and Objective MEasurement). The IPPOME code is available upon request, and the program can also be run through a web interface (http://ippomeweb.umassmed.edu/).
IPPOME presents an automated image analysis tool that can be used to quantify the animal’s body size and determine its color intensity (i.e., from ORO staining) for bright field as well as differential interference contrast (DIC) images. A unique feature of IPPOME is that it automatically manages parameters and optimization, and therefore enables standardized use in high-throughput experiments. For effective background noise removal, IPPOME requires a group of images that have been captured in the same experiment, i.e., multiple animals on the same slide. In bright field image analysis, IPPOME collects positional information (pixels) and color (pixel intensity) from the same image.
To test if IPPOME is suitable to precisely quantify C. elegans phenotypes, we first asked if it could reliably and precisely discriminate an animal from the background. We compared data obtained from 32 wild type (N2) animals manually outlined with a computer mouse in ImageJ to the automated detection of the same animals with IPPOME (Fig 2A). We calculated the body size of the animal as the total number of pixels in the delineated area and found that the mean and median differences in the body size between manual delineation and IPPOME were 3.4% and 2.9%, respectively. Close inspection found that IPPOME actually captures the animal’s image more precisely than manual outlining (Fig EV1). These results demonstrate that IPPOME can automatically and accurately distinguish an animal from the background.
Figure 2-. Automated image analysis by IPPOME.
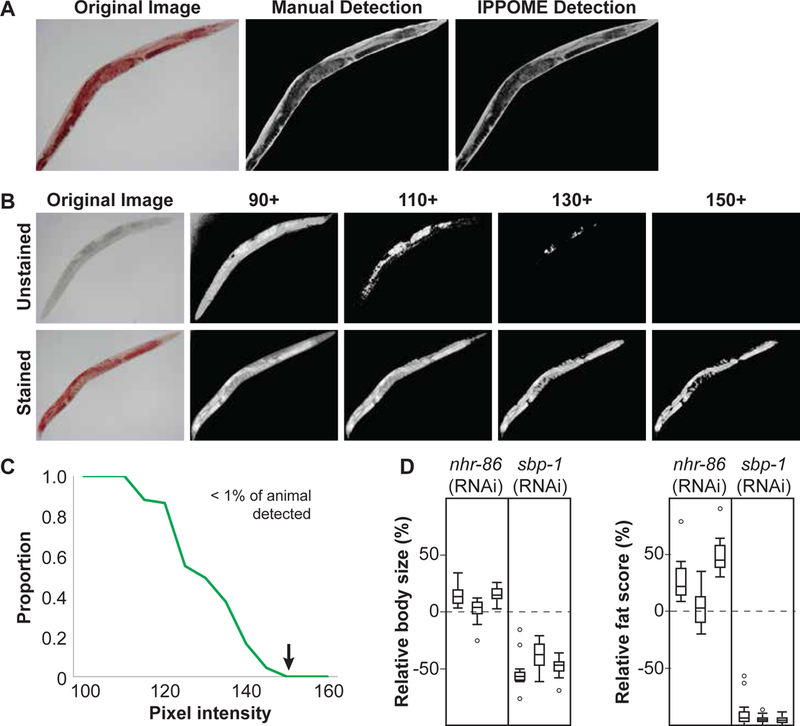
A Comparison between manual and IPPOME-derived delineation of a C. elegans body. An example of a bright field image of an ORO-stained animal (left panel), that same image manually delineated using ImageJ by outlining the animal with a computer mouse (middle panel), and the same image automatically delineated by IPPOME (right panel).
B ORO detection threshold. Determination of baseline pixel intensity for fat content analysis with ORO staining. Original bright field images are located at the far left, with an example of an unstained animal on the top row, and an ORO stained animal on the bottom row. Pixel intensity was inverted in each image. A pixel intensity of 150 was selected as the threshold for fat content analysis because unstained animals are no longer detected while ORO staining is detected.
C IPPOME ORO detection threshold. The proportion of the detectable animal (defined as the number of pixels) with a threshold of pixel intensity of 150 was evaluated by comparing ORO stained and unstained animals in Fig 2B. The green line represents the proportion of the unstained animal visible at the given pixel intensity. The arrow indicates the selected threshold of pixel intensity (150) for ORO staining when less than 1% of the unstained animal is visible.
D Boxplots of the relative body size (left) or fat score (right) for nhr-86 and sbp-1 knockdowns. Each boxplot corresponds to an independent experiment of an average of 17 animals each. The dashed line at 0% indicates the normalized average body size or fat score of paired control animals. Three independent experiments of 17 animals each are shown.
Figure EV1 – Manual animal detection versus IPPOME detection.
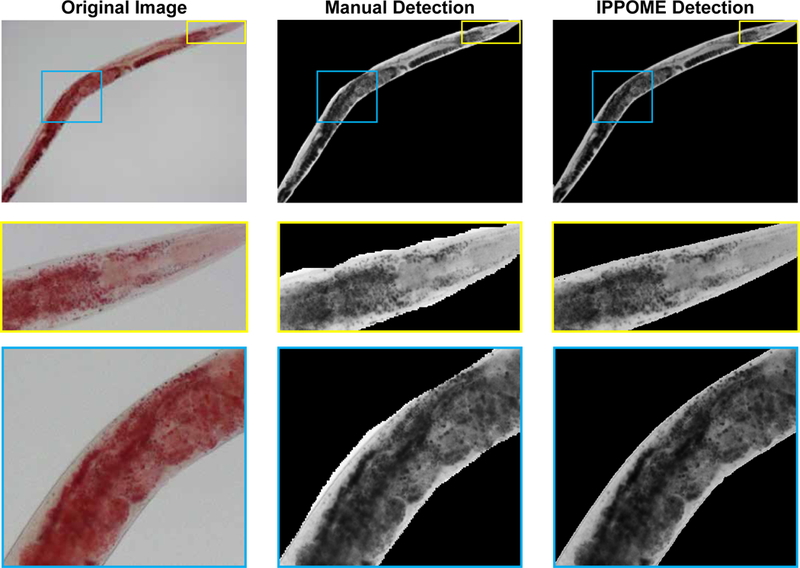
The same image was analyzed by hand using a computer mouse versus automatic analysis by IPPOME. Yellow and blue boxes indicated enlarged areas to compare manual and IPPOME outlining and detection.
To correctly quantify fat content, it is important that only pixels that indicate staining are considered. Therefore, we compared 60 ORO-stained animals to 60 unstained animals and determined the pixel threshold at which the stained animals were detected but the unstained animals were not (Fig 2B). The more darkly ORO stained an animal is, the higher its fat content. To generate a positive correlation between staining magnitude and fat content, we used the green channel signal and inverted the measured pixel intensity such that 0 corresponded to the lightest and 255 is the darkest pixel (Arda et al, 2010)(see Material and methods). At a pixel threshold of 150, no pixels were detected in unstained animals whereas they could be detected in ORO-stained animals (Fig 2B and 2C). Therefore, a threshold of 150 was selected for fat content analysis, and a fat content score was defined as the total number of pixels an intensity greater than 150 in the delineated animal.
To show the utility of IPPOME in quantifying C. elegans body size and fat content, we first focused on the knockdowns of nhr-86 and sbp-1 mentioned in Fig 1C. Knockdown animals were compared to the paired vector control animals treated in the same experiment. Visual inspection of color intensity in images showed a clear difference between paired controls and sbp-1 knockdown, while it was more challenging to visually distinguish differences between nhr-86 RNAi and control (Fig 1C). However, IPPOME could readily quantify both large and small changes in body size and fat content in either TF knockdown, indicating that it is suitable to uncover subtle phenotypes (Fig 2D).
Knockdown of TFs causes a broad distribution of growth and fat storage phenotypes
Next, we determined growth and fat phenotypes for all TFs tested (see Fig EV2A for the analysis pipeline, and see Materials and methods for details). Briefly, first, to determine changes in growth, IPPOME calculated the body size (BS) of single animals for both control and RNAi-treated animals as the total number of pixels in the selected area. All experiments were scored against paired control animals, which are the vector control experimental animals used to normalize scores of the RNAi-treated animals within the same experiment. The relative body size (rBS) corresponding to a TF RNAi experiment was determined by subtracting and dividing by the average BS of the paired controls. Second, to determine changes in fat content, IPPOME calculated the fat score (FS) for each RNAi experiment by calculating the pixel intensity for the same animals used in calculating BS. The FS per animal was calculated as the total number of pixels with an intensity greater than the background threshold of 150 (Fig 2C). Next, IPPOME calculated the relative fat score (rFS) per animal, which normalizes to the FS of the paired control animals. Finally, to correct for differences in body size that may correlate with fat content, a corrected relative fat score (crFS) was calculated. The final crFS for a single RNAi experiment per TF is the average crFS of all ~17 animals. At least three independent experiments were performed for each TF (Dataset EV3). First we plotted the entire dataset as crFS versus rBS with the RNAi knockdowns of sbp-1 and nhr-86 as reference points for small/lean and large/fat for reference points, respectively (Fig 3A). This dot plot shows a broad range of phenotypes for all of the RNAi TF knockdowns. However, a density plot of all TF RNAi experiments show that the majority clustered around (0,0) (Fig 3B). Examining the entire dataset as a histogram for each phenotype further shows the range of rBS, rFS and crFS (Fig 3C). The obvious change in histogram spread between the rFS and the crFS demonstrates the importance of body size correction when interpreting the fat score (Fig 3C, middle versus bottom histogram).
Figure EV2 – Pipeline of image and statistical analysis.
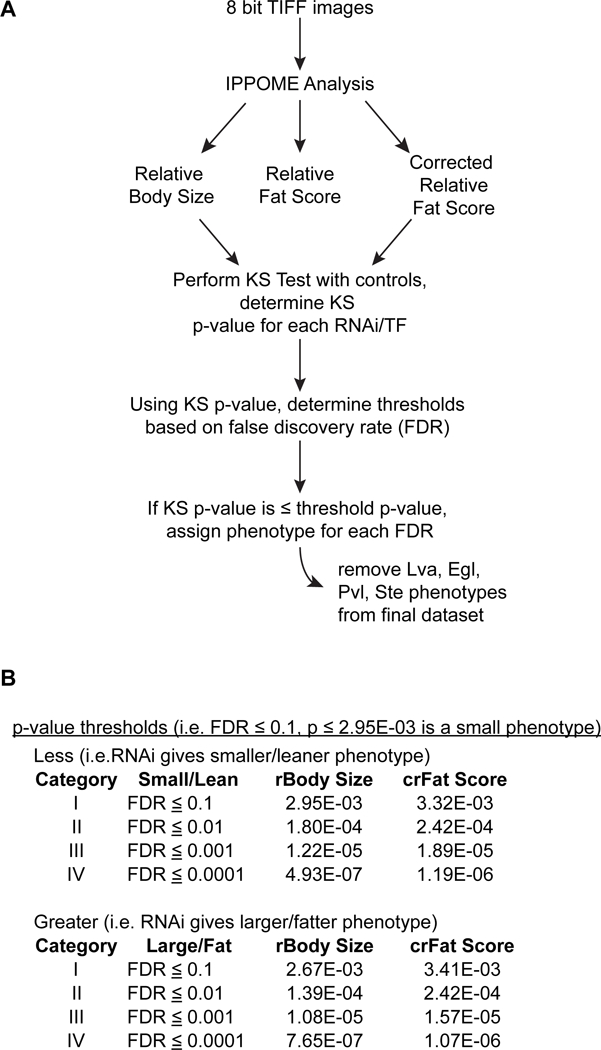
A Eight bit TIFF images are submitted to IPPOME for analysis. IPPOME provides a relative body size, relative fat score, and corrected relative fat score for each group of images (Dataset EV3). The relative body size and corrected relative fat score were analyzed by a one-sided KS test as described in materials and methods (Datasest EV4). Animals that displayed Lva, Egl, Pvl, or Ste phenotypes were removed from the dataset (Dataset EV2).
B False discovery rates (FDRs) plus a single p-value for each FDR percentage were calculated. If the KS p-value was less than or equal to the p-value for that FDR, then the TF was assigned the relevant phenotype. The phenotype thresholds for each of the FDR categories for this dataset are shown. (Dataset EV5).
Figure 3-. Distribution of body size and fat content phenotypes.
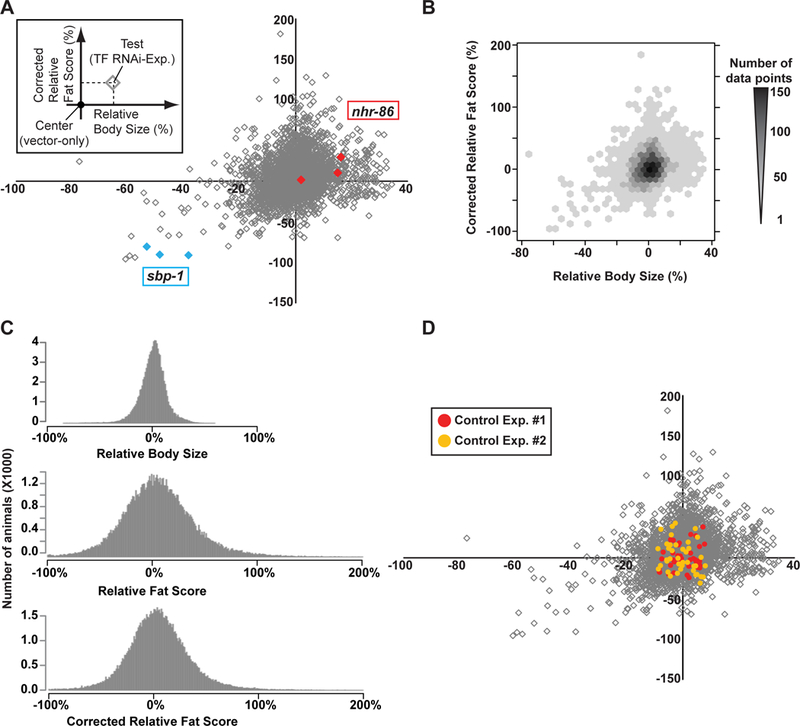
A Relative body size versus corrected relative fat score of all TF knockdowns. Comparative results across the entire experiment of the relative body size (x-axis) and corrected relative fat score (y-axis) of RNAi-mediated TF knockdown animals normalized to the respective scores of paired vector-fed animals. The vector-fed control animals are located at the center (0, 0) of this plot. Each data point represents the average of the corrected relative fat score and the relative body size of the RNAi-mediated TF knockdown per single RNAi experiment (average of ~17 animals each). A complete list of TFs with all scores is available in Dataset EV3. RNAi experiments for sbp-1 (blue) and nhr-86 (red) are shown as examples of lean and small, or fat and large, respectively.
B Density plot of relative body size and corrected relative fat score distributions of all TF RNAi experiments. The x-axis and y-axis indicate the relative body size and corrected relative fat score of RNAi-treated animals, respectively. Darker color hexagons indicate higher density of data points of RNAi-treated animals while lighter color shows lower density of data points.
C Comparison of the distributions of relative body size, relative fat score and corrected relative fat score for the entire dataset.
D Distribution of relative body size and corrected relative fat score of vector-control fed animals. All scores are normalized by the average of all measurements. Red and yellow indicate two independent experiments. In the first experiment, 38 vector only controls were performed, and in the second experiment 40. The gray diamonds indicate the total TF RNAi data shown in Fig 3A.
Before analyzing which TFs contribute significantly to growth and/or fat storage, we determined the rBS and crFS variance of control animals. Specifically, we performed two independent experiments of vector control RNAi; each dot represented an average score of 17 animals as in the real experiment discussed above. We overlaid the distribution of average body size and average fat score of vector-fed control animals over the entire dataset and found that it also largely clusters around (0,0) (Fig 3D). Importantly, many TF RNAi phenotypes are well outside the (0,0) area, indicating that numerous TFs functionally contribute to C. elegans growth and fat content.
To define TFs that significantly affect growth and/or fat storage, we employed a Kolmogorov–Smirnov (KS) test between the knockdown of a given TF, combining the independent experiments, versus the entire dataset of all TFs and controls (Dataset EV4, and website at http://ippomeweb.umassmed.edu/). Figures 4 and 5 show examples of correlation between the statistical test and TFs that affect growth and fat storage when knocked down by RNAi, respectively. Both figures show examples of large or fat (top panels Fig 4 or Fig 5, respectively), to no difference (middle panels), to small or lean (bottom panels Fig 4 or Fig 5, respectively). For instance, RNAi of ets-5 and nhr-283 causes a large phenotype with different magnitudes (top, Fig 4). Similarly, the RNAi of peb-1 and nhr-256 causes a small phenotype (bottom, Fig 4). A similar analysis was performed for calculating fat content phenotypes upon RNAi-mediated knockdown followed by ORO straining and IPPOME analysis, and the results are show in Figure 5.
Figure 4-. Examples of TFs affecting C. elegans growth.
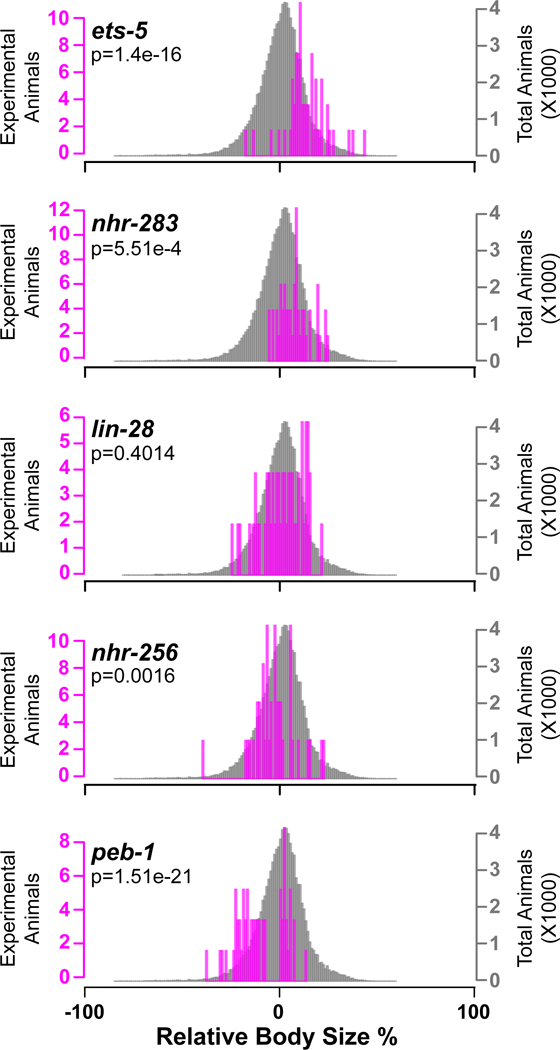
KS-test of each individual animal for the RNAi phenotype of the gene listed on the left (magenta bars) versus the entire dataset (~45,000 animals, gray bars). Examples of RNAi-mediated knockdown causing large (ets-5), above average large (nhr-283), average (lin-28), below average small (nhr-256), or small (peb-1) phenotypes. Three combined independent experiments are shown with an average of 51 animals per TF.
Figure 5-. Examples of TFs affecting C. elegans fat content.
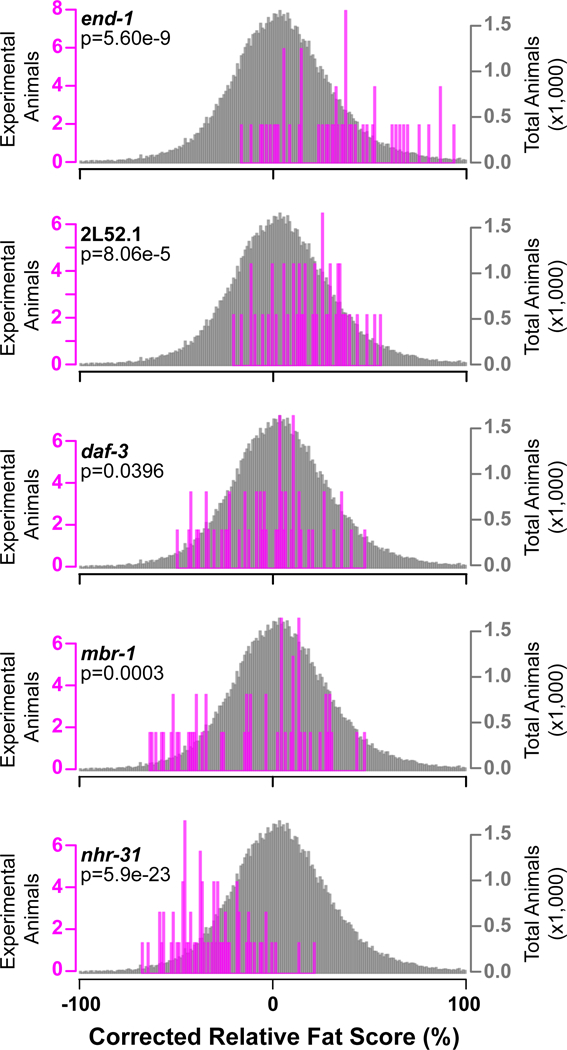
KS-Test of each individual animal for the RNAi phenotype of the gene listed on the left (magenta bars) versus the entire dataset (~45,000 animals, gray bars). Examples of RNAi-mediated knockdown causing fat (end-1), above average fat (2L52.1), average (daf-3), below average lean (mbr-1) or lean (nhr-31) phenotypes. Three combined independent experiments are shown with an average of 51 animals each.
Using p-values derived from the KS analysis, we next objectively defined the TFs that contribute to large, small, fat and lean phenotypes (see Material and methods, Figure EV2B). Prior to categorizing TFs with these phenotypes, we removed TFs that cause the morphological phenotypes described in Figure 1B (Dataset EV2) from the final dataset. With a false discovery rate (FDR) < 0.1, we identified 175 TFs that cause a large phenotype, 152 TFs that cause a small phenotype, 212 TFs that cause a fat phenotype, and 202 TFs that cause a lean phenotype (Fig 6A, Dataset EV5). We further defined subsets with increasing levels of confidence levels by reducing the FDR (Fig 6A, Dataset EV5). Importantly, even at an FDR < 0.0001 (Category IV), more than 10% of tested TFs cause a body size and/or fat content phenotype, or both. Of the TFs that cause a large phenotype (FDR < 0.1, or Category I), 31% confer a higher fat content, while only 15% are lean. Conversely, less than 10% of the TFs conferring a small phenotype are fat, while almost 50% are lean (Fig 6B, Dataset EV5).
Figure 6-. A large number of C. elegans TFs contribute to growth and fat content.
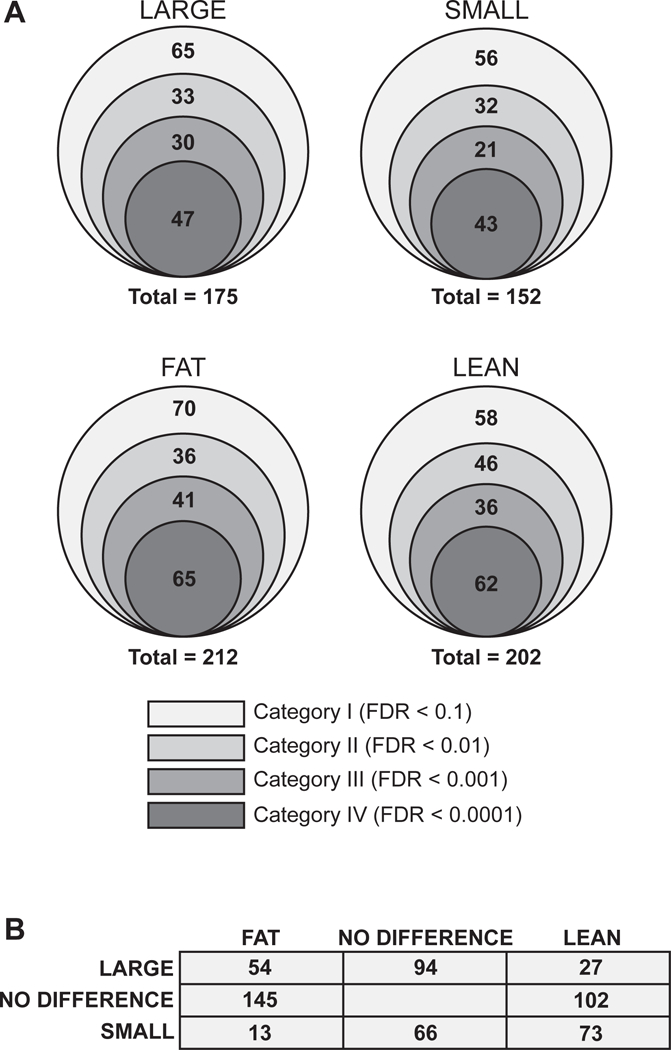
A Concentric circles representing the number of TFs conferring the indicated phenotype with different levels of confidence. FDR – false discovery rate.
B Overlap between Category I phenotypes (FDR < 0.1).
Transcription factor families
We and others previously found several nuclear hormone receptor (NHR) TFs associated with metabolic gene expression and fat content phenotypes (Arda et al, 2010; Van Gilst et al, 2005). Therefore, we next asked whether particular types of TFs are enriched in fat storage or growth phenotypes. We removed those TFs that conferred morphological phenotypes upon RNAi from the 854 TFs we tested. The remaining 813 TFs contain 831 unique (non-repeating) DNA binding domains (DBDs). This is because some TFs have multiple distinct DBDs. We found that the large phenotype (growth rate increase) is enriched for homeodomains (HDs) and depleted for NHRs, while the small phenotype is enriched for NHRs (Fig 7, Dataset EV6). Similarly, the fat phenotype is enriched for NHRs, while the lean phenotype is depleted. This finding globally supports the finding that NHRs, a family of TFs that has greatly expanded in nematodes (Reece-Hoyes et al, 2005; Taubert et al, 2011), more often function to reduce fat content, either by increasing fat catabolism, or by reducing fat storage.
Figure 7-. TF family analysis.
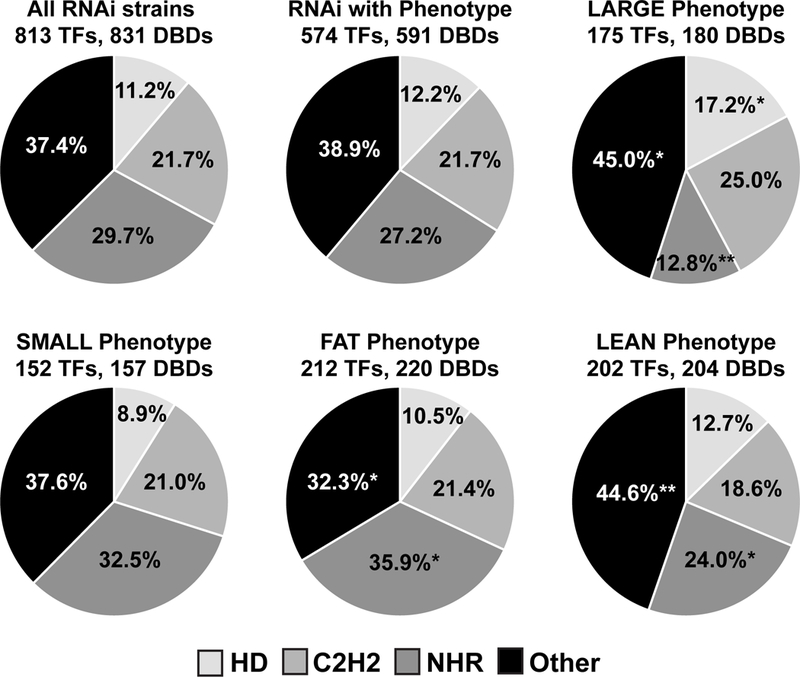
Pie charts showing the percentage of DNA binding domains (DBDs) present per phenotype. The top row indicates all of the DBDs from the total set of TFs tested (813 TFs with 831 DBDs – note that TFs that confer additional phenotypes were not included in this analysis), while the other rows show the percentage of the three most common C. elegans DBD family per phenotype (FDR < 0.1). Enrichment or depletion of a DBD per phenotype was calculated by hypergeometric distribution. *p < 0.05, **p < 0.01.
Developmental rate correlates with body size
One may expect that there is a strong correlation between body size and fat content such that animals that develop faster or slower may have an increase or decrease in body fat, respectively. We performed our screen at a single time point 58 hours after the plating of synchronized L1 animals (Fig 1A). To examine such potential correlation, we decided to stain a population of animals that represent different stages in the C. elegans life cycle. Specifically, we added mixed stage embryos to fresh plates every six hours for a total of 58 hours. We then combined all animals and stained them with ORO (Fig 8A). As a positive control for growth rate, we analyzed animals fed a diet of Comamonas aquatica DA1877 versus the standard laboratory diet of E. coli OP50, because we have previously found that Comamonas accelerates growth by supplementing vitamin B12 to the animal (MacNeil et al, 2013; Watson et al, 2014)(Fig 8B). We then tested the knockdown of four TFs versus control RNAi, nhr-86, hlh-12, nhr-66 and nhr-31, which had high-confidence phenotypes in our large-scale RNAi screen. Both nhr-86 and hlh-12 RNAi slightly increased growth rate and resulted in an increase in fat content (Fig 8B). Importantly, however, we found that knockdown of these TFs resulted in increased fat content relative to control animals of the same size. This shows that the high fat phenotype associated with these TFs is not solely due to an increase in growth rate. A correlation between a reduced growth rate and lower fat content is more apparent: upon RNAi of nhr-66 or nhr-31, animals develop slowly and there is no great difference in fat score between those animals and control animals that were exposed to vector only RNAi (Fig 8B). Altogether, this experiment indicates that changes in fat content reflect alterations either in fat storage or fat breakdown, especially for animals with greater fat content than control animals.
Figure 8-. Correlating fat content and body size over developmental time.
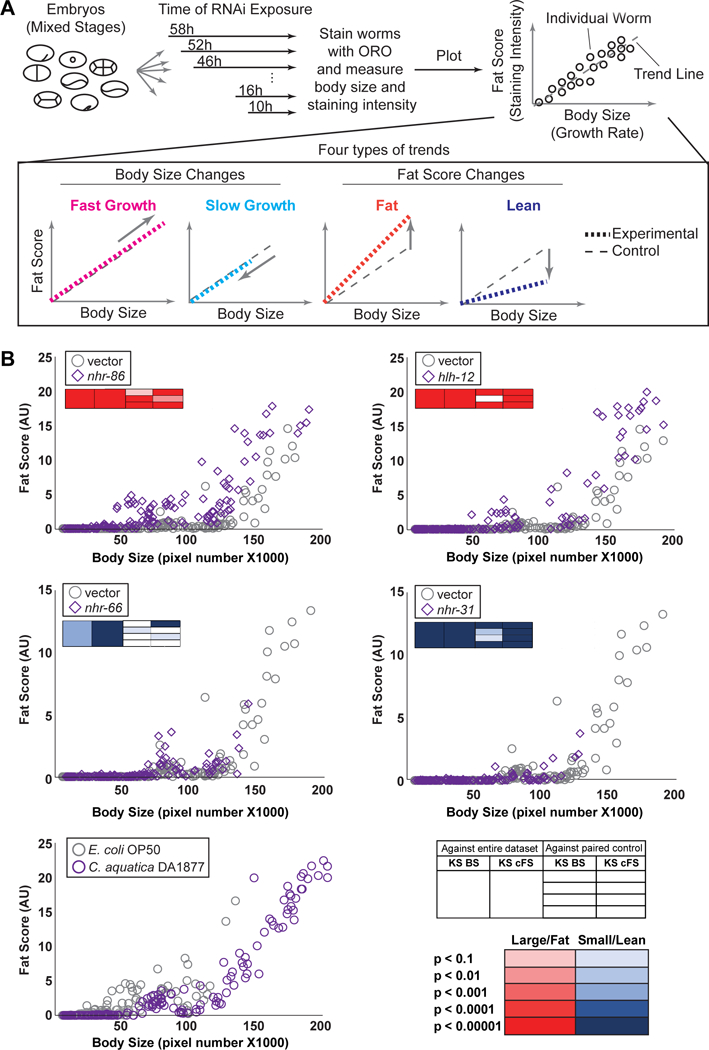
A Overview of the experiment. Mixed stage embryos were grown on different bacterial diets, or on E. coli HT115 bacteria containing RNAi to indicated TFs or vector alone. Embryos were added to fresh plates every 6 hours for a total of 58 hours. Animals were stained with ORO and analyzed by IPPOME as described in Figure 3. Data from individual animals were plotted as fat score (staining intensity over threshold, arbitrary units, AU) versus body size (number of pixels). Four types of phenotypes can be observed: fast growth, slow growth, fat, and lean. All experiments shown are a representative of three independent replicates. The boxes in the upper left of each graph indicate the results of the KS tests, with the key in the lower right of the figure (red – large/fat, blue – small/lean).
Phenotype gallery
In addition to the IPPOME web tool for animal analysis, we also created a web based phenotype gallery of all of our results. The image gallery is searchable by gene name, sequence name, and WormBase ID (Fig 9). Images can also be searched by fat, lean, large and small phenotypes, by the DBD family, and by the animal anatomy staining pattern. Individual images can be examined, and all statistics can be viewed and downloaded. Additionally, all image files can be downloaded for further examination.
Figure 9-. Web based phenotype gallery.
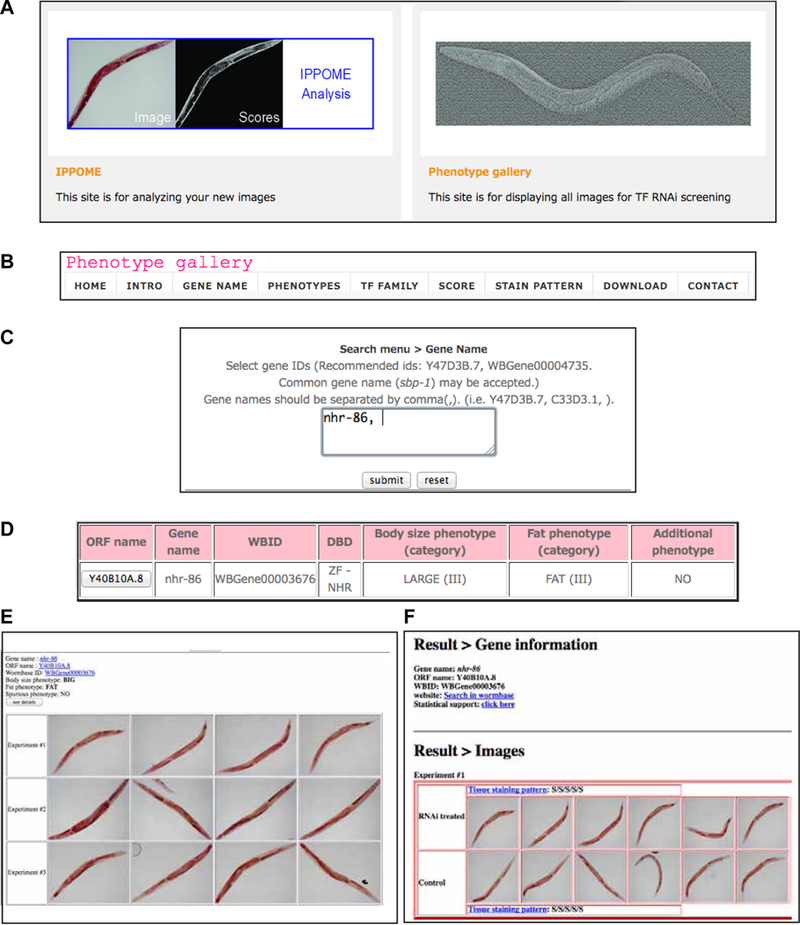
The web based image gallery can be accessed at http://ippomeweb.umassmed.edu/.
A Website main page with access to IPPOME for image analysis on the left, and access to the Phenotype Gallery on the right.
B The Phenotype Gallery menu.
C Search by sequence name, WormBase ID, or gene name.
D Results of searching for nhr-86 reveals the phenotype of the RNAi knockdown leads to a large (FDR < 0.001) and fat (FDR < 0.001) phenotype.
E Clicking on the ORF name in part D displays the experimental images.
F Further clicking on the “see details” button from part E displays the experimental images and the paired controls, plus tissue staining patterns. Further clicking after “Statistical Support” displays the KS-statistics for the entire dataset and for each experiment.
Discussion
We present evidence that many C. elegans TFs contribute to controlling growth and fat content. However, most of these TFs have only subtle but significant effects. We were able to uncover such effects by: (1) using a large number of animals per experiment, (2) performing triplicate, independent experiments, (3) using precise and automated measurements using a newly developed image analysis tool, and (4) rigorous statistical analysis of the data.
Previous studies have examined C. elegans fat storage on a genome scale (Ashrafi et al, 2003) and studied specific gene families such as NHRs (Arda et al, 2010; Hyun et al, 2016). There are several key differences between our study and those previously published. First, we stained L4 or young adult stage animals, while other studies focus on adults. Second, we started with L1 animals and examined phenotypes in those animals, and not in the F1 generation. This enabled us to identify growth and fat-related phenotypes for TFs that confer embryonic lethality upon RNAi knockdown. Third, we used ORO for detecting fat content, while other studies utilize Nile Red staining in living animals, which also stains other components such as lysosomes (Zhang et al, 2010). Finally, we used a novel computational image detection method versus detection by eye or by quantitative software not optimized for C. elegans. Despite using different animal staging, staining methods, and imaging methods, we still found a 30% overlap in previously published fat phenotypes of RNAi to NHRs and a 25% overlap in RNAi to TFs (Hyun et al, 2016; Ashrafi et al, 2003). Our study complements earlier findings by focusing exclusively on TFs, and by using precise computational quantitation when examining fat storage. In addition to determining body size and color intensity (i.e. from staining) for bright field and DIC images, IPPOME can detect and quantify GFP fluorescence with paired DIC images. Using IPPOME, we previously quantified subtle changes in GFP expression in a C. elegans GFP reporter strain sensitive to vitamin B12 (Watson et al, 2016). This study demonstrates that IPPOME can readily detect changes in GFP expression that may not be apparent to the human eye.
To our knowledge this is the first study to comprehensively examine the role of TFs in C. elegans body size. Changes in body size can occur for two reasons: the animals may be developmentally delayed (and we used a single time point after L1 feeding in our experiment), or not be delayed but be physically small. Other studies have examined TFs in specific signaling pathways like TGFβ to identify TFs that cause a small body size (Savage-Dunn et al, 2003; Wang et al, 2002). We reproduced several of these findings in our study, plus identify many more TFs involved in growth.
The importance of subtle genetic changes causing severe phenotypes may be most apparent in human disease. Genome-wide association studies have identified genomic variants that contribute to a variety of complex diseases. These variants may contribute subtly to human physiology, yet combined with other risk alleles and environmental factors may cause disease. A major goal, therefore, is to identify the contributions of each gene to each trait and disease, be it major, subtle, or not at all. As we show here, C. elegans is a powerful model organism for dissecting subtle phenotypes that result from gene knockdown.
Finally, we envision that other gene sets such as metabolic genes can be used in RNAi screens along with IPPOME to determine their contribution to growth and fat storage. Furthermore, examining other phenotypes that can be captured and quantified by image analysis will be important for dissecting out other obvious and subtle phenotypes. This study provides a framework for large-scale genetic analysis of phenotypes in C. elegans.
Materials and methods
C. elegans strains and RNAi
C. elegans strains were cultured and maintained by standard protocols (Brenner, 1974). RNAi was performed as described (Conte et al, 2015; MacNeil et al, 2015) with the following modifications: E. coli HT115 bacteria harboring TF RNAi clones were added to each 6 cm assay plate containing nematode growth media (NGM) supplemented with 2.5 mM Isopropyl β-D-thiogalactopyranoside (IPTG). Eggs were collected using buffered bleach (5–6% sodium hypochlorite in 500 mM NaOH, freshly prepared). On average 50 L1 animals were placed on each plate and grown at 20°C for 58 hours, to reach the one-day old adult stage.
Oil-red-O staining and visual phenotype assessment
ORO staining was performed as described (Arda et al, 2010; Soukas et al, 2009). Stained animals were mounted on 2% agarose pads and RGB images were captured using a Zeiss AxioCam HRc color CCD camera. On average, images of 17 animals per experiment were collected in tagged image file format (TIFF) format and three biological replicate experiments were performed independently. Morphological phenotypes such as larval arrest (Lva), egg-laying deficiency (Egl), sterility (Ste), and protruding vulva (Pvl) phenotypes were manually noted. Since these phenotypes may influence fat content and body size, the corresponding TFs that confer these phenotypes in at least two independent experiments were not considered for further analysis (Dataset EV2). All experiments were conducted blindly.
Gallery of C. elegans images
All images of ORO-stained animals used in this study are available at http://ippomeweb.umassmed.edu/. These images are searchable by: (i) gene ID, (ii) phenotype (body size, fat and manually observed), (iii) TF family, (iv) user definable thresholds for fat score and/or body size, and (v) anatomy-specific staining. Each RNAi-treated animal can be viewed next to the paired vector-fed (negative control) animals for visual comparison. Images in JPG (low resolution) and TIFF (high resolution) can be downloaded: (i) individually (JPG), (ii) in groups by search results (JPG or TIFF), or (iii) as an entire dataset (JPG and TIFF).
Measurements with IPPOME
IPPOME accepts digital interference contrast (DIC), fluorescent protein (e.g., GFP)(Watson et al, 2016), and bright field TIFF images. Multiple images captured in the same experiment were considered as a group. We assume that any type of noise (e.g., background noise from agar pad, illumination, etc.) is lower within a group than between different groups (different slides). IPPOME consists of two parts for automated detection of an image; noise-reduction of the image and the Chan-Vese method to detect objects (Chan & Vese, 2001). To systematically remove noise from each image, a filtering (or thresholding) technique is applied with a threshold of pixel intensity of background noise (i.e. if pixel intensity is below the threshold, then the pixel information is removed as noise and no longer used for analysis). The threshold for each group is determined generating a histogram of pixel intensity from each image. Among the images within the same group, the histogram of pixel intensity of an image is subtracted from the histogram of another image. Depicting the pixel intensity difference between the two images generates a new differential histogram. By using this differential histogram, the minimum pixel intensity (i.e., threshold for noise) is scored at where more than 5% of the difference appeared between the two histograms. After scoring the minimum intensity on all combinations of two images within the group, average (ave) and standard deviation (std) of the scores were calculated. The noise was removed based on the threshold of ave – std from images in the group. The noise-reduced images were then applied to the Chan-Vese method (Chan & Vese, 2001) to precisely detect object(s).
For bright field image analysis, we collected positional information (pixels) and color (pixel intensity) from the same image. Analyzed results of each image were visually curated to check detectability and sensitivity of the image analysis tool. The area (body size) and color score (ORO staining) in the image were calculated for each individually detected object.
The IPPOME script was written in the statistics software package R (http://www.r-project.org/). The rtiff package (http://cran.r-project.org/web/packages/rtiff/index.html) was employed with a single modification (below) to convert TIFF images into three matrices, each of which was associated with the three-color channels (red, green, and blue). The green channel metric was used for image analysis. The original readTiff function provides the relative pixel intensity normalized by the maximum intensity in the image (0 to 1). We modified this function to collect absolute pixel intensity values (0 to 255) enabling the comparison between images. The IPPOME website (url: http://ippomeweb.umassmed.edu/) and other scripts to run image analysis tools were written in R, bash, perl, php, and MySQL and operated on Linux. All IPPOME codes are available upon request.
Definition of relative body size and relative fat score
The body size (BS) of each animal was used as a proxy for developmental rate and was defined as the total number of pixels comprising the automatically detected individual animals in IPPOME. The BS was averaged across a mean of 17 animals per experiment. For each RNAi experiment the relative BS (rBS) was calculated as:
For fat scoring, the RGB composite images were split into each contributing color channel (i.e. red, green, and blue). Of the three, the green channel was selected to further analyze pixel intensities, as it gave the best contrast for the red staining intensity of ORO (Arda et al, 2010). The pixel intensity at which unstained animals were not detectable but ORO-stained animals were detected was empirically determined and subsequently used as a threshold. The fat score (FS) of individual animals was defined as:
The relative FS (rFS) takes into account the paired control animals and was defined as:
To obtain a corrected relative FS, a correction factor (CF) was used to account for differences in BS. The correction factor was defined as:
Which leads to a corrected FS (cFS):
Finally, the corrected relative FS (crFS) was calculated as follows:
Manual versus IPPOME comparison of C. elegans body size
To evaluate the performance of IPPOME, body size was delineated manually using ImageJ to outline each animal and compared to the area detected automatically by IPPOME. To minimize the error of manual detection, each animal was delineated five independent times, and the body size of each animal over five trials was calculated and averaged. This strategy was applied to 32 randomly selected images (32 animals). The average difference of the body size across the five trials over these 32 images was 1.52%. The difference in body size between manual and IPPOME-based delineation was computed per animal:
Statistics
One-sided Kolmogorov–Smirnov (KS) test was determined using KS.test in R (http://www.r-project.org/) and was used to compute p-values for each individual RNAi experiment. Subsequently, the three independent RNAi experiments were combined and statistically evaluated by comparing the data to all other RNAi and control experiments combined. The “less” option for the KS.test program was used to determine a p-value for the large and fat phenotypes while the “greater” option was used to determine small and lean phenotypes. All of the p-values for the above tests were entered into the “compute.FDR” function in R package library “brainwaver.” This package returned a single p-value for each TF that satisfied a targeted threshold of FDR (i.e., FDR < 0.1). The phenotypes for each category were determined based on p-values that satisfied the targeted FDR.
Development assay
Mixed stage embryos were placed onto NGM plates containing E. coli OP50, C. aquatica DA1877, or E. coli HT115 containing a TF RNAi clone or vector only as negative control. RNAi was performed as described above. For each condition, experiments were started every six hours for a maximum of 58 hours such that animals were grown for 58, 52, 46, 40, etc. down to 10 hours. Animals were collected and stained with ORO as described above. Animals were analyzed by IPPOME as described above with the exception of very young animals that are more difficult to automatically distinguish from background and were analyzed manually. Each experiment was performed three independent times.
Supplementary Material
The RNAi ID refers to the number assigned to the TF RNAi E. coli HT115 strain used to blindly screen all TFs. The sequence name is the coding sequence number derived from the C. elegans genome. The sequence name, WormBase ID, and public name were all obtained from WormBase version WS252. The DNA binding domain (DBD) was previously published (Fuxman Bass et al, 2016).
Observed Egl, Ste, Lva, and Pvl phenotypes caused by RNAi-mediated knockdown of a TF. References are shown for known phenotypes caused by RNAi or by a mutant allele.
IPPOME output data of average relative body size (ave rBS) and standard deviation (std rBS), average relative fat score (ave rFS) and standard deviation (std rFS), and average corrected relative fat score (ave crFS) and standard deviation (std crFS) for each experiment with a mean of 17 animals per experiment.
One-sided Kolmogorov-Smirnov test to determine if the RNAi to a TF displays the given phenotype. The first tab, KS Less, shows p-values indicating smaller/leaner phenotypes, and the second tab, KS Greater, shows p-values indicating larger/fatter phenotypes. The third tab, KS vs Paired Control, represents the KS test for individual experiments vs individual paired controls. There is a minimum of three experiments per TF RNAi. This data is provided for further analysis, but is not used in this study. rBS is relative body score, rFS is relative fat score, crFS is corrected relative fat score.
KS-test p-values from Dataset EV4 plus false discovery rate (FDR) thresholds were used to determine each phenotype. Each category represents a 10-fold increase in confidence (category I has an FDR of < 0.1, category II has an FDR of < 0.01, etc.). RNAi of a TF is assigned the phenotype when the KS number is ≤ p-value for a given FDR. For example, with an FDR of < 0.1, a p-value of ≤ 2.95 × 10⁻³ confers a small phenotype. rBS is relative body score and crFS is corrected relative fat score. No Difference indicates that the p-value is above the cutoff for a minimum FDR of < 0.1, and therefor there is no phenotype assigned to the TF (not available, NA).
Phenotypes from Dataset EV5 were grouped by DBD and by FDR category. A summary is shown for all phenotypes in the first tab. Detailed analysis is shown for all TFs in the second tab, large phenotype in the third tab, small phenotype in the fourth tab, fat phenotype in the fifth tab, and lean phenotype in the sixth tab.
Acknowledgements
We thank members of the Walhout lab, Michael Lee and Chad Myers for discussions and critical reading of the manuscript. Strains were provided by the C. elegans Genetics Center (CGC), which is funded by NIH Office of Research Infrastructure Programs (P40 OD010440); and by the National BioResource Project, Japan. This work was supported by US National Institutes of Health grants GM082971 and DK068429 to A.J.M.W.
Footnotes
Conflict of interest
The authors declare that they have no conflicting interest.
References
- Arda HE, Taubert S, Conine C, Tsuda B, Van Gilst MR, Sequerra R, Doucette-Stam L, Yamamoto KR, Walhout AJM (2010) Functional modularity of nuclear hormone receptors in a C. elegans gene regulatory network. Molecular Systems Biology 6: 367. [DOI] [PMC free article] [PubMed] [Google Scholar]
- Ashrafi K, Chang FY, Watts JL, Fraser AG, Kamath RS, Ahringer J, Ruvkun G (2003) Genome-wide RNAi analysis of Caenorhabditis elegans fat regulatory genes. Nature 421: 268–272 [DOI] [PubMed] [Google Scholar]
- Brenner S (1974) The genetics of Caenorhabditis elegans. Genetics 77: 71–94 [DOI] [PMC free article] [PubMed] [Google Scholar]
- Chan TF, Vese LA (2001) Active contours without edges. IEEE transactions on image processing : a publication of the IEEE Signal Processing Society 10: 266–277 [DOI] [PubMed] [Google Scholar]
- Conte D Jr., MacNeil LT, Walhout AJ, Mello CC (2015) RNA Interference in Caenorhabditis elegans. Curr Protoc Mol Biol 109: 26 23 21–26 23 30 [DOI] [PMC free article] [PubMed] [Google Scholar]
- Fernandes JS, Sternberg PW (2007) The tailless ortholog nhr-67 regulates patterning of gene expression and morphogenesis in the C. elegans vulva. PLoS Genet 3: e69. [DOI] [PMC free article] [PubMed] [Google Scholar]
- Fraser AG, Kamath RS, Zipperlen P, Martinez-Campos M, Sohrmann M, Ahringer J (2000) Functional genomics analysis of C. elegans chromosome I by systematic RNA interference. Nature 408: 325–330 [DOI] [PubMed] [Google Scholar]
- Fuxman Bass JI, Pons C, Kozlowski L, Reece-Hoyes JS, Shrestha S, Holdorf AD, Mori A, Myers CL, Walhout AJM (2016) A gene-centered C. elegans protein-DNA interaction network provides a framework for functional predictions. Mol Syst Biol 12: 884. [DOI] [PMC free article] [PubMed] [Google Scholar]
- Husson SJ, Costa WS, Schmitt C, Gottschalk A (2012) Keeping track of worm trackers. WormBook : the online review of C elegans biology: 1–17 [DOI] [PMC free article] [PubMed] [Google Scholar]
- Hyun M, Davis K, Lee I, Kim J, Dumur C, You YJ (2016) Fat Metabolism Regulates Satiety Behavior in C. elegans. Sci Rep 6: 24841. [DOI] [PMC free article] [PubMed] [Google Scholar]
- Kamath RS, Fraser AG, Dong Y, Poulin G, Durbin R, Gotta M, Kanapin A, Le Bot N, Moreno S, Sohrmann M, Welchman DP, Zipperlen P, Ahringer J (2003) Systematic functional analysis of the Caenorhabditis elegans genome using RNAi. Nature 421: 231–237 [DOI] [PubMed] [Google Scholar]
- Karp X, Greenwald I (2004) Multiple roles for the E/Daughterless ortholog HLH-2 during C. elegans gonadogenesis. Dev Biol 272: 460–469 [DOI] [PubMed] [Google Scholar]
- MacNeil LT, Pons C, Arda HE, Giese GE, Myers CL, Walhout AJM (2015) Transcription factor activity mapping of a tissue-specific gene regulatory network. Cell Syst 1: 152–162 [DOI] [PMC free article] [PubMed] [Google Scholar]
- MacNeil LT, Watson E, Arda HE, Zhu LJ, Walhout AJM (2013) Diet-induced developmental acceleration independent of TOR and insulin in C. elegans. Cell 153: 240–252 [DOI] [PMC free article] [PubMed] [Google Scholar]
- McKay RM, McKay JP, Avery L, Graff JM (2003) C elegans: a model for exploring the genetics of fat storage. Dev Cell 4: 131–142 [DOI] [PMC free article] [PubMed] [Google Scholar]
- Piano F, Schetter AJ, Mangone M, Stein L, Kemphues KJ (2000) RNAi analysis of genes expressed in the ovary of Caenorhabditis elegans. Current Biology 10: 1619–1622 [DOI] [PubMed] [Google Scholar]
- Reece-Hoyes JS, Deplancke B, Shingles J, Grove CA, Hope IA, Walhout AJM (2005) A compendium of C. elegans regulatory transcription factors: a resource for mapping transcription regulatory networks. Genome Biol 6: R110. [DOI] [PMC free article] [PubMed] [Google Scholar]
- Savage-Dunn C, Maduzia LL, Zimmerman CM, Roberts AF, Cohen S, Tokarz R, Padgett RW (2003) Genetic screen for small body size mutants in C. elegans reveals many TGFbeta pathway components. Genesis 35: 239–247 [DOI] [PubMed] [Google Scholar]
- Schneider CA, Rasband WS, Eliceiri KW (2012) NIH Image to ImageJ: 25 years of image analysis. Nature Methods 9: 671–675 [DOI] [PMC free article] [PubMed] [Google Scholar]
- Soukas AA, Kane EA, Carr CE, Melo JA, Ruvkun G (2009) Rictor/TORC2 regulates fat metabolism, feeding, growth, and life span in Caenorhabditis elegans. Genes Dev 23: 496–511 [DOI] [PMC free article] [PubMed] [Google Scholar]
- Taubert S, Ward JD, Yamamoto KR (2011) Nuclear hormone receptors in nematodes: evolution and function. Mol Cell Endocrinol 334: 49–55 [DOI] [PMC free article] [PubMed] [Google Scholar]
- Trent C, Tsuing N, Horvitz HR (1983) Egg-laying defective mutants of the nematode Caenorhabditis elegans. Genetics 104: 619–647 [DOI] [PMC free article] [PubMed] [Google Scholar]
- Van Gilst MR, Hadjivassiliou H, Yamamoto KR (2005) A Caenorhabditis elegans nutrient response system partially dependent on nuclear receptor NHR-49. Proc Natl Acad Sci U S A 102: 13496–13501 [DOI] [PMC free article] [PubMed] [Google Scholar]
- Wahlby C, Kamentsky L, Liu ZH, Riklin-Raviv T, Conery AL, O’Rourke EJ, Sokolnicki KL, Visvikis O, Ljosa V, Irazoqui JE, Golland P, Ruvkun G, Ausubel FM, Carpenter AE (2012) An image analysis toolbox for high-throughput C. elegans assays. Nature Methods 9: 714–716 [DOI] [PMC free article] [PubMed] [Google Scholar]
- Walker AK, Jacobs RL, Watts JL, Rottiers V, Jiang K, Finnegan DM, Shioda T, Hansen M, Yang F, Niebergall LJ, Vance DE, Tzoneva M, Hart AC, Naar AM (2011) A conserved SREBP-1/phosphatidylcholine feedback circuit regulates lipogenesis in metazoans. Cell 147: 840–852 [DOI] [PMC free article] [PubMed] [Google Scholar]
- Wang J, Tokarz R, Savage-Dunn C (2002) The expression of TGFbeta signal transducers in the hypodermis regulates body size in C. elegans. Development 129: 4989–4998 [DOI] [PubMed] [Google Scholar]
- Watson E, MacNeil LT, Arda HE, Zhu LJ, Walhout AJM (2013) Integration of metabolic and gene regulatory networks modulates the C. elegans dietary response. Cell 153: 253–266 [DOI] [PMC free article] [PubMed] [Google Scholar]
- Watson E, MacNeil LT, Ritter AD, Yilmaz LS, Rosebrock AP, Caudy AA, Walhout AJM (2014) Interspecies systems biology uncovers metabolites affecting C. elegans gene expression and life history traits. Cell 156: 759–770 [DOI] [PMC free article] [PubMed] [Google Scholar]
- Watson E, Olin-Sandoval V, Hoy MJ, Li C-H, Louisse T, Yao V, Mori A, Holdorf AD, Troyanskaya OG, Ralser M, Walhout AJM (2016) Metabolic network rewiring of propionate flux compensates vitamin B12 deficiency in C. elegans. Elife 5: pii: e17670 [DOI] [PMC free article] [PubMed] [Google Scholar]
- Zhang SO, Trimble R, Guo F, Mak HY (2010) Lipid droplets as ubiquitous fat storage organelles in C. elegans. BMC Cell Biol 11: 96. [DOI] [PMC free article] [PubMed] [Google Scholar]
Associated Data
This section collects any data citations, data availability statements, or supplementary materials included in this article.
Supplementary Materials
The RNAi ID refers to the number assigned to the TF RNAi E. coli HT115 strain used to blindly screen all TFs. The sequence name is the coding sequence number derived from the C. elegans genome. The sequence name, WormBase ID, and public name were all obtained from WormBase version WS252. The DNA binding domain (DBD) was previously published (Fuxman Bass et al, 2016).
Observed Egl, Ste, Lva, and Pvl phenotypes caused by RNAi-mediated knockdown of a TF. References are shown for known phenotypes caused by RNAi or by a mutant allele.
IPPOME output data of average relative body size (ave rBS) and standard deviation (std rBS), average relative fat score (ave rFS) and standard deviation (std rFS), and average corrected relative fat score (ave crFS) and standard deviation (std crFS) for each experiment with a mean of 17 animals per experiment.
One-sided Kolmogorov-Smirnov test to determine if the RNAi to a TF displays the given phenotype. The first tab, KS Less, shows p-values indicating smaller/leaner phenotypes, and the second tab, KS Greater, shows p-values indicating larger/fatter phenotypes. The third tab, KS vs Paired Control, represents the KS test for individual experiments vs individual paired controls. There is a minimum of three experiments per TF RNAi. This data is provided for further analysis, but is not used in this study. rBS is relative body score, rFS is relative fat score, crFS is corrected relative fat score.
KS-test p-values from Dataset EV4 plus false discovery rate (FDR) thresholds were used to determine each phenotype. Each category represents a 10-fold increase in confidence (category I has an FDR of < 0.1, category II has an FDR of < 0.01, etc.). RNAi of a TF is assigned the phenotype when the KS number is ≤ p-value for a given FDR. For example, with an FDR of < 0.1, a p-value of ≤ 2.95 × 10⁻³ confers a small phenotype. rBS is relative body score and crFS is corrected relative fat score. No Difference indicates that the p-value is above the cutoff for a minimum FDR of < 0.1, and therefor there is no phenotype assigned to the TF (not available, NA).
Phenotypes from Dataset EV5 were grouped by DBD and by FDR category. A summary is shown for all phenotypes in the first tab. Detailed analysis is shown for all TFs in the second tab, large phenotype in the third tab, small phenotype in the fourth tab, fat phenotype in the fifth tab, and lean phenotype in the sixth tab.


