Abstract
Cells in the early stages of starvation-induced fruiting body development migrate in a highly organized periodic pattern of equispaced accumulations that move as traveling waves. Two sets of waves are observed moving in opposite directions with the same wavelength and speed. To learn how the behavior of individual cells contributes to the wave pattern, fluorescent cells were tracked within a rippling population. These cells exhibit at least three types of organized behavior. First, most cell movement occurs along the same axis as the rippling movement. Second, there is a high degree of cell alignment parallel to the direction of rippling, as indicated by the biased movement. Third, by controlling the reversal frequency, cell movement becomes periodic in a rippling field. The periodicity of individual cells matches the period of macroscopic rippling. This last behavior is unique to a rippling population and, on the basis of Myxococcus xanthus genetic data, we conclude that this periodicity is linked to the C signal, a nondiffusible cell contact-mediated signaling molecule. When two cells moving in opposite directions meet end to end, they transmit the C signal to each other and in response reverse their gliding direction. This model of traveling waves represents a new mode of biological pattern formation that depends on cell-contact interactions rather than reaction diffusion.
Traveling waves are often found in multicellular development, where they may create a pattern in a previously undifferentiated sheet of cells. One well studied example is the aggregation of Dictyostelium discoideum amoebae to assemble highly structured fruiting bodies. The Dictyostelium waves can be understood in terms of chemotaxis toward cAMP and the induced release of cAMP (1, 2). Traveling waves are also observed in the developing retina of insects (3) and mammals (4). Using time-lapse cinematography, Reichenbach discovered that many species of myxobacteria propagate multicellular waves in the early stages of fruiting body development (5).
When Myxococcus xanthus is starved, the cells transmit developmental signals to each other as they build multicellular fruiting bodies and finally differentiate into spores (6). As aggregates begin to form, cells between the aggregates often migrate in a highly organized periodic pattern of equispaced ridges that move as traveling waves, called ripples (5, 7). In one closely monitored experiment designed to identify the different behavioral stages of fruiting body development, 100% of starved cultures showed rippling during the first 22 h of fruiting body development (8). Later, cells leave these ripples and stream into nascent aggregates. Myxobacterial genetic studies have revealed a series of cell–cell signals necessary for fruiting body development and rippling (9, 10). Mutants defective in either the early A or B signals cannot form fruiting bodies, yet they can ripple (7). In contrast, the C signal, a cell envelope-associated protein encoded by the csgA gene, is required both for fruiting body formation and for rippling (11). Microscopy revealed that the ripple crests were organized heaps of cells (7). C signal was found to change the behavior of cells by altering their reversal frequency (12). C-signaling was also found to depend on cell arrangement, requiring end–end contact between cells (13). csgA mutants, when combined with wild-type cells in different proportions, altered the ripple wavelength (12). These findings led to a proposal that cells travel a distance equal to the ripple wavelength without reversing. Contact with countermigrating cells in a neighboring ripple would then transmit the C signal, triggering cell reversals (12). However, cell tracking in ripples showed that cells reversed direction in ripple troughs, albeit less frequently than in ripple crests, indicating that more was involved than collision of cells in ripples (12).
Ripples offer an opportunity to investigate the role of signaling in the formation of patterns involving thousands of cells. To identify the cell movement behavior that underlies ripples, we first sought conditions under which the pattern is consistently observed. Under these reproducible conditions, cells were tracked and their trajectories analyzed. In collaboration with others, we compared cell tracks with predictions of a mathematical model that was developed to explain rippling behavior (14). Here we report a set of orderly cell behaviors that are sufficient to produce rippling according to that model.
Materials and Methods
Submerged Agar Culture (SAC).
The wild-type strain DK1622 (15) and DK10547, a derivative with green fluorescent protein (GFP) transcriptionally fused to the highly active pilA promoter, constructed by E. Licking (16) were used. In preparation for SAC, cells were grown in nutrient liquid media (1% casitone/10 mM Tris/8 mM MgSO4/1 mM KPO4) to midexponential phase (Klett 100 or ≈5.6 × 10⁸ cells/ml). These bacteria were pelleted at 12,000 × g, washed in nutrient-deficient medium (CF medium: 0.015% casitone, 10 mM Tris, 8 mM MgSO4, 1 mM KPO4), and resuspended at 2.4 × 10⁹ cells/ml in CF.
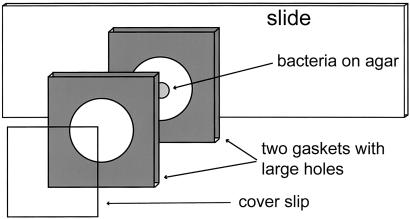
A sterile 0.5-mm-thick silicone rubber gasket (Grace Biolabs, Bend, OR) was placed on top of a flame-sterilized glass microscope slide, creating a small well. Molten 1.5% agar in CF medium was poured into the opening in the gasket, covered by a second flame-sterilized microscope slide, clamped to flatten the agar, and then cooled to room temperature. While the agar hardened, the M. xanthus culture was prepared for spotting as described. A second gasket apparatus was then set up, consisting of another sterile gasket, a flame-sterilized glass coverslip, a 4 × 4-cm piece of Parafilm (American National Can, Chicago), and another glass slide. The coverslip was placed on top of the gasket, creating a watertight well. This was placed on top of the slide, coverslip down, with the Parafilm between the coverslip and the slide to prevent the two from sticking to each other. The Parafilm and slide supported the second gasket to keep it from flexing and breaking the coverslip. The well created by the second gasket and the coverslip was filled with CF liquid medium. When the agar in the first apparatus hardened, the clamp and second slide were removed. A 0.5-μl aliquot of resuspended liquid culture was placed on the now-exposed agar disk and allowed to dry for ≈5 min. The apparatus containing the agar was then inverted and placed on top of the gasket holding the liquid medium so that the positions of the two gaskets match. The resulting sandwich was clamped for at least 1 h so the two gaskets attached to each other. Finally, the clamp was removed, along with the Parafilm and associated support slide. The final layers of a SAC apparatus consist of the coverslip, gasket containing CF liquid, gasket containing agar, and slide. The M. xanthus population is between the agar and the CF liquid (diagrammed in Fig. 1).
Figure 1.
Exploded view of a SAC growth chamber, showing a microscope slide with bacteria developing on an agar surface covered with liquid medium and a coverslip. The SAC chamber is not air tight, but evaporation is slow between the gaskets, and the culture remains wet and aerobic for more than a week. Construction of the chamber is detailed in Materials and Methods.
Microscopy.
During the acquisition of time-lapse images, SAC cultures were maintained at 25°C with a heated stage (Brook, Lake Villa, IL). All video microscopy was performed on a Nikon Eclipse E800 microscope (Nikon) by using long working distance objectives. Digital images were acquired from an analog video source by using a Scion LG-3 video capture card and scion image software (Scion, Frederick, MD). Phase-contrast images were generated with a charge-coupled device (CCD) camera (Optronics Engineering, Goleta, CA), whereas fluorescent images were generated with an intensified charge-coupled device video camera (Video Scope International, Sterling, VA). Images were saved at regular intervals (either 20 or 60 sec per frame), and background noise was reduced in the fluorescent images by averaging the video-rate images over a period of 2 sec. The scion image macro language was used to create scripts for automated hardware control, image acquisition, and data analysis. Images were saved as sequentially numbered Tagged Image File Format (TIFF) files and assembled into time-lapse movies by using quicktime (Apple, Cupertino, CA).
Tracking Cells.
Images of cells were acquired from prerippling and rippling populations at least 4 and 48 h, respectively, after their placement in SAC. Fluorescent images were acquired at 20-sec intervals for periods of 2 h. Consecutive images were assembled into stacks (nih image, Bethesda, MD), and individual cells were tracked manually. Four criteria were used to select cells for tracking. During the entire 2-h period: (i) A cell must be continually visible; (ii) a cell must not undergo cell division; (iii) a cell in a rippling population must remain within the rippling field; and (iv) a cell in a prerippling population must remain in the area where future rippling will occur. Cells were picked from the first frame in the stack and then were observed to see whether all of these criteria were met.
The two-dimensional path of each cell was divided along the x and y axes, with the x axis running tangent to the edge of the cell spot, which is parallel to the direction of ripple movement. Cell reversals, defined as the switching of a cell's leading pole, were determined both systematically and manually. The systematic determination of reversal events exploited the fact that a reversal is followed by an abrupt change in cell direction. Therefore, each cell reversal was initially marked as a point of change in the trajectory from a negative to a positive slope (or the reverse) in either the x or y axis of a cell path. All reversals determined by this method were confirmed visually from the assembled stacks. The time between reversals, or reversal period, was determined from the number of 20-sec frames between reversal events.
Results
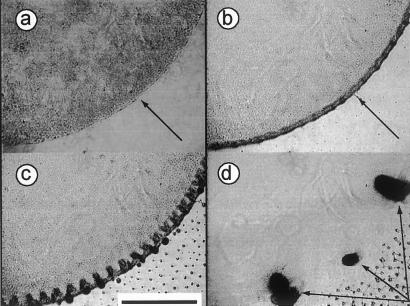
Earlier experimental designs had limited the observation of ripples to brief periods of time and to uncertain locations (see, for example, ref. 8). To find the cell behaviors that underlie ripples, cells were observed in SAC. A spot containing about 1 × 10⁶ starving M. xanthus cells was placed on a thin layer of agar then covered with liquid medium (Fig. 1). These cells eventually complete fruiting body development with spore formation. During the first few hours in SAC, cells from the center accumulate at higher density in an annulus around the edge of the circular spot (Fig. 2 a and b). Such accumulations have previously been observed (17) and arise from the reproducible tendency of M. xanthus cells to migrate from the center of a swarm toward its periphery (18). The cells remain within the edge of the initial spot in SAC and form a peripheral ring of higher cell density than the center 4–8 h later (Fig. 2b). Once the cells have reached a certain density, seen as a darkening of the annulus, rippling initiates. Rippling persists with constant wavelength and period for several days in SAC, offering long periods for photography. As rippling proceeds, cells slowly migrate outward from the ripples into the round fruiting body aggregates that form at the very edge of the spot in Fig. 2d (arrows). As cell density decreases in the ripples they fade, and the fruiting body aggregates enlarge and darken. The ripples are evident in Fig. 3a as a series of lines that extend from the round nascent fruiting bodies toward the center of the culture. The lines are dark at the edge and become progressively lighter toward the center. Thus SAC provides conditions favorable for quantifying the behavior of cells within ripples.
Figure 2.
Images from a time-lapse series showing a sector of a circular M. xanthus population developing in SAC. (a) At 1 h after deposition of the spot, the edge of the spot of bacteria is sharply defined (arrow). (b) Eight hours after cell deposition, there is an increase in cell density at the edge in the form of an annulus (arrow). (c) At 48 h, ripples have formed in the now broader annulus. The ripples are evident as radial bands. Small nascent aggregates are evident at the very edge. (d) At 75 h, fruiting bodies are mature (arrows). [Bar (c) = 0.4 mm.]
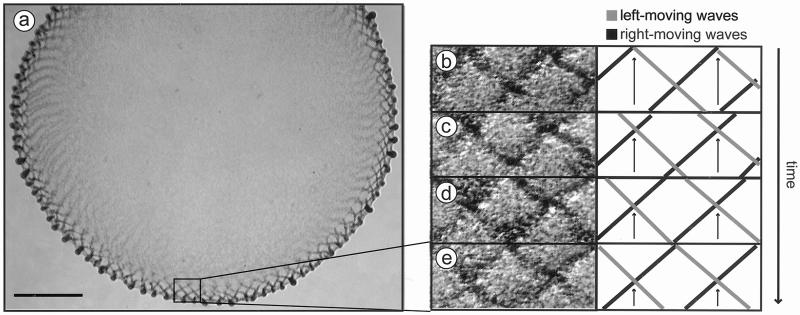
Figure 3.
A field of M. xanthus traveling waves. (a) A phase-contrast image showing most of a rippling population in SAC. Wave crests appear as darker bands. As shown dynamically in Movie 1, crests move in opposite directions around the perimeter of the spot as two sets of opposing waves. (b–e) Crossing patterns of opposing waves are shown in magnified images from a time-lapse series of the boxed area of the spot perimeter (Left), with an interpretive diagram of the crests (Right). The intersection points of opposing ripple crests are indicated by arrows. Each pair of adjacent frames represents a time difference of 180 sec. (Bar = 0.5 mm.)
Ripples have several remarkable properties that distinguish them from D. discoidium waves. First, ripples move in opposite directions around the perimeter of the spot as two sets of opposing waves (see Movie 1, which is published as supporting information on the PNAS web site, www.pnas.org). Each set of waves consists of parallel crests angled toward the perimeter; the opposing set of crests is angled in the complementary direction (Fig. 3). Second, ripples do not spread outward from a selected point. Rather, the entire annulus behaves as one coherent field around which the ripples propagate continuously in both directions (Fig. 3a), and this pattern remains coherent for hours as the ripples move (see Movie 1). D. discoidium waves lead to slug formation. In contrast, myxobacterial cells do not accumulate anywhere within the ripple field despite the incessant movement of the ripples (Fig. 3a). Rather, cells slowly accumulate at the edge of the ripple field in the nascent fruiting body aggregates. Finally, when two countermigrating ripple crests collide, they do not annihilate but appear to interpenetrate one another (Figs. 3a and 4a; see Movie 1). Four sequential stages of ripple crossing are shown in Fig. 3 b–e. Even though the ridges are dense heaps of cells (7), the shape of each ridge emerges unchanged as it leaves an intersection. The preservation of shape suggests that colliding waves are reflecting cell by cell, not interfering (see Movie 2, which is published as supporting information on the PNAS web site).
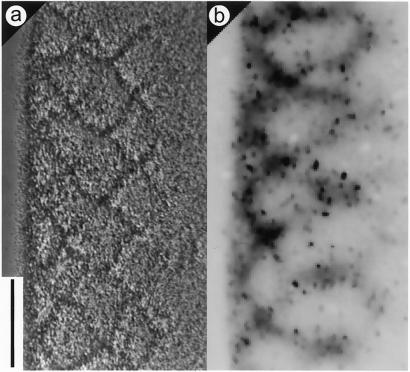
Figure 4.
Tracking of individual M. xanthus cells in a rippling population. (a) Phase-contrast view of a rippling population. (b) Inverse-contrast fluorescent image of the same field. Individual cells are tiny dark spots, and the ripple crests appear as diffuse dark bands because of autofluorescence. The difference in fluorescence intensity between GFP-labeled cells and unlabeled cells is evident. Fluorescent cells were tracked in time-lapse images acquired at 20-sec intervals (Movie 3).
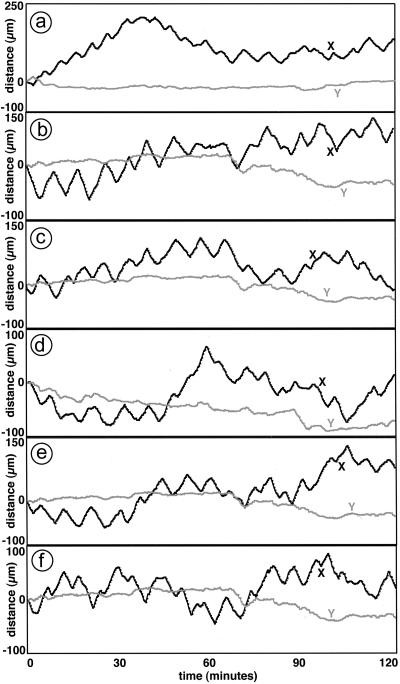
To learn how the ripple pattern is created, individual cells were tracked as they moved within the dense rippling population. DK10547 cells that express GFP were diluted 1/500 into a population of unlabeled cells, and the mixture was allowed to develop in SAC. In epifluorescence mode with a ×20 objective lens, GFP-expressing cells are visible as uniformly fluorescent rods, ≈0.5 μm × 5 μm. The higher-density ripple crests are visible by their autofluorescence as diffuse bands, because M. xanthus cells have carotenoids and other fluorescent pigments (Fig. 4 a and b). The autofluorescence is too weak to show individual cells. By using GFP fluorescence for identification, two qualitative observations were made on Movie 3 (which is published as supporting information on the PNAS web site). First, the labeled cells in a crest moved in the direction of the crest, and second, the cells tended to reverse when the crest collided with an oppositely moving crest. For quantitation, a total of 20 GFP cells were tracked at 20-sec intervals for 2 h in the time-lapse series (see Movie 3). Plots of the trajectories of six cells are shown in Fig. 5 a–f. The x axis is defined as the direction tangent to the edge of the cell spot, the same axis along which the macroscopic ripples move. It is evident from the tracks in Fig. 5 that the cells were displaced many-fold more in the tangential (x) than in the perpendicular (y) direction. Because the long M. xanthus cells move by gliding in the direction of their long axis, this indicates that the cells are predominantly oriented in the x direction. It is likely that the cells became aligned in that direction because of the asymmetry of the cells, when they were initially packed into the annulus by their outward movement (Fig. 2 a and b).
Figure 5.
Paths of individual cells in a rippling population. x and y axes are assigned as tangential and perpendicular, respectively, to the edge of the population perimeter, and consequently x is parallel to the direction of ripple movement. The paths of six cells are plotted as displacement over time along both axes in a–f. (Note: all six cells show net movement in the positive x direction at the end of 2 h, but this is coincidental. Other tracked cells show net movement in the negative x direction at the end of 2 h, and there is no net bias in either direction of the x axis.)
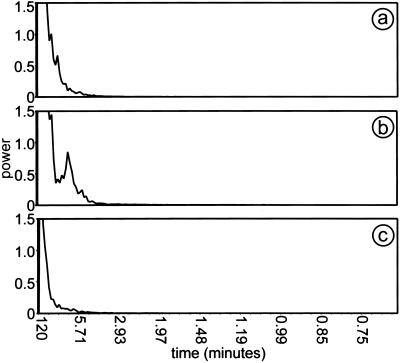
The cell trajectories along the x axis plotted over time in Fig. 5 show rounded sawtooth paths, indicating motion alternately to the left and the right. There is little motion in the y direction. Each trajectory in Fig. 5 is different, showing a stochastic element in the movement. Nevertheless, a regularity in the oscillatory movements in the x direction was revealed by Fourier analysis. The power spectral distribution (PSD) for movement along the rippling x axis has a peak rising above background (Fig. 6b) with a period of 7.5 ± 1 min. Therefore, the cells are not moving randomly on a line. The 7.5-min. peak was reproduced in two experiments and was absent when movement along the y axis was measured (Fig. 6c). In a separate set of experiments and several hours before macroscopic rippling had started, an area within the annulus was photographed in time-lapse photography, and individual GFP cells were tracked to see the behavior of prerippling cells. The 7.5-min peak was also absent from these prerippling cells in either the x (Fig. 6a) or y direction (data not shown). For comparison with the data for individual cells, the wavelength, period, and speed of the macroscopic ripples were measured on magnified images of Movie 3, and the data are summarized in Table 1. The 7.5-min period of individual cell movement in the x direction is not significantly different from the period of macroscopic ripple movement of 8.2 ± 0.6 min.
Figure 6.
PSD plotted against period, obtained by Fourier transformation of the paths of 20 tracked cells in two separate rippling populations. (a) PSD plot of cell paths on the x axis of prerippling cells. (b) PSD plot of cell paths on the x axis of rippling cells show a peak at t = 7.5 min that is not present in the PSD plot of prerippling cells. (c) PSD plot of cell paths on the y axis of rippling cells.
Table 1.
Movement of ripple crests in SAC
| Parameter | Measured value | Sample size |
|---|---|---|
| Speed | 11 ± 0.5 μm/min | n = 76 |
| Wavelength | 91 ± 8 μm | n = 76 |
| Period | 8.2 ± 0.6 min | n = 28 |
The speed of ripples was measured from the time required for a particular crest to move a known distance. Wavelength was measured as the distance between adjacent ripple crests, using their points of intersection with an oppositely moving crest as the mark. The period was measured as the time required for succeeding ripple crests to pass the same point. The data for each measurement were taken from two independent experiments. n represents the number of measurements.
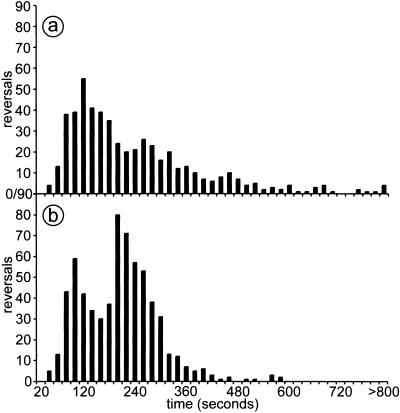
To relate the periodic movement of the population along the x axis to the behavior of individual cells, the time interval between pairs of reversals was measured for each tracked cell. For example, each of the six cells shown in Fig. 5 shows alternating ups and downs in its x trajectory; each up-and-down cycle represents a pair of reversals. The time interval between two reversals for each of those oscillations was measured as described in Materials and Methods, and the interval data are compiled in Fig. 7. For rippling cells (Fig. 7b), the distribution of interval lengths between reversals is asymmetric: it appears to be bounded on the left side of the distribution, with no reversals less than 40 sec. It also appears to be bimodal, with a right mode at 3.8 min, corresponding to one-half cycle and therefore to a full cycle period of 7.6 ± 3 min. The second (Left) modal time interval is at 1.9 min, approximately one-half of the first. Because the distribution is bimodal, reversal is not a random process with a fixed probability of occurrence. Rather it is likely that reversal frequency depends on events extrinsic to the cell. The distribution for prerippling cells is different from rippling cells in several respects (Fig. 7a). A 2-min peak dominates the prerippling distribution. In place of a right peak at 3.8 min, there is a shoulder extending from 3.5 to 6 min with a long tail that extends beyond 13 min. The prerippling distribution had 19 intervals longer than 10 min, but there were no such intervals in the rippling cell distribution. This difference, as well as the 3.8-min peak, distinguishes rippling cells from prerippling cells.
Figure 7.
Histograms showing the distribution of time intervals between cell reversals. A reversal is defined as the point where a cell switches its leading pole. Reversal periods were measured over a period of 2 h for a total of 20 cells each in both rippling and prerippling populations. (a) prerippling; (b) rippling.
Discussion
Several results reported here provide a quantitative basis for the multicellular behavior of rippling cells. The 3.8-min reversal peak (one-half cycle) for individual cells in Fig. 7 is present during rippling but not before it. The 7.5-min peak in the power spectrum (Fig. 6) is present only in rippling cells, and that periodicity is only in the x direction. Both peaks have the same period (within error) as the macroscopic rippling of 8.2 min. Thus macroscopic rippling is temporally correlated with the reversals of individual cells. Moreover, rippling cells tend to be aligned and moving back and forth along the x axis, which is the axis of macroscopic ripple movement. These orderly behaviors—alignment, movement along the x axis, and periodic reversals—provide a cellular mechanism for rippling. What generates the periodic reversals needed for rippling? Other experiments have shown that C-signaling regulates rippling behavior (7, 8, 12). End-to-end collisions could occur between the aligned and counter moving cells that are found in the rippling population. Such collisions would transmit the nondiffusible C signal from one cell to the other, because transmission of C signal has been shown to require movement (10) of aligned cells (13). C signal is a protein product of the csgA gene that is associated with the cell surface. Partially purified protein has been shown to have C signal biological activity (19).
Importantly, null csgA mutants are unable to ripple (7). Moreover, neither fruA (20), frzCD, nor frzE mutants make ripples (12, 20). By contrast, deletion of devT, a C signal-dependent gene, does not block rippling (21), because devT is in the sporulation branch of the C-signaling pathway, as distinct from the branch that controls cell movement. Particular mutations in frzCD change the reversal frequency in growing cells (22), showing that the average time interval between reversals is under genetic control. The genes essential for rippling define the signal transduction pathway from C signal reception to frz gene control of cell reversal (8, 23, 24). Another experiment shows that C signal is key to the propagation of ripples: diluting C signal-proficient cells with C signal-deficient cells that can still respond to the signal increased the ripple wavelength in a regular way. This is as expected, because the frequency of collisions that result in a C signal response from both colliding cells would decrease in proportion to the dilution (12).
These patterns of cell movement and C-signaling were recently used by Igoshin et al., to construct a complete quantitative model of rippling (14), which we call IMO for Igoshin, Mogilner, and Oster. The key features of IMO are: (i) reversal of gliding direction is controlled by a biochemical cycle internal to the cell; (ii) contact-mediated C-signaling induces an increase in cycle phase velocity, thereby increasing reversal probability; (iii) after a reversal, the cell enters a refractory phase of the cycle temporarily insensitive to collision; and (iv) response to C-signaling depends nonlinearly on the local cell density. In light of this model, we suggest that the prominent 7.5-min period of individual cells (Figs. 6 and Fig. 7b) reflects a complete reversal cycle initiated by C-signaling in the high density of a ripple crest. The result of dilution with C signal-deficient cells, described above, is quantitatively predicted by theory (14). Fig. 7 shows a distribution of time intervals between reversals that falls rapidly to zero on the left and has no reversals at less than 40 sec, consistent with a refractory period after a cell has responded to C signal. The peaks observed in the distribution of reversal intervals for rippling and prerippling cells (Fig. 7) are consistent with the model as follows. The faster peak at 2 min is present in both cell types but dominates the prerippling distribution. A 2-min peak in prerippling cells would result from C signal-induced reversals arising from random end-to-end collisions between aligned cells. Its period, which must exceed the cycle refractory period, reflects the average time to accumulate sufficient C signal to trigger reversal. The prerippling population is assumed to have a uniform cell density in the x direction, so that the likelihood of the cell colliding and C-signaling is constant as the cell moves at constant speed in that direction. This condition is reflected in the prerippling distribution of reversal intervals, which lacks a 3.8-min peak and decays from its 2-min peak to a tail that extends beyond 13 min (Fig. 7a).
In the rippling population, according to the assumptions of IMO, a 2-min peak arises from cells that move with a crest and reverse when their cycle has reached the end of its period. A broad peak at 3.8 min is prominent only in the distribution for rippling cells and is broad because it reflects two patterns of movement according to IMO. One pattern is the movement of a cell from one ripple crest that meets a cell in a countermoving crest and reverses after collision, as Sager and Kaiser had proposed (12). Because both cells have been moving at the same average speed; the period is one-half that of two ripples moving in the same direction (which we observed to be 8.2 min). The 3.8-min peak also includes cells from a crest that travel through a trough and reverse when their cycle has completed. These dynamics also explain why two colliding ridges do not annihilate each other. Instead, they partly reflect from each other and partly exchange cells (14). These properties may also explain the absence of net cell transport in a rippling field of bidirectional waves. The ability of the IMO model to produce traveling ridges of cells that appear to pass through each other and to explain the distribution of reversal times shows that the set of behaviors proposed in the model is sufficient to produce the traveling wave pattern. The traveling waves are thus propagated by cell-contact signaling and by cell movement directed by that signaling; the signal need not diffuse.
Rippling may contribute to the spacing pattern of fruiting bodies. Fig. 3a shows that the nascent fruiting bodies are spaced about a ripple wavelength apart around the edge of a submerged agar culture. The two-dimensional IMO model predicts the locations where fruiting bodies are most likely to form (14). Jelsbak and Søgaard-Andersen show that C-signaling also directs another pattern of cell movement, namely cell streaming into nascent fruiting bodies (L. Jelsbak and L. Søgaard-Andersen, personal communication), demonstrating the power of C-signaling to modify cell movement. Streaming behavior follows rippling, because streaming requires a higher level of C-signaling than rippling, and the intensity of C-signaling increases during this period of development (8, 11).
Comparison of the behavior of individual cells with the macroscopic ripples revealed the cell behaviors that underly rippling. These data and other considerations were used by Igoshin et al. (14) to construct a mathematical model, IMO, of rippling. IMO and quantitative data from this study may account for the unusual properties of these traveling waves. IMO shows that the observed cell behaviors, together, are sufficient to generate traveling waves. The waves depend on cell-contact signaling and organized cell movement, not on a diffusible signal.
Supplementary Material
Acknowledgments
We thank Sriram Kosuri and Adam Arkin for invaluable help in the analysis, as well as Michael Laub, Johann Peterson, and Allison Hottes for assistance in data reduction. This investigation was supported by a U.S. Public Health Service grant (GM23441) to D.K. and a Postdoctoral Training Fellowship to R.W., both from the National Institute of General Medical Sciences.
Abbreviations
- SAC
submerged agar culture
- PSD
power spectral distribution
- GFP
green fluorescent protein
- IMO
Igoshin, Mogilner, and Oster
References
- 1.Tomchik K J, Devreotes P N. Science. 1981;212:443–446. doi: 10.1126/science.6259734. [DOI] [PubMed] [Google Scholar]
- 2.Siegert F, Weijer C J. Proc Natl Acad Sci USA. 1992;89:6433–6437. doi: 10.1073/pnas.89.14.6433. [DOI] [PMC free article] [PubMed] [Google Scholar]
- 3.Cagan R L, Ready D F. Dev Biol. 1989;136:346–362. doi: 10.1016/0012-1606(89)90261-3. [DOI] [PubMed] [Google Scholar]
- 4.Butts D A, Feller M B, Shatz C J, Rokhsar D S. J Neurosci. 1999;19:3580–3593. doi: 10.1523/JNEUROSCI.19-09-03580.1999. [DOI] [PMC free article] [PubMed] [Google Scholar]
- 5.Reichenbach H. Ber Deutsch Bot Ges. 1965;78:102–105. [Google Scholar]
- 6.Kroos L, Kaiser D. Genes Dev. 1987;1:840–854. doi: 10.1101/gad.1.8.840. [DOI] [PubMed] [Google Scholar]
- 7.Shimkets L, Kaiser D. J Bacteriol. 1982;152:451–461. doi: 10.1128/jb.152.1.451-461.1982. [DOI] [PMC free article] [PubMed] [Google Scholar]
- 8.Gronewold T M A, Kaiser D. Mol Microbiol. 2001;40:744–756. doi: 10.1046/j.1365-2958.2001.02428.x. [DOI] [PubMed] [Google Scholar]
- 9.Kuspa A, Kroos L R, Kaiser D. Dev Biol. 1986;117:267–276. doi: 10.1016/0012-1606(86)90369-6. [DOI] [PubMed] [Google Scholar]
- 10.Kroos L, Hartzell P, Stephens K, Kaiser D. Genes Dev. 1988;2:1677–1685. doi: 10.1101/gad.2.12a.1677. [DOI] [PubMed] [Google Scholar]
- 11.Li S, Lee B U, Shimkets L. Genes Dev. 1992;6:401–410. doi: 10.1101/gad.6.3.401. [DOI] [PubMed] [Google Scholar]
- 12.Sager B, Kaiser D. Genes Dev. 1994;8:2793–2804. doi: 10.1101/gad.8.23.2793. [DOI] [PubMed] [Google Scholar]
- 13.Kim S K, Kaiser D. Science. 1990;249:926–928. doi: 10.1126/science.2118274. [DOI] [PubMed] [Google Scholar]
- 14.Igoshin O A, Mogilner A, Welch R D, Kaiser D, Oster G. Proc Natl Acad Sci USA. 2001;98:14913–14918. doi: 10.1073/pnas.221579598. [DOI] [PMC free article] [PubMed] [Google Scholar]
- 15.Kaiser D. Proc Natl Acad Sci USA. 1979;76:5952–5956. doi: 10.1073/pnas.76.11.5952. [DOI] [PMC free article] [PubMed] [Google Scholar]
- 16.Wu S S, Kaiser D. J Bacteriol. 1997;179:7748–7758. doi: 10.1128/jb.179.24.7748-7758.1997. [DOI] [PMC free article] [PubMed] [Google Scholar]
- 17.Kuhlwein H, Reichenbach H. In: Schwarmentwicklung und Morphogenese bei Myxobakterien. Wolf G, editor. Göttingen, Germany: Inst. Wissenschaftliche Film; 1968. , C893/1965 Vol 2A, pp. 335–359. [Google Scholar]
- 18.Hodgkin J, Kaiser D. Mol Gen Genet. 1979;171:167–176. [Google Scholar]
- 19.Kim S K, Kaiser D. Proc Natl Acad Sci USA. 1990;87:3635–3639. doi: 10.1073/pnas.87.10.3635. [DOI] [PMC free article] [PubMed] [Google Scholar]
- 20.Søgaard-Andersen L, Slack F, Kimsey H, Kaiser D. Genes Dev. 1996;10:740–754. doi: 10.1101/gad.10.6.740. [DOI] [PubMed] [Google Scholar]
- 21.Boysen, A., Ellehauge, E., Julien, B. & Søgaard-Andersen, L. (2001) J. Bacteriol., in press.
- 22.Blackhart B D, Zusman D. Proc Natl Acad Sci USA. 1985;82:8767–8770. doi: 10.1073/pnas.82.24.8767. [DOI] [PMC free article] [PubMed] [Google Scholar]
- 23.Julien B, Kaiser A D, Garza A. Proc Natl Acad Sci USA. 2000;97:9098–9103. doi: 10.1073/pnas.97.16.9098. [DOI] [PMC free article] [PubMed] [Google Scholar]
- 24.Ellehauge E, Norregaard-Madsen M, Søgaard-Andersen L. Mol Microbiol. 1998;30:807–881. doi: 10.1046/j.1365-2958.1998.01113.x. [DOI] [PubMed] [Google Scholar]
Associated Data
This section collects any data citations, data availability statements, or supplementary materials included in this article.


