Abstract
Objectives
Latex from Hevea brasiliensis (natural rubber tree primarily cultivated for its rubber particles) has no known primary metabolic function, although its biological role is as a plant defence system. The present study has evaluated specific anti‐proliferative effects of latex whole C‐serum and its subfractions, on human cancer cell lines.
Materials and methods
Cell viability assay using MTT, DNA fragmentation assay and real‐time PCR were used to evaluate the cytotoxic effects of latex whole C‐serum and its subfractions on the cell lines.
Results
MTT assay revealed very low LC 50 values, 2.0 and 280 ng/ml, for DCS and DCP treatments, respectively. DCS was proven to be more potent compared to DCP, in conferring specific anti‐proliferative effects on the cancer cell lines. The study also indicated that anti‐proliferative activity of pre‐heated C‐serum fractions diminished significantly.
Conclusion
Although noteworthy cell death was reported, DNA fragmentation assay and real‐time PCR confirmed that that induced by latex C‐serum subfractions was not promoted via the classical apoptotic signalling pathway.
Introduction
Hevea brasiliensis the Pará rubber tree (Euphorbiaceae), is primarily cultivated for use of rubber particles contained in its latex. This latter is a milky white, sticky, emulsion that exudes from the plant upon damage, from specialized canals of articulating laticiferous cells 1, 2. Hevea brasiliensis also has many other valuable constituents such as proteins, lipids, quebrachitol, ribonucleic acids and organic salts (in relatively small amounts), consistent with its cytoplasmic nature 3, 4, 5, 6, 7. For use in research purposes, latex is usually separated into three fractions, consisting of the rubber cream, centrifuged serum (C‐serum) and bottom fraction, after high‐speed centrifugation. The bottom fraction mainly contains vacuole‐like organelles known as lutoid bodies, and fluid released from ruptured lutoid bodies is known as B‐serum. Latex B‐ and C‐sera are known to be rich sources of proteins, nucleic acids and also a multitude of further organic compounds 8. However, the primary metabolic functions of these are poorly understood.
Latex has been strongly implicated in the plant's defence against herbivorous insects 2 as it possesses plant defence proteins known to be allergenic proteins to humans 9. Reports on anti‐bacterial and anti‐fungal activities displayed by latex B‐serum and C‐serum have been described, but with contradicting view points, from different research groups. Contradictions amongst anti‐fungal activities have been explained in more recent findings from our group, in which previous contradictory observations were supposed to be due to membrane constitutions of the fungi, evidenced from anti‐Candida albicans activity 10 and anti‐Aspergillus niger activity 11, exerted by B‐serum and C‐serum respectively, although the effective component(s) from the latter had remained unidentified.
Only limited research has been conducted to elucidate any medicinal properties of H. brasiliensis, for example it has been reported that hydroxynitrile lyase from its leaves could be employed to synthesize active cyanohydrins for use in pharmaceuticals 7. Potential therapeutic application of H. brasiliensis latex sera for cancer was first suggested when the subfraction of latex C‐serum was shown to exert specific anti‐proliferative properties against cell lines of malignant origin 12. This is encouraging as rubber latex serum is a relatively low‐cost resource vis‐à‐vis its potential use as an anti‐cancer therapeutic, due to simplicity of latex preparation and its abundance in rubber‐producing regions.
In the present study, latex C‐serum obtained from high‐speed centrifugation and its dialysed and pre‐heated subfractions, were studied for their anti‐proliferation properties on cell lines originating from human cancers – hepatocellular adenocarcinoma (HepG2) and colorectal adenocarcinoma (HCT116). Such a study has not previously been conducted. It was shown that latex C‐serum was specific to the liver cancer line, with LC50 valued at 888 ng/ml. Interestingly, cell death shown by the assay was not apoptosis, suggesting that further studies need to be conducted to determine the cell death pathway triggered here by latex C‐serum and its subfractions.
Materials and methods
Preparation of latex C‐serum and its subfractions
Latex was collected from field‐grown RRIM 600 trees at the Rubber Research Institute of Malaysia Research Station, Sungai Buloh. To prepare latex C‐serum, fresh latex collected in chilled flasks was fractionated by centrifugation at 44 000 g at 4 °C. Latex separates into three distinct parts on high‐speed centrifugation 13. The upper layer (rubber cream), consisting of rubber particles, was carefully removed and latex C‐serum was prepared from the remaining supernatant, based on a method previously described 14. Whole C‐serum (WC) was then lyophilized for subsequent use. Lyophilized powder of latex C‐serum was reconstituted with 1× phosphate‐buffered saline (PBS; AMRESCO, Solon, OH, USA). Serial dilutions of serum were performed to prepare working concentrations ranging from 2 to 2000 μg/ml. Subfractions of latex C‐serum were prepared by dialysis and by heat treatment.
Subfractions of latex C‐serum were prepared by dialysis using SnakeSkin™ (Pierce, Rockford, IL, USA) tubing with molecular weight cut‐off 3000 Da, against distilled water, for 48 h at ~5 °C. Whitish precipitate was recovered by centrifugation at 20 000 g for 30 min and precipitate (DCP) and supernatant (DCS) were then lyophilized and stored desiccated until further use. Similar centrifugation and lyophilization procedures were employed to obtain boiled C‐serum fractions. WC was placed in a boiling water bath for 10 min, followed by centrifugation to yield pellet (BCP) and supernatant (BCS) subfractions, and lyophilized. Working solutions for dialysed and boiled fractions were prepared as described for WC.
Cell culture
Cell line Hs27 – of human foreskin fibroblasts, that is, not of malignant origin (CRL‐1634), hepatocellular adenocarcinoma and colorectal adenocarcinoma cell lines HepG2 (CRL‐11997) and HCT116 (CCL‐247) respectively, were purchased from the American Type Culture Collection (Rockville, MD, USA). Cells were cultured in Dulbecco's modified Eagle's medium (DMEM) (Gibco®; Invitrogen, Carlsbad, CA, USA) supplemented with foetal calf serum (10% v/v), penicillin (100 units/ml), streptomycin (100 μg/ml) and amphotericin B (0.025 μg/ml) (Gibco®; Invitrogen); Hs27 cells were supplemented with additional 4.5 g/l glucose. Cultures were maintained at 37 °C in a water‐saturated atmosphere containing 5% CO2. Cell counts were performed using a Neubauer haemocytometer under light microscope and living cells were identified by Trypan blue (Gibco®; Invitrogen) staining method. Approximately 2500 cells were seeded in each well of a 96‐well culture plate and were starved in DMEM under cell culture incubation conditions for 48 h prior to cell‐based assay.
Measurement of cell proliferation inhibition
Cytotoxic effects were measured using standard 3‐(4,5‐dimethylthiazol‐2‐yl)2,5‐diphenyl tetrazolium bromide (MTT) assay (Sigma Chemical Company, St. Louis, MO, USA) after cell treatment with latex C‐serum or subfractions of latex C‐serum, for a range of time periods, 24, 48 and 72 h; the assay was developed based on the method described by Mossman 15. Two thousand five hundred cells were seeded into 96‐well plates and cultured in a CO2 incubator at 37 °C. After 48 h, cells were treated with serially‐diluted concentrations of WC, DCS and DCP, and kept again in the CO2 incubator at 37 °C. Cell morphology was observed using reverse phase‐contrast microscopy (ApoTome; Carl Zeiss MicroImaging GmbH, Jena, Germany). Absorbance at 570 nm was read using a spectrophotometric plate reader (Multiskan spectrum; Thermo Electron Co., Waltham, MA, USA) and proportions of surviving cells were calculated as:
Dose–response curves were constructed using Probit analysis 16 to obtain LC50 and LC80 values. All experimental data were derived from at least three independent experiments.
DNA fragmentation assay
Approximately 1 × 10⁴ cells/well in 24‐well plates with concentration 0, LC50 and LC80 of WC, DCS and DCP, were incubated for decided periods of time. Trypsinized cells were rinsed in ice‐cold PBS and lysed in digestion buffer containing 100 mm sodium chloride (NaCl), 10 mm Tris–Cl, pH 8.0, 25 mm ethylenediaminetetraacetic acid (EDTA), 0.5% sodium dodecyl sulphate (SDS); then proteinase K (0.1 mg/ml) was added and further incubation at 50 °C overnight was performed. DNA was extracted using phenol/chloroform/isoamyl alcohol (1:1:1) into the aqueous phase and precipitated with 3 m sodium acetate (pH 5.2) and 100% ethanol. The DNA sample was dissolved in PCR grade water (Promega; Madison, WI, USA). After being mixed with 6X loading buffer (0.025% bromophenol blue, 0.025% xylenen cyanole, 30% glycerol), DNA was separated by 1.5% agarose gel electrophoresis and visualized using ethidium bromide staining (10 μg/ml). Intensity of bands was recorded using a FluorChem® FC2 Imaging System (Alpha Innotech Corporation, San Leandro, CA, USA).
Real‐time quantitative RT‐PCR analysis
Expression levels of Bax and Bcl‐2 mRNA were analysed using the real‐time quantitative reverse transcription‐polymerase chain reaction (qPCR) technique. Experimental cells were treated with concentrations 0 and LC50 of WC, DCS and DCP. Cells were then harvested at 48 h and total RNA was isolated using TriPure Isolation Reagent according to the manufacturer's instructions (Roche Diagnostics, Mannheim, Germany). Integrity and purity of RNA were spectrophotometrically verified by optical density (OD) absorption ratio OD 260 nm/OD 280 nm. Complementary DNA (cDNA) was synthesized with 1 μg total RNA using Transcriptor First Strand cDNA Synthesis Kit according to the manufacturer's instructions (Roche Diagnostics). The reaction was performed at 25 °C for 10 min, followed by 50 °C for 60 min, heated to 95 °C for 5 min and chilled at 4 °C using a MyCycler Thermal Cycler System (Bio‐Rad Laboratories, Hercules, CA, USA). cDNA stock was maintained at 20 ng/μl concentration and −20 °C until use.
Primer sequences for detecting gene expression of Bax, Bcl‐2, and caspase 3 by real‐time PCR were designed and synthesized by Primer Design Ltd. (Hampshire, UK). Primer sequence for GADPH gene was designed using Primer 3 Input (version 0.4.0), and was sent to be synthesized by 1st BASE Pte. Ltd. (Singapore).
Quantification of gene expression was performed using an ABI Prism 7700 Sequence Detector (Perkin‐Elmer Applied Biosystems, Foster, CA, USA). PCR solution (20 μl) was composed of 1X FastStart Universal SYBR Green Master (ROX) (Roche Diagnostics) containing 2.5 μl cDNA sample of treated and untreated samples and 0.3 μm of each primer (Table 1). Thermal cycle parameters were the following: 1 at 95 °C for 10 min followed by 40 cycles at 95 °C for 15 s, 60 °C for 30 s. In addition, real‐time reaction of the products was checked by melting point analysis, after each reaction. Standard curves for Bax, Bcl‐2, caspase 3 and GADPH were generated using serial dilution of cDNA derived from the cell lines. GADPH was monitored as reference gene and Bcl‐2, Bax and caspase 3 expression levels were normalized with respect to GADPH transcript and calculated by the 2−ΔΔCt method 17. A two‐sided P‐value lower than 0.05 was considered to be statistically significant.
Table 1.
Primer sequences in real‐time quantitative RT‐PCR
| Genes | Primer sequences | PCR product size (bp) |
|---|---|---|
| Bax |
Forward: 5′‐ATG GAG CTG CAG AGG ATG AT‐3′ Reverse: 5′‐CAG TTG AAG TTG CCG TCA GA‐3′ |
101 |
| Bcl‐2 |
Forward: 5′‐GAG GTC ACG GGG GCT AAT T‐3′ Reverse: 5′‐GAG GCT GGG CAC ATT TAC TG‐3′ |
88 |
| Caspase3 |
Forward: 5′‐TGT AGA AAT GAT GAT GTG GAA GAA C‐3′ Reverse: 5′‐GCA GTT AAG TCA TCC GTG TAT ATC‐3′ |
98 |
| GADPH |
Forward: 5′‐GAG TCA ACG GAT TTG GTC GT‐3′ Reverse: 5′‐TTG ATT TTG GAG GGA TCT CG‐3′ |
234 |
Statistical analysis
Data are presented as mean ± SEM of triplicate determinations, except when results of plots are shown, in which case, a representative experiment is depicted in each figure. Comparisons between multiple groups were performed using one‐way ANOVA with Tukey and Duncan corrections. Statistical significance was indicated when P < 0.05.
Results
HepG2 cell line, but not HCT116, exhibited susceptibility to latex whole‐C
Cell‐based MTT assay with various concentrations of latex whole C‐serum (WC) showed that proliferation of Hs27 (normal foreskin fibroblasts) and HCT116 (colorectal cancer cells) were not affected, whereas hepatocellular adenocarcinoma cells HepG2, were inhibited within the test concentration range (0–1 μg/ml), as shown in Fig. 1. This was particularly evident by 48 h post‐treatment.
Figure 1.
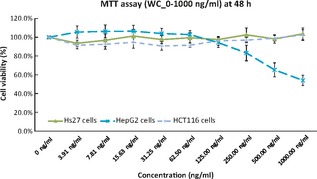
Cell viability assay of Hs27, HCT116 and HepG2 cells treated with WC up to concentration of 1000 ng/ml at 48 h post‐treatment.
Anti‐proliferative properties of DCS and DCP subfractions were specific to HepG2 cells
Cell‐based MTT assay with the determined concentrations of latex C‐serum subfractions DCS and DCP showed that proliferation of Hs27 cells and HCT116 cells were not affected, whereas HepG2 cells were inhibited within the test concentration range (0–1 μg/ml), as shown in Fig. 2. Although the HCT116 and HepG2 cell lines are both of malignant origin, both showed a significant degree of difference in viability at all time points tested. Figure 2 indicates MTT assay results at 48 h post‐treatment with DCS or DCP subfractions. It was observed that viability of HepG2 cells was significantly lower compared to that of non‐malignant Hs27 cells and HCT116 colorectal adenocarcinoma cells, indicating specificity of the subfractions in proliferative activity on one specific cancer‐originating cell line.
Figure 2.
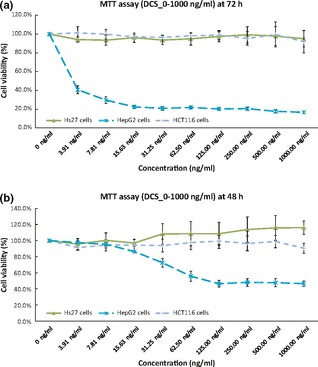
Significant cell viability reduction in HepG2 cells at 48 h post‐treatment with DCS or DCP. Mean difference – significant at P < 0.05 level.
HepG2 cells were more susceptible to DCS than WC and DCP subfractions
Among latex C‐serum subfractions WC, DCS and DCP, HepG2 cells were most susceptible to DCS treatment. LC50 and LC80 calculated using Probit analysis of DCS and DCP for MDA‐MB231 and MCF‐7 at different time points post‐treatment are shown in Table 2.
Table 2.
Probit analysis results showing the LD 50 and LD 80 at various time points post‐treatment with DCS and DCP for HepG2 and HCT 116, with 95% confidence level
| WC | DCS | DCP | ||||||||
|---|---|---|---|---|---|---|---|---|---|---|
| 24 h | 48 h | 72 h | 24 h | 48 h | 72 h | 24 h | 48 h | 72 h | ||
| HepG2 | LC50 | N/A | 888.6 ng/ml | 818.1 ng/ml | 2.4 μg/ml | 2.0 ng/ml | 0.06 ng/ml | N/A | 280 ng/ml | 42.3 ng/ml |
| LC80 | N/A | 3.2 μg/ml | 5.7 μg/ml | 42.3 μg/ml | 79.6 μg/ml | 174 ng/ml | N/A | 3.5 μg/ml | 362.3 ng/ml | |
| HCT116 | LC50 | N/A | N/A | N/A | N/A | 64.6 μg/ml | 120.5 μg/ml | N/A | N/A | N/A |
| LC80 | N/A | N/A | N/A | N/A | 1.8 mg/ml | N/A | N/A | N/A | N/A | |
N/A denotes that the value was too high and therefore not included.
It was evident that LC50 and LC80 of DCS for HepG2s were consistently lower than those after DCP treatment, specially at 72 h. This indicates higher potency residing in the DCS subfraction. Also, susceptibility towards subfractions followed distinctive patterns, which were more pronounced at 72 h post‐treatment, as shown in Fig. 3.
Figure 3.
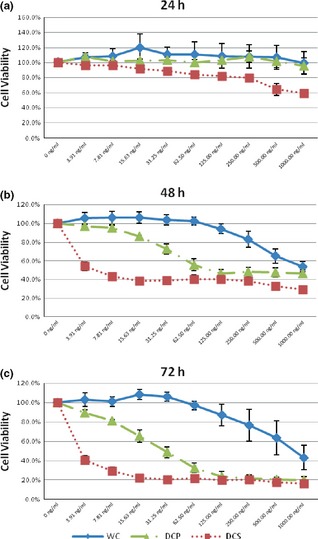
Cell viability comparison for HepG2 cells tested with different latex C‐serum fractions such as WC, DCS and DCP, at different time points.
Anti‐proliferation agents in C‐serum subfractions were sensitive to heat treatment
No significant anti‐proliferative activity was observed when Hs27, HCT116 and HepG2 cells were treated with heat‐treated latex C‐serum subfractions BCP and BCS. Figure 4 clearly illustrates no significant reduction in cell viability across the concentrations of heat‐treated latex C‐serum subfractions on Hs27, HCT116 or HepG2 at 72 h post‐treatment, with the respective subfractions.
Figure 4.

BCP and BCS showing no significant effect on cell population growth of Hs27, HCT116 and HepG2 cells.
DNA laddering was not observed in extracted DNA from WC‐, DCS‐ and DCP‐treated HepG2 cells
Total genomic DNA extracted from serum subfraction‐treated cells and from non‐treated cells was subjected to agarose gel electrophoresis. Results show total genomic DNA smeared on gels, but no DNA laddering was observed (Fig. 5). This is normally observed when dead cells have undergone apoptosis.
Figure 5.
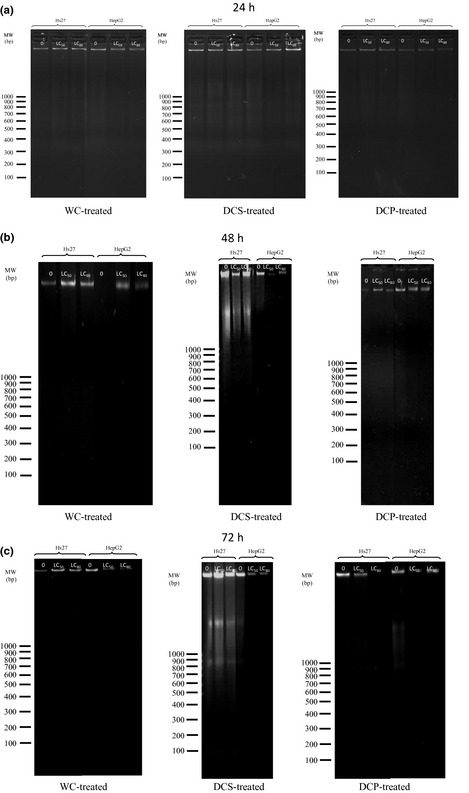
DNA extracted from WC‐, DCS‐ and DCP‐treated HepG2 cells at 24‐, 48‐ and 72 h post‐treatment with subfractions, respectively.
Expression Bcl‐2/Bax ratio increased in HepG2 cells
Real‐time quantitative RT‐PCR analysis demonstrated that WC‐, DCS‐ and DCP‐treated HepG2 cells had high expression of Bcl‐2 but relatively no significant change in Bax and caspase 3 expressions (data not shown). For Hs27 and HCT116 cells, expression levels of Bcl‐2, Bax and caspase 3 all remained unchanged (data not shown). Figure 6 shows increase in relative ratios, in fold changes of expression, between Bcl‐2 and Bax as well as that between Bcl‐2 and caspase 3 when WC‐, DCS‐ and DCP‐treated HepG2 cells were considered.
Figure 6.

Expression ratio of Bcl‐2/Bax and that of Bcl‐2/caspase‐3 in Hs27, HCT116 and HepG2 cells after being treated with WC, DCS and DCP for 48 h.
Discussion
In the current study, HepG2 cells were influenced by whole latex C‐serum (WC) at 48 h, whereas this susceptibility was not observed in colorectal adenocarcinoma cell line, HCT116, or in the human foreskin fibroblast cell line, Hs27, within the tested concentration range (0–1 μg/ml). Susceptibility of Hs27 and HCT116 cells to DCS and DCP subfractions was not observed in subsequent cell viability assays, indicating that inactivity of C‐serum against these cell lines was not due to presence of inhibitory molecule(s) separable with subfractionation according to the molecular weight.
However, LC50 value for these subfractions on HepG2 cells was significantly reduced to 2.0 ng/ml for DCS and 280 ng/ml for DCP compared to 888 ng/ml exerted by WC (before subfractionation), suggesting that subfractionation had at least partially separated the effective factor(s) responsible for HepG2 cells' response to subfractions (specially in DCS), where these factors might be enriched. LC50 values obtained were far lower than the suggested 30 μg/ml benchmarked by the National Cancer Institute (NCI) for crude fractions in natural products 18, 19. With specificity of the subfractions to hepatocellular carcinoma cells, these subfractions were hence shown to be candidates with high potential for use in anti‐cancer agent development.
It has been shown that only 10–20% of hepatocellular carcinomas can be removed completely under surgery 20, 21. If latex C‐serum could be used to specifically target malignant cells in the liver, population growth of the primary cancer cells might eventually be suppressed and eliminated after surgical intervention, or even without surgery, hence providing a higher chance of recovery of healthy hepatocytes. Cell‐specificity displayed by latex C‐serum subfractions affirms that it has substantial potential to be developed as an anti‐hepatocellular carcinoma agent. This may also reduce chances for metastasis, which is often associated with age and disease stage of the patient. Actions of DCS and DCP have been shown to be prolonged with time, as numbers of living cells decreased with time of exposure to them, without need for increase in any fresh dose of the subfractions (Table 2). This non‐linear proportional relationship between dosage and cell death might imply that a minimal effective dose would suffice in eliminating tumour cells, despite size and mass of the tumour. This would reduce undesirable side effects due to application of active subfractions. An active subfraction is highly suspected to target malignant cells via amplification/cascade effect. Alternatively, active compound(s) in subfractions might act as catalysts to promote cell death. For this, latex C‐serum would be a good candidate in adjuvant therapy for anti‐cancer treatment in future.
The HepG2 cell line is often used as a model system for liver metabolism and toxicity studies, as well as for understanding hepatocarcinogenesis and drug‐targeting studies. HepG2 cells have been reported to possess similar cytochrome P450 enzymes and enzymatic derivatives with good correlation to normal hepatocytes 22. Cytochromes P450 (CYP) normally catalyses alcohol, tobacco and chemical carcinogens. Herbal drug interactions could lead to a change in drug efficacy or toxicity 23. Often, a certain compound or drug may prove to be cytotoxic towards cancer cells in vitro, to not pass clinical trials due to contradicting in vivo results or to have dangerous side effects. This is because naturally occurring CYP enzymes could render a drug or cytotoxic compound less efficient (non‐cytotoxic), or increase the toxicity (more cytotoxic) of the compound, which in turn raises safety issues of a compound 24, 25.
Hence, CYP expression level in HepG2 cells could have further activated active components present in a DCS fraction, killing cells at concentrations as low as 2.0 ng/ml by 48 h post‐treatment. This ‘amplification of drug’ effect is similar to that of Tamoxifen, a pro‐drug normally used for treatment of both early and of advanced oestrogen receptor positive (ER+) breast cancers. The drug needs to be metabolized in liver by cytochrome P450 isoforms CYP2D6 and CYP3A4, into active metabolites 26, 27. Active metabolites, 4‐hydroxytamoxifen and N‐desmethyl‐4‐hydroxytamoxifen (endoxifen), then possess 30–100 times higher affinity to oestrogen receptors than tamoxifen itself. If this is true, studies on active component(s)' efficacy and identification of CYP enzyme(s) involved, are essential in understanding mechanisms of relevant signalling pathways which lead to specific cancer cell death, using latex C‐serum subfractions.
Among the three fractions used in this study, active components in DCS had higher potency, particularly obvious as indicated in Fig. 7. This might due to the dialysis method employed on latex C‐serum during the fractionation process. Dialysis might have separated or removed possible small interfering molecules that could act as inhibitors to active component(s) from exerting anti‐proliferative activity. Once inhibitors were removed, active components would be able to exhibit anti‐proliferative activity in DCS and DCP. As both DCS and DCP exert slightly different anti‐proliferative patterns (Fig. 2), there could be at least two different active components present in these substances. Further subfractionation will have to be conducted in the future to obtain a more enriched active subfraction that may be used to compare its efficacy with that of known anti‐cancer agents.
Figure 7.
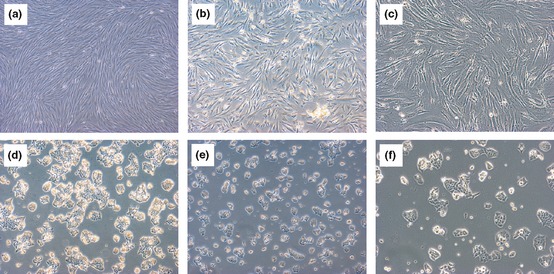
Morphological assessment of (a) Hs27 cells untreated, (b) Hs27 cells treated with DCS, (c) Hs27 cells treated with DCS (100×), (d) HCT116 cells untreated, (e) HCT116 cells treated with DCS and (f) HCT116 cells treated with DCS (100×), at 48 h post‐treatment.
Anti‐proliferative activity was not observed in experiments using heat‐treated BCP and BCS subfractions, suggesting that the active substances in latex C‐serum are heat‐sensitive. Figure 8 clearly illustrates no significant reduction in cell viability across concentrations of these heat‐treated latex C‐serum subfractions on Hs27, HCT 116 and HepG2 at 72 h post‐treatment, with the respective subfractions. Heat might have promoted chemical reactions modifying initial properties of active components, otherwise, active components might have been denatured during the heating process, such as (in the case of proteins) rendering loss form them of initial properties.
Figure 8.
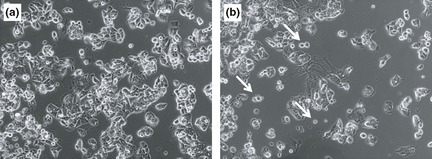
Cell morphology of (a) untreated HepG2 cells and (b) DCS‐treated HepG2 cells. White arrows indicate dying cells floating in suspension. Magnification, 100×.
DNA fragmentation assay was performed to determine whether apoptotic cell death had played a role in HepG2 cell susceptibility to latex C‐serum and its subfractions. Typical formation of DNA ladders due to internucleosomal hydrolysis of genomic DNA, was not observed, although cells were treated for up to 72 h with the subfractions (Fig. 3). Further real‐time PCR evaluation revealed that pro‐apoptotic genes such as Bax and caspase‐3, were not upregulated in latex C‐serum‐treated cells. Instead, expression of Bcl‐2 gene remained highly expressed, although viability of HepG2 cells was compromised at 48 and 72 h.
Bcl‐2/Bax expression ratio and Bcl‐2/casp3 expression ratios in WC‐, DCS‐ and DCP‐treated HepG2 cells remained high compared to those in WC‐, DCS‐ and DCP‐treated Hs27 and HCT116 cells (Fig. 6). Ratios from these latter were not significantly different nor elevated between themselves. As Bcl‐2 gene is associated with protecting a cell from apoptosis, its high ratios in treated HepG2 cells clearly showed that susceptibility of the cells to latex C‐serum treatment was not due to apoptotic programmed cell death, the observation correlated with that of the DNA fragmentation assay. Low expression level of Bax and caspase‐3 genes indicates that Bax, a pro‐apoptotic gene, and caspase‐3, responsible for the caspase cascade in apoptosis, were not activated during WC‐, DCS‐ or DCP‐treatment in HepG2 cells. However, morphology of the cells clearly indicated that their viability was affected (Fig. 8), whereas viability of Hs27 and HCT116 cells was not significantly affected, even though these latter cell lines were treated with LC50 concentrations of the related subfractions (Fig. 7). This might be due to high expression levels of Bcl‐2 that exerts inhibitory effects in cell death promotion.
In conclusion, DNA fragmentation and real‐time PCR analysis strongly support that anti‐proliferative effects induced by latex C‐serum subfractions is not promoted via the classical apoptosis death signalling pathway. Instead, active cell‐specific compound(s) in DCS and DCP could have triggered a phenomenon similar to an amplification drug effect in HepG2 cells and not in non‐cancer‐originating cells. Further investigations are being carried out to determine the cell death effects exerted by latex C‐serum subfractions.
Acknowledgements
This work was supported by the Malaysian Rubber Board and Universiti Sains Malaysia (USM Incentive Grant 1001/CIPPM/822111). K. L. Lam and K. L.Yang are recipients of the Fellowship and Postgraduate Research University Research Grant (grant number 1001/CIPPM/843075 and 1001/CDADAH/843073 for Lam and Yang respectively) from Universiti Sains Malaysia.
References
- 1. Kekwick R (2001) Latex and Laticifers. Encyclopedia of Life Sciences. Nature Publishing Group, 1–6. [Google Scholar]
- 2. Agrawal A, Konno K (2009) Latex: a model for understanding mechanisms, ecology, and evolution of plant defense against herbivory. Annu. Rev. Ecol. Evol. Syst. 40, 311–331. [Google Scholar]
- 3. Bealing FJ (1981) Quebrachitol synthesis in Hevea brasiliensis . J. Rubb. Res. Inst. Malaysia 29, 111–112. [Google Scholar]
- 4. Burton GW, Webb A, Ingold KU (1985) A mild, rapid and efficient method of lipid extraction for use in determining vitamin E/lipid ratios. Lipids 20, 29–39. [DOI] [PubMed] [Google Scholar]
- 5. Chow CK, Draper HH (1970) Isolation of gamma‐tocotrienol dimers from Hevea latex. Biochemistry 9, 445–450. [DOI] [PubMed] [Google Scholar]
- 6. Das G, Alam B, Raj S, Dey SK, Sethuraj MR, Senmandi S (2002) Over‐exploitation associated changes in free radicals and its scavengers in Hevea brasiliensis . J. Rubb. Res. 5, 28–40. [Google Scholar]
- 7. Wajant H, Forster S (1996) Purification and characterization of hydroxynitrile lyase from Hevea brasiliensis . Plant Sci. 115, 25–31. [Google Scholar]
- 8. Archer BL, Audley BG, McSweeney GP, Tan CH (1969) Studies on composition of latex serum and ‘bottom fraction’ particles. J. Rubb. Res. Inst. Malaya 21, 560–569. [Google Scholar]
- 9. Yeang HY, Siti Arija MA, Faridah Y, Sunderasan E (2002) Allergenic proteins of natural rubber latex. Methods 27, 32–45. [DOI] [PubMed] [Google Scholar]
- 10. Daruliza KMA, Yang KL, Lam KL, Priscilla JT, Sunderasan E, Ong MT (2011) Anti‐Candida albicans activity and brine shrimp lethality test of Hevea brasiliensis latex B‐serum. Eur. Rev. Med. Pharmacol. Sci. 15, 1163–1171. [PubMed] [Google Scholar]
- 11. Daruliza KMA, Lam KL, Yang KL, Priscilla JT, Sunderasan E, Ong MT (2011) Anti‐fungal effect of Hevea brasiliensis latex C‐serum on Aspergillus niger . Eur. Rev. Med. Pharmacol. Sci. 15, 1027–1033. [PubMed] [Google Scholar]
- 12. Ong MT, Yang KL, Lam KL, Ong GA, Sunderasan E (2009) Susceptibility of HeLa (cancer‐origin) cells to a sub‐fraction of latex B serum. J. Rubb. Res. 12, 117–124. [Google Scholar]
- 13. Moir GFJ (1959) Ultracentrifugation and staining of Hevea latex. Nature 184, 1626. [Google Scholar]
- 14. Hsia RCH (1958) Oxygen absorption by Hevea brasiliensis latex. Trans. Instn. Rubb. Ind. 34, 267–290. [Google Scholar]
- 15. Mossman T (1983) Rapid colorimetric assay for cellular growth and survival: application to proliferation and cytotoxicity assays. J. Immunol. Methods 65, 55–63. [DOI] [PubMed] [Google Scholar]
- 16. Finney DJ (1962) Probit Analysis. Cambridge: University Press. [Google Scholar]
- 17. Livak KJ, Schmittgen TD (2001) Analysis of relative gene expression data using real‐time quantitative PCR and the 2−ΔΔCT method. Methods 25, 402–408. [DOI] [PubMed] [Google Scholar]
- 18. Suffness M, Pezzuto JM (1990) Assays related to cancer drug discovery In: Hostettmenn K, ed.Methods in Plant Biochemistry: Assays for Bioactivity, Vol. 6, pp. 71–133. London: Academic Press. [Google Scholar]
- 19. Mothana RA, Lindequist U, Gruenert R, Bednarski PJ (2009) Studies of the in vitro anticancer, antimicrobial and antioxidant potentials of selected Yemeni medicinal plants from the island Soqotra. BMC Complement. Altern. Med. 9, 7. [DOI] [PMC free article] [PubMed] [Google Scholar]
- 20. Bosch FX, Ribes J, Díaz M, Cléries R (2004) Primary liver cancer: worldwide incidence and trends. Gastroenterology 127(5, Suppl. 1) S5–S16. [DOI] [PubMed] [Google Scholar]
- 21. Shao W, Sui C, Liu Z, Yang J, Zhou Y (2011) Surgical outcome of hepatocellular carcinoma patients with biliary tumor thrombi. World J. Surg. Oncol. 9, 2. [DOI] [PMC free article] [PubMed] [Google Scholar]
- 22. Westerink WM, Schoonen WG (2007) Cytochrome P450 enzyme levels in HepG2 cells and cryopreserved primary human hepatocytes and their induction in HepG2 cells. Toxicol. In Vitro 21, 1581–1591. [DOI] [PubMed] [Google Scholar]
- 23. Abas HH (2001) Adverse effects of herbs and drug‐herbal interactions. Malays. J. Pharm. 1, 39–44. [Google Scholar]
- 24. McFadyen MCE, Melvin WT, Murray GI (2004) Cytochrome P450 enzymes: novel options for cancer. Mol. Cancer Ther. 3, 363–371. [PubMed] [Google Scholar]
- 25. Rodriguez‐Antona C, Ingelman‐Sundberg M (2006) Cytochrome P450 pharmacogenetics and cancer. Oncogene 25, 1679–1691. [DOI] [PubMed] [Google Scholar]
- 26. Fisher B, Costantino JP, Wickerham DL, Redmond CK, Kavanah M, Cromin WM et al (2005) Tamoxifen for the prevention of breast cancer: current status of the National Surgical Adjuvant Breast and Bowel Project P‐1 Study. J. Natl. Cancer Inst. 97, 1652–1662. [DOI] [PubMed] [Google Scholar]
- 27. Cronin‐Fenton DP, Lash TL (2011) Clinical epidemiology and pharmacology of CYP2D6 inhibition related to breast cancer outcomes. Expert Rev. Clin. Pharmacol. 4, 363–377. [DOI] [PMC free article] [PubMed] [Google Scholar]


