

Abstract
Abstract. Objective: Lapatinib (Tykerb®, GW572016), a potent inhibitor of the catalytic activities of epidermal growth factor receptor (EGFR) and human epidermal growth factor receptor 2 (HER2) (ErbB2), inhibits population growth of selected EGFR and HER2 overexpressing cell lines. Previous studies with a small number of cell lines suggest a correlation between overexpression of EGFR and/or HER2 and sensitivity to growth inhibition by lapatinib; however, the precise determinants of lapatinib selectivity for tumour and/or other cells remain unclear. Materials and methods: To clarify the determinants of its selectivity in cultured cells, lapatinib‐induced cell population growth inhibition and relative EGFR and HER2 protein expression were quantified in 61 different human tumour cell lines from 12 tumour types, two oncogene transformed human cell lines and two normal human cell cultures. Using statistical tools to analyse the data, a model describing the relationship between lapatinib IC50 (the response variable) and EGFR and HER2 expression and tissue type (explanatory variables) was derived. Conclusion: The results suggest that simultaneous consideration of EGFR and HER2 expression, as well as tissue type yields the best determinant of lapatinib selectivity in cultured cells.
INTRODUCTION
Epidermal growth factor receptor (EGFR) and human epidermal growth factor receptor 2 (HER2) tyrosine kinases play critical roles in ligand‐activated signalling pathways that regulate cell proliferation and cell death. Because many tumour cell lines overexpress these receptors and/or display constitutive activation of the pathways, these proteins have been developed as targets for antiproliferative antitumour drugs (Mosesson & Yarden 2004). For example, trastuzumab (Herceptin®, Genentech, San Francisco, CA, USA) is a monoclonal antibody that targets HER2 and is important in the treatment of metastatic and early stage HER2‐positive breast cancer (Yeon & Pegram 2005). Small molecule inhibitors targeted to EGFR tyrosine kinases, such as gefitinib (Iressa®, ZD‐1839; AstraZeneca Pharmaceuticals, Wilmington, DE, USA), and erlotinib (Tarceva®, OSI‐774; OSI Pharmaceuticals, Melville, NY, USA) are also approved for use in cancer treatment (Cohen et al. 2004, 2005). Lapatinib, a novel, orally administered small molecule dual tyrosine kinase inhibitor of EGFR and HER2, is now approved by the US Food and Drug Administration (FDA) for the treatment of patients with advanced or metastatic breast cancer whose tumours overexpress HER2, and is in phase III clinical trials for head and neck squamous cell carcinoma (HNSCC) (Rusnak et al. 2001; Wood et al. 2004; Geyer et al. 2006). Structural and biochemical studies indicate that lapatinib in vitro is a potent inhibitor of the tyrosine kinase activity of EGFR and HER2, binds to an inactive‐like conformation of EGFR and has a slow off‐rate from its target receptor in vitro and in vivo (Wood et al. 2004). Studies with human tumour cell lines and with transfected cell lines demonstrate that lapatinib inhibits the growth of cells from several EGFR and HER2 overexpressing cell lines (Rusnak et al. 2001; Konecny et al. 2006).
Although the previous studies have shown that human tumour cell lines overexpressing EGFR and HER2 were more sensitive to growth inhibition by lapatinib than those cell lines expressing low levels of the two receptors, these observations were limited to a relatively small number of tumour cell varieties (Rusnak et al. 2001), or focused on only breast cancer cell lines (Konecny et al. 2006). The precise determinants of lapatinib activity remain unclear. To improve our ability to predict the efficacy of this treatment in patients, a more comprehensive and analytical study of cellular sensitivity to the drug was needed. Thus, the present study was undertaken to determine the ability of lapatinib to inhibit growth of 61 human tumour cell lines from 12 tumour types, two oncogene transformed human cell lines and two normal human cell cultures. For each cell line, the IC50 for lapatinib was measured and relative expression of EGFR and HER2 was quantified using Western blot analysis. The results were used to develop a statistical model for relationships between these parameters. Here, the model presented will continue to be refined and will have predictive value in determining lapatinib sensitivity for previously uncharacterized cancer cells. This model also provides a framework for future development of objective approaches to optimizing anticancer treatment with lapatinib.
MATERIALS AND METHODS
Reagents
Lapatinib powder was synthesized as described (Petrov et al. 2006) and was prepared as a 10‐mm stock in 100% dimethyl sulfoxide (DMSO).
Cell lines investigated
NCI‐N87 (N87), BT‐474 (BT474), BT‐549 (BT549), MCF7, MDA‐MB‐231, MDA‐MB‐453, MDA‐MB‐468, SK‐Br‐3 (SKBr3), T‐47D (T47D), Hs 578T (Hs578T), Hs 746T (Hs746T), SW480, LoVo, SW620, LS 174T (LS174T), DLD‐1, HT‐29, SW837, RKO, BxPC‐3 (BxPC3), AGS, MGLVA1, A427, A549, NCI‐H747 (H747) NCI‐H460 (H460), Calu‐1 (Calu1), Calu‐3 (Calu3), SK‐OV‐3 (SKOV3), PC‐3 (PC3), LNCaP.FGC (LNCaP), A 431 (A431), ZR‐75‐1, HCT116, COLO 205, 786‐O (786O), HT1376, HT1197, T24, Cal 27, FaDu, RPMI 2650, SCC‐4 (SCC4), SCC‐9 (SCC9), SCC‐12 (SCC12), SCC‐13 (SCC13), SCC‐15 (SCC15), SCC‐25 (SCC25), SW579, SK‐MEL‐28 (SKMEL28), NCI‐H157 (H157), NCI‐H2009 (H2009), NCI‐H322 (H322), NCI‐H727 (H727) and NCI‐H358 (H358) were purchased from the American Type Culture Collection (Manassas, VA, USA). MX1 was provided by the National Cancer Institute (Bethesda, MD, USA). MGLVA1 was provided by Jeremy Stables at Glaxo Wellcome, UK. Human mammary epithelial cells (HMEC) were purchased from Clonetics Corporation (now available through Cambrex Biosciences, East Rutherford, NJ, USA). Human foreskin fibroblasts (HFF) were generated by dissociation of human foreskins with trypsin; SV40 transformed, c‐HER2 or valine 12 mutant v‐Ha‐ras transfected breast epithelial cells, HB4a c5.2 and HB4a r4.2, respectively, were generated as described (Harris et al. 1999). The LICR‐LON‐HN5 (HN5) head and neck carcinoma cell line was a gift from Helmout Modjtahedi at the Institute of Cancer Research, Surrey, UK.
Cell culture
HB4a r4.2 and HB4a c5.2 cells were maintained in RPMI 1640 (Invitrogen 22400‐089, Carlsbad, CA, USA) adjusted to 10% foetal bovine serum (FBS; HyClone SH30071.03, Logan, UT, USA), 5 micrograms/mL hydrocortisone (Sigma H‐0888, St. Louis, MO, USA), 5 µ/mL bovine insulin (Invitrogen 13007‐018) and 50 µg/mL hygromycin B (EMD Biosciences, Calbiochem 400051, San Diego, CA, USA). HMEC cells were cultured in mammary epithelial cell growth medium plus BulletKit reagents containing EGF provided by the supplier. N87, BT474, BT549, MDA‐MB‐453, MX1, SKBr3, T47D, Hs578T, Hs746T, SW480, LoVo, H747, SW620, LS174T, DLD‐1, HT‐29, SW837, RKO, BxPC3, AGS, MGLVA1, H727, A427, H157, H2009, A549, H460, H322, H358, Calu1, Calu3, SKOV3, PC3, LNCaP, A431, ZR‐75‐1, 786O, HT1376, HT1197, T24, Cal 27, FaDu, RPMI 2650, SCC4, SCC9, SCC12, SCC13, SCC15, SCC25 and SW579 cells were grown in RPMI 1640 (Invitrogen 22400‐089) containing 10% FBS. MDA‐MB‐231, MDA‐MB‐468, MCF7, HCT116 and COLO 205 cells were maintained in high glucose Dulbecco's modified Eagle's medium (DMEM, Invitrogen 10564‐011) containing 10% FBS. HFF and HN5 cells were grown in low glucose DMEM (Invitrogen 12320‐032) containing 10% FBS. SKMEL28 cells were maintained in minimum essential medium with 2 mm l‐glutamine and Earle's balanced salt solution, 0.1 mm nonessential amino acids and 1.0 mm sodium pyruvate (Invitrogen 11095‐114) and 10% FBS. SUM102, SUM149, SUM185 and SUM225 cells were cultured in the laboratory of Dr Carolyn Sartor at the Lineberger Comprehensive Cancer Center, Chapel Hill, NC, USA. One plate of each cell line was provided to GSK for each cellular IC50 determination and lysate was generated for Western analysis as described below. Cells (except HFF and HN5 cells) were plated in the appropriate media at an appropriate density to ensure logarithmic growth through the duration of the assay, and were incubated at 37 °C overnight in an atmosphere of 5% CO2. HFF and HN5 cells were treated similarly except in an atmosphere of 10% CO2.
Compound dilution and dosing
Cells were dosed with lapatinib 24 h after initial seeding into 96‐well plates in the following manner. Serial 1 : 3 dilutions of lapatinib were prepared in duplicate in 100% DMSO (Sigma D2650) using a Beckman BIOMEK 2000® (Fullerton, CA, USA). Four microlitres of each dilution were added to a 2‐mL deep well assay block (Corning, Costar 3960, Corning, NY, USA) containing 662 µL of low glucose DMEM (Invitrogen 12320‐032) supplemented with 0.1% gentamicin (Invitrogen 15750‐060, 50 mg/mL) using a 96‐channel pipette. Diluted compound (100 µL) was added to cells in the 96‐well plates (Becton Dickinson, Falcon 353075, Franklin Lakes, NJ, USA). Final concentration of lapatinib was 30, 10, 3.3, 1.1, 0.37, 0.12, 0.041, 0.014, 0.0045 or 0.0015 µm in 5% DMEM, 50% native medium 0.3% DMSO and 5% foetal bovine serum.
Methylene blue cell viability assay/IC50 determination
After 72 h of compound exposure, media were removed by aspiration. Cell biomass was estimated by staining with 100 µL per well of methylene blue (Sigma M9140, 0.5% in 50 : 50, ethanol: water) followed by incubation at room temperature for at least 30 min. Stain was aspirated and plates were rinsed in deionized water and were air‐dried. Stain was released from cells by the addition of 100 µL solubilization solution [1.0% N‐lauroyl sarcosine, sodium salt (Sigma L5121) in PBS (Invitrogen 14190‐144)] and plates were incubated at room temperature for 30 min with gentle shaking. Absorbance at 620 nm was determined on an ELISA plate reader and percentage of inhibition of cell population growth was calculated relative to untreated controls. IC50 values were interpolated using the method of Levenberg & Marquardt and the equation: y = Vmax–{1 –[xn/(Kn + xn)]}, where ‘K’ is equal to IC50 (Mager 1972) was used.
Western blot analysis
Subconfluent cultures of cells were lysed in radio‐immunoprecipitation assay buffer (150 mm NaCl; 50 mm Tris‐HCl, pH 7.5; 0.25% deoxycholate; 1% NP‐40, 100 mm sodium orthovanadate, Calbiochem protease inhibitor cocktail). Protein content was determined using the bicinchoninic acid protein assay kit (Pierce, Rockford, IL, USA). Cell lysates were diluted to 1 mg/mL in 1X Novex Tris‐Glycine SDS sample buffer (Invitrogen) containing 2.5%β‐mercaptoethanol, and 20 µg were loaded on duplicate 6% Novex Tris‐Glycine gels (Invitrogen). For cell lines known to overexpress EGFR or HER2, lysate was diluted to 0.1 mg/mL and 2 µg were loaded on the appropriate gel for the overexpressed receptor. Lysates were resolved by electrophoresis and were transferred to nitrocellulose membranes. The membranes were blocked overnight at 4 °C in Tris‐buffered saline Tween‐20 (150 mm NaCl; 10 mm Tris‐HCl, pH 7.5; 0.1% Tween‐20) containing 4% bovine serum albumin. Membranes were immunoblotted with anti‐EGFR Ab‐12 (Laboratory Vision, Neomarkers, Fremont, CA, USA) or anti‐c‐neu Ab‐3 (Oncogene Research Products, Cambridge, MA, USA) diluted 1 : 1000 in blocking buffer. Horseradish peroxidase‐conjugated AffiniPure donkey antimouse IgG (H + L) (Jackson ImmunoResearch Laboratories Inc., West Grove, PA, USA) was diluted 1 : 10 000 in blocking buffer and enhanced chemiluminescence (ECL; GE Healthcare‐Biosciences, Piscataway, NJ, USA) was used for detection. Bands corresponding to EGFR and HER2 were quantified by densitometry, using a Flour‐S MultiImager (Bio‐Rad, Hercules, CA, USA). Linear range for the Western blot was determined using HN5 lysate and extended to 30 densitometric counts. Dilution of samples known to overexpress EGFR or ErbB2 ensured that samples remained in the linear range of the detection system. Amount of receptor was expressed as a percentage of EGFR in HN5 cells, or HER2 in BT474 cells.
Gene copy number and HPV detection in HNSCCs
DNA copy number for EGFR and ERBB2 were determined by real‐time Q‐PCR. TaqMan primers and probes labelled with 5′‐fluorescein end labeled (FAM) and N, N, N, N‐tetramethyl‐6‐carboxyrhodamine (TAMRA) were designed using Primer Express software (Applied Biosystems, Foster City, CA, USA) and were synthesized by ABI. The data were collected using the Applied Biosystems Prism 7900HT Sequence Detection System, analysed with SDS version 2.1 and Excel (Microsoft Corp., Redmond, WA, USA). DNA copy numbers were calculated relative to TBP (TATA box binding protein), which is relatively stable at DNA level in human cancers determined by available CGH data. Primers used were: EGFR‐QF: 5′‐TCCAGGAGGTGGCTGGTTAT‐3′; EGFR‐QR: 5′‐TGCAGGTTTTCCAAAGGAATTC‐3′; EGFR‐QP: 5′‐FAM TCCTCATTGCCCTCAACACAGTGGAG TAMRA‐3′; ERBB2‐QF: 5′‐CTGGACGTGCCAGTGTGAAC‐3′; ERBB2‐QR: 5′‐TGCTCCCTGAGGACACATCA‐3′; ERBB2‐QP: 5′‐FAM AGAAGGCCAAGTCCGCAGAAGCC TAMRA‐3′; TBP‐QF: 5′‐GGTGGTGTTGTGAGAAGATGGA‐3′; TBP‐QR: 5′‐GGCACTTACAGAAGGGCATCA‐3′ andTBP‐QP: 5′‐FAM CTGGTGCCACACCCTGCAACTCAA TAMARA‐3′.
Five micron (5 µm) sections were cut from cell blocks and were mounted on charged slides (VWR, West Chester, PA, USA). Control human papillomavirus (HPV) slides were purchased (Zymed, San Francisco, CA, USA). These consisted of four core cells (a negative cell line Sf9 and HPV 6–11, HPV 16–18, HPV 31–33–35 positive cell lines). All ISH was performed using an automated Ventana XT; briefly, low risk (HPV 6–11) and high risk (HPV 16–18) DNA digoxigenin labelled HPV probes (Pan Path, Amsterdam, The Netherlands) were used to test the presence of HPV in the cell lines. A manual probe application was performed using a 100 µL of probe to each slide, and 4 h hybridization at 37 °C. Slides were washed three times with 2XSSC for 5 min at 42 °C. The detection was performed using the standard streptavidin‐biotin‐peroxidase method. Monoclonal antidigoxin antibody clone DI‐22(Sigma) against DNA digoxigenin labelled probe was used as primary antibody. Slides were rinsed and counterstained with light green working solution (Harleco, Giggstown, NJ, USA) for 1 minute at room temperature. They were then dehydrated, mounted and viewed using light microscopy.
Statistical analysis
A multiple regression model was fitted to the data to explore the relationship between tissue type, EGFR expression, HER2 expression and lapatinib IC50 (for overview, see Neter et al. 1990). Expression levels of EGFR and HER2 were transformed to the natural log, and were treated as two explanatory variables. The levels were transformed using the natural log because the data values became further apart as expression increased. Expression of HER2 for SUM 102 and EGFR for RPMI 2650 was below the limit of detection IC50 and was defined as zero. In order to take the natural log, these zero values necessitated adding 0.25 to each EGFR and HER2 value. A natural log transformation was performed on the lapatinib IC50 values to meet the anova assumption of constant variance. The statistical output from the multiple regressions is presented in Table 1. For subset analysis of expression (Table 2), efficacy and HPV status of the HNSCC lines, it was necessary to add 0.25 to the EGFR expression value only. HPV was status was assessed as one of three categories: negative, HPV 6–11, or HPV 16–18.
Table 1.
Statistical output for multiple regression
| Analysis | Source | Degrees of freedom | Sum of squares | Mean square | F ratio | P‐value |
|---|---|---|---|---|---|---|
| Analysis of Variance | Model | 18 | 150.0 | 8.34 | 7.73 | < 0.0001 |
| Error | 46 | 49.7 | 1.08 | |||
| Corrected Total | 64 | 199.7 | ||||
| Effects Tests | Tissue [15] | 15 | 54.9 | 3.39 | 0.0007 | |
| ln(EGFR + 0.25) | 1 | 11.2 | 10.4 | 0.0023 | ||
| ln(HER2 + 0.25) | 1 | 45.4 | 42.0 | < 0.0001 | ||
| ln(HER2 + 0.25*HER2 + 0.25) | 1 | 30.2 | 28.0 | < 0.0001 |
| Summary of fit | R‐square | 0.75 |
| Root mean square error | 1.04 | |
| Mean of response | 0.45 | |
| Observations (or sum weights) | 65 |
Table 2.
Human papillomavirus (HPV) status and gene copy number for head and neck squamous cell carcinoma (HNSCC) lines
| Cell line | HPV status | EGFR copy number | HER2 copy number |
|---|---|---|---|
| Cal 27 | Negative | 2 | 2 |
| SCC9 | Negative | 3 | 4 |
| SCC15 | Negative | 9 | 2 |
| SW579 | Negative | 4 | 3 |
| RPMI 2650 | HPV 6–11 | 2 | 4 |
| SCC4 | HPV 6–11 | 7 | 4 |
| SCC13 | HPV 6–11 | 3 | 2 |
| FaDu | HPV 16–18 | 2 | 4 |
| HN5 | HPV 16–18 | 19 | 2 |
| SCC12 | HPV 16–18 | 3 | 2 |
| SCC25 | HPV 16–18 | 2 | 2 |
RESULTS
Previous studies show that lapatinib binds with high affinity to the kinase domains of EGFR and HER2, and inhibits catalytic activity of EGFR and HER2. The Ki app for the tyrosine kinase activity of EGFR and HER2 is 3 nm and 13 nm, respectively (Wood et al. 2004). IC50 for the structurally related receptor tyrosine kinase HER4 is 30‐fold higher than for EGFR and HER2. However, for an unrelated tyrosine kinase, such as c‐Src, the IC50 of lapatinib is in the micromolar range, and even lower efficacy is observed for other non‐ErbB family kinases such as c‐Raf‐1, MEK and ERK (Rusnak et al. 2001; Fabian et al. 2005). This selective affinity of lapatinib for EGFR and HER2 is consistent with data from a small set of seven human tumour cell lines, demonstrating tumour cells that overexpressed these two tyrosine receptor kinases are susceptible to inhibition by lapatinib, whereas tumour cells expressing low levels of these receptors are much less responsive (Rusnak et al. 2001). This relationship has been explored here by quantifying and analysing EGFR and HER2 protein expression and lapatinib sensitivity (IC50) in an expanded panel of 65 human cell lines (Table 3).
Table 3.
Cell lines, lapatinib IC50 and relative expression of EGFR and HER2
| Cell line | Tissue | Lapatinib IC50 (µm) ± SEMa | Western blot analysis | |
|---|---|---|---|---|
| EGFR expression (% of HN5 EGFR) | HER2 expression (% of BT474 HER2) | |||
| H1197 | Bladder | 7.78 ± 0.68 | 2.67 | 2.12 |
| H1376 | Bladder | 3.34 ± 0.25 | 9.33 | 1.03 |
| T24 | Bladder | 8.22 ± 0.9 | 0.66 | 8.65 |
| BT474 | Breast | 0.025 ± 0.004 | 0.37 | 100 |
| BT549 | Breast | 6.35 ± 0.95 | 2.01 | 1.4 |
| HS578T | Breast | 5.11 ± 0.95 | 1.62 | 0.48 |
| MCF7 | Breast | 4.82 ± 1.14 | 0.07 | 1.03 |
| MDA‐MB‐231 | Breast | 7.01 ± 0.51 | 17.1 | 2.8 |
| MDA‐MB‐453 | Breast | 0.079 ± 0.025 | 0.68 | 28.6 |
| MDA‐MB‐468 | Breast | 2.32 ± 0.21 | 66.3 | 0.1 |
| MX1 | Breast | 5.55 ± 1.55 | 0.09 | 5.65 |
| SKBr3 | Breast | 0.032 ± 0.005 | 0.34 | 103 |
| SUM 102 | Breast | 0.38 ± 0.08 | 0.16 | BD |
| SUM 149 | Breast | 0.1 ± 0.04 | 7.1 | 1 |
| SUM 185 | Breast | 1.98 ± 0.02 | 0.05 | 4.97 |
| SUM 225 | Breast | 0.32 ± 0.08 | 0.17 | 129 |
| T47D | Breast | 4.83 ± 1.12 | 0.03 | 1.23 |
| ZR‐75–1 | Beast | 3.01 ± 1.75 | 0.62 | 21 |
| Colo 205 | Colon | 7.7 ± 1.03 | 0.25 | 7.92 |
| DLD‐1 | Colon | 3.63 ± 0.86 | 0.83 | 1.82 |
| HCT 116 | Colon | 5.87 ± 2.04 | 0.88 | 1.02 |
| HT‐29 | Colon | 5.24 ± 1.01 | 0.46 | 6.95 |
| Lovo | Colon | 3.39 ± 0.8 | 1.66 | 2.06 |
| LS174T | Colon | 1.51 ± 0.42 | 1.09 | 5.88 |
| NCI‐H747 | Colon | 1.49 ± 0.94 | 9 | 10.5 |
| RKO | Colon | 5.48 ± 0.52 | 0.36 | 1.65 |
| SW480 | Colon | 6.86 ± 2.1 | 0.2 | 0.26 |
| SW620 | Colon | 6.75 ± 0.63 | 0.34 | 1.57 |
| SW837 | Colon | 4.7 ± 0.77 | 1.11 | 5.67 |
| A431 | Epidermal | 0.23 ± 0.06 | 49.7 | 8.03 |
| AGS | Gastric | 5.24 ± 1 | 0.59 | 5.42 |
| Hs746T | Gastric | 5.81 ± 0.52 | 2.75 | 3.18 |
| MGLVA1 | Gastric | 9.03 ± 2.99 | 1 | 2.29 |
| NCI‐N87 | Gastric | 0.028 ± 0.002 | 4.07 | 241 |
| Cal 27 | Head/Neck | 0.308 ± 0.107 | 10.1 | 1.12 |
| FaDu | Head/Neck | 0.216 ± 0.025 | 5.25 | 2.75 |
| HN5 | Head/Neck | 0.029 ± 0.005 | 100 | 2.76 |
| RPMI 2650 | Head/Neck | 3.57 ± 0.32 | BD | 4.7 |
| SCC12 | Head/Neck | 0.674 ± 0.059 | 1.41 | 1.48 |
| SCC13 | Head/Neck | 1.06 ± 0.2 | 2.45 | 2.89 |
| SCC15 | Head/Neck | 0.267 ± 0.131 | 11.9 | 2.34 |
| SCC25 | Head/Neck | 0.222 ± 0.065 | 5.61 | 1.02 |
| SCC4 | Head/Neck | 1.851 ± 0.39 | 7.3 | 1 |
| SCC9 | Head/Neck | 0.331 ± 0.084 | 0.53 | 3.44 |
| SW579 | Head/Neck | 3.074 ± 0.277 | 2.78 | 0.05 |
| 786O | Kidney | 1.82 ± 0.17 | 11.3 | 0.47 |
| A427 | Lung | 5.95 ± 0.37 | 0.46 | 1.11 |
| A549 | Lung | 4.98 ± 0.49 | 3.1 | 1.49 |
| Calu1 | Lung | 5.51 ± 1.27 | 7.42 | 1.59 |
| CaLu3 | Lung | 0.057 ± 0.006 | 0.07 | 202 |
| H157 | Lung | 5.98 ± 0.03 | 1.04 | 0.15 |
| NCI‐H2009 | Lung | 11.5 ± 0.4 | 0.34 | 5.56 |
| NCI‐H322 | Lung | 0.92 ± 0.02 | 5.18 | 9.02 |
| NCI‐H358 | Lung | 0.27 ± 0.02 | 0.95 | 9.37 |
| NCI‐H460 | Lung | 9.0 ± 0.49 | 0.5 | 0.23 |
| NCI‐H727 | Lung | 7.59 ± 2.19 | 3.76 | 1.31 |
| SKMEL28 | Melanoma | 5.9 ± 0.37 | 0.02 | 0.32 |
| HFF | Normal fibroblast | 6.45 ± 0.78 | 2.34 | 0.57 |
| HMEC | Normal mammary | 1.34 ± 0.37 | 2.71 | 1.95 |
| SKOV3 | Ovarian | 1.25 ± 0.11 | 4.75 | 176 |
| BxPC3 | Pancreas | 1.41 ± 0.13 | 15.8 | 2.89 |
| LNCaP | Prostate | 4.69 ± 0.52 | 7.82 | 6.91 |
| PC3 | Prostate | 7.15 ± 2.24 | 0.37 | 0.78 |
| HB4a r4.2 | Transfected breast V12‐Ha‐ras | 5.73 ± 0.26 | 4.2 | 1.44 |
| HB4a c5.2 | Transfected breast HER2 | 0.027 ± 0.003 | 6.74 | 161 |
BD, below detection. Average IC50 values from at least two separate experiments with duplicate dose–response curves in each experiment. Lapatinib IC50 generated in a proliferation assay after 3 days of compound exposure.
Cell lines used in this study include human tumour cell lines and transfected cell lines expressing varying levels of EGFR or HER2. They were derived from the following types of tumours: breast, colon, epidermis, gastrointestinal tract, HNSCC, lung, melanocyte, ovary, prostate, pancreas, kidney and bladder. Two human transformed breast cell lines overexpressing c‐HER2 or v‐H‐Ras were also tested. Primary cultures of HFF and HMEC were included as examples of normal cells. Receptor tyrosine kinase (RTK) expression was determined by Western blot and dissociation enhanced lanthanide fluorescence immunoassay analysis (DELFIA, Table 3 and data not shown). EGFR protein expression was normalized to HN5 cells, and HER2 protein expression was normalized to BT474 cells. Results from Western blot and DELFIA were generally in agreement. Data from Western blots were used in further analyses. IC50 values were determined from 10‐point duplicate dose–response curves from 30 µm to 1.5 nm lapatinib. Cells were grown in 96‐well plates for 3 days and cell survival was measured using methylene blue cell staining as a marker of cell number. Table 3 shows lapatinib IC50 and relative expression of EGFR and HER2 protein in these cells.
Lapatinib IC50 values measured in this study ranged from 0.025 µm to 11.5 µm (Table 3). Previous observations indicated that serum concentration of lapatinib in treated patients’ peaks at 3.8 µmL and falls to 0.3 µm at 24 h (Burris et al. 2005). The most sensitive cell lines were BT474, SKBr3, MDA‐MB‐453, SUM149 (breast), NCI‐N87 (gastric), CaLu3 (lung) and HN5 (head/neck). Positive control cell lines transfected with c‐HER2 were also highly sensitive to lapatinib, while a negative control cell line transfected with v‐Ha‐ras and overexpressing the Ras protein was relatively insensitive to lapatinib. At least 15 of the tumour cell lines tested in this study had IC50 values less than 0.3 µm while 29 tumour cell lines and HMEC had IC50 values less than 3.0 µm.
In the most extreme cases, higher expression of one or other RTK tended to correlate with lower IC50 for lapatinib (i.e. BT474, A431, NCI‐N87 and CaLu3). However, this was not true in all cases (e.g. SUM‐149, MDA‐MB‐468) where an obvious relationship between lapatinib IC50 and expression of one RTK is not observed, especially for cells that expressed a moderate or low level of both RTKs. To visualize these relationships, average expression and sensitivity values from Table 3 were represented as scatter plots (Fig. 1); lapatinib IC50 was plotted versus EGFR in panel A and versus HER2 in panel B. The scatter plots suggest a possible relationship between RTK expression and lapatinib IC50, particularly for HER2 (Fig. 1, panel B). Furthermore, a significant fraction of the outliers in panels A and B express a high level of HER2 or EGFR, respectively (see open diamonds in Fig. 1). This result suggests that lapatinib sensitivity may depend simultaneously on expression of both RTKs.
Figure 1.
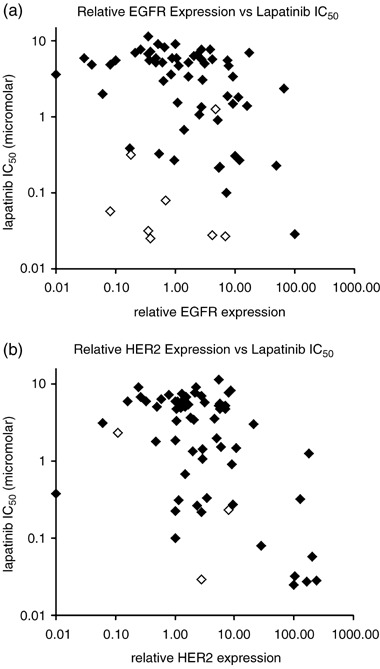
Scatter plots showing the relationship between individual receptor expression and cellular pIC50. (a) EGFR expression and cellular IC50. A number of cell lines with high levels of HER2 (open diamonds) are responsive to lapatinib, despite modest levels of EGFR expression. (b) HER2 expression and cellular IC50. Two of the three cell lines with high levels of EGFR expression (open diamonds) are responsive to lapatinib, despite modest levels of HER2 expression.
Statistical analysis of the data in Table 3 was undertaken to define more precisely the relationship between lapatinib IC50 and EGFR and HER2 expression. Using Western blot data for RTK expression, a multiple regression model was fitted to the data in Table 3. For this analysis, lapatinib IC50 was treated as a response variable, and tissue type and the natural log of the RTK expression values were treated as two independent explanatory variables. The natural log of lapatinib IC50 was used to meet the assumption of constant variance. This analysis, without regard for tissue type, resulted in a fitted surface with an r2 value of 0.47 (data not shown). Adding tissue type in addition to relative EGFR and HER2 expression has resulted in the fitted surface shown from two perspectives in Fig. 2, with an r2 value of 0.75 (Table 1).
Figure 2.
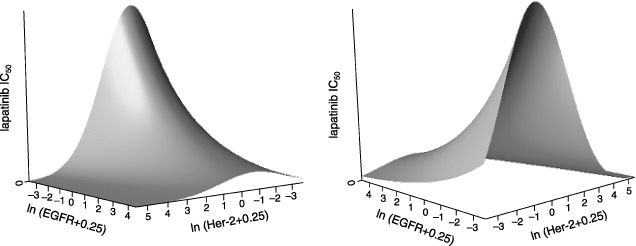
Fitted surfaces showing the effect of EGFR and HER2 expression on response to lapatinib. The natural log of EGFR and HER2 expression is plotted against the IC50 for lapatinib in a three‐day cellular proliferation assay. One cell line had an EGFR expression level and one cell line had an HER2 expression level below the limit of detection which was defined as zero. For this reason, a value of 0.25 was added to the expression level of EGFR and HER2 for all cell lines. Left panel: As EGFR expression increases, there is a commensurate drop in cellular IC50. As HER2 expression increases, there is quadratic relationship between the natural logarithm of expression and efficacy. Tissue of origin for each cell line was also used to generate the fitted surface. Right panel: the same surface rotated to more readily visualize the predicted IC50 at higher levels of HER2.
Validity of the statistical model derived in Fig. 2 was tested by comparing actual and predicted lapatinib IC50 for 65 cell lines. Results of this analysis are represented in Fig. 3 as a residual plot, which show the difference between predicted and actual values for each cell line. Differences of actual IC50 from predicted IC50 range between approximately 8 µm higher and lower (data not shown). Cell lines with the higher IC50 values typically were most affected in this analysis. For this reason, data are presented as the log of the ratio of the actual IC50 divided by the predicted IC50 (Fig. 3). For most of the cell lines, predicted IC50 differs from the actual value by less than 2‐fold. Figure 4 shows the relationship between the natural log of predicted and actual IC50 in graphical form. From Fig. 4, it is apparent that the model is reasonably accurate at predicting response for some tumour types such as those of breast and colon, but the response for other tumour types is less well predicted by the model. For this reason, additional factors were investigated in the HNSCC subset of tumour cell lines.
Figure 3.
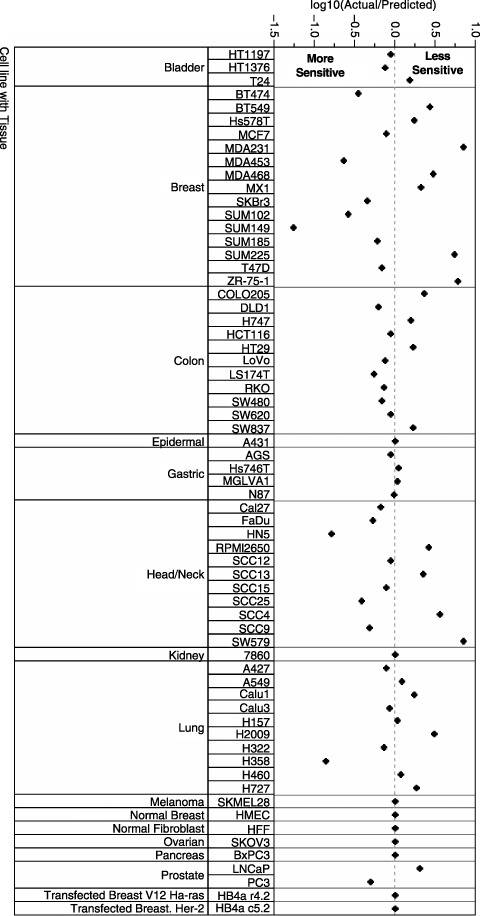
Residual plot shows the difference between predicted and actual cellular IC50 values for 65 cell lines as the ratio of actual/predicted on the log base 10 scale.
Figure 4.
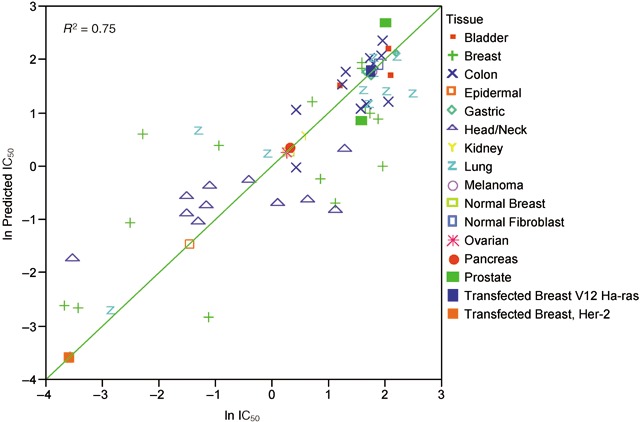
Plot of the natural log of predicted versus actual IC50 values on the log base 10 scale. Each symbol on the graph represents a single cell line. Color symbols indicate tumor tissue of origin.
Table 2 describes the detection of HPV DNA in the HNSCC cell lines, a known agent in the pathogenesis and prognosis of HNSCC (Fakhry et al. 2006). Multivariate analysis was performed investigating the HPV status, EGFR and HER2 expression and their relationship to lapatinib sensitivity. Results in Fig. 5 show that considering HPV infection in addition to EGFR and HER2 expression influences the ability to predict response to lapatinib; r 2 = 0.96 considering HPV or r 2 = 0.73 without considering HPV. In addition, EGFR and HER2 gene copy number was determined in the HNSCC cell lines by DNA Taqman analysis. However, there was no significant relationship between gene copy number and protein expression of EGFR and HER2 or gene copy number and response to lapatinib.
Figure 5.
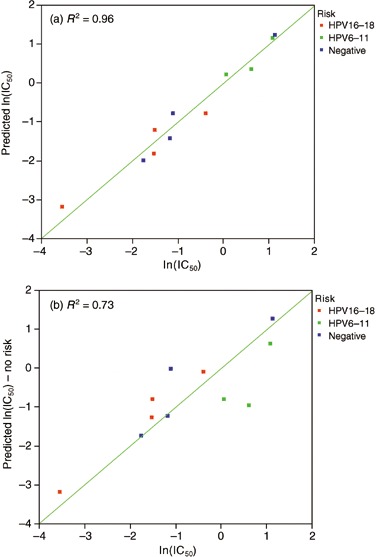
HNSCC tumor cell lines, plot of the natural log of predicted versus actual IC50 value on the log base 10 scale. Multivariate assessment of the effect of HPV risk and EGFR/HER2 expression on lapatinib sensitivity (a) is a better predictor of lapatinib sensitivity than assessment of only EGFR and HER2 expression (b).
DISCUSSION
This study has analysed the sensitivity of 65 human cell lines to lapatinib and develops a statistical model for the relationship between lapatinib IC50 and expression of two RTKs, EGFR and HER2, in these cells. Statistical analysis of the data demonstrated a quadratic relationship between the natural log of the expression of HER2 and the natural log of lapatinib IC50. In contrast, the relationship between the natural log of EGFR and the natural log of lapatinib IC50 is linear. Figure 2 shows that at very high levels of HER2 expression, lapatinib sensitivity is increased, which is consistent with reports for the HER2 therapy, trastuzumab treatment (Pegram et al. 1998; , Vogel et al. 2001). At lower levels of HER2, lapatinib sensitivity is decreased; however, this effect is most dramatic at nearly undetectable levels of EGFR. At higher levels of EGFR expression, even with modest levels of HER2, lapatinib sensitivity is shown to increase. These data point to a key finding of this study, which is that a multivariate regression model exploring the relationship between sensitivity and simultaneously, both EGFR and HER2 expression are required for the assessment of a true dual inhibitor such as lapatinib. Another interesting discovery in this analysis was that including tissue type as an explanatory variable greatly improved the statistical fit. For decades, clinicians have recognized that the broad category of cancer actually represents multiple diseases, and these diseases are typically classified based on tissue of origin. Modern genetic, genomic and proteomic studies are attempting to define these categories objectively with regard to genotype or, in some cases, break down the barrier of tissue type as a descriptor of neoplastic disease. For example, the three cell lines in this study expressing the highest levels of EGFR, A431, HN5 and MDA468 were from different tissues and two of those three were responsive to lapatinib with IC50 values less than 0.3 µm. The highest levels of HER2 were seen in one of the two highly responsive lung cancer cell lines, Calu‐3, and a responsive gastric tumour cell line, N87. The importance of tissue type in this study emphasizes the need to understand genetic complexities that can define a specific tumour tissue, yet A431, HN5, N87 and Calu‐3 imply that in some cases overexpression of the target may be a key factor in predicting response.
The statistical model described in this paper was evaluated by predicting lapatinib IC50 from RTK expression for 65 human cell lines. Although predicted and actual IC50 values agreed closely for most cell lines, some were more sensitive to lapatinib than predicted by the model. Four of these cell lines express EGFR or HER2 at a high level. Furthermore, a number of cell lines were less responsive to lapatinib than the model predicts. The precise reason for the discrepancy between the predicted and actual lapatinib IC50 for these cell lines is not known. To our knowledge, these cell lines do not express mutant RTKs, although other genetic alterations that affect lapatinib sensitivity can not be ruled out at present. For example, genetic defects in the tumour suppressor gene phosphatase and tensin homolog deleted on chromosome ten (PTEN), downstream of EGFR and/or HER2 have been noted in MDA468 cells (Lu et al. 1999) that could modulate the response to lapatinib. In addition, many cancers, such as of the uterine cervix, and HNSCC carry viral gene products resulting in the neoplastic phenotype. To this end, we have further investigated the HNSCC subset of cell lines and found that by applying HPV status as a parameter, there is improvement in the ability of the model to predict lapatinib sensitivity. This is an important factor to be applied to the recently initiated Phase III clinical trials for lapatinib in HNSCC.
Interestingly, there is no evidence to date that trastuzumab is effective in the treatment of HNSCC. Recent reports indicate that due to the apparent lack of HER2 amplification and/or overexpression in these tumours, trastuzumab does not positively impact the response rate in these patients (Gillison et al. 2006). Furthermore, the same study highlighted the importance of overexpression of EGFR in these tumours in predicting the response rate, progression‐free survival and overall survival, indicating that the likely difference between the mechanism of action between lapatinib and trastuzumab in HNSCC is driven through the EGFR arm of the signalling pathway.
Although much remains to be learned about molecular mechanisms that determine lapatinib sensitivity in humans, the model presented here is consistent with the proposal that patients with EGFR overexpressing and HER2 overexpressing cancers may be an appropriate target patient group for lapatinib therapy. In a recent clinical study, lapatinib demonstrated a possible survival benefit in patients with advanced renal cell cancer overexpressing (3+ IHC) EGFR (Ravaud et al. 2006). Furthermore, lapatinib was recently approved by the FDA for the treatment of patients with advanced or metastatic breast cancer whose tumours overexpress HER2 and who have received prior therapy including an anthracycline, a taxane and trastuzumab (Geyer 2006). These data and the results presented in this report are consistent with the idea that EGFR and HER2 overexpression are two determinants of clinical responsiveness of human cancers to treatment with lapatinib.
ACKNOWLEDGEMENTS
The authors would like to thank Miriam Sanders for her excellent technical writing in drafting this manuscript. We would like to thank Dr. Carolyn Sartor for culturing the SUM102, SUM 149, SUM185 and SUM225 lines and providing samples to test for protein expression and compound efficacy.
Send reprint requests to David Rusnak, Clinical Pharmacology and Discovery Medicine, GlaxoSmithKline, 5 Moore Drive, Research Triangle Park, NC 27709, USA. E‐mail: david.w.rusnak@gsk.com
REFERENCES
- Burris HA, Hurwitz HI, Dees EC, Dowlati A, Blackwell KL, O’Neil B, Marcom PK, Ellis MJ, Overmoyer B, Jones SF, Harris JL, Smith DA, Koch KM, Stead A, Mangum S, Spector NL (2005) Phase I safety, pharmacokinetics, and clinical activity study of lapatinib (GW572016), a reversible dual inhibitor of epidermal growth factor receptor tyrosine kinases, in heavily pretreated patients with metastatic carcinomas. J. Clin. Oncol. 23, 5305–5313. [DOI] [PubMed] [Google Scholar]
- Cohen MH, Johnson JR, Chen YF, Sridhara R, Pazdur R (2005) FDA drug approval summary: erlotinib (Tarceva®) tablets. Oncologist 10, 461–466. [DOI] [PubMed] [Google Scholar]
- Cohen MH, Williams GA, Sridhara R, Chen G, McGuinn Jr WD, Morse D, Abraham S, Rahman A, Liang C, Lostritto R, Baird A, Pazdur R (2004) United States Food and Drug Administration Drug Approval Summary Gefitinib (ZD1839; Iressa) Tablets. Clin. Cancer Res. 10, 1212–1218. [DOI] [PubMed] [Google Scholar]
- Fabian MA, Biggs III WH, Treiber DK, Atteridge CE, Azimioara MD, Benedetti MG, Carter TA, Ciceri P, Edeen PT, Floyd M, Ford JM, Galvin M, Gerlach JL, Grotzfeld RM, Herrgard S, Insko DE, Insko MA, Lai AG, Lelias JM, Mehta SA, Milanov ZV, Velasco AM, Wodicka LM, Patel HK, Zarrinkar PP, Lockhart DJ (2005) A small molecule–kinase interaction map for clinical kinase inhibitors. Nat. Biotechnol. 23, 329–336. [DOI] [PubMed] [Google Scholar]
- Fakhry C, Gillison M (2006) Clinical implications of human papillomavirus in head and neck cancers. J. Clin. Onc. 24, 2606–2611. [DOI] [PMC free article] [PubMed] [Google Scholar]
- Geyer CE, Forster J, Lindquist D, Chan S, Romieu CG, Pienkowski T, Jagiello‐Gruszfeld A, Crown J, Chan A, Kaufman B, Skarlos D, Campone M, Davidson N, Berger M, Oliva C, Rubin SD, Stein S, Cameron D (2006) Lapatinib plus capecitabine for HER2‐positive advanced breast cancer. N. Engl. J. Med. 355, 2783–2785. [DOI] [PubMed] [Google Scholar]
- Gillison ML, Glisson BS, O’Leary E, Murphy BA, Levine MA, Kies MS, Chan D, Forastiere AA (2006) ASCO Annual Meeting Proceedings Part I, Abstract 5511. J. Clin. Oncol. 24, 18S. [Google Scholar]
- Harris RA, Eichholtz TJ, Hiles ID, Page MJ, O’Hare MJ (1999) New model of ErbB‐2 over‐expression in human mammary luminal epithelial cells. Int. J. Cancer 80, 477–484. [DOI] [PubMed] [Google Scholar]
- Konecny GE, Pegram MD, Venkatesan N, Finn R, Yang G, Rahmeh M, Untch M, Rusnak DW, Spehar G, Mullin RJ, Keith BR, Gilmer TM, Berger M, Podratz KC, Slamon DJ (2006) Activity of the dual kinase inhibitor lapatinib (GW572016) against HER‐2‐overexpressing and trastuzumab‐treated breast cancer cells. Cancer Res. 66, 1630–1639. [DOI] [PubMed] [Google Scholar]
- Lu Y, Lin YZ, Lapushin R, Cuevas B, Fang X, Yu SX, Davies MA, Khan H, Furui T, Mao M, Zinner R, Hung MC, Steck P, Siminovitch K, Mills GB (1999) The PTEN/MMAC1/TEP tumor suppressor gene decreases cell growth and induces apoptosis and anoikis in breast cancer cells. Oncogene 18, 7034–7045. [DOI] [PubMed] [Google Scholar]
- Mager ME (1972) Data Analysis in Biochemistry and Biophysics. New York: Academic Press. [Google Scholar]
- Mosesson Y, Yarden Y (2004) Oncogenic growth factor receptors: implications for signal transduction therapy. Semin. Cancer Biol. 14, 262–270. [DOI] [PubMed] [Google Scholar]
- Neter J, Wasserman W, Kutner MH (1990) Applied Linear Statistical Models. Homewood, IL: Irwin. [Google Scholar]
- Pegram MD, Pauletti G, Slamon DJ (1998) HER‐2/neu as a predictive marker of response to breast cancer therapy. Breast Cancer Res. Treat. 52, 65–77. [DOI] [PubMed] [Google Scholar]
- Petrov KG, Zhang YM, Carter M, Cockerill GS, Dickerson S, Gauthier CA, Guo Y, Mook Jr RA, Rusnak DW, Walker AL, Wood ER, Lackey KE (2006) Optimization and SAR for dual ErbB‐1/ErbB‐2 tyrosine kinase inhibition in the 6‐furanylquinazoline series. Bioorg. Med. Chem. Lett. 16, 4686–4691. [DOI] [PubMed] [Google Scholar]
- Ravaud G, Gardner J, Hawkins R, Von der Maase H, Zantl N, Harper P, Rolland F, Audhuy B, Machiels J, El‐Hariry I (2006) Efficacy of lapatinib in patients with high tumor EGFR expression: results of a phase III trial in advanced renal cell carcinoma (RCC). J. Clin. Oncol. Suppl. 24, 217s. [DOI] [PubMed] [Google Scholar]
- Rusnak DW, Lackey K, Wood ER, Alligood KJ, Rhodes N, Knight WB, Gilmer TM (2001) The effects of the novel, reversible epidermal growth factor receptor/ErbB‐2 tyrosine kinase inhibitor, GW2016, on the growth of human normal and tumor‐derived cell lines in vitro and in vivo . Mol. Cancer Ther. 1, 85–94. [PubMed] [Google Scholar]
- Vogel CL, Cobleigh MA, Tripathy D, Gutheil JC, Harris LN, Fehrenbacher L, Slamon DJ, Murphy M, Novotny WF, Burchmore M, Shak S, Stewart SJ (2001) First‐line Herceptin monotherapy in metastatic breast cancer. Oncology 61 (Suppl. 2), 37–42. [DOI] [PubMed] [Google Scholar]
- Wood ER, Truesdale AT, McDonald OB, Yuan D, Hassell A, Ellis B, Pennisi C, Horne E, Lackey K, Alligood KJ, Rusnak DW, Gilmer TM, Shewchuk L (2004) A unique structure for epidermal growth factor receptor bound to GW572016 (lapatinib): relationships among protein conformation, inhibitor off‐rate, and receptor activity in tumor cells. Cancer Res. 64, 6652–6659. [DOI] [PubMed] [Google Scholar]
- Yeon CH, Pegram MD (2005) Anti‐erbB‐2 antibody trastuzumab in the treatment of HER2‐amplified breast cancer. Invest. New Drugs 23, 391–409. [DOI] [PubMed] [Google Scholar]