

Abstract
Abstract. Objectives: Recent studies have suggested the potential of mesenchymal stem cells (MSCs) to differentiate into a hepatocyte‐like lineage. Here, we evaluate the efficacy of hepatocyte differentiation of MSCs by studying acquisition of hepatocyte‐like features together with alteration of the native mesenchymal phenotype. Material and methods: In vitro, we have investigated protein and mRNA level expression of hepatocyte and mesenchymal markers of mesenchymal‐derived hepatocyte‐like cells (MDHLCs) and we have evaluated their functionality using metabolic assays. In vivo, we investigated co‐expression of hepatocyte (albumin, α‐foetoprotein, cytokeratin 18) and mesenchymal (fibronectin, vimentin) markers after transplantation of MSCs or MDHLCs into severe combined immune deficiency mice. Results: We observed that while in vitro these cells acquired some phenotypic and functional features of mature hepatocytes, they partially preserved their mesenchymal phenotype. After intrasplenic transplantation, engrafted MSCs with isolated expression of fibronectin and α‐foetoprotein were observed. When these cells were injected into the liver, they expressed all analysed markers, confirming the chimaeric co‐expression observed in vitro. Conversely, liver‐engrafted MDHLCs conserved their hepatocyte‐lineage markers but lost their chimaeric phenotype. Conclusions: Hepatocyte differentiation of MSCs predominantly allows the acquisition of phenotypic hallmarks and provides chimaeric cells that maintain expression of initial lineage markers. However, advanced maturation to the hepatocyte‐like phenotype could be obtained in vivo by conditioning MSCs prior to transplantation or by infusing cells into the liver micro‐environment.
INTRODUCTION
As organ shortage remains a major limiting step in organ‐derived cell transplantation, alternative candidates for liver cell therapy have been proposed, after the discovery of stem cell pluripotency (Herzog et al. 2003; Martin‐Rendon & Watt 2003). Mesenchymal stem cells (MSCs) appear to be an appropriate candidate (Pittenger et al. 1999; Barry & Murphy 2004) and studies on their hepatic differentiation potential has rapidly developed in recent years. Schwartz et al. were the first to demonstrate in vitro the capacity of bone marrow stem cells to differentiate along the hepatocyte pathway (Schwartz et al. 2002). These results have been corroborated both in vitro and in vivo by other groups, using MSCs isolated from bone marrow (Anjos‐Afonso et al. 2004; Lee et al. 2004; Wang et al. 2004; Sato et al. 2005; Aurich et al. 2007), cord blood (Beerheide et al. 2002; Kogler et al. 2004; Hong et al. 2005), placenta (Chien et al. 2006), and adipose tissue (Seo et al. 2005; Talens‐Visconti et al. 2006). In vitro, characterization of conditioned cells has been based on phenotype [morphological changes, immunocytochemistry, reverse transcription‐polymerase chain reaction (RT‐PCR)] and on semiquantitative functional assays (albumin or urea secretion, glycogen storage, pentoxyresorufin‐0‐dealkylase assay, low‐density lipoprotein uptake). In vivo, engraftment of native or in vitro pre‐conditioned MSCs has been described to be efficient in mouse and rat models, with the exception of one recent report (Popp et al. 2006), and these cells were described to have acquired some hepatocyte‐specific markers inside the liver. Taken together, all these data indicate the potential of MSCs to acquire elective hepatocyte features after in vitro or in vivo differentiation.
In the present study, we aimed to investigate effective yield of in vitro hepatocyte differentiation of human bone marrow‐MSCs and to demonstrate whether or not this differentiation was associated with modifications of the initial mesenchymal phenotype. We corroborated these results in vivo by analysing hepatocyte and mesenchymal marker expression after transplantation of MSCs into liver‐injured severe combined immune deficiency (SCID) mice and we evaluated the influence of pre‐transplant conditioning of these cells on their in vivo expression profile. Furthermore, we studied the human origin of engrafted cells by analysis of nuclear and cytoplasmic co‐expression of human markers. The study was approved by our local institutional human and animal ethical committee.
MATERIALS AND METHODS
Cell isolation and culture
Bone marrow samples (n = 16) were collected by aspiration of vertebrae or iliac crests of postmortem donors aged 8–67 years. Aspirates were collected into heparinized syringes containing 10% Hanks’ balanced salt solution (Invitrogen, Merelbeke, Belgium) and were processed within 48 h. Mononuclear cells (MNCs) were separated by centrifugation at 805 g for 20 min at 20 °C after carefully loading bone marrow on Ficoll‐Paque™ PLUS (Amersham Biosciences, Uppsala, Sweden); cells were then washed twice with phosphate‐buffered saline (PBS) (Invitrogen). Cell viability was always greater than 95% as assessed by trypan blue dye exclusion. MNCs were seeded in culture flasks at 1–6 × 10⁶ cells/cm2 in α‐minimal essential medium (Invitrogen) containing 10% foetal calf serum (Perbio, Chester, UK) and 1% penicillin/streptomycin (P/S) (Invitrogen) (defined as MSC medium). First medium change was performed after 48–72 h and then twice weekly. Cells were cultured at 37 °C in a humidified atmosphere containing 5% CO2. When reaching 70% confluence, cells were detached using 0.05% trypsin–0.53 mm EDTA4Na (Invitrogen) and were re‐plated at 0.5 × 10⁴ cells/cm2. Colony forming unit‐fibroblast assays were performed by plating cells at 0.5–10 cells/cm2 in MSC medium. Plates were examined for presence of colonies, after 10 days. Cumulative population doublings were calculated using the following equation: [log10(N H) – log10(N I)]/log10(2), where NI is inoculum number and NH is cell harvest number, as described elsewhere (Bieback et al. 2004).
Mesodermal cell differentiation
Cells were plated at 1.5 × 10⁴ cells/cm2 in uncoated six‐well dishes. To obtain osteogenic differentiation, they were incubated with MSC medium containing 0.1 µm dexamethasone, 0.05 mm ascorbate and 10 mmβ‐glycerophosphate (all from Sigma, Bornem, Belgium), and changed twice a week. After 4 weeks, calcium deposition was evaluated using von Kossa and alizarin red stains. For adipogenic differentiation, cells were incubated with MSC medium containing 1 µm dexamethasone, 0.5 mm isobutyl‐methylxanthine, 0.2 mm indomethacin (all from Sigma) and 10 µg/mL insulin (Lilly Benelux SA, Brussels, Belgium) with medium change twice a week. After 4 weeks, lipid vesicles were revealed by oil red O staining.
Hepatocyte differentiation
Hepatocyte differentiation was evaluated for MSCs at passages 1–9 (28 samples, mean passage = 3). We plated MSCs at 1.5 × 10⁴ cells/cm2 on collagen type I‐coated dishes. These cells were incubated for 10 days with an induction medium containing 1% P/S Iscove's modified Dulbecco's medium (IMDM) (Invitrogen) supplemented with 20 ng/mL hepatocyte growth factor (HGF) (Biosource, Camarillo, CA, USA), 10 ng/mL fibroblastic growth factor 4 (FGF4) (Peprotech, London, UK), 1% insulin–transferrin–selenium (ITS premix, Invitrogen), and 0.61 g/L nicotinamide (Sigma); and then with 1% P/S IMDM containing 20 ng/mL oncostatin M (OSM) (Sigma), 1 µm dexamethasone and 1% ITS premix for ≥ 20 days (maturation medium). This differentiation protocol was defined as the complete protocol. Negative controls were: serum‐free IMDM and maturation medium.
Flow cytometry
Cells from the first to eighth passage were trypsinized and suspended at a concentration of 0.5–1 × 10³/µL in PBS, and then were incubated for 30 min at 4 °C with antibodies to the following: CD45‐APC, CD34‐APC, CD90‐PC5, CD86‐PE, HLA‐DR‐FITC, CD73‐PE, CD29‐PE, CD14‐PC5 (Becton Dickinson, Erembodegem, Belgium); CD105 Endoglin‐FITC (Immunokontact, Frankfurt, Germany); CD44‐FITC, CD49b‐FITC, CD49e‐FITC, CD71‐PE, CD117‐PC5, CD80‐PE, CD33‐FITC, CD26‐PE (Immunotech, Marseilles, France); HLA‐ABC‐PE (Dako Systems, Heverlee, Belgium); CD13‐PE (Beckman Coulter, Miami, FL, USA); CD133‐APC (Miltenyi, Utrecht, The Netherlands). Controls were derived by incubating the cells with corresponding isotypes: IgG1‐FITC, IgG2a‐PE, IgG2a‐PC5, IgG2b‐FITC (Serotec, Oxford, UK); IgM‐FITC (Immunotech); IgG2a‐FITC, IgG1‐PC5 (BD Pharmingen, San Diego, CA, USA); IgG1‐PE, IgG1‐APC (Becton Dickinson); IgG2a‐APC (Miltenyi). Cells were then washed and re‐suspended in Isoton (Beckman Coulter) for reading using a FACSCalibur flow cytometer (Becton Dickinson). Intracytoplasmic human albumin staining was performed as follows: 2 × 10⁵ cells were incubated in 200 µL Cytofix/Cytoperm (Becton Dickinson) for 20 min at room temperature, were washed with 1 mL 1 × Perm/Wash solution (Becton Dickinson) and were centrifuged for 5 min at 805 g. Cell pellets were re‐suspended in 50 µL Perm/Wash and were incubated with 1 µL FITC‐labelled rabbit antihuman albumin antibody (Cedarlane Laboratories, Ontario, Canada) or 1 µL FITC‐labelled IgG1 control isotype (BD Pharmingen), for 25 min at 4 °C. After washing cells with 1 mL PBS and centrifuging for 5 min at 2000 r.p.m., cells were fixed in 250 µL Cellfix (Becton Dickinson) and were analysed using the FACSCalibur flow cytometer.
Immunocytochemistry
Cells were fixed with 3.5% formaldehyde for 15 min, permeabilized with 1% Triton X‐100 (Sigma) in Tris‐buffered saline (TBS) buffer (pH 7.5) for 15 min and then were rinsed with TBS. After 1 h incubation with blocking solution (3% dry milk in TBS), cells were rinsed with TBS and then incubated for 1 h at room temperature with primary mouse antihuman monoclonal antibodies as follows: 1/50 vimentin, 1/50 albumin (Sigma); 1/50 α‐smooth muscle actin (ASMA), 1/50 HepPar1 (Dako Cytomation); 1/50 CK18 (Progen, Heidelberg, Germany); 1/200 connexin‐32 (CX‐32), 1/50 CK8 (Chemicon, Temecula, CA, USA); 1/20 dipeptidylpeptidase‐IV (DPPIV) (Ancell, Bayport, MN, USA); 1/100 E‐cadherin (BD Pharmingen) and rabbit polyclonal antihuman antibodies as follows: 1/50 laminin, 1/100 fibronectin, 1/100 α‐foetoprotein (αFP) (Dako Cytomation) and 1/100 albumin (Jackson Immunoresearch Laboratories, West Grove, PA, USA). Cells were washed five times and primary antibody locations were revealed by 1 h incubation with Cy3‐coupled antimouse IgG (Jackson Immunoresearch Laboratories) and FITC‐coupled antirabbit IgG (Sigma). After rinsing, nuclei were visualized by 30 min staining with 4′,6‐diamidino‐2‐phenylindole (DAPI, Sigma). For immunoperoxidase staining, formaldehyde‐fixed cells were incubated with 3% hydrogen peroxide (Sigma) for 3 min, washed with distilled water and then were permeabilized with 1% Triton X‐100. After 1 h block in 1% bovine serum albumin (BSA, Sigma), cells were incubated 1 h at room temperature with primary antibodies in 0.1% BSA, were washed with PBS, and then exposed for 30 min to antirabbit or antimouse Dako Envision HRP antibody (Dako Cytomation). Staining was performed by 3 min exposure to 3,3′‐diaminobenzidine (Sigma). After rinsing, nuclei were stained with Mayer's haematoxylin (10 min) and cells were mounted. Each antibody was tested on fresh (< 24 h) cultures of human hepatocytes as positive controls and MSCs as negative controls.
Reverse‐transcription polymerase chain reaction
Total RNA was extracted from cells (n = 0.9 × 10⁶) grown in six‐well plates using the TriPure isolation reagent (Roche Diagnostics, Vilvoorde, Belgium), and cDNA was generated using a reverse transcription kit (Thermoscript RT, Invitrogen), according to the manufacturer's instructions. Polymerase chain reaction (PCR) amplifications were performed using specific primers (Table 1) and polymerase elongase (Invitrogen) in a final volume of 25 µL. All PCR experiments were performed at 30 cycles. Samples were electrophoresed on 1% agarose gel and nucleic acids were visualized by ethidium bromide staining.
Table 1.
Primers used for RT‐PCR characterization of mesenchymal‐derived hepatocyte‐like cells
| Primer | Sequence | Size (bp) | Cycle |
|---|---|---|---|
| Albumin | S: 5′‐CCTTGGTGTTGATTGCCTTTGCTC‐3′ AS: 5′‐ CATCACATCAACCTCTGGTCTCACC‐3′ | 308 | 94 °C/1 min; 55 °C/1 min; 72 °C/2 min |
| G6Pase | S: 5′‐TCAGCTCAGGTGGTCCTCTT‐3′ AS: 5′‐CCTCCTTAGGCAGCCTTCTT‐3′ | 291 | 94 °C/1 min; 55 °C/1 min; 72 °C/2 min |
| CK‐8 | S: 5′‐AAGGGCTGACCGACGAGATC‐3′ AS: 5′‐GATCGCCACCTACAGGAAGC‐3′ | 537 | 94 °C/30 s; 50 °C/30 s; 72 °C/60 s |
| CK18 | S: 5′‐CCATGCGCCAGTCTGTGGAG‐3′ AS: 5′‐AGCAGATTGAGGAGAGCACCAC‐3′ | 322 | 94 °C/30 s; 65 °C/45 s; 72 °C/45 s |
| α1‐AT | S: 5′‐TCGCTACAGCCTTTGCAATG‐3′ AS: 5′‐TTGAGGGTACGGAGGAGTTCC‐3′ | 142 | 94 °C/30 s; 55 °C/1 min; 72 °C/2 min |
| αFP | S: 5′‐TGAAATGACTCCAGTAAACCC‐3′ AS: 5′‐AATGAGAAACTCTTGCTTCATC‐3′ | 199 | 94 °C/30 s; 55 °C/1 min; 72 °C/2 min |
| CYP 3A4 | S: 5′‐TGCTGTCTCCAACCTTCACC‐3′ AS: 5′‐GGTGGTGATGATTCCAAGCTA‐3′ | 802 | 94 °C/120 s; 50 °C/60 s; 72 °C/60 s |
| CYP 2B6 | S: 5′‐CCTCTTCCAGTCCATTACCG‐3′ AS: 5′‐GCCATACACAGAGGCAGTCA‐3′ | 551 | 94 °C/120 s; 50 °C/60 s; 72 °C/60 s |
| TAT | S: 5′‐TGAGCAGTCTGTCCACTGCCT‐3′ AS: 5′‐CTCAGATCCTCCTCATTCACAT‐3′ | 358 | 94 °C/40 s; 56 °C/50 s; 72 °C 60 s |
| TDO | S: 5′‐ATACAGAGCACTTCAGGGAGC‐3′ AS: 5′‐GATACCGAAGATGAACCCAACCA‐3′ | 316 | 94 °C/40 s; 56 °C/50 s; 72 °C/60 s |
| HNF4 | S: 5′‐CCAAGTACATCCCAGCTTTC‐3′ AS: 5′‐CTTTGACCCAGATGCCAA‐3′ | 295 | 94 °C/40 s; 56 °C/50 s; 72 °C/60 s |
| c‐met | S: 5′‐CAATGTGAGATGTCTCCAGC‐3′ AS: 5′‐TCTGCCTGCAATCTACAAGG‐3′ | 560 | 94 °C/40 s; 55 °C/40 s; 72 °C 60 S |
| PEPCK | S: 5′‐TTAGATGGGACAAAGCCTG‐3′ AS: 5′‐GCAAGACGGTGATTGTAACTC‐3′ | 226 | 94 °C/40 s; 55 °C/40 s; 72 °C/60 s |
| Vimentin | S: 5′‐CTACATCGACAAGGTGCGCTT‐3′ AS: 5′‐TGCCAGAGACGCATTGTCAA ‐3′ | 301 | 94 °C/30 s; 58 °C/30 s; 72 °C/60 s |
| ASMA | S: 5′‐ATGTGTGAAGAAGAGGACAG‐3′ AS: 5′‐ACTCGTAACTCTTCTCAAGG‐3′ | 730 | 94 °C/30 s; 55 °C/30 s; 72 °C/30 s |
| Fibronectin | S: 5′‐ACGGGAGCCTCGAAGAGCAA‐3′ AS: 5′‐TGCAAGTGATGCGTCCGTG‐3′ | 607 | 94 °C/30 s; 55 °C/30 s; 72 °C/30 s |
| GAPDH | S: 5′‐CGGAGTCAACGGATTTGGTCGTAT‐3′ AS: 5′‐AGC CTT CTC CAT GGT GGT‐3′ | 307 | 94 °C/1 min; 58 °C/1 min; 72 °C/2 min |
α1‐AT, α1‐antitrypsin; αFP, α‐fetoprotein; ASMA, α‐smooth muscle actin; CK, cytokeratin; CYP, cytochrome P450; GAPDH, glyceraldehyde‐3‐phosphate dehydrogenase; G6Pase, glucose‐6‐phosphatase; HNF4, hepatic nuclear factor 4; PEPCK, phosphoenolpyruvate carboxykinase; TAT, tyrosin aminotransferase; TDO, tryptophan‐2,3‐dioxygenase.
Transmission electron microscopy
Samples of MSCs and MDHLCs were trypsinized and centrifuged at 13 400 g for 3 min at room temperature. After supernatant removal, cell pellets were fixed with 2.5% EM‐grade glutaraldehyde (Agar Scientific, London, UK) buffered in 0.1 M sodium cacodylate for 48 h, were post‐fixed in 1% osmium tetroxide (Agar Scientific), and then embedded in Epoxy embedding medium (Fluka Chemie, Buchs, Switzerland). Ultrathin sections were contrasted with uranyl acetate and lead citrate before examination by transmission electron microscopy using a Zeiss EM109 microscope (Carl Zeiss Inc., Oberkochem, Germany).
Glycogen staining
After 3.5% formaldehyde fixation, cells were incubated for 10 min in 1% periodic acid (Sigma), were washed with distilled water and incubated with Schiff's reagent (Sigma) for 15 min. After rinsing for 10 min in tap water, nuclei were stained for 10 min with Karazi's haematoxylin. Cells were then washed with tap water and mounted. Freshly cultured (< 24 h) human hepatocytes and MSCs served, respectively, as positive and negative controls.
Metabolic assays
Urea concentrations of culture supernatants were screened by a colorimetric assay (Gentaur, Brussels, Belgium), handled according to the manufacturer's instructions, and were analysed using a HTS7000PLUS absorbance reader (Perkin Elmer, Wellesley, MA, USA). Serum‐free IMDM, incubated with freshly cultured (< 24 h) mouse hepatocytes, and serum‐free IMDM alone, respectively, served as positive and negative controls.
Human albumin concentration was screened using ELISA assay (Cygnus Technologies, Plainville, MA, USA, or Bethyl Laboratories, Montgomery, TX, USA) as per manufacturers’ instructions and was analysed by Multiskan EX absorbance reader (Thermo Fisher Scientific, Zellik, Belgium). Controls were designed as for urea assay.
For revelation of glucose‐6‐phosphatase (G6Pase) activity, cells were incubated for 5 min in solution containing 0.1 g glucose‐6‐phosphate (G6Pate, Sigma) and 0.15 g lead nitrate (Acros, Geel, Belgium) in a Tris‐maleate buffer at pH 6.7, at 37 °C. Brownish precipitates of lead sulphide were obtained by incubating the cells in a solution of 1% ammonium sulphide (Sigma) (Sokal et al. 1989). They were then mounted for viewing by light microscopy. Controls were performed as for periodic acid‐Schiff staining.
Functional gluconeogenesis assay was performed on freshly isolated mouse hepatocytes from fasted mice, MDHLCs and MSCs. Cells were first incubated with their corresponding medium (see above) containing pentachlorophenol (Sigma) at the following concentrations (0, 0.15 and 0.30 mm) for 4 h and then were washed twice in PBS. For gluconeogenesis testing, cells were incubated for 2 h in a Krebs glucose‐free solution (pH 7.4) containing lactate (10 mm) and pyruvate (1 mm). Gluconeogenesis was evaluated via glucose formation, measured using the glucose oxidase method, as reported by Lefebvre et al. (1994).
Cell transplantation
Cell transplantations were performed on 8–12‐week‐old female SCID mice as summarized in Table 2. Five transplantation groups were designed: group A, MSCs injected into spleens of hepatectomized mice; group B, MSCs injected into spleens of retrorsine–allylalcohol‐treated mice; group C, MSCs injected into livers of hepatectomized mice and groups D and E, MDHLCs injected, respectively, into spleens or livers of hepatectomized mice. Hepatectomies were performed on left or anterior liver lobes, when associated, respectively, to spleen or liver infusion. Retrosine–allylalcohol treatment consisted of two 14‐day separated intraperitoneal injections of 30 mg/kg retrorsine, followed 4 weeks later by a single intraperitoneal dose of 0.62 mmol/kg allylalcohol the day before cell injection (Yavorkovsky et al. 1995; Laconi et al. 2001; Menthena et al. 2004; Piscaglia et al. 2005). Each group of mice consisted of three control mice receiving 100 µL PBS and six sample mice receiving injections of 1 × 10⁶ cells suspended in PBS. After 1 month, serum was collected and tissues were removed, fixed and prepared routinely before paraffin wax embedding, for further analyses.
Table 2.
Description of cell transplantation procedures
| Groups | Transplantation procedures | ||
|---|---|---|---|
| Cells | Injection site | Hepatic stimulus | |
| A | MSCs | spleen | HTM |
| B | MSCs | spleen | R–AA |
| C | MSCs | liver | aHTM |
| D | MDHLCs | spleen | HTM |
| E | MDHLCs | liver | HTM |
(a) HTM, (anterior lobes) hepatectomy; MDHLCs, mesenchymal‐derived hepatocyte‐like cells; MSCs, mesenchymal stem cells; R–AA, retrorsine–allylalcohol.
Immunohistochemistry
Liver sections (5 µm) were deparaffinized with Histosafe, isopropanol and methanol solutions (VWR). Epitope retrieval was performed by incubating sections in 97 °C, in heated 0.02 m citrate buffer (pH 5.8) for 75 min. Endogenous peroxidase was inactivated by treating with 0.3% hydrogen peroxide in methanol for 15 min at room temperature. Non‐specific binding was blocked by incubating sections for 30 min at room temperature in PBS with 1% BSA. Tissues were stained with mouse monoclonal antihuman albumin (1/250) or antihuman vimentin (1/50) antibodies using the avidin‐biotin technique with Dako Cytomation Animal Research Kit according to the manufacturer's instructions. Polyclonal antihuman antibodies were incubated overnight at room temperature at the following concentrations: 1/3000 rabbit antihuman fibronectin, 1/1000 rabbit antihuman αFP and 1/200 guinea pig antihuman CK18 (Progen). Sections were rinsed with PBS and then were incubated for 30 min at room temperature with antirabbit Dako Envision HRP antibody or for 45 min with HRP‐conjugated goat antiguinea pig antibody (Progen). Sections were washed and immunoreactivity was revealed by adding diaminobenzidine (Sigma), forming a brown precipitate on labelled cells. After rinsing, nuclei were counterstained with Mayer's haematoxylin for 10 min and sections were mounted with coverslips. Control immunohistochemistry was performed on human or PBS‐injected mouse liver sections using primary antibodies, the corresponding isotypes or without primary antibodies. Control isotypes used were: mouse IgG1 (BD Pharmingen) for antihuman CK18; mouse IgG2a (BD Pharmingen) for antihuman vimentin and albumin.
Detection of human Alu sequences by in situ hybridization
Three micron liver sections were deparaffinized and re‐hydrated in graded alcohols. Antigen retrieval was performed by incubating sections in citric acid monohydrate solution (pH 6.0) twice in a microwave oven for 10 min. After washing in PBS, sections were treated with 3% hydrogen peroxide in 70% ethanol for 20 min; they were immersed in water for 10 min and then dehydrated in increasing grades of ethanol. After air drying for 15 min, sections were covered with human Alu‐DNA‐Probe (PR‐1001‐01, Innogenex, San Ramon, CA, USA) and were sealed with coverslips. Slides were warmed at 95 °C for 5 min to denature DNA and hybridization was performed at 37 °C. After overnight incubation, coverslips were removed and slides were washed in three baths of 2× SSC (pH 7.0) (room temperature for 10 min, 56 °C for 10 min and room temperature for 15 min). Non‐specific binding was prevented by incubation in PBS 3% BSA for 1 min and by a two‐step Avidin/Biotin block (SP‐2001, Vector Laboratories Ltd., Peterbourough, UK). Sections were incubated 1 h with biotinylated goat anti‐FITC antibody (1 : 100, BA‐0601, Vector Laboratories Ltd.), washed in PBS and exposed for 15 min to streptavidin‐HRP (Animal Research Kit, Dako Cytomation). Visualization was performed using a short incubation in 3,3′‐diaminobenzidine. After rinsing, nuclei were counterstained with Mayer's haematoxylin for 10 min and sections were subsequently mounted.
Cell counting
Cell numbers were obtained by counting positive cells (for hepatocyte‐like morphology and albumin or glycogen staining) in three different random fields (magnification ×200) of each three different culture samples. Total cell counts are provided for each experiment.
Statistics
Results are expressed as mean ± SD and statistically (*P < 0.05, **P < 0.01, ***P < 0.001) significant differences were assessed using the unpaired Student's t‐test.
RESULTS
Characterization of human bone marrow mesenchymal stem cells
We obtained growing cultures of MSCs from all bone marrow samples (Fig. 1a). These cells grew up to 34 cumulative population doublings at the 8th passage. After passage 10, growth and morphology of the cells altered markedly with loss of differentiation capacities (Fig. 1b). This alteration was not impeded by growth factor treatment (bFGF, EGF). Immunophenotype was analysed at each passage and appeared to be stable with high expression of CD44, CD29, CD73, CD90, CD13, HLA‐ABC, moderate expression of CD105, CD49e, CD71, CD26, CD49b, and no expression of CD45, CD34, CD14, CD33, CD117, CD133, CD80, CD86 and HLA‐DR (Fig. 1o). Immunocytochemistry confirmed mesodermal origin of MSCs as they consistently expressed vimentin, fibronectin, ASMA and laminin (Fig. 1c–f). Mesenchymal phenotype was further confirmed in all MSC samples (up to passage 8) by efficiently differentiating these cells into osteocytes and adipocytes (Fig. 1g–n).
Figure 1.
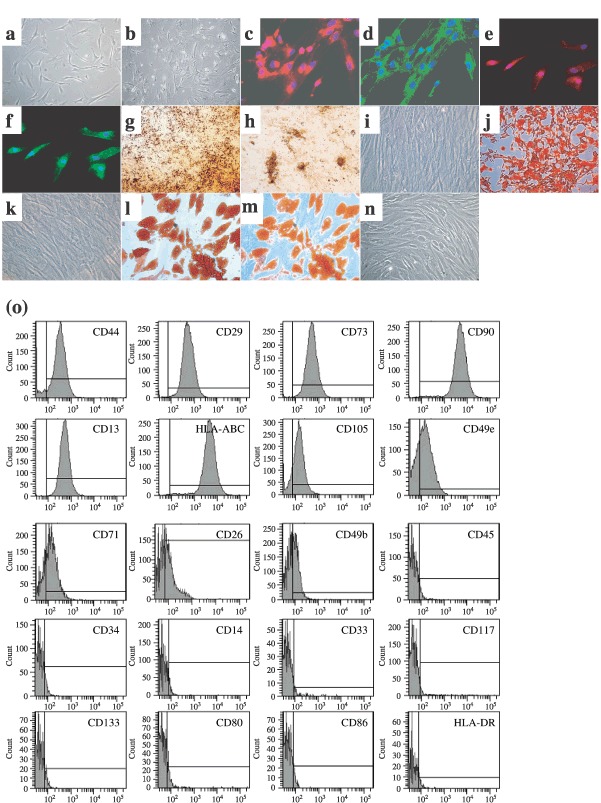
Characterization of MSCs. Example of MSCs morphology at passage 1, day 15 (a) that was altered at passage 8, day 99 (b). Expression of mesodermal antigens in MSCs at passage 2 as revealed by immunofluorescence [vimentin (c), fibronectin (d), ASMA (e), laminin (f), n = 3 each]. Staining of extracellular calcium matrix deposition by von Kossa (g, h) and alizarin red (j) colorations in MSCs after osseous differentiation. Accumulation of intracytoplasmic lipid‐rich droplets revealed by oil red O staining (l, m) after adipocyte differentiation of MSCs. Respective controls are provided with undifferentiated MSCs (i, k, n). Example of representative immunophenotype of MSCs at passage 2 (o). Analyzed epitopes are indicated in the histograms. Bars indicate the fluorescence level of corresponding isotype. Pictures magnifications are: ×100 (b, g), ×200 (j), ×300 (c–f) and ×400 (a, i, k–n).
In vitro hepatocyte differentiation of human bone marrow mesenchymal stem cells
We determined our complete protocol after having tested serial combinations (n = 30, each performed twice or more) of various factors that have been described to play a role in hepatocyte differentiation (HGF, EGF, aFGF, bFGF, FGF4, IL‐6, OSM, DMSO, nicotinamide, ascorbic acid 2‐phosphate, dexamethasone, ITS) (Zaret 2001; Heng et al. 2005; Lavon & Benvenisty 2005). We elicited the protocol which achieved best results of hepatocyte‐like morphology, urea secretion, glycogen storage and albumin expression (Fig. 2). Highest levels of albumin immunopositive and glycogen‐producing cells, and of urea secretion were observed in MDHLCs differentiated using the complete protocol, as compared to cells differentiated with the other tested protocols (Fig. 2).
Figure 2.
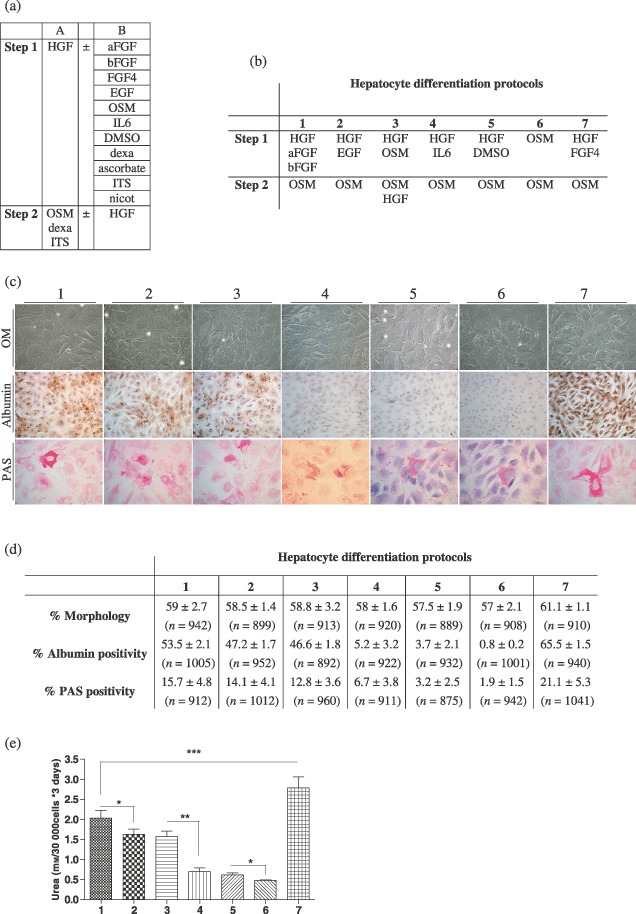
Description of the data collected for the elaboration of the complete hepatocyte differentiation protocol. (a) Description of the cytokines and factors tested in combinations (n = 30) following a two‐step procedure. Column A describes the factors invariably used in the protocols. Column B lists the factors that were added independently or in a combined manner (for step 1). (b) Description of the most representative hepatocyte differentiation protocols designed by combination of the cytokines/factors described in table A. Factors as dexa (dexamethasone), ascorbate (ascorbid acid 2‐phosphate), ITS and nicot (nicotinamide) were not considered in the description. (c) Pictures showing the results obtained after completion of the protocols described in table B (30 days procedures) in terms of morphology analysed by optic microscopy (OM), albumin content assayed by immunocytochemistry and glycogen storage depicted by periodic acid‐Schiff (PAS) staining. Morphology and PAS staining pictures were taken at magnification ×400. Albumin staining pictures were taken at magnification ×200. (d) Calculation, for each group of differentiation, of the amount of cells displaying a hepatocyte‐like morphology or a positive staining for albumin or glycogen. Whereas similar morphological changes were observed in each procedure, the highest albumin and glycogen‐positive cell content was noticed in protocol no. 7. Values are presented as mean ± SD. Total cell count for each experiment is provided between brackets. (e) Values of urea secretion for each differentiation protocol at 30 days (n = 6 for each experiment). Urea production of the protocol no. 7 was significantly higher than all of the other protocols. P values are indicated in the graph (*P < 0.05, **P < 0.01, ***P < 0.001).
We estimated that 61.1 ± 1.1% of MDHLCs (n = 910) displayed hepatocyte‐like morphology, defined as round or polygonal shaped cells reduced in size, containing cytoplasmic granulations and central nucleus with prominent nucleolus (Fig. 3a). This phenotype was observed consistently in each sample induced to differentiate and could be maintained in culture up to 10 weeks, but reverted when cells were incubated in growth factor‐free medium. These morphological changes were also noted with maturation medium but here the cells obtained did not display other hepatocyte‐like features (Fig. 2c). Ultrastructural analysis demonstrated that MDHLCs acquired morphological features of high metabolic activity (prominent nucleolus, highly developed rough endoplasmic reticulum, enhanced content of mitochondria) and of mature hepatocytes (deposition of glycogen) (Fig. 3a).
Figure 3.
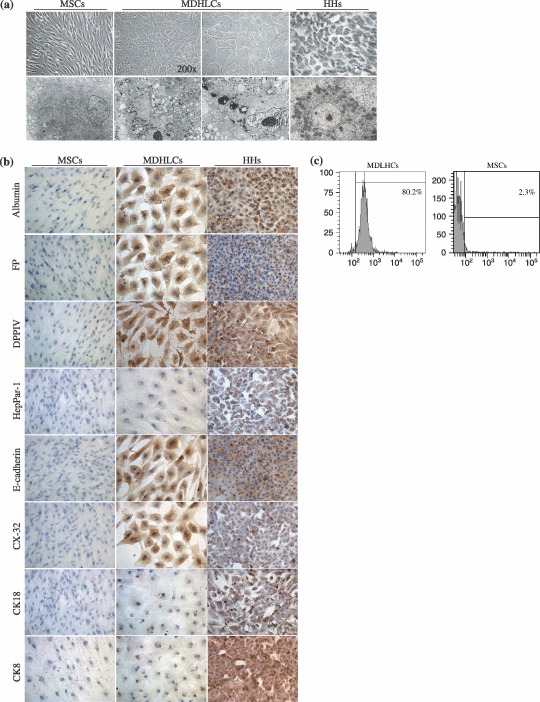
In vitro hepatocyte differentiation of human bone marrow‐MSCs. (a) Comparative aspect of MSCs, MDHLCs and HHs as observed in optic (OM) and electron (EM) microscopy. Pictures show that MDHLCs acquire round or polygonal‐shaped cells reduced in size and containing cytoplasmic granulations and central nucleus with prominent nucleolus. HHs comparative cell size was smaller. EM reveals that MDHLCs exhibited a higher content in cytoplasmic organites (endoplasmic reticulum, mitochondria) and a prominent nucleolus suggesting their enhanced metabolic activity. They produced intracytoplasmic glycogen vacuoles that are a hallmark of hepatocyte‐like functionality. Comparison with MSCs and HHs is provided. OM pictures were taken at magnification ×400 unless indicated and EM pictures magnification was ×4000. (b) MDHLCs immunostaining for hepatocyte markers showing positive expression of albumin, αFP, DPPIV and some epithelial markers (E‐cadherin, CX‐32) but not of HepPar‐1, CK8 and CK18. MSCs and HHs stainings were provided as negative and positive controls, respectively. Pictures were taken at magnification ×400. (c) Representative examples of albumin staining by flow cytometry in MDHLCs and MSCs. Bars indicate the fluorescence level of the corresponding isotype. αFP, α‐foetoprotein; CK18, cytokeratin 18; CX‐32, connexin‐32; DPPIV, dipeptidylpeptidase IV; HHs, human primary hepatocytes; MDHLCs, mesenchymal‐derived hepatocyte‐like cells; MSCs, mesenchymal stem cells.
Immunocytochemical analysis demonstrated that MDHLCs expressed albumin (9/14 samples tested), αFP (5/10), DPPIV (7/7), E‐cadherin (3/3) and connexin‐32 (4/4) (Fig. 3b) but did not express other epithelial markers such as CK8, CK18 and HepPar‐1 (Fig. 3b). Albumin positivity rate was calculated to be 71.1 ± 14.5% by flow cytometry (n = 5) in MDHLC populations while no staining was noted in MSCs (2.6 ± 2.0%, n = 3) (Fig. 3c).
Analysis of hepatocyte‐specific marker expression by RT‐PCR revealed that MDHLCs expressed albumin (3/5), αFP (5/6), α1‐antitrypsin (3/5), G6Pase (2/5), PEPCK (2/5), TAT (3/5), TDO (2/4) and c‐met (2/5) (Fig. 4). Although absent at the protein level, CK8 expression was noted in 2/5 samples. MDHLCs did not express CYP3A4, CYP2B6, HNF4 nor CK18 (n = 5 each).
Figure 4.
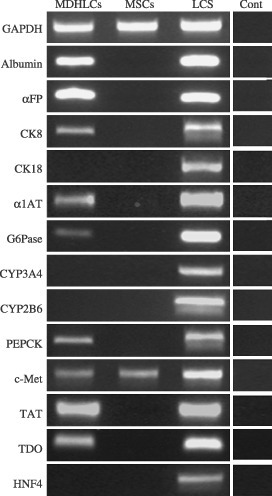
Analysis of hepatocyte and mesodermal markers expression by RT‐PCR in MDHLCs, MSCs (both on passage 1 to 3) and freshly isolated human liver cell suspension (LCS). The figure shows concomitant immature (αFP, CK8) and mature (albumin, α1AT, G6Pase, PEPCK, TAT, TDO) hepatocyte gene expression in MDHLCs while other markers are absent (CK18, CYP2A3, CYP2B6, HNF4). Both MSCs and MDHLCs expressed HGF receptor c‐met. Controls without reverse transcriptase (Cont) are shown for each analysed primer. Abbreviations of oligonucleotides are listed in Table 1.
Differences in the expression pattern of hepatocyte markers between MDHLC samples were not dependent on culture age, as we compared MDHLC populations of similar passages (passage 1–3). Moreover, these variations were observed up to passage 8 and could not be correlated to bone marrow sample characteristics (donor's age, cell proliferation rate) (Table 3).
Table 3.
Influence of BM‐MSCs culture characteristics on hepatic markers expression
| BM samples | |||||||
|---|---|---|---|---|---|---|---|
| 1 | 2 | 3 | 4 | 5 | 6 | ||
| BM data | BM donor age | 21 years | 47 years | 8 years | 34 years | 54 years | 28 years |
| Passage | P1 | P2 | P1 | P3 | P3 | P2 | |
| Growth | 34 PD | 23 PD | 31 PD | 28 PD | 29 PD | 26 PD | |
| RT‐PCR markers | Albumin | – | – | + | + | + | ND |
| αFP | – | + | + | + | + | + | |
| CK‐8 | + | – | – | + | ND | – | |
| CK‐18 | ND | – | – | – | – | – | |
| α1‐AT | + | + | – | – | + | ND | |
| G6Pase | – | ND | + | – | – | + | |
| CYP 3A4 | – | – | ND | – | – | – | |
| CYP 2B6 | – | – | ND | – | – | – | |
| TAT | + | + | – | + | ND | – | |
| TDO | ND | + | + | – | – | ND | |
| HNF4 | ND | – | – | – | – | – | |
| c‐Met | – | – | – | ND | + | + | |
| PEPCK | + | ND | – | – | – | + | |
| ICC markers | Albumin | – | – | + | + | + | + |
| αFP | – | + | – | – | + | + | |
| DPPIV | + | + | + | + | + | + | |
| CK8 | – | – | – | – | – | – | |
| CK18 | – | – | – | – | – | – | |
| HepPar‐1 | – | – | – | – | – | – | |
| Connexin‐32 | + | ND | ND | + | + | + | |
| E‐cadherin | ND | + | + | ND | + | ND | |
α1‐AT, α1‐antitrypsin; αFP, α‐foetoprotein; BM, bone marrow; CK, cytokeratin; CYP, cytochrome P450; DPPIV, dipeptidylpeptidase IV; G6Pase, glucose‐6‐phosphatase; HNF4, hepatic nuclear factor 4; ICC, immunocytochemistry; ND, not determined; P, passage; PD, population doublings; PEPCK, phosphoenolpyruvate carboxykinase; TAT, tyrosine aminotransferase; TDO, tryptophan‐2,3‐dioxygenase.
After having noticed variability in acquisition of hepatocyte markers in MDHLCs, we further evaluated maturation levels of these cells by studying their expression of mesenchymal markers. We observed that MDHLCs maintained MSC marker expression as assessed by immunofluorescence analysis, showing co‐expression of fibronectin and albumin, E‐cadherin and CX‐32, ASMA and αFP and vimentin plus albumin (Fig. 5a). No immunohistochemical staining was detected for these mesodermal antigens in primary human hepatocytes. These data were confirmed at mRNA level by demonstration of persistence of vimentin, ASMA and fibronectin expression in MDHLCs (Fig. 5b). We estimated the ratio of hepatocyte/mesenchymal marker coexpression by analysing co‐staining for albumin, CD73 and CD90 in MDHLCs (Fig. 5c) and observed that the majority of albumin‐positive cells co‐expressed the mesenchymal markers (for the albumin‐positive population, mean CD73 positivity was 56.5 ± 8.4% and mean CD90 positivity was 62.7 ± 10.7%) whereas 76.7 ± 14.1% of MDHLCs co‐expressed CD73 and CD90. Besides showing persistence of MSC markers in MDHLCs, flow cytometric analysis indicated that some markers were significantly down‐regulated in these cells compared to MSCs (Fig. 5d): CD44: 84.2 ± 7.5 versus 98.8 ± 0.8% (P < 0.05); CD29: 89.3 ± 6.6 versus 98.2 ± 1.7% (P < 0.05); CD73: 52.7 ± 5.9 versus 96.5 ± 5.2% (P < 0.001); CD105: 22.4 ± 4.2 versus 61.3 ± 16.3% (P < 0.05). Down‐regulation of CD49e (49.8 ± 18.9 versus 80.9 ± 14.0%) and CD49b (3.7 ± 0.5 versus 39.2 ± 25.0%) was not significant. MDHLCs did not modify the expression of CD90 (Thy‐1) (Fig. 5b) or HLA‐DR, HLA‐ABC, CD80 and CD86 (data not shown). Comparison of immunophenotype of MDHLCs with human hepatocytes demonstrated that the down‐regulation occurring in MDHLCs tended these cells to resemble to mature hepatocytes (Fig. 5d).
Figure 5.
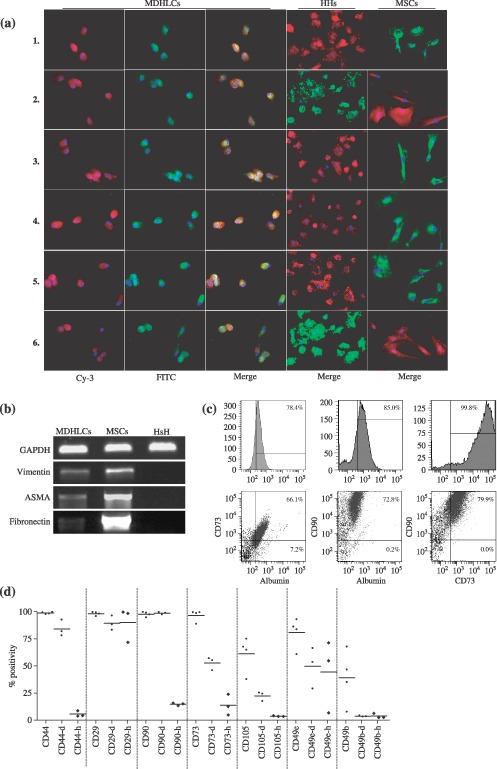
Characterization of the chimerical phenotype of MDHLCs. (a) Immunofluorescence assay showing co‐staining of MDHLCs, HHs and MSCs for albumin/fibronectin (1), ASMA/αFP (2), DPPIV/fibronectin (3), E‐cadherin/fibronectin (4), CX‐32/fibronectin (5) and vimentin/albumin (6). Pictures were taken at magnification ×300. (b) RT‐PCR analysis revealing the persistence of vimentin, ASMA and fibronectin expression in MDHLCs population. (c) Flow cytometry assay showing a representative example of albumin, CD73 and CD90 co‐staining on MDHLCs. (d) Comparative flow cytometric phenotype of MSCs (passage 2 to 4), MDHLCs (passage 1 to 3), and human hepatocytes. MDHLCs and hepatocytes are specified respectively by (‐d) and (‐h) suffixes. P values are indicated below graph (*P < 0.05, **P < 0.01, ***P < 0.001). αFP, α‐foetoprotein; ASMA, α‐smooth muscle actin; CX‐32, connexin‐32; DPPIV, dipeptidylpeptidase IV; HHs, human primary hepatocytes; MDHLCs, mesenchymal‐derived hepatocyte‐like cells; MSCs, mesenchymal stem cells.
We then studied the hepatocyte‐like functional activity of MDHLCs. We first evaluated glycogen production which was noticed in all analyzed samples, with a mean positivity of 21.1 ± 5.3% (calculation in three different random fields of each three samples at magnification ×200, total n cells = 1041) (Fig. 6a). Although G6Pase was expressed at the mRNA level, we could not detect enzyme activity in MDHLCs by cytochemical assay, despite 24 h incubation with 5 mm G6Pate (Fig. 6b). However, we detected significant urea production and noticed that this secretion was comparable to that of mouse hepatocytes (respectively 3.1 ± 0.5 and 4.1 ± 2.1 mm/30 000 cells *3 days compared to 0.2 ± 0.2 mm/30 000 cells *3 days for negative control) (Fig. 6c). Although this production appeared within 3 days of culture, it did not increase significantly but was maintained throughout the differentiation procedure (30 days). We also analysed MDHLC supernatants and did not detect any albumin secretion levels as assessed by two different ELISA assays. Compared to G6Pase, whereas MDHLCs displayed phosphoenolpyruvate carboxykinase (PEPCK) mRNA, we did not observe glucose neoformation after exposure to gluconeogenesis substrates (Fig. 6d).
Figure 6.
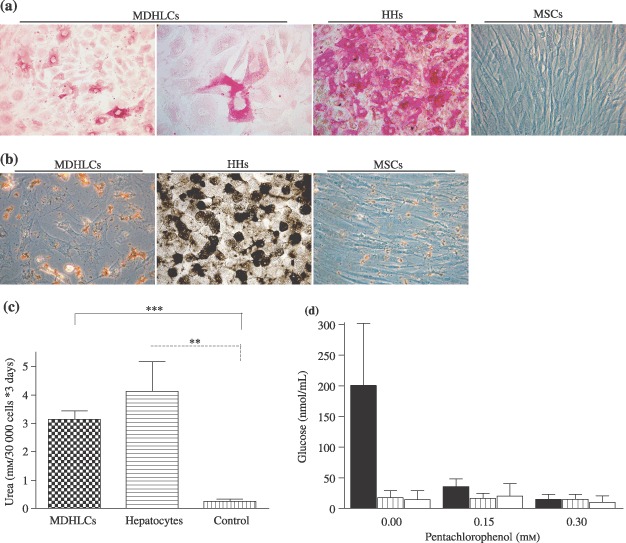
Functional characterization of MDHLCs. (a) Periodic acid‐Schiff (PAS) staining showing cytoplasmic glycogen deposition in MDHLCs as compared to HHs and MSCs. (b) G6Pase assay (n = 5) showing lack of enzyme activity in MDHLCs revealed by absence of brownish lead sulphide cytoplasmic precipitate. Positive and negative controls were performed respectively on HHs and MSCs. Similar results were obtained with overnight 5 mm G6Pate incubation. Pictures were taken at magnification ×400. (c) Colorimetric assay showing significant urea production in MDHLCs (n = 4) as compared to MSCs (n = 4). By comparison, no difference could be observed between the urea production of MDHLCs and mouse hepatocytes. (d) Gluconeogenesis assay showing the decrease of glucose neoformation in mouse hepatocytes (plain bars) after exposure of growing concentrations of pentachlorophenol. No glucose production was observed in MDHLCs (shaded bars) or in MSCs (empty bars) (n = 3 each). HHs, human primary hepatocytes; MDHLCs, mesenchymal‐derived hepatocyte‐like cells; MSCs, mesenchymal stem cells.
In vivo hepatocyte differentiation of mesenchymal stem cells
To investigate hepatocyte differentiation potential of MSCs in vivo, we transplanted these cells into spleens or livers of SCID mice subjected to a liver regeneration stimulus (Fig. 7). When they were injected into spleens of liver‐injured mice (groups A and B), we observed engrafted cells organized as single cells or as clusters and expressing fibronectin and αFP but not vimentin or albumin (Fig. 7a). We did not observe any difference in engraftment level or the marker expression between groups A and B, suggesting that equivalent hepatic regeneration stimulus was provided by hepatectomy or retrorsine–allylalcohol conditioning, in our experimental conditions (Table 4). Noticeable improvement of engraftment was obtained when MSCs were infused into the mouse livers (group C). In this group, engrafted cells analysed on serial sections displayed combined expression of mesodermal (fibronectin and vimentin) and hepatocyte markers (albumin and αFP) (Fig. 7a). When we differentiated MSCs prior to transplantation (groups D and E), cells expressed albumin and αFP but lost the expression of fibronectin and vimentin (Fig. 7a). We then explored CK18 expression in groups A, C and E and observed positive staining in cells engrafted after intrahepatic infusion (groups C and E) (Fig. 7b). Moreover, in group C, we noticed cell clusters co‐expressing CK18 together with albumin and fibronectin, confirming the chimaeric phenotype described above. No anti‐CK18 staining could be detected in group A (data not shown). Engraftment level was similar between MSC and MDHLC groups when comparing same injection site (Table 4). Specificity of each type of staining was ensured using appropriate controls (Fig. 8). We did not detect human albumin in mouse sera of any transplant groups (data not shown).
Figure 7.
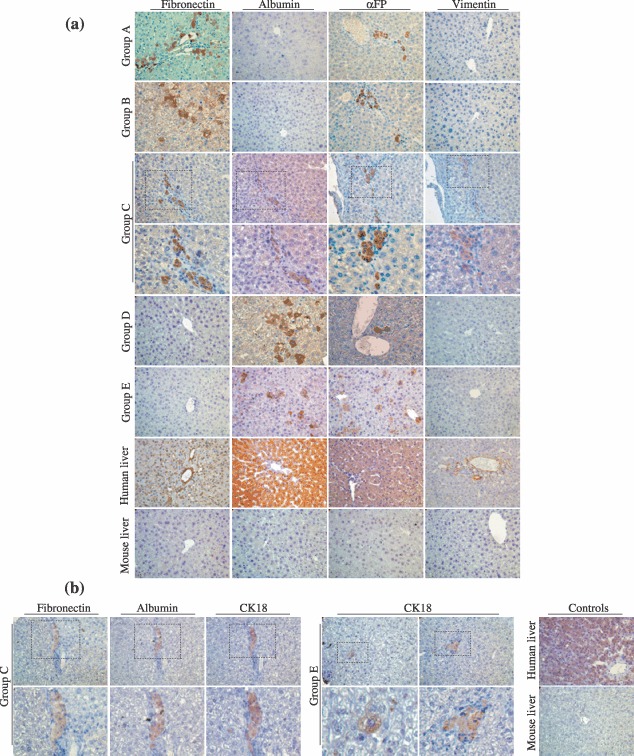
In vivo characterization of MSCs and MDHLCs after transplantation into SCID mice. (a) Analysis of in vivo differentiation potential of MSCs and MDHLCs. Pictures show immunostaining for human mesodermal (fibronectin, vimentin) and hepatocyte (albumin, αFP) antigens. In groups A and B, the engrafted cells formed clusters presenting staining for fibronectin or αFP separately. In group C, cell clusters co‐expressed mesodermal and hepatocyte markers as assessed by serial sections. In groups D and E, where MDHLCs were injected respectively into the spleen or the liver, the engrafted cell clusters expressed only hepatocyte markers. Stains were performed on human and mouse livers respectively as positive and negative controls. (b) Analysis of CK18 expression in groups C and E mice. In group C, the engrafted cells displayed co‐expression of fibronectin, albumin and CK18 whereas in group E, isolated staining for CK18 was observed in single or clustering cells. Control stains for CK18 were performed on human and mouse livers. Pictures were taken at magnification ×400. αFP, α‐foetoprotein.
Table 4.
Estimation of liver engraftment level after cell transplantation into SCID mice
| Groups | Fibronectin | Albumin | αFP | CK18 | ||||||||||||
|---|---|---|---|---|---|---|---|---|---|---|---|---|---|---|---|---|
| Cell clusters | Cells/ cluster | Isolated cells | Total cells | Cell clusters | Cells/ cluster | Isolated cells | Total cells | Cell clusters | Cells/ cluster | Isolated cells | Total cells | Cell clusters | Cells/ cluster | Isolated cells | Total cells | |
| A | 0.7 (0–2) | 28 (10–41) | 3.7 (0–15) | 16.5 (0–65) | 0 | 0 | 0 | 0 | 0.2 (0–1) | 9 (5–9) | 2 (0–8) | 4.2 (0–17) | 0 | 0 | 0 | 0 |
| B | 2.2 (0–5) | 11 (3–24) | 31.2 (0–67) | 50.5 (0–109) | 0 | 0 | 0 | 0 | 0 | 0 | 4.2 (0–17) | 4.2 (0–17) | ND | ND | ND | ND |
| C | 5 (0–12) | 11.8 (2–33) | 6.7 (0–17) | 65.7 (0–201) | 6.7 (0–16) | 8.7 (2–32) | 2.7 (0–12) | 60.8 (0–163) | 5.3 (0–12) | 8.7 (2–38) | 8.7 (0–26) | 55 (0–195) | 2.2 (0–6) | 9.6 (3–24) | 4.3 (0–19) | 26.7 (0–51) |
| D | 0 | 0 | 0 | 0 | 3.5 (0–8) | 4.8 (2–12) | 17 (0–39) | 33.7 (0–70) | 1.2 (0–3) | 6.8 (3–12) | 5.2 (3–7) | 13.7 (5–22) | ND | ND | ND | ND |
| E | 0 | 0 | 0 | 0 | 5.7 (0–9) | 5.6 (2–23) | 42.7 (3–70) | 74.3 (3–109) | 7.7 (3–15) | 8.3 (2–35) | 6.3 (0–15) | 70.3 (34–133) | 3.3 (0–7) | 7.5 (2–31) | 4.7 (3–7) | 28.3 (4–71) |
Values present the number of cell clusters, cell content of clusters, amount of isolated staining cells and total amount of cells per section for each group of staining performed in the mouse livers (minimum sections per group = 6). Data are provided as mean with range value in brackets. αFP, α‐foetoprotein; CK18, cytokeratin 18; ND, not documented; SCID, severe combined immune deficiency.
Figure 8.
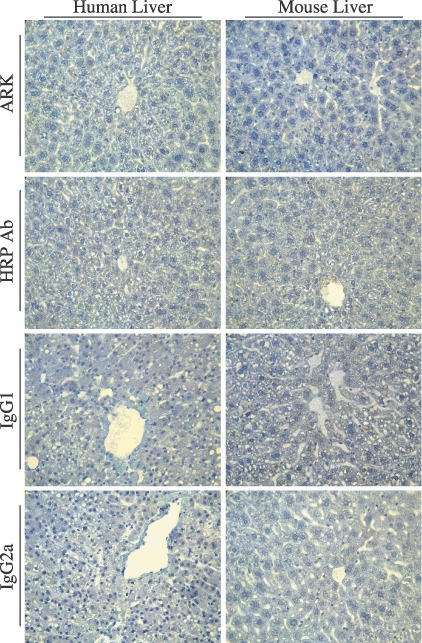
Control immunohistochemistry. Pictures show staining assays performed without primary antibodies using ARK kit (ARK) or HRP‐conjugated anti‐rabbit antibody (HRP Ab). For monoclonal antibodies, stains with corresponding isotypes were performed (IgG1 for anti‐albumin and CK18 antibodies, IgG2a for anti‐vimentin antibody). No cross‐reactivity was observed in any of these conditions. Pictures were taken at magnification ×400.
In parallel, we tracked engrafted human cells by staining nuclei with human Alu probe using in situ hybridization technique (Fig. 9). By analysis of co‐expression on serial sections, we demonstrated that these human Alu‐positive cells contained human protein fibronectin in their cytoplasm (Fig. 9).
Figure 9.
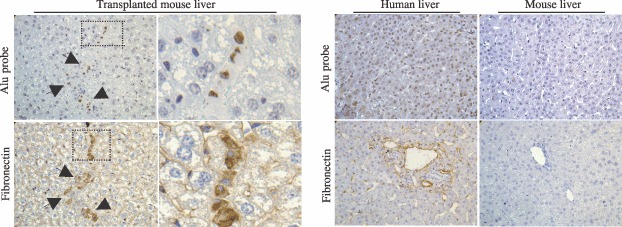
In vivo tracking of human cells. Pictures show that engrafted human cells were co‐stained at the nuclear level with Alu probe by in situ hybridization technique and at the cytoplasmic level with antihuman fibronectin antibody by immunohistochemical assay on serial sections. Human and mouse livers are provided respectively as positive and negative controls. Arrows indicate human positive cells. Pictures were taken at magnification ×400.
DISCUSSION
In this work, we provide clear demonstration of persistence of initial lineage phenotype, in MDHLCs, associated with incomplete acquisition of hepatocyte‐like features. We have produced evidence that in vitro, hepatocyte differentiation of MSCs is restricted to the phenotype level as depicted by morphological changes and specific marker expression. Because this expression associates both early and late differentiation markers, the MDHLC phenotype does not correspond to a defined differentiated state. Incomplete expression of hepatocyte markers indicated the partiality of the differentiation procedure. Besides positive staining for E‐cadherin and CX‐32, lack of CK8 and 18 protein expression in vitro suggested inability of MDHLCs to fully acquire a mature epithelial phenotype. Whereas this expression was rarely seen in vitro in differentiated MSCs (Hong et al. 2005; Oyagi et al. 2006), Sharma et al. have demonstrated lack of these parameters after differentiation of human cord blood cells in vivo (Sharma et al. 2005). Moreover, while MDHLCs expressed G6Pase and PEPCK genes, corresponding metabolic activities were not detected here. However, these cells were able to secrete small amounts of urea and to store glycogen as demonstrated in previous studies (Schwartz et al. 2002; Lee et al. 2004; Aurich et al. 2007; Chien et al. 2006). At cell population level, acquisition rate estimation of the observed hepatocyte‐specific features revealed that only a proportion of MDHLCs were engaged in the differentiation process. Furthermore, some of these features were not always associated with efficient differentiation, as, for instance, hepatocyte‐like morphological changes that were obtained with control medium (maturation medium). These data provided arguments concerning hepatocyte‐like commitment of MDHLCs while further advance is mandatory to demonstrate their capacity to acquire mature hepatocyte functionality (for review, see Hengstler et al. 2005). Furthermore, the usefulness of hepatic markers for demonstrating efficiency of differentiation could also be questioned, as some authors have described expression of such markers in undifferentiated cells (Avital et al. 2001; Kogler et al. 2004; Lee et al. 2004; Hong et al. 2005; Seo et al. 2005).
We have confirmed the partial differentiation status of MDHLCs by demonstrating persistent expression of mesenchymal markers in these cells. As reported by protein and gene expression analyses, MDHLCs retained expression of vimentin, fibronectin, ASMA and laminin. This was confirmed by flow cytometric analysis of albumin, CD73 and CD90 co‐expression. Nevertheless, flow cytometry identified some mesenchymal markers (CD44, CD29, CD73 and CD105) that were significantly down‐regulated in MDHLCs, these cells tending to resemble mature hepatocytes. It is noteworthy that these markers are mostly useful to identify MSCs and the onset of their preferential down‐regulation in MDHLCs could confirm that the cells represent a transitional state between MSCs and mature hepatocytes. This down‐regulation could be related to the presence of HGF in the differentiation cocktail as demonstrated for CD105 marker expression in MSCs (Forte et al. 2006).
These in vitro findings were corroborated in vivo by showing that MSCs maintained mesodermal marker expression while acquiring liver‐specific antigens. Spleen‐infused MSCs displayed elective expression of fibronectin and αFP regardless of hepatic regeneration stimulus used. Intrahepatic injection of MSCs was performed to evaluate influence on the expression profile of direct implantation of these cells into the liver microenvironment. We observed that liver‐infused MSCs had a complete pattern of mesenchymal and hepatocyte marker expression. Furthermore, we detected expression of the mature hepatocyte marker CK18, only in mice receiving intrahepatic cell injection indicating that direct in situ cell injection allowed further maturation of the hepatocyte‐like phenotype to take place. Compared to MSCs, engrafted MDHLCs lost mesenchymal marker expression suggesting that pre‐transplant conditioning was also an important factor for maturation of the cell phenotype in vivo. Further investigations will be necessary to determine whether MSCs exposed to the liver micro‐environment for longer term, would display similar maturation. However, no enhancement of repopulation rate could be observed with MDHLCs as compared to mice infused with MSCs. In the xenogeneic transplantation model, even if intrahepatic cell injection enhanced repopulation rates, these appeared to be weak over all procedures, reflecting a possibly inadequate environment such as immune reactions, cell‐to‐cell contacts (Bhatia et al. 1999), receptor factor interactions and more. We further assured human origin of the engrafted cells by showing co‐expression of human markers at the nuclear and cytoplasmic levels. Globally, our data were consistent with recent work suggesting positive influence of pre‐transplant HGF treatment in terms of MSCs engraftment in vivo. In contrast, Seo et al. obtained equivalent repopulation rates with pretreated or native adipose tissue‐derived stromal cells. We also have corroborated what have been described as haematopoietic (stem) cells (Fiegel et al. 2003; Kakinuma et al. 2003; Yamazaki et al. 2003; Jang et al. 2004; Ruhnke et al. 2005; Yamada et al. 2006) and other cell lineages (Lysy et al. 2007; von Mach et al. 2004; Nussler et al. 2006; Najimi et al. 2007) that have been suggested to display hepatocyte differentiational capability. However, recent work has provided strong arguments concerning the difficulty in obtaining hepatocyte features from haematopoietic stem cells efficiently, both in vitro and in vivo (Lian et al. 2006; Thorgeirsson & Grisham 2006; Yamaguchi et al. 2006).
In conclusion, in our hands, hepatocyte differentiation of MSCs appeared to be effective in producing phenotype‐restricted hepatocyte‐like cells presenting partially down‐regulated native mesenchymal markers. Absence of this chimaerism in vivo after MSC pre‐transplantation differentiation underlies the importance of the in vitro step for improvement of the yield of differentiation of engrafted cells. However, more investigations are required to evaluate whether chimaeric status of MDHLCs is associated with preserved advantageous properties of MSCs [less immunogenicity and immunomodulatory properties (Le Blanc & Ringden 2005), resistance to cryopreservation, proliferation potential or easiness of transfection (Javazon et al. 2004)] or conversely, whether the remaining mesodermal phenotype of these cells hampers the differentiation process. Elaboration of in vitro conditions, that mimic the liver microenvironment and allow enhanced hepatocyte‐specific metabolic activity of MDHLCs, is also mandatory.
ACKNOWLEDGEMENTS
The authors are grateful to Floriane André and Nawal Jazouli for excellent technical work, to Alberte Lefevre and Dr. Christine Sempoux for help with electron microscopy technique, to Sabine Paridaens and Prof. Pedro Buc‐Calderon for handling of gluconeogenesis assays, to Prof. Jean‐Christophe Renauld for providing SCID mice, and to Prof. Andreas K. Nüssler for having shared his experience in in situ hybridization technique. This work was supported by Grant F.N.R.S.: 1.1.058.07.F. and Grant F.R.S.M.: 3.4.572.02.F.
These authors (Mustapha Najimi and Etienne M. Sokal) equally contributed to the present work.
REFERENCES
- Anjos‐Afonso F, Siapati EK, Bonnet D (2004) In vivo contribution of murine mesenchymal stem cells into multiple cell‐types under minimal damage conditions. J. Cell Sci. 117, 5655–5664. [DOI] [PubMed] [Google Scholar]
- Aurich I, Mueller LP, Aurich H, Luetzkendorf J, Tisljar K, Dollinger M, Schormann W, Walldorf J, Hengstler J, Fleig WE, Christ B (2007) Functional integration of hepatocytes derived from human mesenchymal stem cells into mouse livers. Gut 56, 405–415. [DOI] [PMC free article] [PubMed] [Google Scholar]
- Avital I, Inderbitzin D, Aoki T, Tyan DB, Cohen AH, Ferraresso C, Rozga J, Arnaout WS, Demetriou AA (2001) Isolation, characterization, and transplantation of bone marrow‐derived hepatocyte stem cells. Biochem. Biophys. Res. Commun. 288, 156–164. [DOI] [PubMed] [Google Scholar]
- Barry FP, Murphy JM (2004) Mesenchymal stem cells: clinical applications and biological characterization. Int. J. Biochem. Cell Biol. 36, 568–584. [DOI] [PubMed] [Google Scholar]
- Beerheide W, Von Mach MA, Ringel M, Fleckenstein C, Schumann S, Renzing N, Hildebrandt A, Brenner W, Jensen O, Gebhard S, Reifenberg K, Bender J, Oesch F, Hengstler JG (2002) Downregulation of beta2‐microglobulin in human cord blood somatic stem cells after transplantation into livers of SCID mice: an escape mechanism of stem cells? Biochem. Biophys. Res. Commun. 294, 1052–1063. [DOI] [PubMed] [Google Scholar]
- Bhatia SN, Balis UJ, Yarmush ML, Toner M (1999) Effect of cell–cell interactions in preservation of cellular phenotype: cocultivation of hepatocytes and nonparenchymal cells. FASEB J. 13, 1883–1900. [DOI] [PubMed] [Google Scholar]
- Bieback K, Kern S, Kluter H, Eichler H (2004) Critical parameters for the isolation of mesenchymal stem cells from umbilical cord blood. Stem Cells 22, 625–634. [DOI] [PubMed] [Google Scholar]
- Chien CC, Yen BL, Lee FK, Lai TH, Chen YC, Chan SH, Huang HI (2006) In vitro differentiation of human placenta‐derived multipotent cells into hepatocyte‐like cells. Stem Cells 24, 1759–1768. [DOI] [PubMed] [Google Scholar]
- Fiegel HC, Lioznov MV, Cortes‐Dericks L, Lange C, Kluth D, Fehse B, Zander AR (2003) Liver‐specific gene expression in cultured human hematopoietic stem cells. Stem Cells 21, 98–104. [DOI] [PubMed] [Google Scholar]
- Forte G, Minieri M, Cossa P, Antenucci D, Sala M, Gnocchi V, Fiaccavento R, Carotenuto F, De Vito P, Baldini PM, Prat M, Di Nardo P (2006) Hepatocyte growth factor effects on mesenchymal stem cells: proliferation, migration, and differentiation. Stem Cells 24, 23–33. [DOI] [PubMed] [Google Scholar]
- Heng BC, Yu H, Yin Y, Lim SG, Cao T (2005) Factors influencing stem cell differentiation into the hepatic lineage in vitro . J. Gastroenterol. Hepatol. 20, 975–987. [DOI] [PubMed] [Google Scholar]
- Hengstler JG, Brulport M, Schormann W, Bauer A, Hermes M, Nussler AK, Fandrich F, Ruhnke M, Ungefroren H, Griffin L, Bockamp E, Oesch F, Von Mach MA (2005) Generation of human hepatocytes by stem cell technology: definition of the hepatocyte. Expert. Opin. Drug Metab. Toxicol. 1, 61–74. [DOI] [PubMed] [Google Scholar]
- Herzog EL, Chai L, Krause DS (2003) Plasticity of marrow‐derived stem cells. Blood 102, 3483–3493. [DOI] [PubMed] [Google Scholar]
- Hong SH, Gang EJ, Jeong JA, Ahn C, Hwang SH, Yang IH, Park HK, Han H, Kim H (2005) In vitro differentiation of human umbilical cord blood‐derived mesenchymal stem cells into hepatocyte‐like cells. Biochem. Biophys. Res. Commun. 330, 1153–1161. [DOI] [PubMed] [Google Scholar]
- Jang YY, Collector MI, Baylin SB, Diehl AM, Sharkis SJ (2004) Hematopoietic stem cells convert into liver cells within days without fusion. Nat. Cell Biol. 6, 532–539. [DOI] [PubMed] [Google Scholar]
- Javazon EH, Beggs KJ, Flake AW (2004) Mesenchymal stem cells: paradoxes of passaging. Exp. Hematol. 32, 414–425. [DOI] [PubMed] [Google Scholar]
- Kakinuma S, Tanaka Y, Chinzei R, Watanabe M, Shimizu‐Saito K, Hara Y, Teramoto K, Arii S, Sato C, Takase K, Yasumizu T, Teraoka H (2003) Human umbilical cord blood as a source of transplantable hepatic progenitor cells. Stem Cells 21, 217–227. [DOI] [PubMed] [Google Scholar]
- Kogler G, Sensken S, Airey JA, Trapp T, Muschen M, Feldhahn N, Liedtke S, Sorg RV, Fischer J, Rosenbaum C, Greschat S, Knipper A, Bender J, Degistirici O, Gao J, Caplan AI, Colletti EJ, Almeida‐Porada G, Muller HW, Zanjani E, Wernet P (2004) A new human somatic stem cell from placental cord blood with intrinsic pluripotent differentiation potential. J. Exp. Med. 200, 123–135. [DOI] [PMC free article] [PubMed] [Google Scholar]
- Laconi S, Pillai S, Porcu PP, Shafritz DA, Pani P, Laconi E (2001) Massive liver replacement by transplanted hepatocytes in the absence of exogenous growth stimuli in rats treated with retrorsine. Am. J. Pathol. 158, 771–777. [DOI] [PMC free article] [PubMed] [Google Scholar]
- Lavon N, Benvenisty N (2005) Study of hepatocyte differentiation using embryonic stem cells. J. Cell. Biochem. 96, 1193–1202. [DOI] [PubMed] [Google Scholar]
- Le Blanc K, Ringden O (2005) Immunobiology of human mesenchymal stem cells and future use in hematopoietic stem cell transplantation. Biol. Blood Marrow Transplant. 11, 321–334. [DOI] [PubMed] [Google Scholar]
- Lee KD, Kuo TK, Whang‐Peng J, Chung YF, Lin CT, Chou SH, Chen JR, Chen YP, Lee OK (2004) In vitro hepatic differentiation of human mesenchymal stem cells. Hepatology 40, 1275–1284. [DOI] [PubMed] [Google Scholar]
- Lefebvre V, Goffin I, Buc‐Calderon P (1994) Fructose metabolism and cell survival in freshly isolated rat hepatocytes incubated under hypoxic conditions: proposals for potential clinical use. Hepatology 20, 1567–1576. [DOI] [PubMed] [Google Scholar]
- Lian G, Wang C, Teng C, Zhang C, Du L, Zhong Q, Miao C, Ding M, Deng H (2006) Failure of hepatocyte marker‐expressing hematopoietic progenitor cells to efficiently convert into hepatocytes in vitro . Exp. Hematol. 34, 348–358. [DOI] [PubMed] [Google Scholar]
- Lysy PA, Smets F, Sibille C, Najimi M, Sokal EM (2007) Human skin fibroblasts: from mesodermal to hepatocyte‐like differentiation. Hepatology 46, 1574 –1585. [DOI] [PubMed] [Google Scholar]
- Von Mach MA, Hengstler JG, Brulport M, Eberhardt M, Schormann W, Hermes M, Prawitt D, Zabel B, Grosche J, Reichenbach A, Muller B, Weilemann LS, Zulewski H (2004) In vitro cultured islet‐derived progenitor cells of human origin express human albumin in severe combined immunodeficiency mouse liver in vivo . Stem Cells 22, 1134–1141. [DOI] [PubMed] [Google Scholar]
- Martin‐Rendon E, Watt SM (2003) Stem cell plasticity. Br. J. Haematol. 122, 877–891. [DOI] [PubMed] [Google Scholar]
- Menthena A, Deb N, Oertel M, Grozdanov PN, Sandhu J, Shah S, Guha C, Shafritz DA, Dabeva MD (2004) Bone marrow progenitors are not the source of expanding oval cells in injured liver. Stem Cells 22, 1049–1061. [DOI] [PubMed] [Google Scholar]
- Najimi M, Khuu DN, Lysy PA, Jazouli N, Abarca J, Sempoux C, Sokal EM (2007) Adult derived human liver mesenchymal‐like cells as a potential progenitors reservoir of hepatocytes? Cell Transplant. 16, 717–728. [DOI] [PubMed] [Google Scholar]
- Nussler A, Konig S, Ott M, Sokal E, Christ B, Thasler W, Brulport M, Gabelein G, Schormann W, Schulze M, Ellis E, Kraemer M, Nocken F, Fleig W, Manns M, Strom SC, Hengstler JG (2006) Present status and perspectives of cell‐based therapies for liver diseases. J. Hepatol. 45, 144–159. [DOI] [PubMed] [Google Scholar]
- Oyagi S, Hirose M, Kojima M, Okuyama M, Kawase M, Nakamura T, Ohgushi H, Yagi K (2006) Therapeutic effect of transplanting HGF‐treated bone marrow mesenchymal cells into CCl4‐injured rats. J. Hepatol. 44, 742–748. [DOI] [PubMed] [Google Scholar]
- Piscaglia AC, Di Campli C, Zocco MA, Di Gioacchino G, Novi M, Rutella S, Bonanno G, Monego G, Vecchio FM, Michetti F, Mancuso S, Leone G, Gasbarrini G, Pola P, Gasbarrini A (2005) Human cordonal stem cell intraperitoneal injection can represent a rescue therapy after an acute hepatic damage in immunocompetent rats. Transplant. Proc. 37, 2711–2714. [DOI] [PubMed] [Google Scholar]
- Pittenger MF, Mackay AM, Beck SC, Jaiswal RK, Douglas R, Mosca JD, Moorman MA, Simonetti DW, Craig S, Marshak DR (1999) Multilineage potential of adult human mesenchymal stem cells. Science 284, 143–147. [DOI] [PubMed] [Google Scholar]
- Popp FC, Slowik P, Eggenhofer E, Renner P, Lang SA, Stoeltzing O, Geissler EK, Piso P, Schlitt HJ, Dahlke MH (2006) No contribution of multipotent mesenchymal stromal cells to liver regeneration in a rat model of prolonged hepatic injury. Stem Cells 25, 639–645. [DOI] [PubMed] [Google Scholar]
- Ruhnke M, Nussler AK, Ungefroren H, Hengstler JG, Kremer B, Hoeckh W, Gottwald T, Heeckt P, Fandrich F (2005) Human monocyte‐derived neohepatocytes: a promising alternative to primary human hepatocytes for autologous cell therapy. Transplantation 79, 1097–1103. [DOI] [PubMed] [Google Scholar]
- Sato Y, Araki H, Kato J, Nakamura K, Kawano Y, Kobune M, Sato T, Miyanishi K, Takayama T, Takahashi M, Takimoto R, Iyama S, Matsunaga T, Ohtani S, Matsuura A, Hamada H, Niitsu Y (2005) Human mesenchymal stem cells xenografted directly to rat liver differentiated into human hepatocytes without fusion. Blood 106, 756–763. [DOI] [PubMed] [Google Scholar]
- Schwartz RE, Reyes M, Koodie L, Jiang Y, Blackstad M, Lund T, Lenvik T, Johnson S, Hu WS, Verfaillie CM (2002) Multipotent adult progenitor cells from bone marrow differentiate into functional hepatocyte‐like cells. J. Clin. Invest. 109, 1291–1302. [DOI] [PMC free article] [PubMed] [Google Scholar]
- Seo MJ, Suh SY, Bae YC, Jung JS (2005) Differentiation of human adipose stromal cells into hepatic lineage in vitro and in vivo . Biochem. Biophys. Res. Commun. 328, 258–264. [DOI] [PubMed] [Google Scholar]
- Sharma AD, Cantz T, Richter R, Eckert K, Henschler R, Wilkens L, Jochheim‐Richter A, Arseniev L, Ott M (2005) Human cord blood stem cells generate human cytokeratin 18‐negative hepatocyte‐like cells in injured mouse liver. Am. J. Pathol. 167, 555–564. [DOI] [PMC free article] [PubMed] [Google Scholar]
- Sokal EM, Trivedi P, Cheeseman P, Portmann B, Mowat AP (1989) The application of quantitative cytochemistry to study the acinar distribution of enzymatic activities in human liver biopsy sections. J. Hepatol. 9, 42–48. [DOI] [PubMed] [Google Scholar]
- Talens‐Visconti R, Bonora A, Jover R, Mirabet V, Carbonell F, Castell JV, Gomez‐Lechon MJ (2006) Hepatogenic differentiation of human mesenchymal stem cells from adipose tissue in comparison with bone marrow mesenchymal stem cells. World J. Gastroenterol. 12, 5834–5845. [DOI] [PMC free article] [PubMed] [Google Scholar]
- Thorgeirsson SS, Grisham JW (2006) Hematopoietic cells as hepatocyte stem cells: a critical review of the evidence. Hepatology 43, 2–8. [DOI] [PubMed] [Google Scholar]
- Wang PP, Wang JH, Yan ZP, Hu MY, Lau GK, Fan ST, Luk JM (2004) Expression of hepatocyte‐like phenotypes in bone marrow stromal cells after HGF induction. Biochem. Biophys. Res. Commun. 320, 712–716. [DOI] [PubMed] [Google Scholar]
- Yamada Y, Nishimoto E, Mitsuya H, Yonemura Y (2006) In vitro transdifferentiation of adult bone marrow Sca‐1+ cKit‐cells cocultured with fetal liver cells into hepatic‐like cells without fusion. Exp. Hematol. 34, 97–106. [DOI] [PubMed] [Google Scholar]
- Yamaguchi K, Itoh K, Masuda T, Umemura A, Baum C, Itoh Y, Okanoue T, Fujita J (2006) In vivo selection of transduced hematopoietic stem cells and little evidence of their conversion into hepatocytes in vivo . J. Hepatol. 45, 681–687. [DOI] [PubMed] [Google Scholar]
- Yamazaki S, Miki K, Hasegawa K, Sata M, Takayama T, Makuuchi M (2003) Sera from liver failure patients and a demethylating agent stimulate transdifferentiation of murine bone marrow cells into hepatocytes in coculture with nonparenchymal liver cells. J. Hepatol. 39, 17–23. [DOI] [PubMed] [Google Scholar]
- Yavorkovsky L, Lai E, Ilic Z, Sell S (1995) Participation of small intraportal stem cells in the restitutive response of the liver to periportal necrosis induced by allyl alcohol. Hepatology 21, 1702–1712. [PubMed] [Google Scholar]
- Zaret KS (2001) Hepatocyte differentiation: from the endoderm and beyond. Curr. Opin. Genet. Dev. 11, 568–574. [DOI] [PubMed] [Google Scholar]