

Abstract
Objective: The mechanisms that regulate mitogenic and antiapoptotic signals in primary effusion lymphoma (PEL) are not well known. In efforts to identify novel approaches to block the proliferation of PEL cells, we assessed the effect of apigenin (4′,5,7‐trihydroxyflavone), a flavonoid on a panel of PEL cell lines.
Materials and methods: We studied the effect of apigenin on four PEL cell lines. Apoptosis was measured by annexin V/PI dual staining and DNA laddering. Protein expression was measured by immunoblotting.
Results: Apigenin induced apoptosis in PEL cell lines in a dose dependent manner. Such effects of apigenin appeared to result from suppression of constitutively active kinase AKT resulting in down‐regulation of SKP2, hypo‐phosphorylation of Rb and accumulation of p27Kip1. Apigenin treatment of PEL cells caused dephosphorylation of p‐Bad protein leading to down regulation of the anti‐apoptotic protein, Bcl‐2 and an increase in Bax/Bcl2 ratio. Apigenin treatment also triggered Bax conformational change and subsequently translocation from cytosole to mitochondria causing loss of mitochondrial membrane potential with subsequent release of cytochrome c. Released cytochrome c onto the cytosole activated caspase‐9 and caspase‐3, followed by polyadenosin‐5′‐diphosphate‐ribose polymerase (PARP) cleavage. Finally, treatment of PEL cells with apigenin down‐regulated the expression of inhibitor of apoptosis protein (IAPs).
Conclusions: Altogether, these data suggest a novel function for apigenin, acting as a suppressor of AKT/PKB pathway in PEL cells, and raise the possibility that this agent may have a future therapeutic role in PEL and possibly other malignancies with constitutive activation of the AKT/PKB pathway.
Introduction
Primary effusion lymphoma (PEL), a subtype of non‐Hodgkin’s B‐cell lymphoma, is mainly present in patients with advanced AIDS, but is sometimes also found in human immunodeficiency virus (HIV)‐negative individuals (1). PEL cells grow as a lymphomatous effusion in body cavities and are infected with Kaposi sarcoma‐associated herpesvirus (KSHV/HHV‐8). Most cases show dual infection with Epstein–Barr virus (EBV/HHV‐4) (2). Pleural and abdominal effusions from patients with AIDS‐PEL contain a number of cytokines, which serve as autocrine growth factors (3). For example, IL‐10 has been reported to serve as an autocrine growth factor for AIDS‐related B‐cell lymphoma (4). Recently, it has also been shown that PEL cells use viral IL‐6 and IL‐10 in an autocrine fashion for their survival and proliferation (3, 4). A number of constitutively activated signalling pathways play critical roles in survival and growth of PEL cells. These include JAK/STAT, NF‐κB and PI3‐kinase (5, 6, 7). Considerable evidence demonstrates the role of PI3′‐kinase/AKT signalling in oncogenic transformation and cancer progression (8, 9, 10). AKT prevents apoptosis by generating anti‐apoptotic signals through modulation of activity of various survival and proapoptotic molecules (11, 12, 13, 14). Activation of AKT promotes cell survival by directly phosphorylating key apoptotic regulators BAD and members of the Foxo family of transcription factors (15). The PI3‐kinase/AKT pathway controls expression of cell‐cycle regulatory proteins, such as p27Kip1, and deregulated cell cycle control is an important constituent of all cancers. Several lines of evidence show that SKP2 and p27Kip1 are central players in the pathogenesis of various malignancies (15, 16, 17, 18). PI3K/AKT signalling is known to control SKP2 transcription in different cellular systems (16, 17) and it regulates SKP2 gene transcription by controlling a cis‐acting element in the proximal human SKP2 gene promoter (18). Reduced p27Kip1 protein level has been shown in a variety of malignant cells (19, 20). There is no evidence of p27Kip1 mutations, instead, wild‐type p27Kip1 protein has been shown to be commonly reduced because of deregulation of SKP2 through ubiquitin‐mediated degradation (19, 20). Interestingly, SKP2 is frequently up‐regulated in human cancers or in some cases, such as lung cancer, the SKP2 gene is amplified (19, 20, 21). Interestingly, we have observed that PEL cell lines that display lower levels of p27Kip1 show a high level of SKP2.
The Bcl‐2 family is now well characterized consisting of pro‐survival members related to Bcl‐2, and proapoptotic proteins such as Bax and Bak [that can act as primary initiators of mitochondrial disruption (15)] or the BH3‐only proteins such as Bid, Bim and Bad that can act as modulators of these processes (22).
Apigenin (4’,5, 7‐trihydroxyflavone) is a common dietary flavonoid found in fruit and vegetables (23). It has been used as a dietary supplement and has become an attractive compound for cancer research studies because of its anti‐tumour properties (24). Apigenin has been shown to possess growth inhibitory abilities against many human cancer cell lines including breast, colon, thyroid, leukaemia and prostate cancer (25, 26, 27, 28, 29). There has been particular interest for the potential use of apigenin as an anti‐cancer agent because of its low intrinsic toxicity and lack of mutagenic properties, compared to other structurally related flavonoids (30). Although apigenin has been shown to have anti‐tumourigenic effects, that specifically on primary effusion lymphoma remains unknown. Here, we investigated anti‐tumour activity of apigenin against human primary effusion lymphoma cell lines.
In this study, we show for the first time that apigenin induces apoptosis of PEL cells. Apigenin inhibits the constitutive activation AKT/PKB leading to de‐accumulation of p27Kip1 via hypophoshorylation of RB and down‐regulation of SKP2. Apigenin treatment of PEL cells resulted in dephosphorylation of Bad leading to down‐regulation of Bcl2 and increase in the Bax/Bcl‐2 ratio. This leads to conformational changes of Bax protein, loss of mitochondrial membrane potential and subsequent release of cytochrome c, as well as down‐regulation of IAPs and activation of caspase‐dependent apoptosis.
Materials and methods
Cell culture and treatment
Human PEL (BC1, BC3, BCBL1 and HBL‐6) cell lines were obtained from American Type Culture Collection (ATCC), (Rockville, MD, USA) and cultured in RPMI 1640 medium supplemented with 10% (v/v) foetal bovine serum (FBS), 100 U/ml penicillin and 100 U/ml streptomycin at 37 °C in a humidified atmosphere containing 5% CO2. BC1 and HBL‐6 cell lines were co‐infected with EBV and HHV‐8, while BC3 and BCBL1 cell lines were HHV‐8 positive only. All experiments were performed in 5% FBS, in triplicate. Apigenin was used in different concentrations ranging between 0 and 100 μm dissolved in dimethyl sulphoxide (DMSO). DMSO was added to untreated samples to exclude DMSO toxicity.
Reagents and antibodies
Apigenin and Bax 6A7 monoclonal antibodies were purchased from Sigma Chemical Co (St. Louis, MO, USA). Bcl‐2 antibody was purchased from Dako (Carpenteria, CA, USA). zVAD‐fmk and caspase‐9 antibodies were purchased from Calbiochem (San Diego, CA, USA). p‐AKT, p‐FKHR, p‐GSK3, cleaved caspase‐3, p‐Bad and BID antibodies were purchased from Cell Signaling Technologies (Beverly, MA, USA). Caspase‐3, PARP, cytochrome c, Bax and beta‐actin antibodies were purchased from Santa Cruz Biotechnology Inc. (Santa Cruz, CA, USA). Caspase‐8, cIAP1 and XIAP antibodies were purchased from R&D (Minneapolis, MN, USA). TUNEL assay kit, ZB4 and CH11 antibodies were obtained from MBL (Watertown, MA, USA). AnnexinV/PI assay kit was purchased from Molecular Probes (Eugene, OR, USA). JC1 and mitochondrial incubation buffer were purchased from Alexis (San Diego, CA, USA).
Cell death assay
After indicated treatments with apigenin, cells were incubated with trypan blue for 5–10 min at room temperature. Trypan blue‐positive and total cells were counted per microscope field for a total of four fields per condition. The proportion of cell death was calculated by dividing the number of dead cells by total number/field.
Cell cycle analysis
Cell lines were treated with, or without apigenin for 24 h, were washed once in phosphate‐buffered saline (PBS) and re‐suspended in 500 μl hypotonic staining buffer (sodium citrate 250 mg, TritonX 0.75 ml, propidium iodide 25 μg, ribonuclease A 5 μg and 250 ml water) and analysed by flow cytometry as described previously (31).
Annexin V staining
Cell lines were treated with different concentrations of apigenin as described in the figure legends. Cells were harvested and percentage of apoptosis was measured by flow cytometry after staining with flourescein‐conjugated annexin‐V and propidium iodide (PI) as described previously (32). We scored viable cells as those that were negative for annexin V and PI. Percentage of apoptosis was calculated from reduction of the number of viable cells between treated and untreated samples. The amount of necrotic cells (annexin V negative, PI positive) was always minimal.
TUNEL assay
Cell lines were treated with apigenin as described in the figure legends. Apoptotic cells were measured using the TUNEL assay as described earlier (33). Briefly, after 24 h treatment with different concentrations of apigenin, 1 × 10⁶ cells were washed twice in PBS containing 0.2% BSA and fixed with 4% paraformaldehyde at 4 °C for 30 min. This was followed by two washes in PBS containing 0.2% BSA. Cells were permeabilized in 70% ethanol at –20 °C for 30 min then washed twice and incubated with 30 μl of TdT buffer (MBL; Watertown) (Tdt buffer II, FITC‐dUTP and TdT in the ratio of 18:1:1) for 1 h at 37 °C. This was followed by two washes in PBS and cells were re‐suspended in 500 μl of PBS. Stained cells were analysed using FACScan flow cytometry equipped with a Cell Quest data analysis program (Beckon Dickinson, San Diego, CA, USA).
DNA laddering
2 × 10⁶ cells were treated with and without apigenin for 24 h and cells were harvested and DNA was isolated using DNA laddering kit from Roche as described previously (34). After measuring the DNA, 2 μg of DNA was electrophoresed on a 1.5% agarose gel containing ethidium bromide at 75 v for 2 h and visualized using a UV light source.
RT‐PCR assays
Total RNA was extracted after treatment with 25 and 50 μm apigenin for 24 h using TRIZOL, and reverse‐transcribed with random hexamers. RT‐PCR amplifications were performed using the following primers:
AKT1‐For: GCTGGACGATAGCTTGGA,
AKT1‐Rev: GATGACAGATAGCTGGTG,
AKT2‐For: GGCCCCTGATGAGACTCTA,
AKT2‐Rev: TCCTCAGTCGTGGAGGAGT, and AKT3‐For: GCAAGTGGACAGGAATAAGTCTC,
AKT3‐Rev: ACAATGGTGGGCTCATGACTTCC for 35 cycles (55 °C annealing temperature) to yield 382, 275 and 328 bp products respectively. Amplification of GAPDH was used as an internal control.
Quantification analysis using real‐time RT‐PCR
All reactions were performed in glass capillaries (Roche, Mannheim, Germany) with a final reaction volume of 10 μl of 1× LightCycler‐FastStart DNA Master SYBR Green I reaction mixture (Roche) containing FastStart Taq, reaction buffer, deoxynucleotide triphosphate, 1 mm MgCl2, and final concentrations of 0.5 μm for each primer. Thermocycling and detection were performed using the LightCycler (Roche). Quantification for fold changes was carried out using Pfaffle methodology as described previously (31).
Cell lysis and immunoblotting
Cells were treated with apigenin as described in the figure legends and lysed as described previously (35). Briefly, cell pellets were re‐suspended in phosphorylation lysis buffer (0.5–1.0% Triton X‐100, 150 mm NaCl, 1 mm EDTA, 200 μm sodium orthovanadate, 10 mm sodium pyrophosphate, 100 mm sodium fluoride, 1.5 mm magnesium chloride, 1 mm/l phenylmethylsulphonyl‐fluoride and 10 μg/ml aprotonin). Protein concentrations were assessed using the Bradford assay before loading the samples. Equal amounts of proteins were separated by SDS–PAGE and transferred to polyvinylidene difluoride membrane (Immobilion; Millipore, Bellerica, MA, USA). Immunoblotting was performed with the appropriate antibodies and visualized using an enhanced chemiluminescence method (ECL; Amersham, Piscataway, NJ, USA, USA).
Gene silencing using siRNA
AKT and SKP2 siRNA and Scrambled control siRNA were purchased from Qiagen (Hilden, Germany). For transient expression, cell lines were transfected using LipofectAMINE 2000 reagent (Invitrogen, Carlsbad, CA, USA) according to the manufacturer’s instructions. After incubating the cells for 6 h, lipid and siRNA complex was removed and fresh growth medium was added. Cells were lysed 48 h after transfection and specific protein levels were determined using Western blot analysis with specific antibodies against the targeted proteins, and actin as loading control.
Detection of Bax conformational changes
This assay was performed as described previously (31). Briefly, after treatment with apigenin for indicated time points, cells were harvested and washed in PBS, and then lysed using Chaps lysis buffer [10 mm HEPES (pH 7.4), 150 mm NaCl, 1% Chaps] containing protease inhibitors. Protein concentrations were assessed using the Bradford assay and 500 μg of total protein was incubated with 2 μg of anti‐Bax 6A7 monoclonal antibody for 2 h at 4 °C. After incubation, 25 μl of protein G‐beads were added and incubated at 4 °C overnight on a shaker with gentle agitation. After five washes in Chaps lysis buffer, samples were separated by SDS–PAGE, transferred and immunoblotted using N20 Bax polyclonal antibody.
Measurement of mitochondrial potential using the JC‐1 (5, 5′, 6, 6′‐tetrachloro‐1, 1′, 3,3′‐ tetraethylbenzimidazolylcarbocyanine iodide) assay kit
1 × 10⁶ cells were treated with apigenin for 24 h. Cells were washed twice in PBS and suspended in mitochondrial incubation buffer (Alexis Corp, Farmingdale, NY, USA). JC1 was added to a final concentration of 10 μm and cells were incubated at 37 °C in the dark for 15 min. Cells were washed twice in PBS and re‐suspended in 500 μl of mitochondrial incubation buffer and mitochondrial membrane potential (% of green and red aggregates) was determined by flow cytometry as described previously (36).
Assay for cytochrome c release
Release of cytochrome c from mitochondria was assayed as described earlier (37). Briefly, cells were treated with and without apigenin as described in the figure legends, and centrifuged at 1000 g for 10 min at 4 °C. Cell pellets were re‐suspended in five volumes of hypotonic buffer [20 mm HEPES (pH 7.4), 10 mm KCl, 1.5 mm MgCl2, 1 mm EDTA, 1 mm EGTA, 1 mm DTT, 20 μg/ml leupeptin, 10 μg/ml aprotonin and 250 mm sucrose] and incubated for 15 min on ice. Cells were completely lysed by passing them 15–20 times through a 22 gauge needle that was 1.5cm long. Lysates were centrifuged at 1000 g for 5 min at 4 °C to pellet nuclei and unbroken cells. Supernatants were collected and centrifuged at 12 000 g for 15 min. Resulting mitochondrial pellets were re‐suspended in lysis buffer. Supernatants were transferred to new tubes and centrifuged again at 12 000 g for 15 min and resulting supernatants, representing cytosolic fractions, were separated. 15–20 μg proteins from cytosolic fraction as well as mitochondrial fraction of each sample were analysed by immunoblotting using an anti‐cytochrome c antibody.
Statistical Analysis
Data are presented as mean ± SD. Comparisons between groups were made using the paired Student’s t‐test. Values of P < 0.05 were considered statistically significant.
Results
Effect of apigenin on cell cycle and apoptosis in PEL cells
We initially sought to determine whether apigenin treatment lead to cell death in PEL cell lines. BC1, BC3, BCBL and HBL‐6 cells were cultured in the presence or absence of 0, 10, 25, 50 and 100 μm apigenin for 24 h and cell death was subsequently assessed. Figure 1a shows that as dose of apigenin increased from 10 to 100 μm, cell death increased in a dose‐dependent fashion in all the PEL cell lines.
Figure 1.
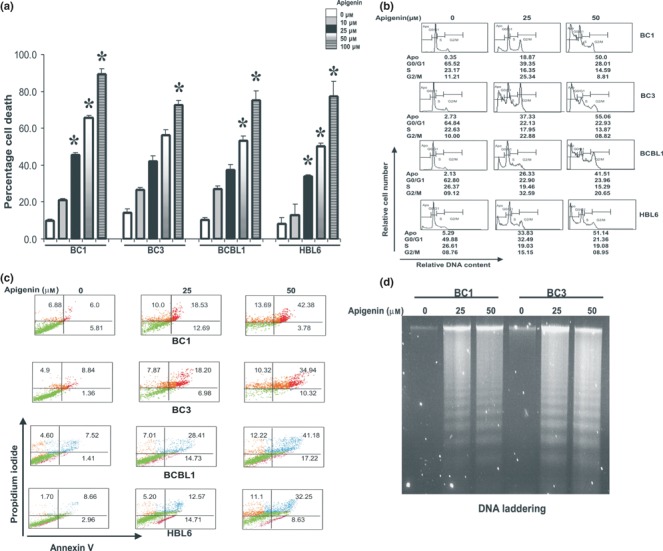
(a) Apigenin suppresses growth of PEL cells. BC1, BC3, BCBL1 and HBL‐6 cells were incubated in 0–100 μm apigenin for 24 h. Cell death assays were performed using trypan blue exclusion dye as described in the Materials and methods section. The graph displays mean ± SD (standard deviation) of three independent experiments with replicates of six wells for all doses, and vehicle control for each experiment. *P < 0.05, statistically significant (Student’s t‐test). (b) Apigenin treatment increases G2/M population at 25 μm and sub‐G1 (apoptotic) populations at 50 μm. BC1, BC3, BCBL1 and HBL‐6 cells were treated with 25 and 50 μm apigenin for 24 h. Thereafter, the cells were washed, fixed and stained with propidium iodide, and analysed for DNA content by flow cytometry as described in the Materials and methods section. At least three independent experiments were performed for all cell lines. Results from one representative experiment shown. (c) Apigenin‐induced apoptosis detected by Annexin V/PI dual staining. Cells were treated with 25 and 50 μm apigenin (as indicated) for 24 h and were subsequently stained with flourescein‐conjugated annexin‐V and propidium iodide (PI) and analysed by flow cytometry. (d) BC1 and BC3 cells were treated with 25 and 50 μm apigenin for 24 h and DNA was extracted and separated by electrophoresis on 1.5% agarose gel.
To determine whether apigenin caused cell cycle arrest or apoptosis in the PEL cells, all lines were treated with or without different concentrations of apigenin (25 or 50 μm) for 24 h. Cells were fixed and cell cycle fractions were determined by flow cytometry. As shown in Fig. 1b, the sub‐G1 population of cells increased from 0.35% in the control to 18.87% at the lower concentration of apigenin (25 μm), and to 50% at the higher concentration (50 μm) in BC1 cells. Similar results were obtained in BC3 cells (2.73–37.33% and 55.06%); as well as in BCBL1 (2.13–26.33% and 41.51%) and HBL‐6 cells (5.29–33.83% and 51.14%). Interestingly, with 25 μm apigenin treatment, there was increase in the G2/M population of cells suggesting that apigenin caused cell cycle arrest at lower doses, accompanied by apoptosis. However at 50 μm dose, there was an increase in the sub‐G1 fraction accompanied by loss in G0/G1, S and G2/M population of cells. It has been reported that cells with these features are those dying by apoptosis (31, 32, 33, 34). To confirm further that this increase in the sub‐G1 population indeed reflects apoptosis, PEL cells were treated with various doses of apigenin, as indicated, and apoptotic cells were analysed using the annexin V dual staining and TUNEL assays. As shown in Fig. 1c, apigenin treatment resulted in apoptosis in a dose‐dependent manner in all different PEL‐derived cell lines.
We analysed DNA fragmentation, which is another hallmark of apoptosis. BC1 and BC3 cells were treated with 25 and 50 μm apigenin for 24 h and DNA was isolated using an apoptotic DNA‐laddering kit from Roche. As shown in Fig. 1d, apigenin caused fragmentation of DNA, a characteristic of apoptotic cell death. In addition, TUNEL assays that were carried out on apigenin‐treated cells showed apoptosis (Fig. S1b). We finally determined the effect of apigenin on normal B cells. Blood samples from five healthy normal donors were taken and B cells were isolated. Normal B cells were then treated with 25 and 50 μm apigenin for 24 h and cells were analysed for apoptosis using Annexin V/PI dual staining. As shown in Fig. S1a, apigenin failed to induce apoptosis in normal B cells in all the five samples. These data suggest that apigenin has a specific apoptotic effect on PEL cells.
Apigenin‐mediated inhibition of constitutive activated AKT/PKB induces PEL cell accumulation in G0/G1, SKP2 down‐regulation, and increased p27Kip1 expression levels
Activated PI3‐kinase/AKT pathway signalling has been shown to inhibit apoptosis in cancer cells (32, 33, 34). We therefore sought to determine whether apigenin would inhibit the constitutive phosphorylation/activation of AKT/PKB pathway in the PEL cells. BC1, BC3 and BCBL1 cells were treated for 24 h with 25 and 50 μm apigenin as indicated in Fig. 2a. Apigenin caused dephosphorylation of AKT at Ser473 and Thr308 in a dose‐dependent manner in all cell lines without affecting AKT at the transcriptional level (Fig. S2a). AKT is known to be regulated by PDK1 and PDK2 via phosphorylation of Thr308 and Ser473 respectively. For AKT to be completely activated, it has to be phosphorylated at both sites by the action of PDK1 and PDK2. We therefore sought to determine the effect of apigenin treatment on activation of PDK1. BC1 and BC3 cells were treated with apigenin and in parallel, cells were also treated with LY294002, a specific inhibitor of PI3‐kinase activation. Treatment of the cells with apigenin or LY294002 dephosphorylated PDK1 in a dose‐dependent manner suggesting that apigenin inhibited AKT by inactivation of PDK1, in similar manner as LY294002 (Fig. S2b). These results indicate that apigenin may induce apoptosis in PEL cells via inactivation of AKT activity, suggesting that activated AKT may play a role in proliferation and survival of PEL cells.
Figure 2.
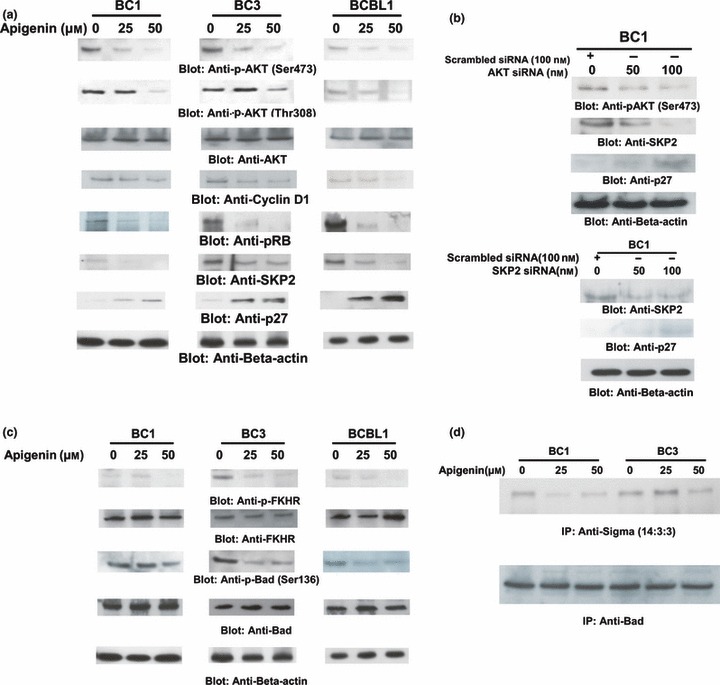
Apigenin inhibits constitutive active AKT, Cyclin D1, Rb, SKP2 and p27 in PEL cells. (a) BC1, BC3 and BCBL1 cells were treated with various doses of apigenin as indicated and cytoplasmic extracts were prepared. Twenty micrograms protein from each sample was separated on SDS–PAGE and immunoblotted with phospho‐Akt‐Ser473, phospho‐Akt‐Thr308, total AKT, cyclin D1, phospho‐Rb, SKP2 and p27 antibodies. Blots were probed with antibody against beta‐actin for equal loading (bottom panel). (b) AKT siRNA expression inactivates AKT, down‐regulates SKP2 and accumulates p27Kip1. BC1 cells were transfected with Scrambled siRNA (100 nm) and AKT siRNA (50 and 100 nm) with Lipofectamine as described in the Materials and methods section. After 48 h transfection, cells were lysed and equal amounts of proteins were separated by SDS–PAGE, transferred to Immobilon membrane, and immunoblotted with antibodies against p‐AKT, SKP2, p27‐Kip1 and beta actin, as indicated. Representative of three separate independent experiments depicted in this figure. (c) SKP2 siRNA expression down‐regulates SKP2 and accumulates p27Kip1. BC1 cells were transfected with Scrambled siRNA (100 nm) and SKP2 siRNA (50 and 100 nm) with Lipofectamine as described in the Materials and methods section. After 48 h transfection, cells were lysed and equal amounts of protein were separated by SDS–PAGE, transferred to Immobilon membrane and immunoblotted with antibodies against SKP2, P27Kip1 and beta actin as indicated. Representative of three separate independent experiments depicted. (d) Apigenin treatment causes inactivation of downstream targets of AKT: BC1, BC3 and BCBL1 cells were treated with 25 and 50 μm apigenin and cytoplasmic extracts were prepared. Twenty micrograms protein from each sample was separated on SDS–PAGE and immunoblotted with phospho‐FOXO1, FOXO‐1, phospho‐Bad, Bad and actin for equal loading. (e) 5 × 10⁶ cells were treated with and without apigenin for 24 h, immunoprecipitated using Bad antibody and proteins were separated on SDS–PAGE. Blots were probed with 14:3:3 Sigma antibody. Lysates were separated on SDS–PAGE, and immunoblotted with Bad antibody to insure equal loading.
Inhibition of AKT by apigenin resulted in decreased expression of cyclin D1 and increased expression of p27/Kip1 (Fig. 2a). Increased expression of p27Kip1 is accompanied by down‐regulation of SKP2, an F‐box protein that targets the cell cycle regulator via ubiquitin‐mediated degradation. This is further supported in that apigenin treatment led to decreased phosphorylation of Rb protein (Fig. 2a). Rb has been shown to be involved in regulation of SCF‐SKP2 ubiquitin ligase‐mediated p27Kip1 degradation via the SKP2 auto‐induction loop (38, 39). Apigenin‐induced hypophosphorylation of Rb and accumulation of p27Kip1 may disrupt the SKP2 auto‐induction loop, consequently promoting p27Kip1/Rb‐coupled G1 cell cycle arrest and apoptosis. Furthermore, inhibition of PI3‐kinase/AKT‐induced stabilization and accumulation of p27Kip1 may be regulated by AKT/SCF‐SKP2 signalling‐mediated regulation of CDK2 assembly with p27Kip1 and SKP2 protein expression (40, 41). At the messenger level, there was a 1.5‐ to 3‐fold decrease in expression of SKP2, suggesting that apigenin treatment of PEL cells leads to transcriptional regression of SKP2. Interestingly, there was no change in expression of p27Kip1 suggesting that p27Kip1 up‐regulation occurs post‐translationally after apigenin treatment (Fig. S2c,d).
To provide direct evidence to whether dephosphorylation of AKT down‐regulates SKP2 and up‐regulates p27Kip1, we attempted to knock down expression of AKT using siRNA against AKT. As shown in Fig. 2b, after partially blocking expression of AKT, there was down‐regulation of SKP2 and accumulation of p27 in the BC1 cells. In addition, transfection of siRNA against SKP2 resulted in SKP2 protein depletion as well as concomitant accumulation of p27Kip1 in BC1 cells (Fig. 2c). These results suggest that proteasome inhibition stabilized or up‐regulated p27Kip1 via down‐regulation of SKP2.
Apigenin treatment suppressed interaction between Bad and 14‐3‐3
AKT regulates apoptosis by phosphorylating several negative modulators including Bad and FKHR/FOXO1 (42, 43, 44). AKT has been shown to phosphorylate Bad at Ser136 and inhibits its pro‐apoptotic function (45). To test whether apigenin‐mediated apoptosis involved Foxo1 and Bad, we treated BC1, BC3 and BCBL1 cells with 25 and 50 μm apigenin for 24 h and analysed the expression of p‐FOXO1 and p‐Bad by Western blotting. As shown in Fig. 2d, p‐FOXO1 and p‐Bad were found to be constitutively activated and apigenin treatment dephosphorylated these proteins. These results suggest that PEL cells express constitutively activated Foxo1 transcription factors and p‐Bad. Pro‐apoptotic activity of Bad is regulated by phosphorylation (42). In its dephosphorylated state, Bad is localized to the outer mitochondrial membrane where it binds to and antagonizes pro‐survival Bcl‐2 family proteins such as Bcl‐2 and Bcl‐xL (44, 45). In cancer cells, phosphorylation of Bad causes its cytoplasmic sequestration because of increased binding with 14‐3‐3 proteins, which prevents interaction of Bad with anti‐apoptotic Bcl‐2 family members (45, 46). To test whether apigenin treatment affected interaction between Bad and 14‐3‐3 proteins, we immunoprecipitated Bad using lysates from untreated and apigenin‐treated (25 and 50 μm) cells, and immunoprecipitated complexes were then subjected to immunoblotting using anti‐14‐3‐3 antibody. As shown in Fig. 2e, complex formation between Bad and 14‐3‐3 was reduced in apigenin‐treated BC1 and BC3 cells. The same blot was re‐probed with anti‐Bad antibody to ensure equal immunoprecipitation from control and apigenin‐treated lysates.
Apigenin treatment results in dose‐dependent decrease in Bcl‐2 protein causing increase in Bax/Bcl‐2 ratio
The Bcl‐2 family of proteins plays a central regulatory role via its interacting pro‐ and anti‐apoptotic members that integrate a wide variety of upstream survival and distress signals, to decide the fate of cells (47). We therefore evaluated the effect of apigenin treatment on expression of two major members of the Bcl‐2 family, Bax and Bcl‐2 in BC1 cell line. As shown in Fig. 3a, as dosage of apigenin increased, there was a decrease in Bcl‐2 levels. Densitometric analysis of these proteins revealed an increase in the Bax/Bcl‐2 ratio that has been shown to induce apoptosis (Fig. 3a).
Figure 3.
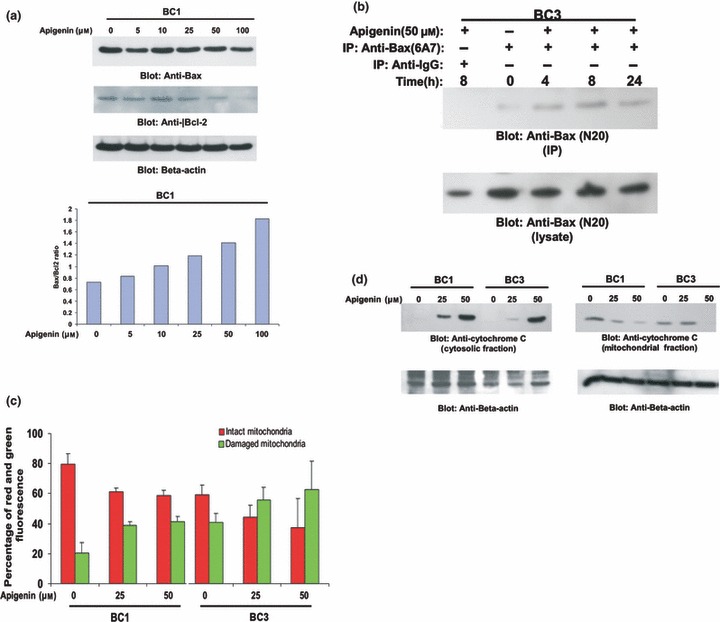
Apigenin‐induced mitochondrial signalling pathways in primary effusion lymphoma cells. (a) Apigenin treatment causes alteration in Bcl‐2 expression. BC1 cells were treated with various doses of apigenin. Cells were lysed and equal amounts of proteins were separated by SDS–PAGE, transferred to Immobilon membrane, and immunoblotted with antibodies against Bax, Bcl‐2 and beta actin as indicated (upper panel). Data obtained from immunoblot analyses of Bax and Bcl‐2 were used to evaluate effects of apigenin on Bax/Bcl‐2 ratio. Densitometric analysis of Bax and Bcl‐2 bands was performed using AlphaImager Software (San Leandro, CA, USA), and data (relative density normalized to β‐actin) were plotted as Bax/Bcl‐2 ratio. (b) Apigenin‐induced Bax activation. After treating with 50 μm apigenin for indicated time periods, BC1 and BC3 cells were lysed in 1% Chaps lysis buffer and subjected to immunoprecipitation with either anti‐Bax 6A7 antibody or non‐specific IgG, for detection of conformationally changed Bax protein. In addition, total cell lysates were applied directly to SDS–PAGE, transferred to Immobilon membrane and immunoblotted with specific anti‐Bax polyclonal antibody. (c) Loss of mitochondrial potential by apigenin treatment. Cells were treated with and without 25 and 50 μm apigenin for 24 h. Live cells with intact mitochondrial membrane potential (red bars) and dead cells with lost mitochondrial membrane potential (green bars) were measured by JC‐1 staining and analysed by flow cytometry as described in the Materials and methods section. Average of three independent experiments is depicted. (d) Apigenin‐induced release of cytochrome c. BC1 and BC3 cells were treated with and without 25 and 50 μm apigenin for 24 h. Mitochondrial‐free cytoplasmic fractions as well as mitochondrial extracts were isolated as described in the Materials and Methods sections. Cell extracts were separated on SDS–PAGE, transferred to PVDF membrane, and immunoblotted with an antibody against cytochrome c. Beta‐actin was used for equal loading.
Apigenin induces Bax conformational changes and oligomerization
As it is known that dephosphorylation of Bad and down‐regulation of Bcl‐2 play an important role in activation of Bax and apoptosis, we examined activation of Bax in response to apigenin treatment. BC1 cells were treated with 50 μm apigenin for 4, 8 and 24 h and lysed using 1.0% Chaps lysis buffer; lysates were immunoprecipitated with Bax 6A7 antibody that recognizes only the conformationally changed Bax protein. The detergent Chaps has been shown to retain Bax protein in its native conformation. As shown in Fig. 3b, conformationally changed Bax was detected 4 and 8 h after treatment with 50 μm apigenin.
Apigenin induces loss of mitochondrial membrane potential and subsequent release of cytochrome c into cytosol
We further tested the effect of apigenin on mitochondrial membrane potential using JC1 stain. BC1 and BC3 cells were treated with 25 and 50 μm apigenin for 24 h. As shown in Fig. 3c, treatment resulted in loss of mitochondrial membrane potential as measured by JC1‐stained green florescence, depicting apoptotic cells. Cytochrome c release from mitochondria in BC1 and BC3 cells treated with apigenin was examined using Western blot analysis. Cells were treated in the presence and absence of 25 and 50 μm apigenin for 24 h. Cytosolic‐specific, mitochondria‐free as well as mitochondrial cell lysates were prepared as described in the Materials and methods section. As shown in Fig. 3d, cytochrome c was released into the cytosol, as visualized by an increase in intensity of the cytochrome c band in cytosolic fractions, and decrease in intensity of the bands in mitochondrial fractions, after apigenin treatment. These results suggest that apigenin treatment of PEL cells causes apoptosis via the intrinsic apoptotic pathway following release of cytochrome c.
Apigenin‐induced signalling results in caspases‐9 and ‐3 activation and PARP cleavage
As caspases are important mediators of apoptosis induced by various apoptotic stimuli (48), we examined whether apigenin treatment also caused their activation. BC1, BC3, and BCBL1 cells were treated with 25 or 50 μm apigenin for 24 h and immunoblotted with antibodies against caspases‐9 and ‐3, cleaved caspase‐3 and PARP. As shown in Fig. 4a, apigenin treatment induced activation and cleavage of caspases‐9 and ‐3 after 24 h, as inferred by decreased intensity of pro‐caspase bands and appearance of cleaved caspase‐9 and 3 bands. As expected based on these findings, PARP cleavage, a hallmark of cells undergoing apoptosis, was also seen in these cell lines after apigenin treatment. To examine further whether apigenin‐induced apoptosis is caspase dependent, we pre‐treated BC1 and BC3 cell lines with 80 μm zVAD‐fmk, a universal inhibitor of caspases, for 2 h followed by treatment with 50 μm apigenin for 24 h. As seen in Fig. 4c,d, zVAD‐fmk pre‐treatment abrogated caspase‐3 and PARP activation and prevented cell death induced by apigenin, firmly establishing that caspases play a critical role in apigenin‐induced apoptosis in PEL cells.
Figure 4.
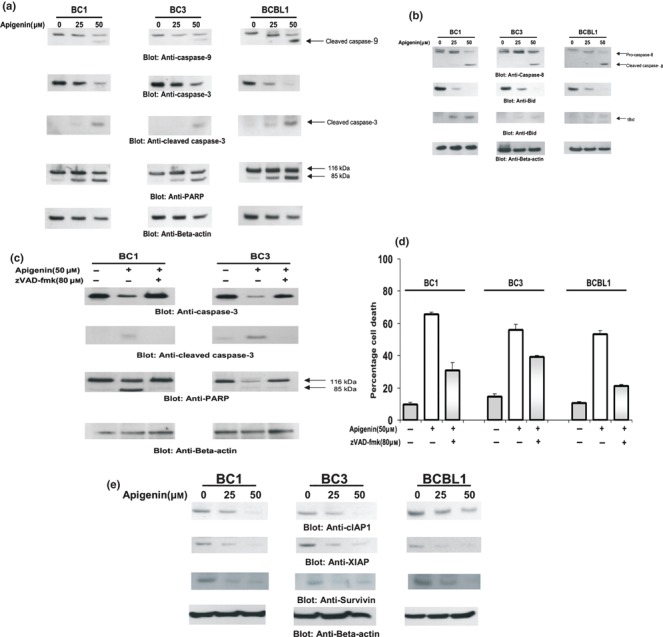
Activation of caspases‐9 and 3 and cleavage of PARP induced by apigenin treatment. (a) BC1, BC3 and BCBL cells were treated with and without 25 and 50 μm apigenin for 24 h. Cells were lysed and equal amounts of protein were separated by SDS–PAGE, transferred to PVDF membrane, and immunoblotted with antibodies against caspase‐9, caspase‐3, cleaved caspase‐3 and PARP. (b) Apigenin‐induced activation and cleavage of caspase‐8 and Bid. BC1, BC3 and BCBL1 cells were treated with 25 and 50 μm apigenin as indicated for 24 h. Cells were lysed and equal amounts of protein were separated by SDS–PAGE, transferred to Immobilon membrane, and immunoblotted with antibodies against caspase‐8 and Bid. Beta‐actin was used as a loading control. (c) Effect of z‐VADfmk on apigenin‐induced activation of caspase‐3 and PARP. BC1 and BC3 cells were pre‐treated with 80 μm of z‐VAD for 2 h and subsequently treated with 50 μm apigenin for 24 h. Cells were lysed and 20 μg of protein was separated by SDS–PAGE, transferred to PVDF membrane and immunoblotted with antibodies against caspase‐3, cleaved caspase‐3 and PARP. Three independent experiments were performed to confirm the results. Representative blot is shown. (d) Effect of z‐VAD on apigenin‐induced cell death. BC1 and BC3 cells were pre‐treated with 80 μm of z‐VAD for 2 h and subsequently treated with 50 μm apigenin for 24 h. Live and dead cells were scored using trypan blue dye exclusion. The graph displays the mean ± SD of three independent experiments. (e) Apigenin‐induced down‐regulation of cIAP1, XIAP and Survivin expression. BC1, BC3 and BCBL1 cells were treated with and without 25 and 50 μm apigenin for 24 h. Cells were lysed and equal amounts of proteins were separated on SDS–PAGE, transferred to PVDF membrane, and immunoblotted with antibodies against cIAP1, XIAP and Survivin. Beta‐actin was used to measure equal loading. A representative blot of three independent experiments shown.
Modulation of IAP protein family in apigenin‐induced apoptosis in PEL cells
We also examined whether apigenin induced cell death by modulating expression of inhibitors of apoptosis protein (IAP) family members, which ultimately determine the cell’s response to apoptotic stimuli. BC1, BC3 and BCBL1 cells were treated with 25 and 50 μm apigenin for 24 h and expressions of cIAP1, XIAP and Survivin were determined using the Western blotting technique. As shown in Fig. 4e, apigenin treatment caused dose‐dependent down‐regulation of cIAP1, Survivin and XIAP. These results indicate that IAP proteins may also be involved in apigenin‐induced apoptosis.
Based on our findings in this study, we propose a model (Fig. 5) in which we show that apigenin treatment causes dephosphorylation of AKT at both sites, Ser473 and Thr308. AKT dephosphorylation leads to two major events in apigenin‐treated PEL cells, cell cycle arrest and apoptosis. Cell cycle arrest occurs via down‐regulation of cyclin D1 leading to in‐activation of Rb protein as well as down‐regulation of SKP2 protein leading to accumulation of p27. On the other hand, apoptosis is initiated via in‐activation of Bad protein leading to down‐regulation of Bcl‐2 thereby causing activation of the mitochondrial apoptotic pathway. These events ultimately lead to DNA fragmentation and apoptosis after apigenin treatment in PEL cell lines.
Figure 5.
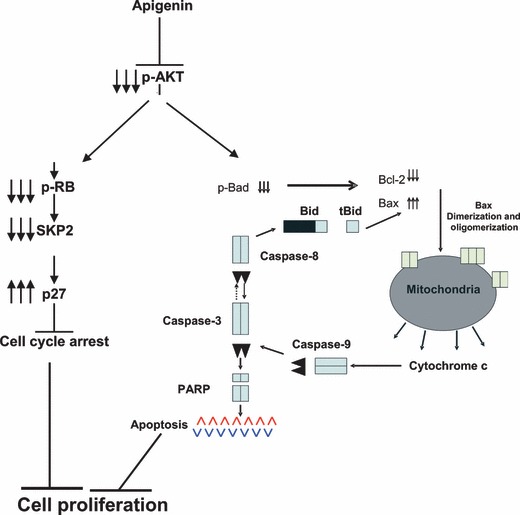
Schematic representation of apigenin‐induced cell cycle‐coupled apoptosis in PEL cells.
Discussion
Primary effusion lymphoma is a very aggressive type of cancer, which frequently becomes resistant to conventional chemotherapeutic agents. Because of the relative lack of efficacy of chemotherapy in treatment of this malignancy, there is a need for development of new therapeutic targets and approaches, including clinical trials with novel agents. PEL cells produce a variety of inflammatory cytokines and growth factors, in an autocrine fashion, including viral IL‐6, IL‐10 and VEGF, providing them cyto‐protection against apoptosis (3). It is now postulated that the mechanisms of lymphomagenesis involve deregulation of several signalling pathways that may act either independently or crosstalk with each other. Constitutive activation of various signalling pathways is a common finding in haematological malignancies, while some of these pathways are implicated in promotion of cell population growth and generation of anti‐apoptotic signals (5, 6, 7).
Apigenin, a non‐mutagenic flavonoid, has garnered significant attention as an inhibitor of certain signal transduction pathways (25, 26). It is a chemopreventive compound that inhibits protein kinase by competing with ATP. Flavopiridol, a semi‐synthetic polyhydroxylated flavone, exhibits in vitro activity and is currently used in clinical trials as an anti‐tumour agent for various cancers (49). In this study, we demonstrate that apigenin is able to induce apoptosis in a number of PEL cell lines. Our findings provide the evidence for a novel function of apigenin in PEL, involving activation of the mitochondrial apoptotic pathway, as a result of inhibition of AKT activation. Our data firmly establish that inhibition of constitutive AKT/PKB is the key signalling event in apigenin‐induced apoptosis.
Apigenin has been shown to induce cell cycle arrest via induction of cell cycle‐dependent kinase inhibitor, p27Kip1 (50). In the present study, we showed that apigenin increased p27Kip1 protein expression without affecting p27Kip1 mRNA expression, which suggested post‐translational regulation of p27Kip1 by apigenin in PEL cells. Several pathways have been suggested to regulate these post‐translational events (51). The one that has been best described involves SKP2‐ubiquitination‐dependent turnover. SKP2‐dependent p27Kip1 ubiquitination and proteasome degradation mechanism have been shown to be correlated with increasing aggressiveness of colon cancers (52). PI3‐kinase/AKT activation activity mediated by hormonal stimulation has been shown to modulate expression of SKP2 (53). This is the first study where our data have shown that inhibition of p‐AKT by apigenin resulted in decreased expression of SKP2 leading to accumulation p27/Kip1 expression. In addition, apigenin treatment led to decreased phosphorylation of Rb protein (Fig. 2a). Rb has previously been shown to be involved in regulation of SKP2‐mediated p27Kip1 degradation via SKP2 (38, 39). Apigenin‐induced hypophosphorylation of Rb and accumulation of p27Kip1 may disrupt the SKP2 autoinduction loop, consequently promoting p27Kip1/Rb‐coupled G1 cell cycle arrest and apoptosis.
Activated AKT can also phosphorylate several apoptosis‐regulating proteins including pro‐apoptotic Bcl‐2 family member Bad (42). Bad promotes cell death by interacting with anti‐apoptotic Bcl‐2 members such as Bcl‐2 and Bcl‐xL, which allows multidomain pro‐apoptotic Bcl‐2 family members Bax and Bak to aggregate and cause release of apoptogenic molecules (for example, cytochrome c) from mitochondria to the cytosol culminating in caspase activation and cell death (54, 55). Growth factor‐stimulated phosphorylation of Bad at Ser112, Ser136 and/or Ser155 induces a conformational change in Bad that reduces its ability to interact with Bcl‐xL (42, 43, 44, 45, 46). However, phosphorylation of Bad promotes its interaction with 14‐3‐3 proteins, which sequester Bad in the cytoplasm (54, 55, 56, 57, 58). Our data in the present study indicate that apigenin‐mediated inactivation of AKT causes dephosphorylation of Bad protein at136. We also found that apigenin treatment reduced interaction between Bad and 14‐3‐3.
Apigenin‐mediated dephosphorylation of Bad caused down‐regulation of Bcl‐2 protein, consequently allowing conformational change in Bax. Apigenin‐induced conformation caused Bax to translocate to mitochondria leading to formation of mitochondrial pores that cause loss of mitochondrial membrane potential and release of cytochrome c into the cytosol. In the cytosol, cytochrome c and dATP bind to apoptotic protease‐activating factor‐1 (Apaf‐1), and this complex, along with adenine nucleotides, promotes procaspase‐9 autoactivation, which in turn activates caspase‐3, ultimately resulting in PARP cleavage leading to DNA degradation and apoptosis (59). Our data showed apigenin‐mediated cytoplasmic cytochrome c induced activation of caspase‐9, caspase‐3 and cleaved PARP. Apigenin has been shown to induce apoptosis via activation of the caspase cascade in leukaemia Jurkat T cells (60) and neuroblastoma (61). These results imply that activation of caspase‐3 plays a role in apigenin‐induced apoptosis.
The IAPs have been reported to inhibit apoptosis by directly inhibiting effector caspases, caspase‐3 and caspase‐7 (62). Furthermore, cIAP1 is also able to inhibit cytochrome c induced activation of caspase‐9 (62). XIAP, an inhibitor of apoptosis, has been shown to play a role in modulation of apoptosis by involvement of the AKT pathway. A recent report suggests that AKT interacts with XIAP and results in inhibition of caspase‐3 activity and apoptosis, in response to cisplatin treatment (63). Furthermore, XIAP degradation is an important mechanism to regulate sensitivity of cisplatin‐induced apoptosis in human ovarian cancer cells (63). Ectopic expression of constitutively active AKT protects XIAP from ubiquitination and degradation induced by cisplatin. Our results show that inhibition of the PI3‐kinase/AKT pathway by apigenin results in down‐regulation of expressions of cIAP1, XIAP and Survivin in PEL cells undergoing apoptosis, implicating down‐regulation of IAPs in activation of caspase‐9 and ‐3 in apigenin‐induced apoptosis.
In conclusion, our results demonstrate that down‐regulation of AKT kinase activity causes disruption of cell cycle checkpoint proteins such as Cyclin D1, Rb and SKP2, leading to accumulation of p27 and consequently leading to cell cycle arrest. In addition, AKT inactivation leads to dephosphorylation of FOXO1 and Bad, leading to down‐regulation of Bcl‐2, causing Bax conformational change and translocation to mitochondria, causing loss of mitochondrial membrane potential and release of cytochrome c into the cytosol. Apigenin‐induced release of cytochrome c leads to activation of downstream caspases‐9 and ‐3 and down‐regulation of survival proteins (cIAP1, XIAP and Survivin), resulting in PEL cell death. Taken altogether, our data suggest that apigenin has chemopreventive/therapeutic potential against these aggressive lymphomas.
Supporting information
Fig. S1 A TUNEL assay: BC1, BC3, BCBL1 and HBL6 cell were treated with and without 25 and 50μM apigenin for 24 hours and apoptosis was determined using TUNEL assay. (B) Normal B cells from 5 healthy individuals were treated with 25 and 50μM apigenin and cells were subsequently stained with flourescein‐conjugated annexin‐V and propidium iodide (PI) and analyzed by flow cytometry.
Fig. S2 (A) 5x10⁶ were treated with and without indicated doses of apigenin for 24 hours. RNA was isolated, and reverse transcribed as described in material and methods. Block RT‐PCR for AKT1, AKT2 and AKT3 were performed for 35 cycles at 55°C. (B) BC1 and BC3 cells were treated with various doses of apigenin and LY294002 for 24 hours. Cells were lysed and equal amounts of proteins were separated by SDS‐PAGE, transferred to Immobilon membrane, and immunoblotted with antibodies against p‐PDK1 and beta actin as indicated. (C) 5x10⁶ were treated with and without indicated doses of apigenin for 24 hours. RNA was isolated, and reverse transcribed and real‐time quantitative RT‐PCR was performed for detection of expression of SKP2 and p27. GAPDH was used as an internal control.
Please note: Wiley‐Blackwell are not responsible for the content or functionality of any supporting materials supplied by the authors. Any queries (other than missing material) should be directed to the corresponding author for the article.
Supporting info item
Supporting info item
Supporting info item
References
- 1. Klepfish A, Sarid R, Shtalrid M, Shvidel L, Berrebi A, Schattner A (2001) Primary effusion lymphoma (PEL) in HIV‐negative patients – a distinct clinical entity. Leuk. Lymphoma 41, 439–443. [DOI] [PubMed] [Google Scholar]
- 2. Drexler HG, Uphoff CC, Gaidano G, Carbone A (1998) Lymphoma cell lines: in vitro models for the study of HHV‐8+ primary effusion lymphomas (body cavity‐based lymphomas). Leukemia 12, 507–517. [DOI] [PubMed] [Google Scholar]
- 3. Jones KD, Aoki Y, Chang Y, Moore PS, Yarchoan R, Tosat G (1999) Involvement of interleukin‐10 (IL‐10) and viral IL‐6 in the spontaneous growth of Kaposi’s sarcoma herpesvirus‐associated infected primary effusion lymphoma cells. Blood 94, 2871–2879. [PubMed] [Google Scholar]
- 4. Masood R, Zhang Y, Bond MW, Scadden DT, Moudgil T, Law RE et al. (1995) Interleukin‐10 is an autocrine growth factor for acquired immunodeficiency syndrome‐related B‐cell lymphoma. Blood 85, 3423–3430. [PubMed] [Google Scholar]
- 5. Aoki Y, Feldman GM, Tosato G (2003) Inhibition of STAT3 signaling induces apoptosis and decreases survivin expression in primary effusion lymphoma. Blood 101, 1535–1542. [DOI] [PubMed] [Google Scholar]
- 6. Keller SA, Schattner EJ, Cesarmanm E (2000) Inhibition of NF‐kappaB induces apoptosis of KSHV‐infected primary effusion lymphoma cells. Blood 96, 2537–2542. [PubMed] [Google Scholar]
- 7. Uddin S, Hussain AR, Manogaran PS, Al‐Hussein K, Platanias LC, Gutierrez MI et al. (2005) Curcumin suppresses growth and induces apoptosis in primary effusion lymphoma. Oncogene 24, 7022–7030. [DOI] [PubMed] [Google Scholar]
- 8. Prakash O, Tang ZY, Peng X, Coleman R, Gill J, Farr G et al. (2002) Tumorigenesis and aberrant signaling in transgenic mice expressing the human herpesvirus‐8 K1 gene. J. Natl Cancer Inst. 94, 926–935. [DOI] [PubMed] [Google Scholar]
- 9. Tomlinson CC, Damania B (2004) The K1 protein of Kaposi’s sarcoma‐associated herpesvirus activates the Akt signaling pathway. J. Virol. 78, 1918–1927. [DOI] [PMC free article] [PubMed] [Google Scholar]
- 10. Vivanco I, Sawyers CL (2002) The phosphatidylinositol 3‐Kinase AKT pathway in human cancer. Nat. Rev. Cancer 2, 489–501. [DOI] [PubMed] [Google Scholar]
- 11. Cross DA, Alessi DR, Cohen P, Andjelkovich M, Hemmings BA (1995) Inhibition of glycogen synthase kinase‐3 by insulin mediated by protein kinase B. Nature 378, 785–789. [DOI] [PubMed] [Google Scholar]
- 12. Brunet A, Bonni A, Zigmond MJ, Lin MZ, Juo P, Hu LS et al. (1999) Akt promotes cell survival by phosphorylating and inhibiting a Forkhead transcription factor. Cell 96, 857–868. [DOI] [PubMed] [Google Scholar]
- 13. Reed JC (2006) Proapoptotic multidomain Bcl‐2/Bax‐family proteins: mechanisms, physiological roles, and therapeutic opportunities. Cell Death Differ. 13, 1378–1386. [DOI] [PubMed] [Google Scholar]
- 14. Yang E, Korsmeyer SJ (1999) BCL‐2 gene family and the regulation of programmed cell death. Cancer Res. 59, 1693–1700. [PubMed] [Google Scholar]
- 15. Zong WX, Lindsten T, Ross AJ, MacGregor GR, Thompson CB (2001) BH3‐only proteins that bind pro‐survival Bcl‐2 family members fail to induce apoptosis in the absence of Bax and Bak. Genes Dev. 15, 1481–1486. [DOI] [PMC free article] [PubMed] [Google Scholar]
- 16. Mamillapalli R, Gavrilova N, Mihaylova VT, Tsvetkov LM, Wu H, Zhang H et al. (2001) PTEN regulates the ubiquitin‐dependent degradation of the CDK inhibitor p27 (KIP1) through the ubiquitin E3 ligase SCF (SKP2). Curr. Biol. 11, 263–267. [DOI] [PubMed] [Google Scholar]
- 17. Andreu EJ, Lledó E, Poch E, Ivorra C, Albero MP, Martínez‐Climent JA et al. (2005) BCR‐ABL induces the expression of Skp2 through the PI3K pathway to promote p27Kip1 degradation and proliferation of chronic myelogenous leukemia cells. Cancer Res. 65, 3264–3272. [DOI] [PubMed] [Google Scholar]
- 18. Reichert M, Saur D, Hamacher R, Schmid RM, Schneider G (2007) Phosphoinositide‐3‐kinase signaling controls S‐phase kinase‐associated protein 2 transcription via E2F1 in pancreatic ductal adenocarcinoma cells. Cancer Res. 67, 4149–4156. [DOI] [PubMed] [Google Scholar]
- 19. Nakayama KI, Nakayama K (2006) Ubiquitin ligases: cell‐cycle control and cancer. Nat. Rev. Cancer 6, 369–381. [DOI] [PubMed] [Google Scholar]
- 20. Bloom J, Pagano M (2003) Deregulated degradation of the cdk inhibitor p27 and malignant transformation. Semin. Cancer Biol. 13, 41–47. [DOI] [PubMed] [Google Scholar]
- 21. Yokoi S, Yasui K, Saito‐Ohara F, Koshikawa K, Iizasa T, Fujisawa T et al. (2002) A novel target gene, SKP2, within the 5p13 amplicon that is frequently detected in small cell lung cancers. Am. J. Pathol. 161, 207–216. [DOI] [PMC free article] [PubMed] [Google Scholar]
- 22. Kaufmann T, Tai L, Ekert PG, Huang DC, Norris F, Lindemann RK et al. (2007) The BH3‐only protein bid is dispensable for DNA damage‐ and replicative stress‐induced apoptosis or cell‐cycle arrest. Cell 129, 423–433. [DOI] [PubMed] [Google Scholar]
- 23. Dunnick JK, Hailey JR (1992) Toxicity and carcinogenicity studies of quercetin, a natural component of foods. Fundam. Appl. Toxicol. 19, 423–431. [DOI] [PubMed] [Google Scholar]
- 24. Fotsis T, Pepper MS, Aktas E, Breit S, Rasku S, Adlercreutz H et al. (1997) Flavonoids, dietary‐derived inhibitors of cell proliferation and in vitro angiogenesis. Cancer Res. 57, 2916–2921. [PubMed] [Google Scholar]
- 25. Yin F, Giuliano AE, Law RE, Van Herle AJ (2001) Apigenin inhibits growth and induces G2/M arrest by modulating cyclin‐CDK regulators and ERK MAP kinase activation in breast carcinoma cells. Anticancer Res. 21, 413–420. [PubMed] [Google Scholar]
- 26. Van Dross R, Xue Y, Knudson A, Pelling JC (2003) The chemopreventive bioflavonoid apigenin modulates signal transduction pathways in keratinocyte and colon carcinoma cell lines. J. Nutr. 133, 3800S–3804S. [DOI] [PubMed] [Google Scholar]
- 27. Yin F, Giuliano AE, Van Herle AJ (1999) Growth inhibitory effects of flavonoids in human thyroid cancer cell lines. Thyroid 9, 369–376. [DOI] [PubMed] [Google Scholar]
- 28. Wang IK, Lin‐Shiau SY, Lin JK (1999) Induction of apoptosis by apigenin and related flavonoids through cytochrome c release and activation of caspase‐9 and caspase‐3 in leukaemia HL‐60 cells. Eur. J. Cancer 35, 1517–1525. [PubMed] [Google Scholar]
- 29. Shukla S, Gupta S (2007) Apigenin‐induced cell cycle arrest is mediated by modulation of MAPK, PI3K‐Akt, and loss of cyclin D1 associated retinoblastoma dephosphorylation in human prostate cancer cells. Cell Cycle 6, 1102–1114. [DOI] [PubMed] [Google Scholar]
- 30. Czeczot H, Tudek B, Kusztelak J, Szymczyk T, Dobrowolska B, Glinkowska G et al. (1990) Isolation and studies of the mutagenic activity in the Ames test of flavonoids naturally occurring in medical herbs. Mutat. Res. 240, 209–216. [DOI] [PubMed] [Google Scholar]
- 31. Hussain AR, Al‐Jomah N, Siraj AK, Manogaran P, Al‐Hussein K, Abubaker J et al. (2007) Sanguinarine‐dependent induction of apoptosis in primary effusion lymphoma cells. Cancer Res. 67, 3888–3897. [DOI] [PubMed] [Google Scholar]
- 32. Uddin S, Hussain A, Manogaran PS, Wickrema A, Gutierrez MI, Bhatia KG (2005) Inhibition of phosphatidylinositol 3′‐kinase/AKT‐signaling promotes apoptosis of primary effusion lymphoma cells. Clin. Cancer Res. 11, 3102–3108. [DOI] [PubMed] [Google Scholar]
- 33. Hussain A, Al‐Rasheed M, Manogaran PS, Al‐Hussein KA, Platanias LC, Al Kuraya K et al. (2006) Curcumin induced apoptosis in acute T cell leukemias. Apoptosis 11, 245–254. [DOI] [PubMed] [Google Scholar]
- 34. Uddin S, Hussain AR, Siraj AK, Manogaran PS, Al‐Jomah NA, Moorji A et al. (2006) Role of phosphatidylinositol 3′‐kinase/AKT pathway in diffuse large B‐cell lymphoma survival. Blood 108, 4178–4186. [DOI] [PubMed] [Google Scholar]
- 35. Uddin S, Ah‐Kang J, Ulaszek J, Mahmud D, Wickrema A (2004) Differentiation stage‐specific activation of p38 mitogen‐activated protein kinase isoforms in primary human erythroid cells. Proc. Natl. Acad. Sci. USA 101, 147–152. [DOI] [PMC free article] [PubMed] [Google Scholar]
- 36. Uddin S, Hussain A, Al‐Hussein K, Platanias LC, Bhatia KG (2004) Inhibition of phosphatidylinositol 3′‐kinase induces preferentially killing of PTEN‐null T leukemias through AKT pathway. Biochem. Biophys. Res. Commun. 320, 932–938. [DOI] [PubMed] [Google Scholar]
- 37. Hussain AR, Ahmed M, Al‐Jomah NA, Khan AS, Manogaran P, Sultana M et al. (2008) Curcumin suppresses constitutive activation of nuclear factor‐kappa B and requires functional Bax to induce apoptosis in Burkitt’s lymphoma cell lines. Mol. Cancer Ther. 7, 3318–3329. [DOI] [PubMed] [Google Scholar]
- 38. Assoian RK, Yung Y (2008) A reciprocal relationship between Rb and Skp2: implications for restriction point control, signal transduction to the cell cycle and cancer. Cell Cycle 7, 24–27. [DOI] [PubMed] [Google Scholar]
- 39. Ji P, Jiang H, Rekhtman K, Bloom J, Ichetovkin M, Pagano M et al. (2004) An Rb‐Skp2‐p27 pathway mediates acute cell cycle inhibition by Rb and is retained in a partial‐penetrance Rb mutant. Mol. Cell 16, 47–58. [DOI] [PubMed] [Google Scholar]
- 40. Shapira M, Kakiashvili E, Rosenberg T, Hershko DD (2006) The mTOR inhibitor rapamycin down‐regulates the expression of the ubiquitin ligase subunit Skp2 in breast cancer cells. Breast Cancer Res. 8, R46. [DOI] [PMC free article] [PubMed] [Google Scholar]
- 41. Wang Q, Zhou Y, Wang X, Evers BM (2008) p27(Kip1) nuclear localization and cyclin‐dependent kinase inhibitory activity are regulated by glycogen synthase kinase‐3 in human colon cancer cells. Cell Death Differ. 15, 908–919. [DOI] [PMC free article] [PubMed] [Google Scholar]
- 42. Datta SR, Dudek H, Tao X, Masters S, Fu H, Gotoh Y et al. (1997) Akt phosphorylation of BAD couples survival signals to the cell‐intrinsic death machinery. Cell 91, 231–241. [DOI] [PubMed] [Google Scholar]
- 43. Brunet A, Park J, Tran H, Hu LS, Hemmings BA, Greenberg E (2001) Protein kinase SGK mediates survival signals by phosphorylating the forkhead transcription factor FKHRL1 (FOXO3a). Mol. Cell. Biol. 21, 952–965. [DOI] [PMC free article] [PubMed] [Google Scholar]
- 44. Yang E, Zha J, Jockel J, Boise LH, Thompson CB, Korsmeyer SJ (1995) Bad, a heterodimeric partner for Bcl‐XL and Bcl‐2, displaces Bax and promotes cell death. Cell 80, 285–291. [DOI] [PubMed] [Google Scholar]
- 45. Zha J, Harada H, Yang E, Jockel J, Korsmeyer SJ (1996) Serine phosphorylation of death agonist BAD in response to survival factor results in binding to 14‐3‐3 not BCL‐X(L). Cell 87, 619–628. [DOI] [PubMed] [Google Scholar]
- 46. Downward J (1999) How BAD phosphorylation is good for survival. Nat. Cell Biol. 1, E33–E35. [DOI] [PubMed] [Google Scholar]
- 47. Adhami VM, Aziz MH, Mukhtar H, Ahmad N (2003) Activation of pro‐death Bcl‐2 family proteins and mitochondrial apoptosis pathway by sanguinarine in immortalized human HaCaT keratinocytes. Clin. Cancer Res. 9, 3176–3182. [PubMed] [Google Scholar]
- 48. Desagher S, Osen‐Sand A, Nichols A, Eskes R, Montessuit S, Lauper S et al. (1999) Bid‐induced conformational change of Bax is responsible for mitochondrial cytochrome c release during apoptosis. J. Cell Biol. 144, 891–901. [DOI] [PMC free article] [PubMed] [Google Scholar]
- 49. De Azevedo WF Jr, Canduri F, Da Silveira NJ (2002) Structural basis for inhibition of cyclin‐dependent kinase 9 by flavopiridol. Biochem. Biophys. Res. Commun. 293, 566–571. [DOI] [PubMed] [Google Scholar]
- 50. Shukla S, Gupta S (2005) Molecular targets for apigenin‐induced cell cycle arrest and apoptosis in prostate cancer cell xenograft. Mol. Cancer Ther. 5, 843–852. [DOI] [PubMed] [Google Scholar]
- 51. Koff A (2006) How to decrease p27Kip1 levels during tumor development. Cancer Cell 275, 1059–1065. [DOI] [PubMed] [Google Scholar]
- 52. Uddin S, Ahmed M, Bavi P, El‐Sayed R, Al‐Sanea N, Abdul Jabbar A et al. (2008) Bortezomib (Velcade) induces p27Kip1 expression through S‐phase kinase protein 2 degradation in colorectal cancer. Cancer Res. 68, 3379–3388. [DOI] [PubMed] [Google Scholar]
- 53. Auld CA, Caccia CD, Morrison RF (2007) Hormonal induction of adipogenesis induces Skp2 expression through PI3 and MAPK pathways. J. Cell. Biochem. 100, 204–216. [DOI] [PubMed] [Google Scholar]
- 54. Datta SR, Katsov A, Hu L, Petros A, Fesik SW, Yaffe MB et al. (2000) 14‐3‐3 proteins and survival kinases cooperate to inactivate BAD by BH3 domain phosphorylation. Mol. Cell 6, 41–51. [PubMed] [Google Scholar]
- 55. Cheng EH, Wei MC, Weiler S, Flavell RA, Mak TW, Lindsten T et al. (2001) BCL‐2, BCL‐X(L) sequester BH3 domain‐only molecules preventing BAX‐ and BAK‐mediated mitochondrial apoptosis. Mol. Cell 8, 705–711. [DOI] [PubMed] [Google Scholar]
- 56. Wei MC, Zong WX, Cheng EH, Lindsten T, Panoutsakopoulou V, Ross AJ et al. (2001) Proapoptotic BAX and BAK: a requisite gateway to mitochondrial dysfunction and death. Science 292, 727–730. [DOI] [PMC free article] [PubMed] [Google Scholar]
- 57. Virdee K, Parone PA, Tolkovsky AM (2000) Phosphorylation of the pro‐apoptotic protein BAD on serine 155, a novel site, contributes to cell survival. Curr. Biol. 10, 1151–1154. [DOI] [PubMed] [Google Scholar]
- 58. Tan Y, Demeter MR, Ruan H, Comb MJ (2000) BAD Ser‐155 phosphorylation regulates BAD/Bcl‐XL interaction and cell survival. J. Biol. Chem. 275, 25865–25869. [DOI] [PubMed] [Google Scholar]
- 59. Zou H, Li Y, Liu X, Wang X (1999) An APAF‐1.cytochrome c multimeric complex is a functional apoptosome that activates procaspase‐9. J. Biol. Chem. 274, 11549–11556. [DOI] [PubMed] [Google Scholar]
- 60. Chen D, Daniel KG, Chen MS, Kuhn DJ, Landis‐Piwowar KR, Dou QP (2005) Dietary flavonoids as proteasome inhibitors and apoptosis inducers in human leukemia cells. Biochem. Pharmacol. 69, 1421–1432. [DOI] [PubMed] [Google Scholar]
- 61. Torkin R, Lavoie JF, Kaplan DR, Yeger H (2005) Induction of caspase‐dependent, p53‐mediated apoptosis by Apigenin in human neuroblastoma. Mol. Cancer Ther. 4, 1–11. [PubMed] [Google Scholar]
- 62. Deveraux QL, Reed JC (1999) IAP family proteins – suppressors of apoptosis. Genes Dev. 13, 239–252. [DOI] [PubMed] [Google Scholar]
- 63. Dan HC, Sun M, Kaneko S, Feldman RI, Nicosia SV, Wang HG et al. (2004) Akt phosphorylation and stabilization of X‐linked inhibitor of apoptosis protein (XIAP). J. Biol. Chem. 279, 5405–5412. [DOI] [PubMed] [Google Scholar]
Associated Data
This section collects any data citations, data availability statements, or supplementary materials included in this article.
Supplementary Materials
Fig. S1 A TUNEL assay: BC1, BC3, BCBL1 and HBL6 cell were treated with and without 25 and 50μM apigenin for 24 hours and apoptosis was determined using TUNEL assay. (B) Normal B cells from 5 healthy individuals were treated with 25 and 50μM apigenin and cells were subsequently stained with flourescein‐conjugated annexin‐V and propidium iodide (PI) and analyzed by flow cytometry.
Fig. S2 (A) 5x10⁶ were treated with and without indicated doses of apigenin for 24 hours. RNA was isolated, and reverse transcribed as described in material and methods. Block RT‐PCR for AKT1, AKT2 and AKT3 were performed for 35 cycles at 55°C. (B) BC1 and BC3 cells were treated with various doses of apigenin and LY294002 for 24 hours. Cells were lysed and equal amounts of proteins were separated by SDS‐PAGE, transferred to Immobilon membrane, and immunoblotted with antibodies against p‐PDK1 and beta actin as indicated. (C) 5x10⁶ were treated with and without indicated doses of apigenin for 24 hours. RNA was isolated, and reverse transcribed and real‐time quantitative RT‐PCR was performed for detection of expression of SKP2 and p27. GAPDH was used as an internal control.
Please note: Wiley‐Blackwell are not responsible for the content or functionality of any supporting materials supplied by the authors. Any queries (other than missing material) should be directed to the corresponding author for the article.
Supporting info item
Supporting info item
Supporting info item