

Abstract.
Tocopherols and tocotrienols represent the two subclasses within the vitamin E family of compounds. However, tocotrienols are significantly more potent than tocopherols in suppressing epidermal growth factor (EGF)‐dependent normal mammary epithelial cell growth. EGF is a potent mitogen for normal mammary epithelial cells and an initial event in EGF‐receptor mitogenic‐signalling is protein kinase C (PKC) activation. Studies were conducted to determine if the antiproliferative effects of specific tocopherol and tocotrienol isoforms are associated with a reduction in EGF‐receptor mitogenic signalling and/or PKC activation. Normal mammary epithelial cells isolated from midpregnant BALB/c mice were grown in primary culture, and maintained on serum‐free media containing 10 ng/mL EGF as a mitogen, and treated with various doses (0–250 µm) of α‐, γ‐, or δ‐tocopherol or α‐, γ‐, or δ‐tocotrienol. Treatment with growth inhibitory doses of δ‐tocopherol (100 µm), α‐tocotrienol (50 µm), or γ‐ or δ‐tocotrienol (10 µm) did not affect EGF‐receptor levels, EGF‐induced EGF‐receptor tyrosine kinase activity, or total intracellular levels of PKCα. However, these treatments were found to inhibit EGF‐induced PKCα activation as determined by its translocation from the cytosolic to membrane fraction. Treatment with 250 µmα‐ or γ‐tocopherol had no affect on EGF‐receptor mitogenic signalling or cell growth. These findings demonstrate that the inhibitory effects of specific tocopherol and tocotrienol isoforms on EGF‐dependent normal mammary epithelial cell mitogenesis occurs downstream from the EGF‐receptor and appears to be mediated, at least in part, by a reduction in PKCα activation.
Introduction
Vitamin E compounds are recognized as important antioxidants that regulate peroxidation reactions and control free‐radical production within the body (Packer 1991). However, these compounds have also been shown to inhibit normal and neoplastic mammary epithelial cell proliferation (Nesaretnam et al. 1998; Yu et al. 1999; McIntyre et al. 2000a,b). Tocopherols and tocotrienols represent the two subclasses in the vitamin E family of compounds. Tocopherols are commonly found in high concentrations in a wide variety of foods, whereas tocotrienols are relatively rare and found in appreciable levels only in a few specific vegetable fats, such as palm oil (Cottrell 1991). Tocopherols and tocotrienols have the same basic chemical structure characterized by a long phytyl tail attached to a chromane ring. However, tocopherols have a saturated, whereas tocotrienols have an unsaturated phytyl tail, and individual isoforms of tocopherols and tocotrienols differ form each other based on the degree of methylation of the chromane ring. Studies have shown that individual tocopherol and tocotrienol isoforms display differential potencies in suppressing normal mammary epithelial cell growth that can be characterized as δ‐tocotrienol ≥ γ‐tocotrienol > α‐tocotrienol > δ‐tocopherol > γ‐ and α‐tocopherol (McIntyre et al. 2000a).
At present, the exact intracellular mechanism(s) mediating the antiproliferative effects of tocopherols and tocotrienols is unknown. However, EGF is a potent mitogen for normal mammary epithelial cells (Imagawa et al. 1990; Sylvester et al. 1994; McIntyre et al. 1995) and specific tocopherol and tocotrienol isoforms have been shown to inhibit EGF‐dependent mammary epithelial cell proliferation (McIntyre et al. 2000a,b). The mitogenic actions of EGF are mediated through specific membrane‐bound tyrosine kinase receptors (Ullrich & Schlessinger 1990). Furthermore, EGF‐dependent mitogenesis in normal mammary epithelial cells is associated with the activation of phospholipid‐dependent PKC, and treatments that enhance PKC activation stimulate, whereas treatments that inhibit PKC activation inhibit, EGF‐induced mammary epithelial cell proliferation (Imagawa et al. 1990; Sylvester et al. 1994; 1996a, 1996b). Therefore, studies were conducted to determine if the antiproliferative effects of specific tocopherol and tocotrienol isoforms results from an inhibition in EGF‐receptor mitogenic signalling and/or PKC activation in normal mouse mammary epithelial cells grown in primary culture.
Materials and methods
Isolation and culture of mammary epithelial cells
Normal mouse mammary epithelial cells were isolated and prepared for primary culture as previously described (Sylvester et al. 1994). All materials were purchased from Sigma Chemical Company (St. Louis, MO), unless otherwise stated. Briefly, mammary glands from midpregnant BALB/c mice were removed, minced, and subjected to collagenase followed by pronase E digestion. Mammary epithelial cells isolated from midpregnant mice were selected for experimentation because these cells are highly responsive to EGF‐induced mitogenesis (Imagawa et al. 1990). Mammary epithelial cell organoids were then isolated by a series of filtrations through sterile filters, plated within rat tail collagen gels, and fed growth media (Dulbecco’s modified Eagle’s minimal essential medium; DMEM/F12 1 : 1, insulin 10 µg/mL, penicillin 100 U/mL, streptomycin 100 µg/mL, 10% bovine calf serum (Hyclone, Logan, UT). Plates were then placed in a humidified incubator at 37 °C in an environment of 95% air and 5% CO2. After a 2‐day incubation period, mammary epithelial cell organoids were again isolated by collagenase digestion and filtration. This double isolation procedure provides isolated mammary epithelial cell organoids ready for experimentation that are devoid of fibroblast and adipocyte contaminants (Jones et al. 1983). Mammary epithelial cells were then plated within collagen gels at a density of 2 × 10⁵ cells/0.5 mL collagen in 24‐well tissue culture plates (growth studies) or 1 × 10⁷ cells/8 mL collagen in 100 mm culture plates (Western blot experiments). In growth studies, cells were divided into different treatment groups and fed serum‐free control or treatment media consisting of DMEM/F12 containing 5 mg/mL bovine serum albumin (BSA), 10 µg/mL transferrin, 100 U/mL soybean trypsin inhibitor, 100 U/mL penicillin, 0.1 mg/mL streptomycin, 10 ng/mL EGF, and 10 µg/mL insulin, and 0–250 µmα‐, γ‐ or δ‐tocopherol or α‐, γ‐ or δ‐tocotrienol. In order to dissolve the highly lipophilic vitamin E compounds in aqueous culture media, these compounds were conjugated to BSA as previously described (2000a, 2000b). Measurement of viable cell number was determined in 24‐well culture plates (6–8 wells/group) by the 3‐(4,5‐dimethylthiazol‐2yl)‐2,5‐diphenyl tetrazolium bromide (MTT) colorimetric assay as described previously (Sylvester et al. 1994). In studies assaying cellular levels of EGF‐receptor or total PKCα, cells were grown in control or treatment medium for 5 days, then isolated from their collagen gels with collagenase, and whole cell lysates were prepared for Western blot analysis of EGF‐receptor and PKCα as describe previously (McIntyre et al. 1995; 1996a, 1996b). In studies assaying EGF‐induced EGF‐receptor tyrosine kinase activity or PKCα activation, cells were grown is control or treatment media for 5 days, isolated from collagen gels, and then resuspended in their corresponding EGF‐free control or treatment media for a 3‐h period to restore intracellular protein phosphotyrosine intensity (McIntyre et al. 1998; McIntyre & Sylvester (1998) and cytosolic and membrane PKCα concentrations (Sylvester et al. 1994; 1996a, 1996b) to basal levels. Afterwards, cells were stimulated with 100 ng/mL EGF for 0–60 min, and then whole cell lysates were prepared for Western blot analysis of EGF‐induced intracellular protein phosphotyrosine intensity or subjected to subcellular fractionation followed by Western blot analysis of EGF‐induced PKCα translocation from the cytosolic to membrane (Sylvester et al. 1994; 1996a, 1996b).
Electrophoresis and Western blot analysis
Whole cell lysates and subcellular fractions obtained from the different treatment groups were dissolved in Laemmli buffer (Laemmli 1970) and protein concentrations in each sample was determined using a Bio‐Rad protein assay kit (Bio‐Rad, Hercules, CA) according to the manufacturer’s directions. Equal amounts of protein from each sample (25–50 µg/lane) in a given experiment were loaded on polyacrylamide minigels and electrophoresed through a 7.5% resolving gel. Proteins were transblotted (25 V for 12–16 h) to PVDF membranes (Dupont, Boston, MA) according to the methods of Towbin (Towbin et al. 1979). Membranes were blocked with 2% BSA in 10 mm Tris–HCl containing 50 mm NaCl and 0.1% Tween 20, pH 7.4 (TBST) and then incubated with either antiphosphotyrosine monoclonal antibody (PY20, Transduction Laboratories, Lexington, KY), anti‐EGF‐receptor rabbit polyclonal antibody (1005:sc‐03, Santa Cruz Biotech, Santa Cruz, CA) or anti‐PKCα monoclonal antibody (P16520, Transduction Laboratories, Lexington, KY) in TBST with 2% BSA for 2 h. Membranes were then rinsed 5 times with TBST and then incubated with horseradish peroxidase (HRP)‐conjugated goat anti‐mouse or goat anti‐rabbit second antibody (Transduction Laboratories, Lexington, KY) in TBST with 2% BSA for 1 h. Afterwards, blots were rinsed five times with TBST and protein bands were visualized by chemiluminescence according to the manufacture’s instructions (Pierce, Rockford, IL). In each experiment, blots from each treatment group were exposed on the same piece of film (Kodak X‐OMAT AR, Rochester, NY). Images were acquired with a Microtek 9600XL scanner (Microtek Lab Inc., Redondo Beach, CA) and analysed with Scion software (Scion, Frederick, MD).
Statistical analysis
Differences among the various treatment groups were determined by analysis of variance followed by Duncan’s multiple range test. A difference of P < 0.05 was considered to be significant, as compared to controls or as defined in the figure legends.
Results
Treatment effects of specific tocopherol and tocotrienol isoforms on EGF‐dependent normal mammary epithelial cell growth in primary culture are shown in Fig. 1. Treatment doses for specific tocopherol and tocotrienol isoforms were selected to induced approximately 50% growth inhibition as compared to controls based on previously published dose–response studies (McIntyre et al. 2000a). Although treatment with up to 250 µmα‐ or γ‐tocopherol has not been shown to inhibit EGF‐induced normal mammary epithelial cell growth (McIntyre et al. 2000a), these treatments were included in the present study to serve as negative controls. Cells grown in serum‐free control media displayed approximately a 3‐fold increase in viable cell number over the 5‐day culture period (Fig. 1a,b). In agreement with previous findings, supplementation of culture medium with 250 µmα or γ‐tocopherol had no effect (Fig. 1a), whereas treatment with 100 µmδ‐tocopherol (Fig. 1a), or 50 µmα‐tocotrienol, 10 µmγ‐, or δ‐tocotrienol (Fig. 1b) inhibited EGF‐induced normal mammary epithelial cell growth by approximately 50% as compared to controls.
Figure 1.
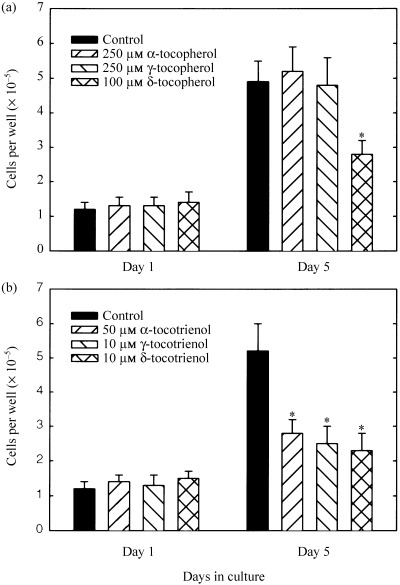
Effects of specific tocopherol (a) and tocotrienol (b) isoforms on EGF‐induced normal mammary epithelial cell growth in primary culture. Vertical bars represent mean cell count/well ± SEM of six to eight wells in each treatment group at the end of the 5‐day culture period. *P < 0.05, as compared to controls within each respective treatment group.
The effects of 250 µmα‐ or γ‐tocopherol, 100 µmδ‐tocopherol, 50 µmα‐tocotrienol, or 10 µmγ‐, or δ‐tocotrienol on EGF‐receptor levels in normal mammary epithelial cells grown for 5 days in primary culture are shown in Fig. 2. Whole cell lysates obtained from the various tocopherol and tocotrienol treatment groups showed little or no differences in relative levels of EGF‐receptor as compared to controls (Fig. 2a). Scanning densitometric analysis of the EGF‐receptor protein bands displayed in Fig. 2a are shown in Fig. 2b.
Figure 2.
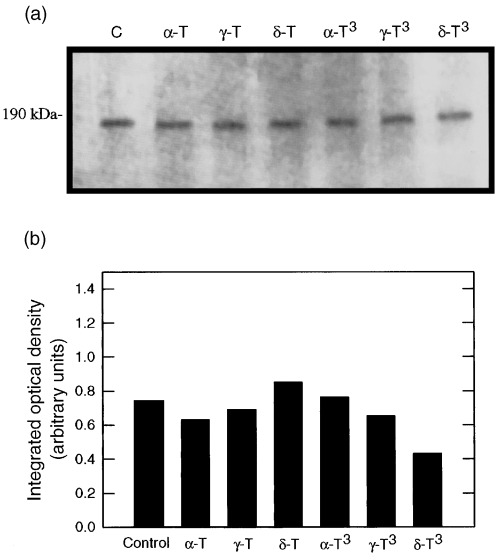
Effects of growth inhibitory or maximum tested doses of individual tocopherol and tocotrienol isoforms on EGF‐receptor levels in normal mammary epithelial cells grown in primary culture. Cells were grown in primary culture for 5 days in serum‐free control or treatment media containing 10 ng/mL EGF. Treatments included the following: Controls (C); 250 µmα‐tocopherol (α‐T); 250 µmγ‐tocopherol (γ‐T); 100 µmδ‐tocopherol (δ‐T); 50 µmα‐tocotrienol (α‐T3); 10 µmγ‐tocotrienol (γ‐T3); or 10 µmδ‐tocotrienol (δ‐T3). Whole cell lysates (25 µg/lane) from the different treatment groups were fractionated by SDS–PAGE and then subjected to Western blot analysis for EGF‐receptor. Scanning densitometric analysis of EGF‐receptor levels visualized in Western blots displayed in (a) is shown in (b). Vertical bars represent the integrated optical density of bands visualized in each lane.
The effects of 250 µmα‐ or γ‐tocopherol, 100 µmδ‐tocopherol, 50 µmα‐tocotrienol, or 10 µmγ‐ or δ‐tocotrienol on EGF‐induced intracellular protein phosphotyrosine intensity in normal mammary epithelial cells grown for 5 days in primary culture are shown in Fig. 3. Following a 3‐h period in EGF‐free media, basal levels of intracellular protein phosphotyrosine intensity showed no differences between control and individual tocopherol treatment groups (Fig. 3a). Following a 5‐min exposure to 100 ng/mL EGF, there was a large increase in intracellular protein phosphotyrosine intensity and this increase was similar in all treatment groups (Fig. 3a). Likewise, basal levels of intracellular protein phosphotyrosine intensity in EGF‐free media was similar in control and individual tocotrienol treatment groups, and following a 5‐min exposure to 100 ng/mL EGF there was a similar increase in intracellular protein phosphotyrosine intensity among these treatment groups (Fig. 3b).
Figure 3.
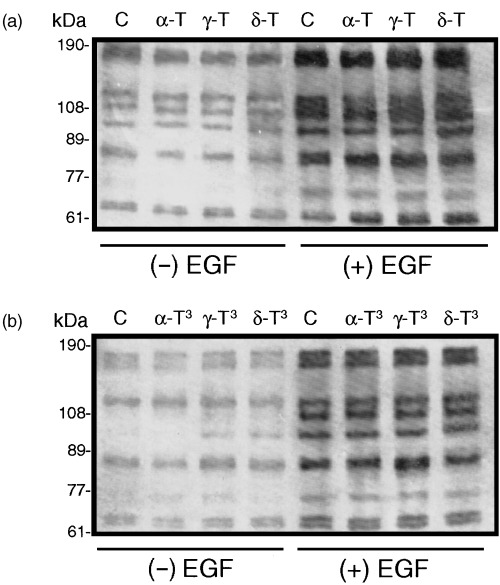
Effects of growth inhibitory or maximum tested doses of individual tocopherol and tocotrienol isoforms on basal (− EGF) and EGF‐induced (+ EGF) intracellular protein phosphotyrosine intensity in normal mammary epithelial cells grown in primary culture. Cells were grown in primary culture for 5 days in serum‐free control or treatment media containing 10 ng/mL EGF. Treatments included the following: Controls (C); 250 µmα‐tocopherol (α‐T); 250 µmγ‐tocopherol (γ‐T); 100 µmδ‐tocopherol (δ‐T); 50 µmα‐tocotrienol (α‐T3); 10 µmγ‐tocotrienol (γ‐T3); or 10 µmδ‐tocotrienol (δ‐T3). Afterwards, cells were isolated from collagen gels and resuspended in their respective EGF‐free treatment media. After a 3‐h incubation period, cells were exposed to 0 or 100 ng/mL EGF for 5 min and then lysed. Whole cell lysates (25 µg/lane) from the different treatment groups were fractionated by SDS–PAGE and then subjected to Western blot analysis for phosphotyrosine intensity. Treatment effects are shown for individual tocopherols (a) and tocotrienols (b).
The effects of 250 µmα‐ or γ‐tocopherol, 100 µmδ‐tocopherol, 50 µmα‐tocotrienol, or 10 µmγ‐ or δ‐tocotrienol on total PKCα levels in normal mammary epithelial cells grown for 5 days in primary culture are shown in Fig. 4. Whole cell lysates obtained from the different treatment groups showed that total intracellular levels of PKCα was slightly lower in γ‐ and δ‐tocotrienol treated cells as compared to the other treatment groups. However, this reduction was relatively minor and did not show a consistent correlation with individual treatment group effects on mammary epithelial cell proliferation (Fig. 4a). Scanning densitometric analysis of the PKCα protein bands displayed in Fig. 4a are shown in Fig. 4b.
Figure 4.
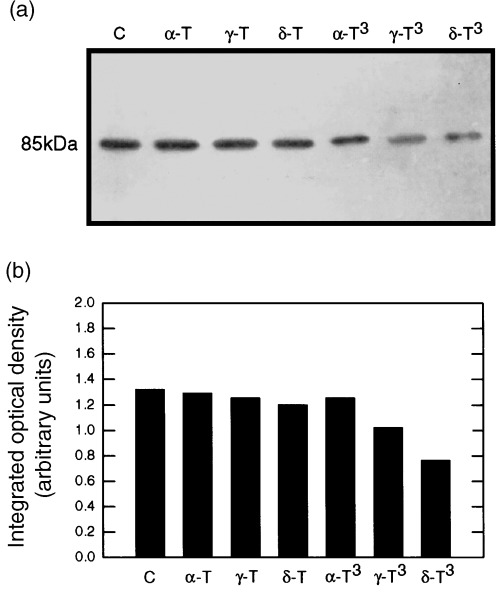
Effects of growth inhibitory or maximum tested doses of individual tocopherol and tocotrienol isoforms on total cellular levels of PKCα in normal mammary epithelial cells grown in primary culture. Cells were grown in primary culture for 5 days in serum‐free control or treatment media containing 10 ng/mL EGF. Treatments included the following: Controls (C); 250 µmα‐tocopherol (α‐T); 250 µmγ‐tocopherol (γ‐T); 100 µmδ‐tocopherol (δ‐T); 50 µmα‐tocotrienol (α‐T3); 10 µmγ‐tocotrienol (γ‐T3); or 10 µmδ‐tocotrienol (δ‐T3). Whole cell lysates (25 µg/lane) from the different treatment groups were fractionated by SDS–PAGE and then subjected to Western blot analysis for PKCα. Scanning densitometric analysis of PKCα levels visualized in Western blots displayed in (a) is shown in (b). Vertical bars represent the integrated optical density of bands visualized in each lane.
The effects of 250 µmα‐ or γ‐tocopherol, 100 µmδ‐tocopherol, 50 µmα‐tocotrienol, or 10 µmγ‐ or δ‐tocotrienol on EGF‐induced PKCα activation in normal mammary epithelial cells after 5 days in primary culture are shown in Fig. 5. Following a 3‐h period in EGF‐free media, exposure to 100 ng/mL EGF resulted in the translocation of PKCα from the cytosolic to membrane fraction in controls, and this effect was not altered by treatment with 250 µmα‐ or γ‐tocopherol (Fig. 5). In contrast, treatment with growth inhibitory doses of δ‐tocopherol, or α‐, γ‐ or δ‐tocotrienol blocked EGF‐induced PKCα translocation from the cytosolic to the membrane fraction (Fig. 5). Scanning densitometric analysis of the cytosolic and membrane PKCα protein bands displayed in Fig. 5 is shown in Fig. 6.
Figure 5.
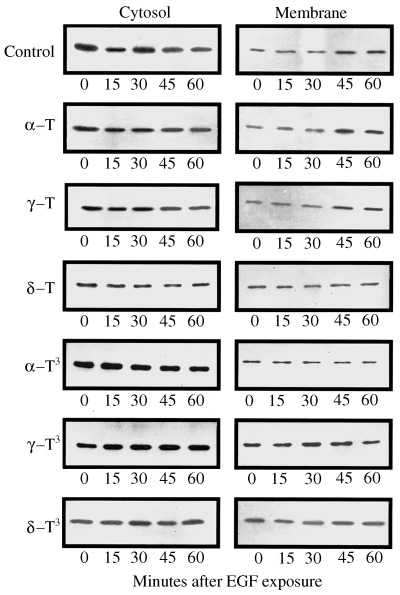
Effects of growth inhibitory or maximum tested doses of individual tocopherol and tocotrienol isoforms on EGF‐induced PKCa translocation from the cytosolic to membrane fraction in normal mammary epithelial cells grown in primary culture. Cells were grown in primary culture for 5 days in serum‐free control or treatment media containing 10 ng/mL EGF. Treatments included the following: Controls (C); 250 µmα‐tocopherol (α‐T); 250 µmγ‐tocopherol (γ‐T); 100 µmδ‐tocopherol (δ‐T); 50 µmα‐tocotrienol (α‐T3); 10 µmγ‐tocotrienol (γ‐T3); or 10 µmδ‐tocotrienol (δ‐T3). Afterwards, cells were isolated from collagen gels and resuspended in their respective EGF‐free treatment media. After a 3‐h incubation period, cells were exposed to 100 ng/mL EGF for 0–60 min. At various time periods after EGF exposure, aliquots of cells from each treatment group were prepared for cytosolic and membrane fractionation. Cytosolic fractions (25 µg/lane) and membrane fraction (50 µg/lane) from each treatment group were fractionated by SDS–PAGE and then subjected to Western blot analysis for PKCα.
Figure 6.
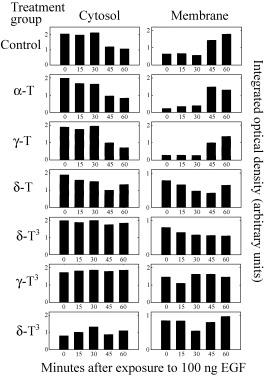
Scanning densitometric analysis of Fig. 5 Western blot visualizing the relative levels of PKCα in cytosolic and membrane fractions at various time points after exposure to 100 ng/mL EGF. Vertical bars represent the integrated optical density of bands visualized in each lane.
Discussion
Results demonstrate that tocopherol and tocotrienol inhibition of EGF‐dependent normal mouse mammary epithelial cell growth does not result from a decrease in EGF‐receptor levels or EGF‐induced EGF‐receptor tyrosine kinase activity. Rather, it appears that the inhibitory effects of specific vitamin E isoforms on EGF‐dependent mitogenic signalling in these cells occur downstream from the EGF‐receptor. Previous investigations have shown that PKCα activation is an early event in EGF‐induced mammary epithelial cell mitogenesis (Sylvester et al. 1994; 1996a, 1996b). The present study shows that although treatment with growth inhibitory doses of δ‐tocopherol, or α‐, γ‐ or δ‐tocotrienol did not alter total intracellular levels of PKCα, these treatments were found to inhibit EGF‐dependent PKCα translocation from the cytosolic to membrane fraction. These finding suggest that the antiproliferative effects of specific tocopherol and tocotrienol isoforms on mammary epithelial cells are mediated, at least in part, by a reduction in PKC activation.
Recent studies showed that individual tocotrienols are significantly more potent than tocopherols in regard to their antiproliferative activity in normal, preneoplastic and neoplastic mammary epithelial cells (2000a, 2000b). Although the exact mechanism mediating tocopherol and tocotrienol suppression of EGF‐dependent cell growth is unknown, the mitogenic actions of EGF are mediated through specific membrane‐bound EGF‐receptors that contain a cytoplasmic tyrosine kinase domain (Ullrich & Schlessinger 1990). EGF stimulation of the EGF‐receptor activates receptor tyrosine kinase activity and induces EGF‐receptor autophosphorylation (Ullrich & Schlessinger 1990). EGF‐receptor autophosphorylation sites are required for substrate interaction and tyrosine phosphorylation (Ullrich & Schlessinger 1990). However, tocopherol and tocotrienol suppression of EGF‐dependent mitogenesis was not found to be associated with a reduction in EGF‐receptor levels or tyrosine kinase activity function in normal mammary epithelial cells. These findings indicate that the antiproliferative effects of specific tocopherol and tocotrienol isoforms do not result from suppression in EGF‐receptor mitogenic responsiveness.
It is well established that EGF stimulation of the EGF‐receptor initiates multiple signal transduction pathways associated with cell proliferation, including PKC activation (Imagawa et al. 1990; Sylvester et al. 1994; 1996a, 1996b). Treatment with phorbol ester has been shown to enhance phospholipid‐dependent PKC activation and potentiate EGF‐dependent mammary epithelial cell growth, whereas treatment with PKC inhibitors induces the opposite results (Imagawa et al. 1990; Sylvester et al. 1994; 1996a, 1996b). PKC consist of a large family of structurally homologous serine/threonine kinases, which display a wide range of tissue and cellular distribution and have distinct sensitivities to lipid activation and regulation (Birkenfeld et al. 1996b). Previous studies have shown that PKCα is present in the highest concentrations in normal mammary epithelial cells and the relative levels of this PKC isoform increases throughout the period of log phase growth (Birkenfeld et al. 1996b).
Growth inhibitory doses of specific tocopherol and tocotrienol isoforms were found to have little or no effect on total intracellular levels of PKCα in normal mammary epithelial cells grown in primary culture. However, these same treatments were observed to inhibit EGF‐induced PKCα translocation from the cytosolic to membrane fraction. In contrast, treatment with relatively high doses (250 µm) of α‐ or γ‐tocopherol had no effect on EGF‐dependent mammary epithelial cell proliferation or PKCα translocation. Previous investigations in vascular smooth muscle cells have shown that α‐tocopherol, but not β‐tocopherol, indirectly attenuates PKCα activation by stimulating protein phosphatases that act to dephosphorylate and diminish PKCα enzymatic activity (Clement et al. 1997; Ricciarelli et al. 1998). Although α‐tocopherol has not been shown to inhibit normal mammary epithelial cell growth, it is possible that similar mechanisms may be involved in mediating the growth inhibitory effects of other tocopherols and tocotrienols isoforms in these cells. Additional studies are required to determine if specific tocopherol and tocotrienol isoforms stimulate phosphatase activity and/or alter PKCα phosphorylation levels and enzymatic activity.
It is not completely understood why individual tocopherol and tocotrienol display differential potencies in regard to their antiproliferative activity in normal mammary epithelial cells grown in primary culture. Direct comparisons between these two vitamin E subclasses have shown that tocotrienols are significantly more potent than tocopherols and this is directly related to the ease or selectivity with which these compounds accumulate within these cells (McIntyre et al. 2000a). It has been suggested that since mammary epithelial cells take up tocotrienols preferentially over tocopherols, higher concentrations are present at their intracellular sites of action, and thereby able to induce a greater biological response (McIntyre et al. 2000a). Studies are currently underway to determine whether specific tocopherol and tocotrienol isoforms affect additional intracellular components associated with EGF‐receptor mitogenic signalling, such as G‐protein or phosphatidylinositol‐3‐kinase activation.
Acknowledgements
The authors thank the Malaysian Palm Oil Board (MPOB) for generously providing purified α‐, γ‐ and δ‐tocotrienol for use in these experiments. This work was supported by LCLTFB grant 2000‐03‐01 and NIH grant CA86833.
References
- Birkenfeld HP, McIntyre BS, Briski KP, Sylvester PW (1996a) Role of protein kinase C in modulating epidermal growth factor‐ and phorbol ester‐induced mammary epithelial cell growth in vitro. Exp. Cell Res. 223, 183. [DOI] [PubMed] [Google Scholar]
- Birkenfeld HP, McIntyre BS, Briski KP, Sylvester PW (1996b) Protein kinase C isoenzyme expression in normal mouse mammary epithelial cells grown in primary culture. Proc. Soc. Exp. Biol. Med. 213, 65. [DOI] [PubMed] [Google Scholar]
- Clement S, Tasinato A, Boscoboinik D, Azzi A (1997) The effect of alpha‐tocopherol on the synthesis, phosphorylation and activity of protein kinase C in smooth muscle cells after phorbol 12‐myristate 13‐acetate down‐regulation. Eur. J. Biochem. 246, 745. [DOI] [PubMed] [Google Scholar]
- Cottrell RC (1991) Introduction: nutritional aspects of palm oil. Am. J. Clin. Nutr. 53, 989S. [DOI] [PubMed] [Google Scholar]
- Imagawa W, Bandyopadhyay GK, Nandi S (1990) Regulation of mammary epithelial cell growth in mice and rats. Endocr. Rev. 11, 494. [DOI] [PubMed] [Google Scholar]
- Jones W, Challowes RC, Choongkittaworn N, Hosick HL, Dils R (1983) Isolation of the epithelial subcomponents of the mouse mammary gland for tissue‐level culture studies. J. Tissue Cult. Methods 8, 17. [Google Scholar]
- Laemmli UK (1970) Cleavage of structural proteins during the assembly of the head of bacteriophage T4. Nature 227, 680. [DOI] [PubMed] [Google Scholar]
- McIntyre BS, Birkenfeld HP, Sylvester PW (1995) Relationship between epidermal growth factor receptor levels, autophosphorylation and mitogenic‐responsiveness in normal mouse mammary epithelial cells in vitro . Cell Prolif. 28, 45. [DOI] [PubMed] [Google Scholar]
- McIntyre BS, Sylvester PW (1998) Genistein and erbstatin inhibition of normal mammary epithelial cell proliferation is associated with EGF‐receptor down‐regulation. Cell Prolif. 31, 35. [DOI] [PMC free article] [PubMed] [Google Scholar]
- McIntyre BS, Briski KP, Hosick HL, Sylvester PW (1998) Effects of protein tyrosine phosphatase inhibitors on EGF‐ and insulin‐dependent mammary epithelial cell growth. Proc. Soc. Exp. Biol. Med. 217, 180. [DOI] [PubMed] [Google Scholar]
- McIntyre BS, Briski KP, Tirmenstein MA, Fariss MW, Gapor A, Sylvester PW (2000a) Antiproliferative and apoptotic effects of tocopherols and tocotrienols on normal mouse mammary epithelial cells. Lipids 35, 171. [DOI] [PubMed] [Google Scholar]
- McIntyre BS, Briski KP, Gapor A, Sylvester PW (2000b) Antiproliferative and apoptotic effects of tocopherols and tocotrienols on preneoplastic and neoplastic mouse mammary epithelial cells. Proc. Soc. Exp. Biol. Med. 224, 292. [DOI] [PubMed] [Google Scholar]
- Nesaretnam KR, Stephen R, Dils R, Darbre P (1998) Tocotrienols inhibit the growth of human breast cancer cells irrespective of estrogen receptor status. Lipids 33, 461. [DOI] [PubMed] [Google Scholar]
- Packer L (1991) Protective role of vitamin E in biological systems. Am. J. Clin. Nutr. 53, 1050S. [DOI] [PubMed] [Google Scholar]
- Ricciarelli RA, Tasinato A, Clement S, Ozer NK, Boscoboinik D, Azzi A (1998) alpha‐Tocopherol specifically inactivates cellular protein kinase C alpha by changing its phosphorylation state. Biochem. J. 334, 243. [DOI] [PMC free article] [PubMed] [Google Scholar]
- Sylvester PW, Birkenfeld HP, Hosick HL, Briski KP (1994) Fatty acid modulation of epidermal growth factor‐induced mouse mammary epithelial cell proliferation in vitro . Exp. Cell Res. 214, 145. [DOI] [PubMed] [Google Scholar]
- Towbin H, Staehelin T, Gorden J (1979) Electrophoretic transfer of proteins from polyacrylamide gels to nitrocellulose sheets: procedure and some applications. Proc. Natl. Acad. Sci. 76, 4350. [DOI] [PMC free article] [PubMed] [Google Scholar]
- Ullrich A, Schlessinger J (1990) Signal transduction by receptors with tyrosine kinase activity. Cell 61, 203. [DOI] [PubMed] [Google Scholar]
- Yu W, Israel K, Liao QY, Aldaz CM, Sanders BG, Kline K (1999) Vitamin E succinate (VES) induces Fas sensitivity in human breast cancer cells: role for Mr 43 000 Fas in VES‐triggered apoptosis. Cancer Res. 59, 953. [PubMed] [Google Scholar]