

Abstract
Abstract. Incorporation of bromodeoxyuridine (BrdU) during DNA replication is frequently used for cell cycle analysis. The flow cytometric BrdU/Hoechst quenching technique is conducive to high‐resolution assessment of cell cycle kinetics, but requires continuous BrdU treatment, which may have cytostatic or cytotoxic effects. Here, we have examined the impact of BrdU on the proliferation of BT474 and SK‐BR‐3 breast cancer cell lines and compared the observed effects with cell proliferation of RT4 and J82 bladder carcinoma cells, previously described to be sensitive and insensitive to BrdU, respectively. Both uni‐ and bi‐parametric DNA measurements were performed to identify BrdU‐induced alterations in the S‐phase fraction and in cell cycle progression. An annexinV/propidium iodide (PI) assay was used to identify potential induction of apoptosis by BrdU. Proliferative activity in BT474, SK‐BR‐3, and RT4 cultures was reduced in different cell cycle phases due to continuous treatment with 60, 5.0, and 3.5 µm BrdU. This effect, which was not found in J82 cultures, was dependent on exposure time (96 versus 48 h) and was also dose‐dependent for RT4 and SK‐BR‐3. BrdU application does not induce apoptosis or necrosis as revealed with the annexin V/PI assay. We concluded that continuous BrdU treatment did not affect cell viability, but essentially alters cell cycle progression in three out of four cell lines tested. Cell‐type specific validation of the feasibility of the powerful BrdU/Hoechst quenching technique is required and recommended.
INTRODUCTION
The flow‐cytometric BrdU/Hoechst quenching technique is a powerful tool to analyse cell cycle distribution and kinetics. It has a broad application spectrum (Rabinovitch et al. 1988) and is unique for studying mitogenic, cytostatic and cytotoxic effects of growth factors and potential effects of drugs on cell proliferation (Ormerod et al. 1992; Poot et al. 1994). Up to three consecutive cell cycles of synchronized (Rabinovitch et al. 1988) or asynchronously (Ormerod et al. 1992) growing cell populations in vitro can be investigated. The fraction of quiescent cells (G0 cells) and their potential to re‐enter the cell cycle via G0‐ to G1‐transition can be quantified. In addition, exit probability from any cell cycle phase can be evaluated. The BrdU/Hoechst quenching method requires continuous incubation of cells with BrdU to guarantee complete thymidine substitution in one DNA strand during the first cell cycle and in the second DNA strand during the following cell cycle. Cells that are continuously exposed to bromodeoxyuridine (BrdU) incorporate this thymidine analogue into DNA strands during DNA replication. Staining of these cells with Hoechst 33258, which is quenched by the BrdU/thymidine exchange, and a DNA intercalating dye, such as propidium iodide (PI), which is not affected by BrdU incorporation, results in cell cycle and cell cycle phase dependent fluorescence signals (Ormerod et al. 1992) (Fig. 1). The two‐dimensional cytogram allows resolution of individual cell cycle phases within three successive cell cycles. Measured PI fluorescence is directly proportional to the DNA content of cells and is twice as high in G2/M cells compared with G0/G1 cells. Hoe33258 fluorescence intensity depends on the amount of BrdU incorporated over time, which increases within these cell cycle phases (DNA content in G0/G1‐, S‐, G2/M‐phase) and in the successive cell cycles observed. Quenching effects of Hoe33258 fluorescence can be observed over the first cell cycle (Latt et al. 1977; Kubbies et al. 1989; Endl et al. 1997). The unifiliary thymidine substitution by BrdU during the first cell cycle of BrdU exposure causes a decrease of Hoe33258 fluorescence intensity with increasing DNA content. The bifiliary incorporation of BrdU into the second DNA strand over the second cell cycle results in an increase of Hoe33258 fluorescence intensity with increasing DNA content (Kubbies et al. 1989). The individual fluorescence characteristics of Hoe33258 generate a reversed image between the first and second cell cycles. However, cells of the third cell cycle can be found in parallel to cells running through the second cycle. We intended to use the BrdU/Hoe quenching method to analyse cell cycle kinetics of BT474 and SK‐BR‐3 breast cancer cells lines which both overexpress the HER2/neu receptor (Brockhoff et al. 2001). erbB‐receptor‐dependent cell cycle regulation in the presence of Her2/neu overexpression provides an experimental basis for the development and specification of erbB‐receptor and/or proliferation based therapeutics. However, before applying this technique, we had to exclude any potential BrdU‐induced inhibitory effects due to continuous DNA labelling. Gradual thymidine substitution by halogenated deoxyuridine entails conformational alterations of the 3‐D DNA structure that can be recognized by DNA binding and/or interacting molecules and may alter protein stickiness to the DNA (Goz 1977). Also, continuous BrdU exposure may disturb the balanced nucleotide pool in cell cultures. In light of these side‐effects, cytostatic consequences resulting in blockage of cell cycle progression, induction of differentiation‐like events (Poot et al. 1994), and even induction of cell death by BrdU, may occur. Human skin fibroblasts, for example, show cell cycle retardation and partial G1‐phase arrest in the second cell cycle when exposed to only 10 µm BrdU (Rabinovitch et al. 1988), while other cell types such as NIH 3T3 (Poot et al. 1994) and human peripheral blood leucocytes (hPBL) (Kubbies et al. 1985) have been considered not to be affected even by high BrdU concentrations of 300–650 µm. With respect to these reports, we have evaluated a potential cell type‐specific sensitivity to long‐term exposure of BrdU in BT474 and SK‐BR‐3 breast cancer cell lines. We compared the effect of BrdU on cell proliferation of these cell lines to cell proliferation of RT4 and J82 bladder cancer cell lines, known to be sensitive and insensitive to continuous BrdU treatment, respectively. In addition, single parametric DNA measurements with PI were performed to calculate S‐phase‐fraction (SPF) and to determine sensitivity of the different cell lines for BrdU concentrations ranging between 3.5 and 60 µm. AnnexinV staining was performed to evaluate whether alterations in SPF are caused by induction of apoptosis. Cell cycle progression of the cell lines investigated in this study was differentially affected by continuous BrdU treatment. Cell proliferation of BT474, SK‐BR‐3 and RT4 cells was inhibited on a different level of cell cycle progress, implying that any potential BrdU‐induced inhibitory effect on cell proliferation has to be excluded prior to the application of the BrdU/Hoechst quenching technique.
Figure 1.
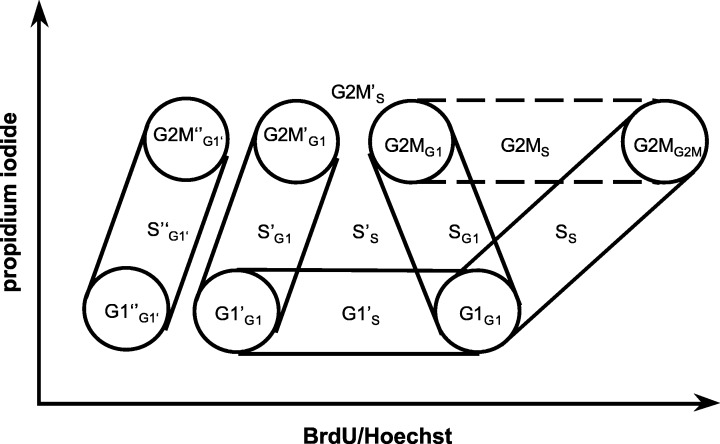
Schematic bivariate diagram of BrdU/Hoe33258 versus propidium iodide fluorescence intensities. The distribution of three successive cell cycles with cell cycle phases G1, S, G2/M of an asynchronous cell population continuously exposed to BrdU is shown. Superscript bars indicate the first (none), the second (’) and the third (”) cell cycles. Subscript labels indicate the cell cycle phase of origin. [modified from Ormerod and Kubbies (1992)].
MATERIALS AND METHODS
Cell culture
The human breast cancer cell lines BT474 and SK‐BR‐3 were obtained from the European Collection of Animal Cell Cultures (ECACC) and grown in Dulbecco's modified Eagle's medium (DMEM) (Gibco, Grand Island, NY, USA) supplemented with 5% foetal calf serum (FCS) (Sigma, Deisenhofen, Germany). Human bladder cancer cell lines RT4 and J82 characterized by a high and a low grade of differentiation (Rigby et al. 1970; O’Toole et al. 1978) were cultured in RPMI‐1640 (Biochrom, Berlin, Germany) medium containing 5% FCS (Masters et al. 1986). Cells were seeded at cell densities of 2 × 10⁵ cells per T75 tissue flask (Greiner, Frickenhausen, Germany) and incubated in humidified atmosphere containing 5% CO2 at 37 °C. Culture medium was refreshed every 2 days. Cells were routinely grown for 7 days, then washed with phosphate‐buffered saline (PBS, pH 7.4, Biochrom) and detached from culture flasks by 0.05% trypsin/0.02% EDTA treatment for 3 min at 37 °C in PBS.
Single cell suspensions were either stained immediately for determination of apoptosis or were frozen in freezing medium [medium + 10% FCS + 10% dimethylsulfoxide (DMSO)] at a concentration of 106 cells/ml at −20 °C for uni‐ and bivariate DNA staining.
BrdU labelling
All cell samples were seeded on the same day into T75 culture flasks (Greiner) and incubated for a period of 7 days. In order to avoid cell–cell‐contact‐induced inhibition of cell proliferation due to cell confluency, just 2 × 10⁵ cells per flask were initially seeded. This procedure ensured that cells were in a subconfluent state after 7 days of incubation. Fresh medium containing 60, 5 or 3.5 µm 5‐bromo‐2′‐deoxyruridine (BrdU, Sigma) was added to cell cultures after 3 or 5 days. To minimize potential disturbances in the nucleotide pathway due to BrdU treatment, medium was also supplemented with deoxycytidine (Sigma) at concentrations of 30, 2.5 and 1.6 µm, respectively. Cells were protected from visible light irradiation by wrapping culture flasks with aluminium foil and were harvested at low light intensities. BrdU‐exposed cells were compared with control samples grown without BrdU supplement, for identical time intervals. Cell detachment was performed after identical periods of growth, both in the case of BrdU‐treated and ‐untreated (control) cells. Experimental procedures to cell cultures was as follows: day 0: cell seeding, day 3 addition of BrdU (96 h BrdU exposure), day 5: addition of BrdU (48 h BrdU exposure), day 7: cell detachment of BrdU‐treated and ‐untreated samples, followed by cell storage in freezing medium or immediate preparation for flow cytometric analysis.
Cell staining
For BrdU/Hoechst 33258 and PI staining, frozen cells were thawed, centrifuged (5 min, 4 °C, 300 g) and washed twice with 2 ml of ice cold DNA‐staining buffer [100 mm Tris pH 7.4, 154 mm NaCl, 1 mm CaCl2, 0.5 mm MgCl2, 0.1% IGEPAL, 0.2% bovine serum albumin (BSA)]. Cells (0.5 × 10⁵) were resuspended in 1 ml buffer supplemented with 10 U/ml RNAse (Roche, Basel, Switzerland) and 1.2 µg/ml Hoechst 33258 (Sigma) for 15 min at 37 °C. A 1‐mg/ml stock solution of PI was added to a final concentration of 1.5 µg/ml and incubated for 15 min on ice. Samples were passed through a 70‐µm nylon mesh to remove cell aggregates prior to flow cytometric analysis.
For conventional univariate DNA staining, frozen cells were thawed, washed twice with PBS supplemented with 0.2% BSA and fixed in 70% methanol at 4 °C for at least 1 hour. Then, cells were washed twice in PBS buffer containing 0.2% BSA followed by an incubation in the same buffer supplemented with 10 U/ml RNAse (20 min, 37 °C). Subsequently, PI was added to a final concentration of 25 µg/ml. Samples were incubated for 15 min and analysed. Cells were kept in the dark during preparation.
Quantitative analysis of cell cycle kinetics
We calculated the fraction of asynchronous growing cells in G1‐, S‐ and G2/M‐phases of three subsequent cell cycles and the time course by appropriate gating for particular cell cycle fractions as shown in Fig. 1. By drawing regions around individual G1‐, S‐, and G2/M‐phases of the first, second and third cell cycles, we calculated the cell fractions within three consecutive cell cycles and thence quantitatively calculated the successive cell cycle progress over time.
AnnexinV/propidium iodide assay/evaluation of apoptosis and necrosis
For evaluation of potential apoptotic and necrotic cells induced by BrdU, cells were stained using the TACS™ annexinV‐FITC kit (R & D Systems, Wiesbaden‐Nordenstadt, Germany). According to Koopmann et al. (1994), cells in early apoptosis are annexinV‐FITC positive but exclude low PI concentration, whereas late apoptotic cells are both annexinV‐FITC and PI positive. In contrast, live cells are annexinV‐FITC and PI negative. As a positive apoptotic control, BT474 cells were seeded in a 24‐well plate at a cell density of 5 × 10⁴ cell per well according to Spiridon et al. (2002). After 24 h sodium azide (NaN3) was added at a final concentration of 180 mm and cells were incubated for an additional 4 h. Untreated cells served as negative control. After detachment with trypsin, cells were washed twice with PBS supplemented with 2% BSA and stained according to the manufacturer's instructions. PI was added 1 min before flow cytometric analysis.
Flow cytometric analysis
A FACStarplus dual laser cell sorter (BD Biosciences, San Jose, CA, USA) was used for BrdU/Hoechst quenching measurements. PI fluorescence was excited with an air‐cooled argon ion laser (emission wavelength 488 nm, output power 30 mW) and measured with a 630/22 nm bandpass filter. Hoechst fluorescence was measured using UV‐light excitation from a second laser (water‐cooled argon ion laser, emission wavelength 365 nm, output power 100 mW) with emission monitored with a 425/44 nm bandpass filter.
For conventional DNA analysis, a FACSCalibur flow cytometer (BD Biosciences) equipped with an argon laser, a diode laser, and four photomultipliers (PMT) for fluorescence detection was used. PI was excited by 488 laser light and the emission was detected at 670 nm (long pass filter).
All measurements were performed with CellQuest Software (BD Biosciences) and data were stored as list mode on a Macintosh G3 computer. Data were analysed with the same software using multiparametric gating. Cell debris and aggregates were excluded by using pulse processing. Statistic cell cycle analysis was performed with WinCycle software (Phoenix Flow Systems, San Diego, CA, USA).
Statistical analysis
The Student‐t‐test for independently acquired samples was applied to calculate mean values ± standard deviation of SPF determined from uniparametric DNA analysis (Fig. 4). Each measurement was performed at least in triplicate (n = 3) except for the 48‐h value of BT474 (Fig. 4), which was acquired eight times (n = 8) for validation.
Figure 4.
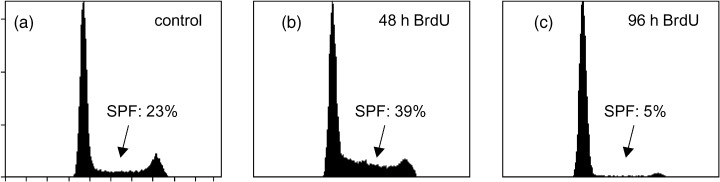
Single parametric DNA diagrams of BT474 cells stained with PI. Measurements were performed on a FACSCalibur flow cytometer after 48 h without (a) and with 60 µm BrdU (b), and after 96 h of 60 µm BrdU treatment (c). DNA histograms were analysed with the MultiCycle for Windows software.
RESULTS
Different effects of BrdU on cell cycle progression in BT474, SK‐BR‐3, RT4 and J82 cells
Biparametric BrdU/Hoe versus PI diagrams of BT474 (A and B), SK‐BR‐3 (C and D), RT4 (E and F) and J82 (G and H) cells after treatment with 60 µm BrdU for 48 and 96 h, respectively, are shown in Fig. 2.
Figure 2.
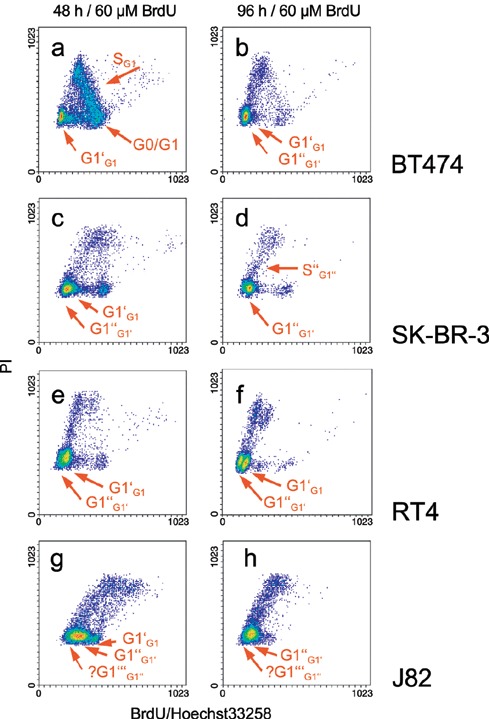
Two parametric BrdU/Hoe33258 versus PI fluorescence density plots of cells (breast cancer: BT474, SK‐BR‐3; bladder cancer: RT4, J82) treated with 60 µm BrdU for 48 and 96 h, respectively. Cell‐specific characteristics in cell cycle distribution are highlighted with red arrows and labelled according to the nomenclature given in Figure 1. BT474: cells show a transient delay in cell cycle progression represented by a high S‐phase value analysed after 48 h (a) (see also Figure 4). After 96 h cells have overcome this delay with 9% of cells in G1’ of the second and 80% in G1‘‘ of the third cell cycle (b). SK‐BR‐3: cells can be found delayed in G1’ after 48 h (78%). After 96 h, 97% of all cells have completed the first cell cycle, but appear repeatedly accumulated in G1‘‘ of the third cell cycle (d). A small fraction has entered the S‐phase of the third cell cycle (S‘‘G1‘‘). RT4: 87% of all cells are found in G1’ of the second cell cycle after 48 h (e). Only 3% have entered the S“‐phase. After 96 h, 28% of cells are in G1“ of the third cell cycle. A small fraction (9%) of cells has reached S“‐ and G2“/M“‐phase of the third cycle. J82: no inhibitory effect of BrdU exposure on cell cycle progression of J82 could be detected. A cell cycle distribution showing that all cells have left the first and entered the second, or even the third, cell cycle after 48 h is shown (g). Most cells (96%) can be found in the third cell cycle after 96 h. That J82 cells appear to have entered a fourth cell cycle after 48 and 96 h, but cannot be unambiguously resolved, is indicated by a question mark (g, h).
BT474 After 48 h of BrdU incubation (Fig. 2a) most of BT474 cells (67%) originated from the first cell cycle had entered the G1′‐phase of the second cell cycle. Only a few cells (3%) had entered the S′‐phase of the second cell cycle. The SPF of BT474 cells was conspicuously but transiently high after 48 h BrdU treatment. After 96 h of BrdU incubation, the SPF of the first cell cycle was drained and a small cell fraction only represented the G1′‐phase (Fig. 2b). The majority of cells were found in the G1″‐phase of the third cell cycle. A very small subpopulation (4%) was capable of leaving the G1″‐phase of the third cell cycle and entering the S″‐phase. Few cells (2%) did not proliferate and represented G0/G1 cells of the first cell cycle.
SK‐BR‐3 SK‐BR‐3 cell cycle progression was slowed down by BrdU treatment as shown by 78 and 97% G1 cells of the second and third cell cycles after 48‐h (Fig. 2c) and 96‐h (Fig. 2d) BrdU treatment. Cells of the second (G1′) and of the third (G1″) cell cycle are found in panel C. After 96 h BrdU exposure, 97% of all cells were within the third cell cycle, 93% representing a delay in the G1″‐compartment of the third cell cycle (Fig. 2d). Only 3% of SK‐BR‐3 cells had left the G1″‐phase and had entered the S″‐phase of the third cell cycle, represented by a cell track emerging from the G1″‐phase. SKBR‐3 cells were mainly delayed in the G1″‐phase of the third cell cycle. The absolute cell count was not substantially increased within the period from 48‐to 96‐h BrdU incubation due to 97% G1″‐phase cells.
RT4 RT4 bladder cancer cells proceeded thorough the cell cycle by entering the second and third cycles in the presence of BrdU (Fig. 2e and f). After 48 h, 87% of the cells were in the G1′‐compartment of the second cell cycle where a track of cells emerged from entering the S″‐phase (Fig. 2e). In addition, after 48 h, a small subpopulation had already arrived in the G1″‐phase of the third cell cycle. After 96 h BrdU treatment, the majority of RT4 cells had accumulated either in the G1′‐phase of the second (57%) or the G1″‐phase the third (28%) cell cycle, but the corresponding S‐phase fraction was small (5%) and cell doubling time had lengthened. The low SPF after 96 h shown in panel F was in accordance with the single parametric PI measurement shown in Fig. 4(c).
J82 This cell line appeared not to be affected by BrdU treatment. After 48 h, all cells had left the first and were distributed in the second and third cell cycles, represented by the two tracks in parallel lower left and higher. Seventy‐two per cent of the cells can be attributed to the third cell cycle (sinistral track). After 96 h, almost all cells (96%) had left the second cell cycle and can be found in the third and eventually fourth cycles. Resolution to distinguish between the third and fourth cell cycles is limited, but J82 proliferation was fast and without any BrdU‐induced delay or inhibition.
S‐phase fraction in BrdU‐treated cells
The SPF calculation from single parametric DNA measurements with PI, showing that the SPF of SK‐BR‐3 and RT4 cells was reduced in a dose‐dependent manner by BrdU application, is summarized in Fig. 3. Higher BrdU concentrations even led to a pronounced decrease in SPF. The influence of BrdU on SK‐BR‐3 and RT4 cells was dependent on both the concentration of BrdU and exposure time. The lowest SPF value in these cells was about 5%, measured after 96 h of incubation with 60 µm BrdU. In addition, this decrease in SK‐BR‐3 was more pronounced after 96 h of BrdU treatment compared with a 48‐h incubation interval. In contrast to SK‐BR‐3 and RT4 cells, the reduction of SPF in BT474 induced by BrdU was dose independent (P‐value calculated with the Student‐t‐test was 0.001 for SK‐BR‐3 cells treated with 60 µm BrdU compared with 5 µm BrdU treatment, measured after 48 h). Within the concentration range 3.5–60 µm BrdU, higher concentration (60 µm) had no further inhibitory effect on BT474 cells compared with 3.5 or 5.0 µm BrdU treatment analysed after 96 h. Strikingly, 60 µm BrdU increased the SPF of this cell line tremendously when analysed after 48 h. However, the SPF of BT474 cells was significantly reduced by sustained BrdU incubation (96 h). Figure 4 shows DNA histograms of PI stained BT474 cells. The SPF is 23% under control conditions (Fig. 4a). Similar to SK‐BR‐3 and RT4 cells, the SPF of BT474 cells was considerably decreased when cells were treated with BrdU for 96 h (Fig. 4c). However, 48‐h BrdU incubation transiently elevated the SPF increment to 39% (Fig. 4b) compared with the control (Fig. 4a).
Figure 3.

S‐phase fraction (SPF) in cultures (breast cancer: BT474, SK‐BR‐3; bladder cancer: RT4, J82) treated with increasing concentrations of BrdU (3.5, 5.0, 60 µm) for 48 and 96 h, respectively, as compared with untreated controls. (Untreated control cells serve for both, the 48‐ and 96‐h values. See MATERIAL AND METHODS.) SPF was analysed by flow cytometry using uni‐parametric DNA staining with PI. Mean values (n = 3) ± standard deviation are shown. A dose‐dependent decline in SPF in SK‐BR‐3 and RT4 cells was identified. The reduction of SPF in BT474 cells appeared to be dose‐independent. However, after 48 h 60 µm BrdU treatment induced an unexpected but reproducible and significant increase in SPF. SPF in J82 cultures was in general unaffected by BrdU; the slight increase in some SPF values, e.g. 60 µm BrdU for 48 h was not significant. *P < 0.05 (Student t‐test) for SPF in treated versus untreated cells. Control 3.5 µm BrdU 5.0 µm BrdU 60 µm BrdU.
In contrast to BT474, SK‐BR‐3, and RT4 cells, J82 cells were not affected by BrdU (Fig. 2g and h): this cell line revealed no significant SPF alteration after exposure to 3.5, 5 and 60 µm BrdU for 48 and 96 h as compared with control samples. Figure 2(h) shows that all J82 cells had entered the third cell cycle after 96 h and Fig. 3 summarizes the relatively high but constant SPF values of 17 to 20% in J82 cultures for all treatment modalities.
Potential induction of apoptosis in BrdU‐treated cells
BrdU‐induced apoptosis of G2/M phase cells was hypothesized to cause the increase in SPF in 48‐h treated BT474 cultures. Therefore, a set of experiments using annexinV/PI double staining was performed to identify apoptotic cell death in these cultures. As shown in Fig. 5, untreated BT474 cultures contained a minimal apoptotic fraction of 4% (Fig. 5a). NaN3‐treament (positive control) induced apoptosis, with the annexinV‐positive cells reaching 20%. In addition, 15% annexinV‐FITC/PI positive cells were found in an advanced apoptotic state. Our experiments clearly showed that exposure to BrdU did not result in an increase of apoptotic cell fractions, neither for the 48‐h nor for the 96‐h incubation interval, with 2 and 3% of cells in apoptosis (annexinV‐positive/PI negative), respectively.
Figure 5.
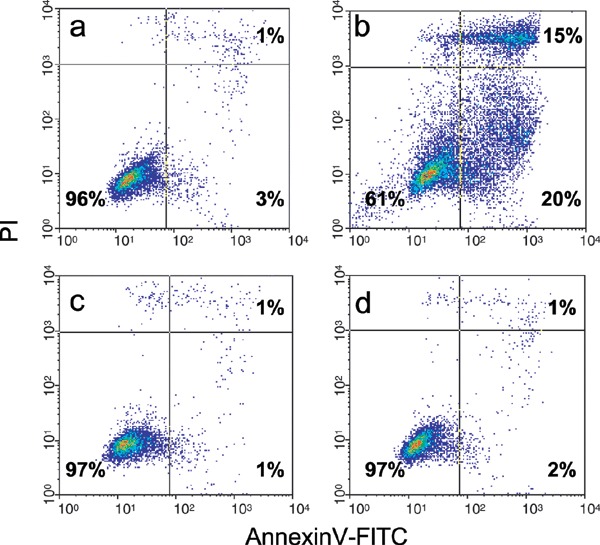
Flow cytometric analysis of apoptosis in BT474 cells. AnnexinV‐FITC/PI staining discriminates cells in early (lower right quadrant) and advanced apoptotic states (upper right quadrant). Viable cells are double negative (lower left quadrant). The apoptotic cell fraction was 4% in untreated controls (a) and 35% of cells can be found in the upper and lower right quandrant when cells are treated with 180 mm NaN3 for 4 h (b). After treatment with 60 µm BrdU for 48 h (c) and 96 h (d) the proportion of apoptotic cells was 2–3% and did not significantly differ from the negative control.
DISCUSSION
The flow cytometric BrdU/Hoechst quenching technique is a multi‐informative and advanced method for cell cycle analysis. Its application yields the following information:
-
•
the fractions of cells actively cycling (G1, S, G2/M);
-
•
individual cells attributable to at least three successive cell cycles;
-
•
the percentage of the non‐cycling fraction (G0);
-
•
the duration of any cell cycle phase;
-
•
the probability by which resting cells are recruited into the cell cycle and by which cells are capable of transit from one cell cycle phase to the next, that is the transition of cell cycle check points;
-
•
the replicative history of cells during the period of observation.
This method clearly extends the potential of conventional proliferation assays such as MTT‐like assays, H3‐tymidine incorporation, or univariate DNA analysis in flow cytometry. These techniques provide only a single piece of information such as the S‐phase‐fraction (static DNA analysis, BrdU incorporation in histological sections), the number of viable cells with active metabolism (MTT or related assays) or average proliferation activity (H3‐thymidine incorporation). The flow cytometric BrdU/Hoechst quenching technique is a more powerful tool for cell cycle analysis, because regulation of cell proliferation under defined conditions can be analysed in detail. In contrast, other methods provide static information based on a ‘snapshot’ (for example propidium iodide measurement in flow cytometry) or ‘endpoint‐measurement’ (for example the MTT‐test) and are less sensitive and specific. However, the BrdU/Hoechst quenching method requires continuous cell exposure to BrdU, a thymidine analogue that may interfere with nucleic acid metabolism and consequently might impair normal in vitro cell cycle regulation.
In the present study, we described the effect of continuous BrdU incubation on two breast (BT474, SK‐BR‐3) and two bladder (RT4, J82) cancer cell lines. We observed different effects of BrdU on cell proliferation of these cell lines. According to existing data (Endl et al. 1997), J82 cells are unaffected by BrdU treatment. However, we found that proliferation of SK‐BR‐3 and RT4 cells was inhibited by BrdU in a dose‐ and time‐dependent manner, whereas the reduction in cell cycle progression in BT474 cultures was independent of the BrdU concentration. These findings indicate that the effect is cell‐type specific but not restricted to cell lines from one tumour type. Interestingly, breast cancer cells BT474 were transiently retarded in the S‐phase of the first cell cycle, subsequently passed through the second cycle, and were finally delayed in the G1″‐ phase of the third cycle (Fig. 2a and b). SK‐BR‐3 and RT4 cells were not arrested but were repeatedly delayed in the G1‐phase of the second and third cell cycles by BrdU treatment (Fig. 2c, d, e and f). Cell cycle retardation of BT474 and SK‐BR‐3 cells was predominant in G1″ of the third cell cycle and might be interpreted as a discharge of cells from the active cycling cell pool (G1‐, S‐, G2/M‐phases). This late induced delay could be attributed to bifiliary thymidine substitution not occurring until the second cell cycle. However, the more dispersed cell enrichment of RT4 in G1 within both the second and third cell cycles was due to a significant prolongation of the G1‐phase. In contrast to BT474 and SK‐BR‐3 cells, the RT4 cell line was already retarded in the G1′‐phase of the second cell cycle, that is after unifiliary thymidine substitution. This leads to the hypothesis of at least two different mechanisms for BrdU‐associated cell cycle alteration: (i) a pronounced delay in the G1″‐phase of the third cell cycle after bifiliary thymidine substitution in the case of breast tumour cells BT474 and SK‐BR‐3 and (ii) a repeated prolongation of the G1‐phase of the second and the third cell cycles in the urothelial cancer cell line RT4, that can be attributed to both unifiliary and bifilary BrdU incorporation, respectively. Hence, in this study, RT4 cells showed the highest sensitivity to BrdU exposure. In order to investigate any organ/tissue‐specific mechanisms of BrdU‐induced inhibition, we additionally analysed cell proliferation of other cells, including human breast cancer (MDA‐MB231, MDA‐MB‐435, T47D, MCF7), colon carcinoma (SW480, HT29, HTC116) and prostate carcinoma (LNCaP) cell lines. We did not observe any noteworthy inhibition of proliferation within this broader range of tumour cell lines. Therefore, we concluded that the BrdU‐mediated effect was not tissue‐type dependent.
An inhibitory effect of BrdU on cell proliferation has been demonstrated in gastric carcinoma cells; p53‐dependent and ‐independent regulation was implicated (Peng et al. 2001). The underlying molecular mechanisms concerned are (i) direct DNA damage due to the level of BrdU incorporation, (ii) disturbances of the nucleotide pathway caused by BrdU excess, and/or (iii) modified DNA‐protein binding characteristics after BrdU incorporation (Cleaver 1967; Goz 1977; Kaufmann & Davidson 1978). An excess of thymidine or its analogues such as BrdU can cause a ‘thymidine block’ induced cell cycle arrest. Addition of deoxycytidine in half‐equimolar concentrations of BrdU has been suggested to balance the nucleotide pool and to avoid this effect (Cleaver 1967; Kaufmann et al. 1978; Endl et al. 1997). In our experiments, the cell cycle in three cell lines was inhibited in spite of the deoxycytidine supplementation. Therefore, we conclude that the BrdU‐induced cell cycle slow‐down we describe here is based on a delayed G1″‐phase exit after bifiliary thymidine substitution (BT474 and SK‐BR‐3) or after uni‐ and bifiliary thymidine substitution (RT4) in combination with a perturbed nucleotide pool, that cannot be compensated for by deoxycytidine supplementation.
Continuous labelling of cells with 100 µm BrdU is frequently recommended to investigate cell proliferation with the BrdU/Hoechst quenching technique (Goz 1977; Kubbies 1999; , Ormerod et al. 1992). However, Latt et al. (1977) described in the late 1970s that 10 µm BrdU results in sufficient thymidine substitution for subsequent Hoechst 33258 quenching (factor of 4) to allow differentiation and quantification of cycling and non‐cycling cells. Later, concentrations above 10 µm were shown to induce cell cycle retardation in different fibroblasts and fibroblast‐like cells with increasing oxygen concentrations (Rabinovitch et al. 1983; Poot et al. 1988). In contrast, NIH‐3T3 murine fibroblasts were described to tolerate even 300 µm BrdU without any detectable growth inhibition (Poot et al. 1994). We evaluated the effect of BrdU in the range of 0.1–100 µm and found 3.5 µm to be the lowest concentration which resulted in sufficient thymidine substitution to quench Hoechst 33258 fluorescence. However, BrdU caused cytostasis in BT474, SK‐BR‐3, and RT4 cells even at this low concentration. Treatment with 1.0 and 0.1 µm BrdU with a potentially lower effect on cell cycle progression did not cause Hoechst 33258 fluorescence quenching (data not shown), indicating that BrdU concentrations below 3.5 µm BrdU were insufficient for biparametric BrdU/Hoe measurements. However, in order to avoid any BrdU‐induced inhibitory effect on cell proliferation, it can be recommended to use the lowest BrdU concentration that is sufficient to cause Hoechst quenching.
In previous studies, we have applied the BrdU pulse‐labelling technique to analyse cell cycle kinetics (Brockhoff et al. 2001). Compared with the continuous labelling modality, we found that a 30‐min BrdU pulse‐treatment with 20 µm had no effect on cell proliferation of BT474 and SK‐BR‐3 cells (Brockhoff et al. 2001), indicating that the BrdU‐induced inhibition described herein is based on complete thymidine substitution within the first cell cycle and a bifiliary replacement in the second cell cycle due to continuous BrdU exposure. Short‐time incubation with BrdU leads to incomplete thymidine substitution only in one DNA strand. Thus, cell cycle delay (BT474, SK‐BR‐3) or prolongation of the G1‐phase (RT4) becomes apparent only with progressive thymidine displacement.
Besides the general cell cycle inhibition, BT474 cells showed a conspicuous increment of SPF after 48 h of 60 µm BrdU treatment (4, 2, 3). This effect was transient as SPF was significantly decreased for the 96‐h incubation interval compared with control samples (Fig. 4). An artificial increase in SPF due to apoptotic cells (for example, derived from disaggregating G2/M‐phase cells) was excluded by annexinV (Fig. 5) staining. While S‐phase arrest is supposed not to occur naturally, we propose a BrdU‐induced transient and reversible S‐phase delay according to the finding in p53 wild‐type MKN‐45 human gastric carcinoma cells (Peng et al. 2001). BrdU incorporation could inhibit DNA replication machinery in BT474 cells, resulting in a deceleration of S‐phase progress. However, as no S‐phase deceleration could be observed within the second or third cell cycles, we interpret the accumulated cells to be a result of a delayed exit from G1‐phase of the first cell cycle. BrdU supplement to the culture medium could cause an unbalanced nucleotide pool, resulting in a disturbed exit from the G1‐phase, even within the first cell cycle when the BrdU incorporation had not yet taken place. An augmented S‐phase fraction caused by stimulation of proliferation can be excluded.
In summary, our study disclosed different effects of BrdU on cell cycle progression in BT474 and SK‐BR‐3 breast cancer and RT4 and J82 bladder cancer cell lines. Inhibitory effects represented by prolongation of the G1‐phase (RT4) or a delayed G1‐phase exit after two cell cycles (BT474, SK‐BR‐3) are cell‐type specific and due to continuous BrdU treatment. The value of the BrdU/Hoe quenching technique to study cell cycle kinetics is unique because it reveals cell cycle regulation under defined conditions in detail. However, the method is limited when applied to the three out of four BrdU‐sensitive epithelial cell lines investigated here. Due to BrdU‐induced delay in the G1‐phases of the second and/or third cell cycles it cannot be used to investigate long‐term proliferation beyond the completion of the first cell cycle. Therefore, we recommend a general evaluation of potential inhibitory or cytostatic effects (even with low BrdU concentration) in a continuous‐treatment setting, prior to use of this technology.
ACKNOWLEDGEMENTS
Marit Hoffmann (Institute of Pathology, University of Regensburg) is gratefully acknowledged for her assistance with the FACStarplus technology. We greatly appreciate the fruitful discussions with Professor Ruth Knuechel (Head of the Institute of Pathology, Aachen, Germany).
REFERENCES
- Brockhoff G, Heiss P, Schlegel J, Hofstaedter F, Knuechel R (2001) Epidermal growth factor Receptor, e‐erbB2 and e‐erbB3 receptor interaction, and related cell cycle kinetics of SK‐BR‐3 and BT474 breast carcinoma cells. Cytometry 44, 338. [DOI] [PubMed] [Google Scholar]
- Cleaver JE (1967) Thymidine metabolism and cell kinetics In: Neuberger A, Tatum EL, eds. Frontiers of Biology, Vol. 6, p. 92 Amsterdam: North‐Holland Publishing Company. [Google Scholar]
- Endl E, Steinbach P, Knuechel R, Hofstaedter F (1997) Analysis of cell cycle‐related Ki‐67 and P120 expression by flow cytometric BrdUrd‐Hoechst/7AAD and immunolabeling technique. Cytometry 29, 1. [PubMed] [Google Scholar]
- Goz B (1977) The effects of incorporation of 5‐halogenated deoxyuridines into the DNA of eukaryotic cells. Pharmacol. Rev. 29, 249. [PubMed] [Google Scholar]
- Kaufmann ER, Davidson RL (1978) Biological and biochemical effects of bromodeoxyuridine and deoxycytidine on syrian hamster melanoma cells. Somat. Cell Genet. 4, 587. [DOI] [PubMed] [Google Scholar]
- Koopman G, Reutelingsperger CP, Kuijten GA, Keehnen RM, Pals ST, Van Oers MH (1994) Annexin V for flow cytometric detection of phosphatidylserine expression on B cells undergoing apoptosis. Blood 84, 1415. [PubMed] [Google Scholar]
- Kubbies M (1999) High‐resolution cell cycle analysis: the flow cytometric bromodeoxyuridine‐Hoechst quenching technique. In: Radbruch A, ed. Flow Cytometry and Cell Sorting, 2nd edn.
- Kubbies M, Schindler D, Hoehn J, Rabinovitch PS (1985) BrdU‐Hoechst flow cytometry reveals regulation of human lymphocyte growth by donor age‐related growth fraction and transition rate. J. Cell Physiol. 125, 229. [DOI] [PubMed] [Google Scholar]
- Kubbies M, Hoehn H, Schindler D, Chen YC, Rabinovich PS (1989) Cell cycle analysis via BrdUrd/Hoechst flow cytometry: principles and applications In: Yen A, ed. Flow Cytometry: Advanced Research and Clinical Application, Vol. II, p. 5 Boca Raton, FL: CRS‐Press. [Google Scholar]
- Latt SA, George YS, Gray JW (1977) Flow cytometric analysis of bromodeoxyuridine‐substituted cells stained with 33258 Hoechst. J. Histochem. Cytochem. 25, 927. [DOI] [PubMed] [Google Scholar]
- Masters JRW, Hepburn PJ, Walker L, Highman WJ, Trefdosiewicz LK, Povey S, Parkar M, Bidget TH, Riddle PR, Franks LM (1986) Tissue culture model of transitional cell carcinoma. Characterization of twenty‐two human urothelial cell lines. Cancer Res. 46, 3630. [PubMed] [Google Scholar]
- O'Toole C, Price ZH, Ohnuki Y, Unsgaard B (1978) Ultrastructure, karyology and immunology of a cell line originated from a human transitional‐cell carcinoma. Br. J. Cancer 38, 64. [DOI] [PMC free article] [PubMed] [Google Scholar]
- Ormerod MG, Kubbies M (1992) Cell cycle analysis of asynchronous cell populations by flow cytometry using bromdeoxyuridine label and Hoechst‐propidium iodide staining. Cytometry 13, 678. [DOI] [PubMed] [Google Scholar]
- Peng DF, Sugihara H, Hattori T (2001) Bromodeoxyuridine induces p53‐dependent and ‐independent cell cycle arrests in human gastric carcinoma cell lines. Pathobiology 69, 77. [DOI] [PubMed] [Google Scholar]
- Poot M, Schindler D, Kubbies M, Hoehn H, Rabinovitch PS (1988) Bromodeoxyuridine amplifies the inhibitory effect of oxygen on cell proliferation. Cytometry 9, 332. [DOI] [PubMed] [Google Scholar]
- Poot M, Hoehn H, Kubbies M, Grossmann A, Chen Y, Rabinovitch PS (1994) Cell‐cycle analysis using continuous bromodeoxyuridine labeling and Hoechst 33358‐ethidium bromide bivariate flow cytometry. Meth. Cell Biol. 41, 327. [DOI] [PubMed] [Google Scholar]
- Rabinovitch PS (1983) Regulation of human fibroblast growth rate by both noncycling cell function transition probability is shown by growth in S‐bromodeoxyuridine followed by Hoechst 33258 flow cytometry. Proc Natl Acad Sci US. 17, 80, 2951. [DOI] [PMC free article] [PubMed] [Google Scholar]
- Rabinovitch PS, Kubbies M, Chen YC, Schindler D, Hoehn H (1988) BrdU‐Hoechst flow cytometry: a unique tool for quantitative cell cycle analysis. Experimental Cell Research 174, 309. [DOI] [PubMed] [Google Scholar]
- Rigby CC, Franks LM (1970) A human tissue culture cell line from a transitional cell tumour of the urinary bladder: growth, chromosone pattern and ultrastructure. Br. J. Cancer 24, 746. [DOI] [PMC free article] [PubMed] [Google Scholar]
- Spiridon CI, Ghetie MA, Uhr J, Marches R, Li JL, Shen GL, Vitetta ES (2002) Targeting multiple Her‐2 epitopes with monoclonal antibodies results in improved antigrowth activity of a human breast cancer cell line in vitro and in vivo . Clin. Cancer Res. 8, 1720. [PubMed] [Google Scholar]