Abstract
Objectives: Mathematical models are useful for studying vascular and avascular tumours, because these allow for more logical experimental design and provide valuable insights into the underlying mechanisms of their growth and development. The processes of avascular tumour growth and the development of capillary networks through tumour‐induced angiogenesis have already been extensively investigated, albeit separately. Despite the clinical significance of vascular tumours, few studies have combined these approaches to develop a single comprehensive growth and development model.
Materials and methods: We develop a continuum‐based mathematical model of vascular tumour growth. In the model, angiogenesis is initiated through the release of angiogenic growth factors (AGFs) by cells in the hypoxic regions of the tumour. The nutrient concentration within the tumour reflects the influence of capillary growth and invasion induced by AGF.
Results and conclusions: Parametric and sensitivity studies were performed to evaluate the influence of different model parameters on tumour growth and to identify the parameters with the most influence, which include the rates of proliferation, apoptosis and necrosis, as well as the diffusion of sprout tips and the size of the region affected by angiogenesis. An optimization was performed for values of the model parameters that resulted in the best agreement with published experimental data. The resulting model solution matched the experimental data with a high degree of correlation (r = 0.85).
Introduction
The number of deaths resulting from cancer every year is second only to cardiovascular disease (1). Mathematical models that describe the process of tumorigenesis can both increase our understanding of tumour development, as well as aid in the development and preliminary testing of treatment options (2). These models can provide insight into the vulnerability of different types of tumours to different anti‐angiogenic drugs, suggesting avenues for the development of new treatment regimes (3, 4, 5). They also provide a quantitative framework to determine tumour prognosis (6). Avascular tumours are readily modelled, because nutrients are only supplied by diffusion from the outside of the tumour (7). However, they are of lesser clinical significance, because in most cases the diffusion‐limited nutrient supply limits their size and also because the tumour cells do not spread through the bloodstream. Vascular tumours are of greater clinical concern because they develop capillary beds through the process of angiogenesis. These grow much larger in size than avascular tumours because of the additional vascular nutrient flux. They are associated with considerably higher mortality rates, and also have a greater potential to metastasize (8, 9, 10). The two principal approaches used for the mathematical modelling of vascular tumours are the cellular automaton (CA) and continuum methods.
CA modeling of tumour growth is based on equations that describe the behaviour of individual cells within a tumour (11). It is particularly useful in determining the behaviour of a particular component of a tumour system. CA models have been developed to describe the behaviour of an individual vascular endothelial cell migrating in angiogenesis (12, 13, 14, 15), and to understand different aspects of avascular and vascular tumour growth (16, 17). However, it is difficult to realistically implement CA models to obtain descriptions of entire tumours because of the large number of cells involved. Thus, they are employed as components of multiscale models or serve as starting points for the implementation of continuum models (18, 19).
Continuum models usually describe the tumour properties, such as capillary density, nutrient concentration, and cell counts as field variables on a volumetric basis. They describe the response of an entire tumour using ordinary and partial differential equations. While these models are less computationally expensive, they require additional assumptions. One common approach is to characterize a volume consisting of a single subpopulation by specifying a threshold nutrient concentration (20, 21, 22, 23). An alternative approach is to treat each subpopulation as a separate species, and solve for the concentration profile of each cell type (22). These models have been used to predict tumour behaviour by separating cells into proliferating, hypoxic and necrotic subpopulations, and also to develop models that examine the stem cell hypothesis (23, 24, 25), such as in brain cancers. The effects of pH and tissue mechanics have also been investigated through such a model (26).
Angiogenesis is the process by which new blood vessels are formed within a tumour (13). Continuum models of angiogenesis can predict the concentration of vascular endothelial cells on the basis of equations governing their diffusion, chemotaxis, and haptotaxis (12), or the concentration of capillaries (27, 28). The interaction between a tumour and angiogenesis for a weakly vascular tumour has been modelled by adjusting the nutrient diffusivity (23), or by incorporating a vascular source term in the equation governing the nutrient concentration. In the latter case, the models are limited through the assumption of a constant a priori angiogenesis source profile (29, 30). We have developed a continuum model of vascular tumour growth that incorporates both the initial avascular tumorigenesis and the later angiogenesis. This model is able to quantitatively describe the experimentally observed behaviour of such a tumour.
Mathematical model
Model overview
Our mathematical model consists of two coupled submodels, one that governs the tumour growth and the other that describes the progression of angiogenesis. The tumorigenesis model assumes spherical symmetry and constant tumour cell sizes as well as quasi‐steady Fickian diffusion of nutrients.
The angiogenesis model includes a continuum treatment of tumour capillaries. Two different field variables quantify the instantaneous angiogenic state of the vascular network in a tumour (28). The sprout tip concentration s tracks the location of actively growing capillary sprout tips and is defined as the number of sprout tips located within a given volume. The capillary length concentration ϕ is similarly defined as the total capillary length per unit volume. Essentially, the capillary length concentration represents the total length of each capillary within a unit volume. Similarly, the sprout tip concentration represents the number of active capillary sprout tips at which capillaries are increasing in length.
The diffusion of angiogenic growth factor (AGF) is assumed to be quasistatic, which is justified through the large difference between the diffusivities of AGF and endothelial cells. We neglect the influence of fibronectin, as it primarily serves to connect growing capillaries, a process which is beyond the current scope of our model.
Tumorigenesis model
The tumorigenesis model is based upon our previous avascular glioma model (23). Its primary variables are the numbers of live N b and dead N d cells in the tumour. The Fickian diffusion of nutrients c out of capillaries (produced by angiogenesis) within the tumour is represented by continuous source terms throughout the region of the tumour where capillaries are present, so that the governing equation for the nutrient concentration is
| (1) |
where S represents the metabolic rate at which nutrients are absorbed by the cells and g(ϕ,c) is the volumetric nutrient transport from the capillaries, which represents the diffusion across a capillary wall because of the difference in the nutrient concentration in the capillary and the tumour. The nutrient concentration in the capillary is assumed to decay linearly from a peak value at the capillary wall to zero over a radial distance δ, which represents the distance that a capillary can pass through the tumour before the concentration of the blood within it reaches equilibrium with the surrounding tissue. This linear decay has the effect of creating an outer region that is influenced by angiogenesis, whereas deeper regions remain unaffected. This results in the relation
| (2a) |
| (2b) |
R cap is the capillary radius, R T the tumour radius, c b the nutrient concentration in the capillaries, D C the nutrient diffusivity, ϕ the capillary length concentration and H represents the unit step function. f(r) represents the decrease in nutrient concentration present in the blood progressing deeper into the tumour. This is treated as a piecewise linear function as shown in Fig. 1.
Figure 1.
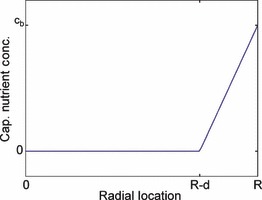
Description of the piecewise linear function. Form of the function f(r), which represents the decrease in the nutrient concentration in the capillary blood as the capillary progresses deeper into the tumour.
The boundary conditions for eqn (1) are constant nutrient concentration c 0 at the tumour exterior and no flux at some location r = α. For a small tumour, α is located at the tumour centre. However, depending on angiogenesis, for larger tumours, the nutrient concentration may decay to zero at a finite distance from the centre, resulting in an innermost necrotic core that lacks sufficient nutrients to survive. The tumour radius (required for the first boundary condition) is calculated from the total cell count
| (3) |
The concentration profile c(r) obtained from (1), (2a), (2b) separates the tumour into three discrete regions at any instant. The proliferative region, where c is greater than a threshold value c p, consists of cells that have sufficient nutrient supply to support active proliferation. The necrotic region consists of cells with c < c n, where c n represents the minimum concentration necessary to avoid cell death. The hypoxic region consists of cells that have sufficient concentration to avoid cell death, but insufficient concentration to support proliferation. Hence, in this region, c p < c < c n. The proliferative volume V p, hypoxic volume V h and the necrotic volume V n can be determined from the concentration profile.
As the total number of individual tumour cells is known, the number of live cells in each of the three tumour subvolumes can be determined by considering the ratio of each compartment volume to the total tumour volume based on the tumour radius, i.e.
| (4a) |
| (4b) |
| (4c) |
The additional term in eqn (4c) arises through the assumption that all the dead cells within the tumour are located within the necrotic region. Thus, the number of dying (necrotic) cells is equal to the total number of cells in V n minus the number of dead cells. Once the number of live cells of each type is known, the rate of change in the number of all live cells within the tumour is determined as follows,
| (5) |
where ω p represents the proliferation rate of cells within the proliferative region, ω a the apoptosis rate of live cells (as cancer cells are inherently at risk of apoptosis regardless of nutrient concentration because of the various anti‐cancer regulatory mechanisms within the cells) and ω n the rate at which living cells in the necrotic region die. Similarly, the rate of change in the number of dead cells within the tumour is
| (6) |
where ω d denotes the rate at which dead cells degrade and are removed. Controlled cell death occurs during apoptosis in a manner that facilitates rapid degradation and removal of the cell.
The nutrient concentration field described by (1), (2a), (2b) is dependent only on the variables N b, N d and ϕ. The first two are determined from (5), (6), and ϕ is calculated using the angiogenesis model.
Angiogenesis model
The angiogenesis model was established by modifying an existing approach (12) to allow the capillary length and sprout tip concentrations to be determined. The sprout tip concentration s in the tumour is influenced by Fickian diffusion and chemotaxis, which is assumed to be linear so that
| (7) |
where D s denotes the diffusivity of endothelial cells (which make up the sprout tip), χ 0 the linear chemotaxic constant and {AGF} the concentration of AGF. A zero gradient boundary condition at the tumour centre is implied by spherical symmetry, while on the outer boundary, a sprout tip concentration, s 0 is applied following the development of a hypoxic region within the tumour. Prior to the development of such a region, this outer concentration is 0, and there is no angiogenesis. This accommodates the role of AGF release by hypoxic cells in triggering sprout formation.
The capillary length concentration increases as sprout tips pass through a volume, leaving capillaries in their wake. Hence, the rate of change in capillary length concentration is based on the flux of sprout tip concentration, i.e.
| (8) |
The quasistatic AGF concentration is calculated based on Fickian diffusion with a governing equation
| (9a) |
| (9b) |
Here, q(c) represents a source term due to the presence of hypoxic cells. AGF is not released by the proliferative cells of the tumour, but by live cells distributed throughout the tumour as a result of a lack of oxygen. The initial conditions for both sprout tip and capillary length concentrations are set to be everywhere zero. A schematic representation of the entire model is shown in Fig. 2.
Figure 2.
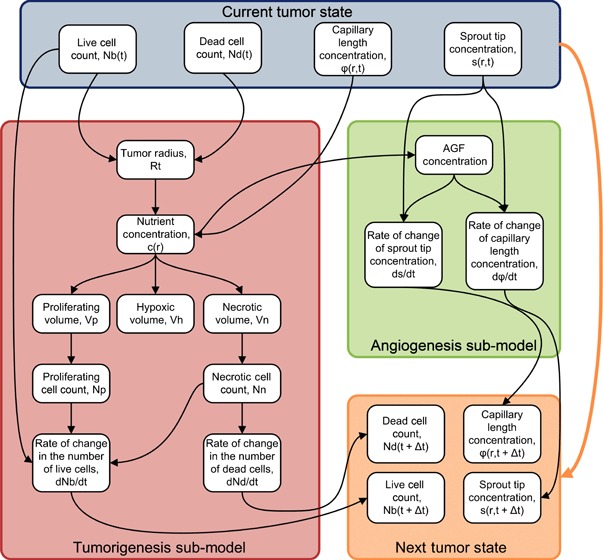
Schematic representing the model. The model consists of two submodels, one representing tumorigenesis and the other representing angiogenesis. The tumorigenesis model depends on the live and dead cell counts, as well as the capillary length concentration, and provides the rate of change in the live and dead cell counts. The angiogenesis model depends on the sprout tip concentration, and provides the rates of change in both sprout tip and capillary length concentrations. The large orange arrow on the left represents the dependence on the initial state of the Runge–Kutta scheme. The previous solutions, along with the derivatives, are used to obtain the new solution.
Numerical methods
A finite difference scheme was used to solve this system of ordinary and partial differential equations. The details of the discretizations are included in the appendix. Discretization of the partial differential equations governing the rate of change of sprout tip and capillary length concentrations, i.e. (7), (8), respectively, allows the system to be represented as a system of ordinary differential equations. Two ordinary differential equations correspond to each node (except the boundary nodes), one for sprout tip concentration and the other for capillary length concentration. The equations were solved on a 400‐node mesh over time using a second‐order explicit Runge–Kutta method for the tumorigenesis model, and a first‐order implicit Runge–Kutta method for the angiogenesis model. Instability is a common problem in the finite difference solution of partial differential equations, and the use of a completely implicit method proved more efficient than other stiff methods, such as the numerical differentiation formula method. The model was solved for a time period of 120 days, using a time step of 0.04 days, which was stable over the entire range of considered parameter values.
Results and discussion
Parametric and sensitivity studies
A parametric study of the model was performed to examine the effects of large‐scale changes in model parameters on the model solution. The parameters were varied by one order of magnitude about their nominal values that were obtained from the tumorigenesis (23) and angiogenesis (12) literature. Large‐scale changes in model parameters lead to relatively straightforward changes in the model solution, but with several important exceptions. For increases in the proliferation rate, as expected, the instantaneous size of the tumour increases, as shown in Fig. 3. Figure 3 also shows that if the proliferation rate is reduced sufficiently below a critical value, the tumour is unable to grow and shrinks to a zero radius. This behaviour is due to the form of eqn (5), which predicts the rate of change in the number of live cells present in the tumour. If the proliferation rate is smaller than the apoptosis rate, the tumour is unable to grow and eventually ceases to exist even if the tumour becomes sufficiently small so as to consist of only proliferating cells. Increasing the degradation rate results in the tumour being unable to grow to sizes requiring a large necrotic core, because any dead cells decay rapidly. On the other hand, decreases in the degradation rate result in increased tumour size, as more dead cells remain in the tumour body. As the degradation rate approaches zero, all dead cells are retained forever, and the tumour grows linearly without restriction. These results are presented in Fig. 4.
Figure 3.
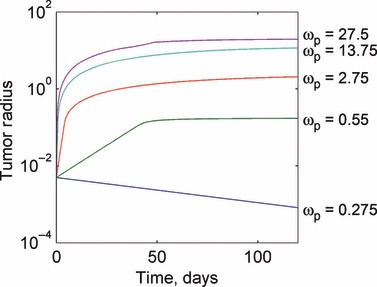
Response of the tumour growth predictions to variations in the proliferation rate ωp. Larger values of the proliferation rate result in larger tumour steady states, with a steady state being reached more rapidly. An extra parameter value of ω p = 1 is added for additional insight. Values for the proliferation rate are given in units of 1/day.
Figure 4.
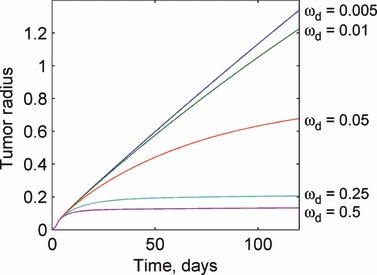
Response of the tumour growth predictions to variations in the degradation rate ωd. For high degradation rates, the tumour rapidly reaches a small steady‐state radius and does not grow further. As the degradation rate becomes negligibly small, the tumour growth becomes approximately linear and keeps increasing without bound. Values for the degradation rate are given in units of 1/day.
Smaller, but still significant changes in the solution occur through changes in the value of the apoptosis rate and the nutrient diffusivity. For a sufficiently large apoptosis rate (that is greater than the proliferation rate), the tumour is unable to grow. This is a major physiological barrier to tumour development. For the opposite limiting case when the apoptosis rate is negligible in comparison with the necrosis rate, the tumour grows rapidly but to a constant size because of cell necrosis and degradation. These results are observed in Fig. 5. Increases in the nutrient diffusivity on the other hand steadily increase the tumour radius without bound. Nutrient diffusivities approaching zero result in very small tumours, as shown in Fig. 6.
Figure 5.
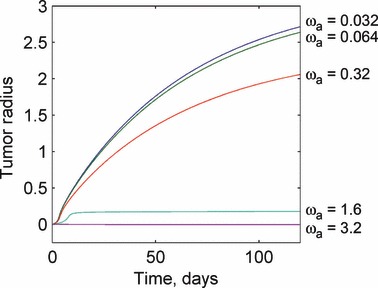
Response of the tumour growth predictions to variations in the apoptosis rate ωa. For small values of the apoptosis rate, the tumour growth is governed by the interaction between the proliferation and degradation rates. Sufficiently large apoptosis rates can prevent tumour growth from being initiated. This demonstrates a physiological mechanism to prevent tumour growth and development. Values for the apoptosis rate are given in units of 1/day.
Figure 6.
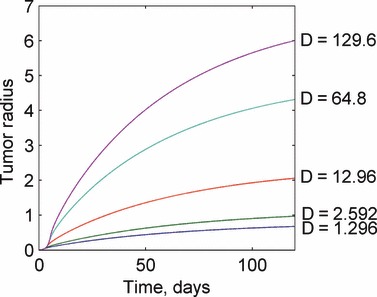
Response of the tumour growth predictions to variations in the nutrient diffusivity D. Changes in the nutrient diffusivity produce similar plots, with increased diffusivity resulting in larger tumours. Values for the nutrient diffusivity are given in units of mm2/day.
We now focus on the interaction of angiogenesis and tumorigenesis in vascular tumours by examining the effects of large changes in the angiogenesis parameters (i.e. in the sprout tip diffusivity and the size of the affected region). As seen in Fig. 7, an increase in the sprout tip diffusivity results in a corresponding increase in the tumour radius at any instant with the effect being relatively uniform over varying D s. A 2‐fold increase in the diffusivity, for instance, results in a 12% increase in the tumour radius at the end of the simulation, while a similar 2‐fold decrease results in an 8% decrease in tumour size.
Figure 7.
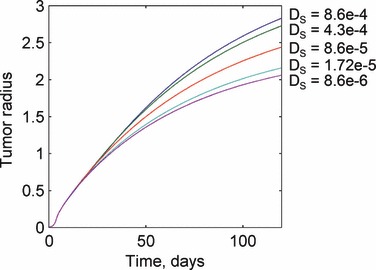
Response of the tumour growth predictions to variations in the sprout tip diffusivity Ds. Sprout tip diffusivity has no affect until the onset of angiogenesis when the solutions for different values of the parameter diverge. Larger diffusivities result in larger tumour sizes. Values for the sprout tip diffusivity are given in units of mm2/day.
Changes in the length of the affected region have a nonlinear influence on tumour size. For small values of δ, the predictions are similar to those for an avascular solution. However, as δ increases, the tumour size increases significantly. Indeed, unphysiological behaviour can be obtained by increasing this parameter by an order of magnitude. This is explained through (2a), (2b). The size of the affected region has no effect on the avascular nutrient concentration, because it only influences the nutrient concentration due to the capillaries feeding the tumour. Hence, a sufficiently small affected region influences the nutrient concentration only in a small outer region of the tumour, which is already well supplied with nutrients through the usual surface diffusion. As a result, the small local increase in nutrient concentration has little effect on tumour growth when δ is small. Thus, the solutions for the two smallest values of δ in Fig. 8 are virtually identical, and relatively close to the growth of an avascular tumour. The consideration of an angiogenesis‐influenced region in our model involves an a priori assumption about the nutrient concentration in the capillaries. A future approach could model the capillaries as flow tubes with nutrients diffusing out along their length in proportion to the external concentration, although this would increase the model complexity.
Figure 8.
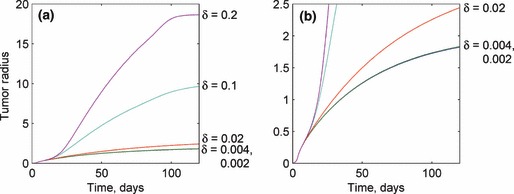
Response of the tumour growth predictions to variations in the various capillary nutrient concentration decay distances δ. Like the sprout tip diffusivity, the length of the affected region has no influence prior to the onset of angiogenesis. After angiogenesis occurs, large values of δ result in very large tumour sizes, while small values have little to negligible influence on tumour growth, as oxygenation of the affected region is diffusion limited. Values for the length of the affected region are given in units of mm.
In addition to the parametric study, a sensitivity study was performed to reveal which of these parameters have the most significant local influence on tumour growth. This was conducted by perturbing each of the seven model parameters considered, which are presented in Table 1, by a small amount (0.1%) and observing the resulting change in the solution. This allowed the estimation of the derivative dR t /dq i, where R T represents the tumour radius and q i represents a given model parameter. By examining the value of this derivative, we can observe the effects of local changes in the model parameter on the solution. The sensitivity of the tumour radius over time is presented in Fig. 9a, and that of the number of live and dead cells in Fig. 9b,c respectively. This analysis revealed that the model is more sensitive to local changes in the tumorigenesis parameters (which are different from the angiogenesis parameters). The most locally sensitive tumorigenesis parameters are the proliferation and degradation rates, while the length of the region influenced by angiogenesis and the sprout tip diffusivity are among the least sensitive parameters. Here, we note that although small‐scale changes in the length of the affected region have little effect, large‐scale changes can have a significant effect, as demonstrated by the parametric study. Based on the results from the parametric and sensitivity studies, the following parameters were varied to calibrate the model against experimental data: proliferation rate, ω p, the apoptosis rate, ω a, the degradation rate, ω d, the sprout tip diffusivity, D s and the length of the region affected by angiogenesis, δ.
Table 1.
Nomenclature and parameter values
| Nomenclature | Symbols | Units |
|---|---|---|
| Nutrient concentration | c | M/mm3 |
| Radial distance from tumour centre | r | mm |
| Radius of tumour | R T | mm |
| Radius of hypoxic shell | R H | mm |
| Radius of necrotic core | R N | mm |
| Time | t | days |
| Parameter | Symbols | Nominal values | Calibrated values | Units |
|---|---|---|---|---|
| Nutrient concentration outside tumour | c 0 | 1 | nmol/mm3 | |
| Nutrient concentration needed for proliferation | c H | 0.75*C0 | nmol/mm3 | |
| Nutrient concentration needed to avoid necrosis | c N | 0.5*C0 | nmol/mm3 | |
| Cell radius | R c | 0.005 | 0.000503 | mm |
| Nutrient diffusivity | D | 12.96 | 11.94 | mm2/day |
| Metabolic rate | S | 1786 | 4553 | nmol/mm3*day |
| Proliferation rate | ω p | 2.75 | 3.13 | 1/day |
| Apoptosis rate | ω a | 0.32 | 0.556 | 1/day |
| Necrosis rate | ω n | 5 | 7.41 | 1/day |
| Degradation rate | ω d | 0.05 | 0.0575 | 1/day |
| Sprout tip diffusivity | D s | 0.00086 | 0.000115 | mm2/day |
| Chemotactic constant | χ 0 | 22 400 000 | 22 400 000 | mm2/nmol*day |
| AGF diffusivity | D c | 2.5 | 2.5 | mm2/day |
| Length of the affected region | d | 0.02 | 0.0675 | mm |
Figure 9.
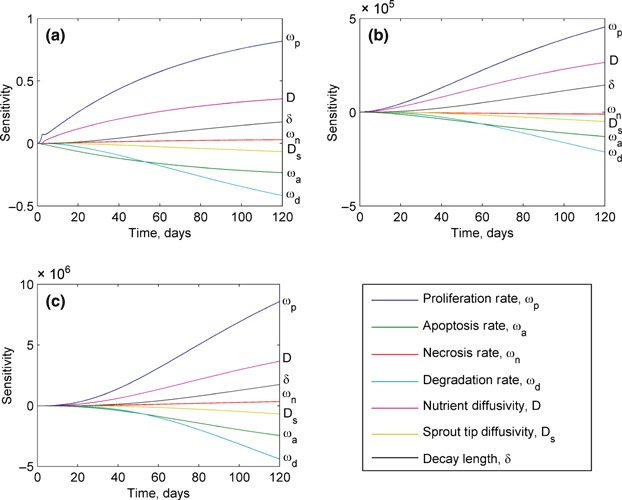
Sensitivity of the model predictions to local changes in the values of model parameters for: (a) tumour radius, (b) live cell count and (c) dead cell count. The tumorigenesis parameters that have the largest influence on these predictions are the proliferation, degradation and apoptosis rates. The predictions are far less sensitive to changes in the angiogenesis parameters, sprout tip diffusivity and the length of angiogenesis‐affected region.
Model calibration
The model was calibrated to fit it to experimental data available in the literature for human pancreatic tumour cell lines BxPC‐3 and MiaPaCa‐2 (31). In that study, real‐time quantitative measurements of the tumour volumes were obtained by imaging the tumours from different angles during their growth. This provided tumour volume data for 18 implanted tumours from about 40 days to about 140 days. We are thus able to compare the tumour radii predicted by our model with the experimentally obtained tumour volumes. Although we determined optimal parameters for human pancreatic tumours, the framework of our model should be valid for many different tumour types because of its fundamentally mechanistic nature.
The model was calibrated using nonlinear least‐squared regression, implemented with the MATLAB ‘lsqnonlin.m’ function. Each model parameter that was varied during the optimization was represented by the nominal value of the parameter multiplied by a coefficient, w:
| (10) |
The coefficients were allowed to vary over the range 1 < w < 10, corresponding to the range considered in the parametric study. The use of these coefficients allowed uniform treatment of the parameters, with the weights serving as the design variables in the optimization. Although the full set of 11 parameters that are presented in Table 2 was used in the optimization, it seems likely that, based on the parametric and sensitivity studies, similar results could be obtained keeping only the most sensitive parameters. The best‐fit solution is shown in Fig. 10 with experimental measurements averaged over multiple sets. There is good agreement between the model predictions and the experiments (r 2 = 0.85). A key feature of the model is its ability to extrapolate early‐stage behaviour that is not measurable through experiments.
Table 2.
Calibration ratios
| Parameter | w i /w i,n |
|---|---|
| Cell radius | 0.1007 |
| Nutrient diffusivity | 0.921 |
| Metabolic rate | 2.55 |
| Proliferation rate | 1.138 |
| Apoptosis rate | 1.738 |
| Necrosis rate | 1.482 |
| Degradation rate | 1.145 |
| Sprout tip diffusivity | 0.134 |
| Chemotactic constant | 1 |
| AGF diffusivity | 1 |
| Length of the affected region | 3.377 |
Figure 10.
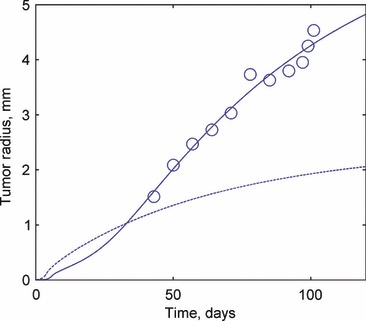
Comparison of experimental measurements from (31) and the ‘best fit’ model prediction resulting from the parametric study. The experimental data are available from ∼40 days but most of the complexity in the predicted behaviour occurs prior to this.
Model results
The calibrated model for human pancreatic tumours was used to predict tumour growth for both vascular and avascular tumours (shown in Fig. 11). Although human pancreatic tumours are highly vascular, this approach allows us to understand the effect that vascularization has on tumour growth, thus providing insight into the underlying mechanisms. The model showed that the early behaviour (prior to the development of a hypoxic region) of both vascular and avascular tumours is identical. Beyond this early stage, avascular tumour growth begins to plateau because of limitations in the nutrient availability, ultimately reaching a steady state when the increase in the number of live cells is precisely matched by the destruction rate of dead cells in the necrotic core.
Figure 11.
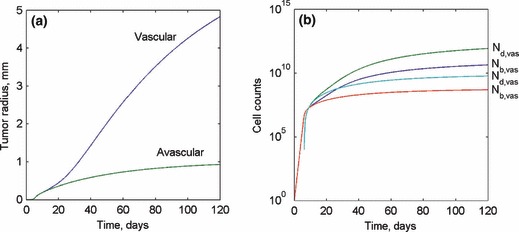
(a) Predicted tumour radius of both vascular and avascular tumours over 120 days. (b) Live and dead cell counts for both vascular and avascular tumours over the first 120 days following the onset of tumorigenesis.
A vascular tumour overcomes the nutrient limitation through transport from the capillaries so that its growth is not arrested, as shown in Fig. 11a,b, which present tumour radius and live and dead cell counts for both the vascular and avascular models. At the end of the simulation period, the radius of the avascular tumour reaches a steady state radius of about 1 mm, while the vascular tumour is still steadily growing because of the increase in ϕ within the vascular tumour. The results for s and ϕ are shown in Fig. 12a,b respectively. The invasion of microvessels into the tumour body is initiated on the tumour surface and intrudes inwards into the tumour mass over time. This intrusion is initiated at approximately the same time as the development of a hypoxic region within the tumour, because the process is triggered through AGF release by hypoxic cells. Ultimately, a uniform steady‐state sprout tip concentration profile is reached throughout the tumour volume. Meanwhile, the capillary length concentration has a maximum value on the outer edge of tumour and decreases linearly within the tumour until it reaches zero at the centre.
Figure 12.
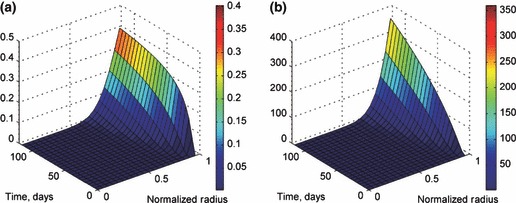
(a) Sprout tip concentration within the vascular tumour. The sprout tip density is zero prior to the development of a hypoxic region at ∼20 days. (b) Capillary length concentration as a function of both normalized radius r/R T and time. This concentration is initially zero throughout the tumour but reaches a steady state and becomes a function of radius.
Conclusions
A mathematical model of highly vascular tumours based on continuum theory is presented. It is able to predict the behaviour of a highly vascular tumour through all stages of development, from a single neoplastic cell to an aggressive rapidly expanding vascular tumour. A sensitivity study showed that the model is most sensitive to local changes in the proliferation and degradation rates, although a parametric study showed that larger changes in the length of the angiogenesis‐affected region can generate large changes in the model solution. Using calibrated parameters for a human pancreatic tumour, the model was shown to accurately predict experimentally measured tumour growth. It also provides insight into the penetration of capillaries, although this was not measured in the experimental data. Although we only compared our predictions with human pancreatic tumour data, because of the mechanistic nature of the model, it should be able to describe other tumour types as well with appropriate choices of model parameters.
Appendix: Discretization scheme for the differential equations
Nutrient concentration
Consider the ordinary differential equation for the nutrient concentration in the body of the tumour (eqn 1). Introducing spherical coordinates and the quasi‐steady state condition ∂c/∂t = 0, at any time this concentration follow the relation,
| (A1) |
Discretizing the outer and inner derivatives, respectively, results in a linear system of algebraic equations
 |
(A2) |
Sprout tip concentration
Discretization of eqn (7) governing the sprout tip concentration leads to a system of ordinary differential equations,
 |
(A3) |
These equations can then be further using a first‐order implicit finite difference scheme as discussed in the numerical methods portion of the paper. This results in a series of algebraic equations, whose solution yields the value of the sprout tip concentration at the next time step:
 |
(A4) |
Capillary length concentration
The discretization of the capillary length concentration relation eqn (8) is similar to that for s. Discretizing the derivatives yields ordinary differential equations at each node, namely,
| (A5) |
Applying an implicit first‐order Runge–Kutta scheme to discretize these differential equations yields algebraic expressions:
 |
(A6) |
References
- 1. Heron M, Hoyert D, Murphy S, Xu J, Kochanek K, Tejada‐Vera B (2009) Deaths: final data for 2006. Natl. Vital. Stat. Rep. 57, 1–134. [PubMed] [Google Scholar]
- 2. Komarova NL (2005) Mathematical modeling of tumorigenesis: mission possible. Curr. Opin. Oncol. 17, 39–43. [DOI] [PubMed] [Google Scholar]
- 3. Jain RK, Tong RT, Munn LL (2007) Effect of vascular normalization by antiangiogenic therapy on interstitial hypertension, peritumor edema, and lymphatic metastasis: insights from a mathematical model. Cancer Res. 67, 2729–2735. [DOI] [PMC free article] [PubMed] [Google Scholar]
- 4. Ribba B, S O, Colin T, Bresch D, Grenier E, Boissel JP (2006) A multiscale mathematical model of avascular tumor growth to investigate the therapeutic benefit of anti‐invasive agents. J. Theor. Biol. 243, 532–541. [DOI] [PubMed] [Google Scholar]
- 5. Stoll BR, Migliorini C, Kadambi A, Munn LL, Jain RK (2003) A mathematical model of the contribution of endothelial progenitor cells to angiogenesis in tumors: implications for antiangiogenic therapy. Blood 102, 2555–2561. [DOI] [PubMed] [Google Scholar]
- 6. Sanga S, Frieboes HB, Zheng X, Gatenby R, Bearer EL, Cristini V. (2007) Predictive oncology: a review of multidisciplinary, multiscale in silico modeling linking phenotype, morphology and growth. Neuroimage 37(Suppl. 1):S120–S134, [doi: 10.1016/j.neuroimage.2007.05.043]. [DOI] [PMC free article] [PubMed] [Google Scholar]
- 7. Roose T, Chapman SJ, Maini PK (2007) Mathematical models of avascular tumor growth. SIAM Rev. 49, 179–208. [Google Scholar]
- 8. Weinberg R (2007) The Biology of Cancer. New York: Garland Science. [Google Scholar]
- 9. Folkman J (2002) Role of angiogenesis in tumor growth and metastasis. Semin. Oncol. 29 (6, Supplement 16), 15–18, [doi: 10.1016/S0093-7754(02)70065-1]. [DOI] [PubMed] [Google Scholar]
- 10. Carmeliet P, Jain RK (2000) Angiogenesis in cancer and other diseases. Nature 407, 249–257, [doi: 10.1038/35025220]. [DOI] [PubMed] [Google Scholar]
- 11. Moreira J, Deutsch A (2002) Cellular automation models of tumor development: a critical review. Adv. Complex Syst. 5, 247–268. [Google Scholar]
- 12. Anderson A, Chaplain M (1998) Continuous and discrete mathematical models of tumor‐induced angiogenesis. Bull. Math. Biol. 60, 857–899, [doi: 10.1006/bulm.1998.0042]. [DOI] [PubMed] [Google Scholar]
- 13. Chaplain MAJ, McDougall SR, Anderson ARA (2006) Mathematical modeling of tumor‐induced angiogenesis. Annu. Rev. Biomed. Eng. 8, 233–257. [DOI] [PubMed] [Google Scholar]
- 14. Levine H, Pamuk S, Sleeman B, Nilsen‐Hamilton M (2001) Mathematical modeling of capillary formation and development in tumor angiogenesis: penetration into the stroma. Bull. Math. Biol. 63, 801–863. [DOI] [PubMed] [Google Scholar]
- 15. Bauer AL, Jackson TL, Jiang Y (2007) A cell‐based model exhibiting branching and anastomosis during tumor‐induced angiogenesis. Biophys. J. 92, 3105–3121. [DOI] [PMC free article] [PubMed] [Google Scholar]
- 16. Dresden G (2002) Modeling of self‐organized avascular tumor growth with a hybrid cellular automaton. In Silico Biol. 2, 393–406. [PubMed] [Google Scholar]
- 17. Patel AA, Gawlinski ET, Lemieux SK, Gatenby RA (2001) A cellular automaton model of early tumor growth and invasion: the effects of native tissue vascularity and increased anaerobic tumor metabolism. J. Theor. Biol. 213, 315–331. [DOI] [PubMed] [Google Scholar]
- 18. Bellomo N, De Angelis E, Preziosi L (2003) Review article: multiscale modeling and mathematical problems related to tumor evolution and medical therapy. Comput. Math. Methods Med. 5, 111–136. [Google Scholar]
- 19. Alarcon T, Byrne HM, Maini PK (2005) A multiple scale model for tumor growth. Multiscale Model. Simul. 3, 440–475. [Google Scholar]
- 20. Burton A (1966) Rate of growth of solid tumours as a problem of diffusion. Growth 30, 157–176. [PubMed] [Google Scholar]
- 21. Jiang Y, Pjesivac‐Grbovic J, Cantrell C, Freyer JP (2005) A multiscale model for avascular tumor growth. Biophysical J. 89, 3884–3894. [DOI] [PMC free article] [PubMed] [Google Scholar]
- 22. Sherratt JA, Chaplain MAJ (2001) A new mathematical model for avascular tumour growth. J. Math. Biol. 43, 291–312. [DOI] [PubMed] [Google Scholar]
- 23. Tanaka ML, Debinski W, Puri IK (2009) Hybrid mathematical model of glioma progression. Cell Prolif. 42, 637–646. [DOI] [PMC free article] [PubMed] [Google Scholar]
- 24. Ganguly R, Puri IK (2006) Mathematical model for the cancer stem cell hypothesis. Cell Prolif. 39, 3–14. [DOI] [PMC free article] [PubMed] [Google Scholar]
- 25. Ganguly R, Puri IK (2007) Mathematical model for chemotherapeutic drug efficacy in arresting tumour growth based on the cancer stem cell hypothesis. Cell Prolif. 40, 338–354. [DOI] [PMC free article] [PubMed] [Google Scholar]
- 26. Helmlinger G, Netti PA, Lichtenbeld HC, Melder RJ, Jain RK (1997) Solid stress inhibits the growth of multicellular tumor spheroids. Nat. Biotechnol. 15, 778–783, [doi: 10.1038/nbt0897-778]. [DOI] [PubMed] [Google Scholar]
- 27. Byrne H, Chaplain M (1995) Mathematical models for tumour angiogenesis: numerical simulations and nonlinear wave solutions. Bull. Math. Biol. 57, 461–486, [doi: 10.1007/BF02460635]. [DOI] [PubMed] [Google Scholar]
- 28. Mantzaris NV, Webb S, Othmer HG (2004) Mathematical modeling of tumor‐induced angiogenesis. J. Math. Biol. 49, 111–187, [doi: 10.1007/s00285-003-0262-2]. [DOI] [PubMed] [Google Scholar]
- 29. Jackson TL (2002) Vascular tumor growth and treatment: consequences of polyclonality, competition and dynamic vascular support. J. Math. Biol. 44, 201–226. [DOI] [PubMed] [Google Scholar]
- 30. Orme ME, Chaplain MAJ (1996) A mathematical model of vascular tumour growth and invasion. Math. Comput. Model. 23, 43–60, [doi: 10.1016/0895-7177(96)00053-2]. [DOI] [Google Scholar]
- 31. Bouvet M, Wang J, Nardin SR, Nassirpour R, Yang M, Baranov E et al. (2002) Real‐time optical imaging of primary tumor growth and multiple metastatic events in a pancreatic cancer orthotopic model. Cancer Res. 62, 1534–1540. [PubMed] [Google Scholar]


