Abstract
Abstract. Objective: The susceptibility of two cell lines, WEHI‐3B myelomonocytic leukaemia and its variant Ciprofloxacin‐resistant WEHI‐3B/CPX to undergo apoptosis induced by Ciprofloxacin was studied and compared. Materials and methods: Apoptosis was checked by measuring the DNA fragmentation and determining the ratio of apoptotic/necrotic cells. The relationship between the induction of apoptosis and G1, S or G2 block in the cell cycle has also been investigated and cytogenetical evaluation of chromosomal aberrations in both cell lines has been carried out. The regulation of expression of Bax and Bcl‐2 was also checked by western blotting after Ciprofloxacin treatment. Results: We observed that the resistance of the subline was caused by a small percentage of cells that underwent apoptosis during continuous exposure to Ciprofloxacin in comparison with the parental cell line, whereas the percentage of necrotic cells remained unchanged. The WEHI‐3B cells showed a G2 block and a higher degree of cytogenetic damage after drug exposure. The two cell lines expressed the same level of Bax and Bcl‐2 following stimulation by Ciprofloxacin. Only in the resistant subclone, the ratio Bcl‐2/Bax reversed in the anti‐apoptotic gene expression. Conclusion: The resistance to ciprofloxacin observed is not related to mitochondrial function and although Bcl‐2/Bax ratio behaviour does not fully explain the resistance of the WEHI3B/CPX subclone it is consistent with phenotypic character of resistance to CPX. The toxic effect on sensitive cells could be mediated by the cell cycle arrest whereas in the resistant clone, the prolonged G2 phase could play a key role to favour cell cycle progression and proliferation.
INTRODUCTION
The WEHI‐3B/CPX cell line is a genetically stable Ciprofloxacin (CPX)‐resistant variant of murine myelomonocytic leukaemia cells WEHI‐3B. IC50 of CPX measured by 3‐(4,5‐dimethylthiazol‐2‐yl)‐2,5‐diphenyltetrazolium bromide (MTT) for the resistant variant is 17.3 times higher than that for the parental line and this phenotype is not cross‐resistant to other quinolones, novobiocin and antineoplastic drugs that act on topoisomerase II (Pessina et al. 1993). In this context, studies on the capacity of Ciprofloxacin to enhance topoisomerase I‐ and II‐dependent DNA cleavage activity has been investigated finding that the topo‐II enzyme from the variant is resistant to the CPX enhancement effect (Pessina et al. 2001). As has previously reported, 4‐quinolones may interfere with cell population growth by causing selective loss of mitochondrial DNA in drug treated cells (Lawrence et al. 1993) and that CPX may cause cytotoxicity by interfering with mitochondrial topoisomerase II‐like activity resulting in loss of mitochondrial DNA (Lawrence et al. 1996). Our study has verified mitochondrial activity in WEHI‐3B cells and in the CPX resistant subclone cells to exclude that resistance could be related to selection of WEHI‐3B cells that have some form of mitochondria‐mediated resistance. Furthermore, susceptibility of cells of the two lines to undergo apoptosis, induced by treatment with CPX, have been studied by evaluating chromosomal aberrations, G1 or G2 arrest and possible roles of p‐53, Bax and Bcl‐2 expression.
MATERIALS AND METHODS
Drugs
A starting solution of Ciprofloxacin (Bayer, Leverkusen, Germany) was prepared at 10 000 µg/mL in bidistilled‐autoclaved water. Working solutions were made up directly with culture medium to final concentrations for use in the experiments.
Cell lines and culture conditions
WEHI‐3B and WEHI‐3B/CPX cells (established in the Cell Culture Laboratory of the Department of Public Health, Microbiology, Virology, University of Milan, Milan, Italy), were maintained in suspension by weekly passages 1 : 20 in McCoy's 5A medium (Life‐Technologies, Paisley, UK) supplemented with 10% foetal calf serum (FCS) (Life‐Technologies) and 1% penicillin‐streptomycin (Sigma Chemical Co., St. Louis, MO, USA). Cells for the experiments were incubated at 37 °C in a humidified atmosphere with 5% CO2 and were maintained with exponential growth by centrifugating and diluting the cells every second day to a concentration of 3 × 10⁵ cells/mL with fresh, pre‐warmed medium.
To determine whether mitochondria might be a cytotoxic target for CPX, we used the method suggested by Lawrence et al. (1993), in which cells were grown under normal and respiration independent conditions. Briefly, cells were grown in RPMI 1640 (Euroclone, Milan, Italy) containing glucose but in the absence of pyruvate and pyrimidines (in these conditions mitochondrial activity is required for survival). To enable cells to grow in the absence of mitochondrial function RPMI–PUT was used (RPMI supplemented with 1 mm sodium pyruvate, 10 µg/mL uridine and 10 µg/mL thymidine).
Drug treatment
Treatment was carried out maintaining cell cultures in serial 2‐fold dilutions of CPX (from 500 to 7.8 µg/mL) for 24, 48 and 72 h. At each time point, cells were monitored for viability (MTT assay), apoptosis (Annexin V binding assay) and cell cycle phases (flow cytometry using propidium iodide). Maintaining normal culture conditions, PDT (population doubling time) of the two cell lines, both untreated and with CPX treatment (125 µg/mL), was calculated after 40 h of culture, according to methods previously described (McAteer & Davis 1994).
Cell cycle analysis
Cell cycle analysis was performed on cells stained with propidium iodide. Aliquots of 1 ml of cell suspensions were centrifuged at 400 g for 5 min and were fixed in 70% ethanol at 4 °C for at least 30 min. About 5 × 10⁵ fixed cells were resuspended in 1 mL phosphate‐buffered saline (PBS), were stained with 40 µL propidium iodide (1 mg/mL in PBS) and 100 µL RNase was added (1 mg/mL in PBS). Samples were incubated for 30 min in the dark at 37 °C and then were analysed on an Epics flow cytometer (Coulter, Miami, FL, USA). Cell cycle analysis was defined with the use of MultiCycle AV software (Phoenix Flow Systems Inc., San Diego, CA, USA).
Detection of apoptosis
Apoptotic cells were noted under the different experimental conditions by using two different assays. To determine DNA fragmentation the method used was that of Herrmann et al. (1994). Briefly after harvesting, cell samples were washed with PBS and were pelleted by centrifugation (1600 g for 5 min). Cell pellets were then treated for 10 s with apoptotic buffer (1% NP‐40 in 20 mm Na‐EDTA, 50 mm Tris‐HCl, pH 8.0). After centrifugation for 5 min at 1600 g, the supernatant was collected and extraction was repeated with the same amount of apoptotic buffer. Supernatants were brought to 1% sodium dodecyl sulfate and were treated for 1 h 30 min with Rnase‐A (final concentration 2 µg/mL) at 56 °C, followed by digestion with proteinase K (final concentration 2.5 µg/mL) for 1 h 30 min at 37 °C. After addition of 1/2 volume 10 m ammonium acetate, DNA was precipitated with 2.5 volume absolute ethanol at –20 °C for at least 2 h. After centrifugation for 10 min at 14 000 g, the pellet was suspended in 70% ethanol then, after further centrifugation for 10 min at 14 000 g, it was dissolved in sterile TE and was separated by electrophoresis in 1% agarose gel.
Apoptotic cells, labelled with the Annexin V‐FITC apoptosis detection kit (Sigma), were performed as follows. Briefly, ~5 × 10⁵ cells were washed twice with PBS and were resuspended in binding buffer (10 mm HEPES/NaOH, pH 7.4, 140 mm NaCl, 2.5 mm CaCl2). Annexin V‐FITC and propidium iodide were added to a final concentration of 1 µg/mL each. The mixture was incubated for 10 min in the dark, at room temperature, was washed with PBS and was resuspended in binding buffer. Samples were then analysed by flow cytometry; viable cells are FITC−/PI−, apoptotic cells FITC+/PI− and necrotic cells FITC+/PI+.
Detection of chromosomal aberration
Two hours prior to harvesting, Colcemid (0.1 mg/mL; Invitrogen, Carlsbad, CA, USA) was added to the cell cultures. Cell samples were counted using a Coulter counter (Beckman Coulter Inc.) to determine cell number as an indicator of cytotoxicity. That these counts represented viable cells was verified by checking samples for trypan blue dye exclusion. Cells were treated with hypotonic KCl (75 mm; Sigma Chemical Company) for 1–3 min at room temperature, were washed twice with fixative (methanol : glacial acetic acid, 3 : 1, v/v), were dropped on slides, air‐dried and were stained with Gurr Giemsa stain (BDH Chemicals LTD, Poole, England, UK). One hundred cells per point were scored for chromosomal aberrations, single and double strand breaks as well as dicentric chromosomes were scored.
Subcellular fractionation
Basal enzymatic activity for mitochondria in WEHI‐3B and WEHI‐3B/CPX cells was also tested by measuring MTT reduction in the mitochondrial fractions of cells. To obtain subcellular fractions for MTT reduction tests, we used a modification of the original method of Berridge & Tan (1993). Briefly, 2 × 10⁷ cells were washed twice in extraction buffer (0.25 m sucrose, 25 mm HEPES, 1 mm EDTA pH 7.4), and were homogenized in 1 mL buffer using 80 strokes of a Dounce homogenizer with a Teflon pestle. The suspension diluted with 5 mL of extraction buffer was layered over 5 mL of 0.34 m sucrose and then was centrifuged at 500 g for 10 min. Supernatant was collected and centrifuged at 5600 g for 10 min, and the pellet (washed twice at 14 000 g for 10 min) was used for the MTT assay.
MTT test
Mitochondrial protein in the subcellular fraction was measured using the Bradford assay (1976) and its activity was tested as described above, using the MTT assay performed according to a modification of the technique of Berridge & Tan (1993). Two potential electron donors involved in cellular MTT reduction were been used, succinate and NADH. Briefly, in microtitre plates, 50 µL of cell fraction was added to 100 µL of extraction buffer containing 20 mm succinate (Sigma) or 1 mm NADH (Sigma). These were incubated for 1 h at 37 °C in the presence of 15 µL of MTT (5 mg/mL). At the end of incubation, 100 µL of lysing buffer was added and after a further 3 h the absorbance at 550 nm was red in a LP 200 Diagnostic Pasteur reaction. Reduction of MTT by whole living cells was determined according to the original technique suggested by Mosmann (1983) by incubating 2 × 10⁴ cells in 100 µL of culture medium in the presence of 15 µL of MTT for 3 h, then followed by the procedure above.
Western blotting
After CPX treatment, cells were checked for viability and protein extracts for Western blotting analysis were prepared as follows. After centrifugation at 1000 g for 10 min, cells were suspended in PBS and then were pelleted at 1000 g for 10 min. Pellets were resuspended in lysis buffer (150 mm NaCl, 0.5 mm EDTA, 0.5 mm MgCl2, 10 mm Tris, 1% Triton X‐100, 1 mm PMSF, 1 mm DTT, 10 µg/mL aprotinin, 10 µg/mL leupeptin, 1 µg/mL pepstatin, 10 µg/mL trypsin inhibitor), were vortexed, incubated on ice for 30 min and, after centrifugation at 14 000 g for 15 min, supernatants containing total cell proteins were collected and stored at –80 °C. Protein concentration of lysates was determined by the Bradford assay (1976). Protein extracts were denaturated at 95 °C for 5 min and then were subjected to electrophoresis in 12.5% sodium dodecyl sulfate polyacrylamide gel according to the Laemli method (1970). Proteins on the gel were transferred using the semidry blotter system (Milliblot‐Graphite Electroblotter System, Millipore, Bedford, MA, USA) to polyvinylidene difluoride membrane (Immobilon‐P, Millipore), essentially described by Towbin et al. (1979). After saturation in 5% non‐fat milk (AppliChem, Ottoweg, Darmstadt, DE, USA) in TBST (Tris buffer solution +0.05% Tween‐20) for 1 h at room temperature, the membrane was incubated overnight at 4 °C with the primary antibody diluted 1 : 500 in 5% milk in TBST 0.05%. After three further washings with TBST 0.05%, the blot was incubated for 45 min at room temperature with secondary antibody diluted 1 : 10 000 in 5% milk in TBST 0.05%. After three more washes in TBST 0.05% and two in TBS, the membrane was developed using an enhanced chemiluminescence technique (SuperSignal West Pico Chemiluminescent Substrate, Pierce Biotechnology, IL, USA) using Hyperfilm ECL (Amersham, Buckinghamshire, UK).
The following primary antibodies were used: rabbit IgG polyclonal anti‐mouse Bax (Santa Cruz Biotechnology, Santa Cruz, CA, USA) (200 µg/mL), and rabbit IgG polyclonal anti‐human Bcl‐2 (Santa Cruz Biotechnology) (200 µg/mL). As a secondary antibody, we used goat antirabbit IgG HRP‐conjugated antibody (Santa Cruz Biotechnology) (400 µg/mL).
RESULTS
Cell population growth
As shown in Fig. 1, the percentage of viability determined by the MTT assay on WEHI‐3B cells exposed to increasing doses of drug was dramatically reduced after 24 h of treatment, 80% reduction at 125 µg/mL. Viability of WEHI‐3B/CPX cells on the contrary was not affected and maintained 100% proliferative activity even when treated with 500 µg/mL of CPX (see also graph in Fig. 3). As reported in the Fig. 2 histogram, WEHI‐3B cell population growth had PDT of 14.13 ± 1.17 h, which does not differ from that determined for the resistant subclone (PDT = 13.64 ± 1.04 h). By treating the cell lines with 125 µg/mL of CPX, PDT of the parental strain was dramatically increased to 47.16 ± 4.1 h, whereas PDT of resistant cells did not change (14.11 ± 1.06 h).
Figure 1.
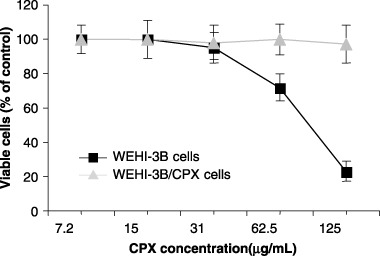
Effect of increasing concentrations of ciprofloxacin on the viability of WEHI‐3B and WEHI‐3B/CPX cells. Viability is expressed as percentage of control (cells cultured in the absence of ciprofloxacin). Each point represents the mean ± standard deviation of three experiments.
Figure 3.
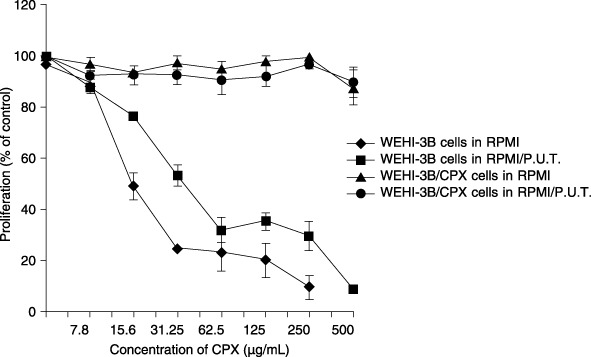
Effect of increasing concentrations of ciprofloxacin on the proliferation of WEHI‐3B and WEHI‐3B/CPX cells cultured in RPMI and RPMI/P.U.T. media (RPMI supplemented with 1 mM sodium pyruvate, 10 µg/mL uridine and 10 µg/mL thymidine). Proliferation is expressed as percentage of control. Each point represents the mean value ± standard deviation of three experiments.
Figure 2.
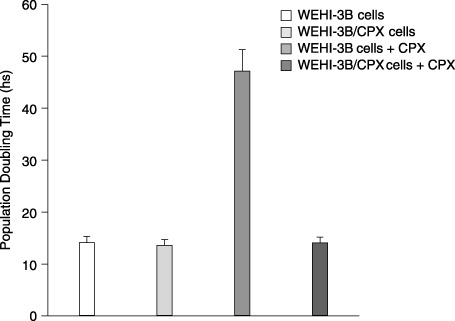
Effect of ciprofloxacin treatment (125 µg/mL) on population doubling time (PDT) of WEHI‐3B and WEHI‐3B/CPX cells. Each histogram expresses the mean ± standard deviation of three experiments.
Mitochondrial function
To confirm that cytotoxicity observed in MTT tests was not related to some effect of CPX on respiratory function of mitochondria, both the WEHI‐3B and WEHI‐3B/CPX cells were demonstrated to grow well in RPMI and in RPMI‐PUT medium (data not shown); CPX treatment produced identical kinetics of inhibition with both the media used (Fig. 3). This suggests that CPX is cytotoxic both in conditions in which respiratory function is required or not required. MTT reduction kinetics (proportional to the amount of mitochondrial protein) was found to be the same in WEHI‐3B and WEHI‐3B/CPX cells (Fig. 4). The Fig. 5 histogram reports that CPX did not affect electron transport and mitochondrial MTT reduction in the presence of NADH or of succinate, in mitochondrial preparations both from WEHI‐3B and from WEHI‐3B/CPX cells.
Figure 4.
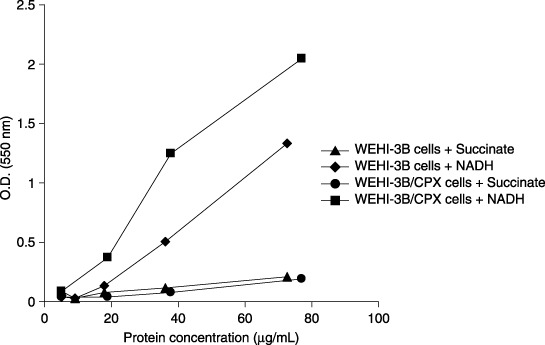
Kinetics of MTT reduction by subcellular fraction from WEHI‐3B and WEHI‐3B/CPX cells. The levels of MTT reduction are measured as optical density (O.D.) at 550 nm in function of the amount of subcellular fraction expressed as µg/mL of proteins. Each point represents the mean value of two experiments.
Figure 5.
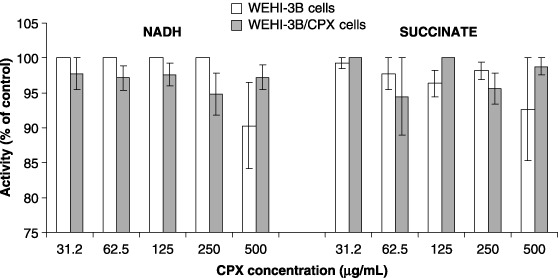
Effect of ciprofloxacin on MTT reduction activity of subcellular fraction from WEHI‐3B and WEHI‐3B/CPX cells. Each histogram represents the mean value ± standard deviation of three experiments.
Apoptosis
In the two cell lines treated with increasing concentrations of Ciprofloxacin, a significant increase in percentage of apoptotic cells was observed, starting from 62.5 µg/mL of CPX. At 125 µg/mL treatment also, a significant percentage of necrotic cells is observed in WEHI‐3B preparation, but no increase of apoptosis or necrosis was observed in Ciprofloxacin‐resistant cells (Fig. 6). Percentages of apoptotic and necrotic cells were measured by flow cytometry using an Annexin V‐FITC detection kit. One of the earliest indications of apoptosis is translocation of the membrane phospholipid phosphatidylserine (PS) from the inner to the outer leaflet of the plasma membrane. The translocation of PS precedes other apoptotic processes such as loss of plasma membrane integrity, DNA fragmentation and chromatin condensation. Cells negative for both Annexin V and the vital dye have no indication of apoptosis; PS translocation has not occurred and the plasma membrane is still intact. Cells Annexin V‐positive and vital dye‐negative, however, are in early apoptosis as PS translocation has occurred, yet the plasma membrane is still intact. Cells positive for both Annexin V and the vital dye are either in late stages of apoptosis or are already dead, as PS translocation has occurred and loss of plasma membrane integrity is observed. Presence of apoptosis is confirmed in Fig. 7 where it is evident that treatment of cells with 125 µg/mL of Ciprofloxacin for 24 h produced in characteristic laddering of DNA fragments in WEHI‐3B cells, which was absent in WEHI‐3B/CPX cells.
Figure 6.
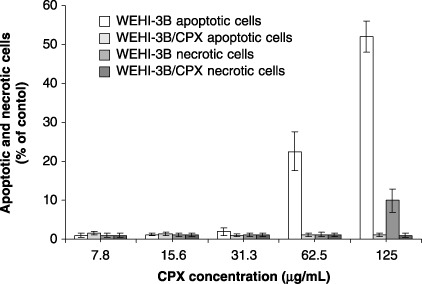
Percentage of WEHI‐3B and WEHI‐3B/CPX cells in apoptosis and necrosis following the treatment with increasing concentrations of ciprofloxacin. Each column of the histogram represents the mean value ± standard deviation of three experiments.
Figure 7.
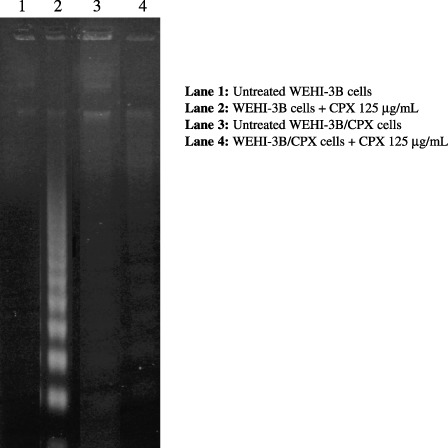
Induction of apoptosis by ciprofloxacin treatment in WEHI‐3B and WEHI‐3B/CPX cells.
Cell cycle analysis and Bax/Bcl‐2 expression
In the resistant cells, continuous treatment with CPX did not affect duration of G1 and S phases, whereas in the parental WEHI‐3B cells, at a concentration of 125 µg/mL, CPX was observed to block cell progression in G2 phase(Fig. 8). Cytogenetical analysis revealed a higher number of chromosomal aberrations (B′) in the parental cell line, with respect to resistant cells, after exposure to 31.25 µg/mL and 62.5 µg/mL (Table 1).
Figure 8.
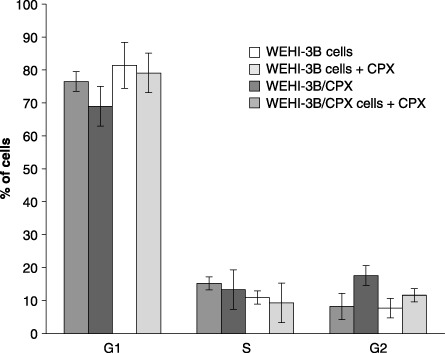
Percentage of WEHI‐3B and WEHI‐3B/CPX cells in G1, S and G2 phases after 72 hours treatment with ciprofloxacin (125 µg/mL). Each histogram represents the mean value ± standard deviation of three experiments.
Table 1.
Chromosomal aberrations observed in WEHI‐3B and WEHI‐3B/CPX cells after CPX treatment
| Cell line | CPX dose (µg/mL) | Aberrations a | Total | |||
|---|---|---|---|---|---|---|
| Gaps | B′ | B″ | Dic. | |||
| WEHI‐3B | 0 (Ctrl) | 0 | 0 | 0 | 0 | 00 + 00 |
| 32.25 | 0 | 13 | 0 | 0 | 13 + 00 | |
| 62.5 | 0 | 23 | 2 | 0 | 25 + 00 | |
| WEHI‐3B/CPX | 0 (Ctrl) | 0 | 2 | 0 | 0 | 02 + 00 |
| 31.25 | 0 | 5 | 0 | 0 | 05 + 00 | |
| 62.5 | 0 | 8 | 0 | 0 | 08 + 00 | |
Counts on 100 cellular metaphases. B′, single‐strand break; B″, double‐strand break; Dic., dicentric chromosomes.
Analysis by Western blotting of Bax and Bcl‐2 proteins, expression indicated that whereas basal expression of Bax was similar in the two cell lines, Bcl‐2 was overexpressed in the resistant subclone. Treatment of the two cell lines for 24 h with 125 µg/mL of Ciprofloxacin produced up‐regulation of Bcl‐2 in WEHI‐3B cells, with no increase in Bax whereas a down‐regulation of Bax with no modulation of Bcl‐2 was observed in the resistant cells WEHI‐3B/CPX (Fig. 9).
Figure 9.
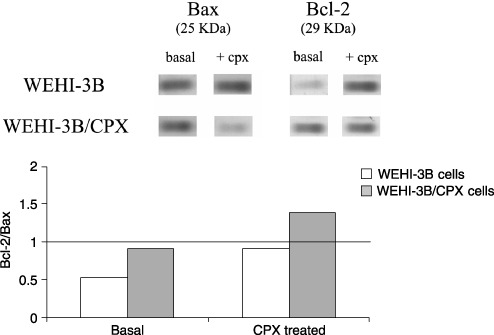
Modulation of Bax and Bcl‐2 expression after 24 hours treatment of WEHI‐3B and WEHI‐3B/CPX cells with 125 µg/mL of ciprofloxacin.
DISCUSSION
The WEHI‐3B/CPX cell line is a genetically stable variant of WEHI‐3B myelomonocytic leukaemia that expresses high resistance to Ciprofloxacin. It has previously been demonstrated that this mechanism of resistance is specific to Ciprofloxacin and is not mediated by multidrug resistance (Pessina et al. 1993). Both viability and proliferation of the WEHI‐3B/CPX resistant cells are not affected by the treatment (1, 3). Ciprofloxacin at 125 µg/mL is able to affect the parental cell strain producing a dramatic increase of PDT (from 14.1 to 46 h) that correlates well to its low proliferative activity and/or decreased cell viability. At this CPX concentration (125 µg/mL), the cell cycle of the surviving population may be affected to a minor degree, observed at higher concentration (500 µg/mL) but enough to produce a significant delay in cell replication. At 500 µg/mL, this effect is probably exerted on all the cell population as cell cycle arrest. None of these effects is seen in the resistant clone as documented by the observation that Ciprofloxacin treatment does not modify the PDT value.
In common with many workers, we have measured the effect of drugs on cell proliferation by measuring cell viability at 7 days in culture. We used the MTT assay that is based on evaluation of enzymatic activity of mitochondria. Thus, because quinolones have been indicated to be possible inhibitors of respiration in mitochondria, we verified that the MTT assay was not affected by direct interference of Ciprofloxacin in the culture medium. Our results (Fig. 3) confirmed that Ciprofloxacin is cytotoxic, even in conditions in which respiratory functions are not required, and furthermore that electron transport and mitochondrial MTT reduction (measured both by NADH and by succinate) are not affected in the two cell lines. This shows that the resistance to Ciprofloxacin observed is not related to mitochondrial function and that the MTT endpoint is not modulated by the presence of Ciprofloxacin. Recent evidence (Thomson 2002) has suggested that mitochondria PK may be involved in physiological processes of apoptosis and that its activation can induce apoptosis in lymphoma cells (Matuszyk et al. 2002). According to other authors, PKAI is related to multidrug resistance and is implicated in a Bax/Bcl‐2‐dependent apoptotic way (Tortora & Ciardiello 2002). Bax is a pro‐apoptotic member of the Bcl‐2 family. It is able to inhibit tumour progression by promoting chemotherapeutically induced apoptosis by a mechanism of pore‐forming activity in the outer mitochondrial membrane; this enables release of cytochrome c into the cytosol (Schlesinger et al. 1997; Schendel et al. 1998). Although Bax has been reported to be transcriptionally regulated by p53 (Strobel et al. 1996), according to data reported by Heiligtag et al. (2002), mitochondria can also play a role in Bax overexpression, correlated with the extent of apoptosis regulated in a p53‐independent manner. Our data clearly show that WEHI‐3B/CPX cells are also resistant to undergoing apoptosis after treatment with Ciprofloxacin, and that this does not correlate with mutation of either p53 or Bax expression, whereas it does seem to be correlated to expression of Bcl‐2. In the parental, sensitive cells (Fig. 9), Ciprofloxacin treatment produces significant up‐regulation of Bcl‐2 that, however, is ineffective to contrast the action of the apoptotic mechanism. This suggests that these cells are able to up‐regulate Bcl‐2 to oppose apoptosis but (as expected), although in the continuous presence of high drug concentrations, the mechanism fails to protect the cells. In WEHI‐3B/CPXRES cells (resistant to Ciprofloxacin), treatment with CPX does not modulate the expression of Bcl‐2 but results in down‐modulation of Bax indicating a reason for the resistance of these cells to CPX‐induced apoptosis, as the Bcl‐2/Bax ratio is increased 2‐fold. If these results are considered in terms of quantitative Bcl‐2/Bax ratios (Fig. 9), in WEHI‐3B cells the basal ratio was increased by Ciprofloxacin treatment from 0.5 to 0.8 but remained < 1. On the contrary, in Ciprofloxacin‐resistant cells the ratio changed from 0.7 to 1.4 doubling the value by also inverting the ratio in favour of anti‐apoptotic Bcl‐2.
This did not indicate that the Bcl‐2/Bax ratio fully explained resistance of the WEHI‐3B/CPX subclone but that probably this mechanism is consistent with this phenotypical characteristic of resistance to CPX. We did not observe DNA damage‐inducible G1 arrest either in the parental cells, or in the resistant ones, whereas a G2/M block was present only in the sensitive cells. We postulate that the G2 delay may be critical in preventing irreversible fixation of DNA damage as suggested by the correlation between prolonged G2 delay and increased radio resistance in many types of cells (Terzoudi et al. 2005). Antiproliferative effects of CPX on sensitive cells could be mediated by cell cycle arrest and in the resistant clone, the prolonged G2 phase could play a key role to favour cell cycle progression and proliferation.
REFERENCES
- Berridge MV, Tan AS (1993) Characterization of the cellular reduction of 3‐(4,5‐dimethylthiazol‐2‐yl)‐2,5‐diphenyltetrazolium bromide (MTT): subcellular localization, substrate dependence, and involvement of mitochondrial electron transport in MTT reduction. Arch. Biochem. Biophys. 303, 474–482. [DOI] [PubMed] [Google Scholar]
- Bradford MM (1976) A rapid and sensitive method for the quantitation of microgram quantities of protein utilizing the principle of protein‐dye binding. Anal. Biochem. 72, 248–254. [DOI] [PubMed] [Google Scholar]
- Heiligtag SJ, Bredehorst R, David KA (2002) Key role of mitochondria in cerulenin‐mediated apoptosis. Cell Death Differ. 9, 1017–1025. [DOI] [PubMed] [Google Scholar]
- Herrmann M, Lorenz HM, Voll R, Grûnke M, Woith W, Kalden JR (1994) A rapid and simple method for the isolation of apoptotic DNA fragments. Nucleic. Acids. Res. 22, 5506–5507. [DOI] [PMC free article] [PubMed] [Google Scholar]
- Laemli UK (1970) Cleavage of structural proteins during the assembly of the head of bacteriophage T4. Nature 227, 680–685. [DOI] [PubMed] [Google Scholar]
- Lawrence JW, Claire DC, Weissig V, Rowe TC (1996) Delayed cytotoxicity and cleavage of mitochondrial DNA in Ciprofloxacin‐treated mammalian cells. Mol. Pharmacol. 50, 1178–1188. [PubMed] [Google Scholar]
- Lawrence JW, Darkin‐Rattray SJ, Xie F, Neims AH, Rowe TC (1993) 4‐Quinolones cause a selective loss of mitochondrial DNA from mouse L1210 leukemia cells. J. Cell. Biochem. 51, 165–174. [DOI] [PubMed] [Google Scholar]
- Matuszyk J, Cebrat M, Kalas W, Strzadala L (2002) HA1004, an inhibitor of serine/threonine protein kinases, restores the sensitivity of thymic lymphomas to Ca2+‐mediated apoptosis through a protein kinase A‐independent mechanism. Int. Immunopharmacol. 2, 435–442. [DOI] [PubMed] [Google Scholar]
- McAteer JA, Davis J (1994) Basic cell culture technique and the maintenance of cell lines In: Davis JM, ed. Basic Cell Culture, p. 93 Oxford, UK: Oxford University Press. [Google Scholar]
- Mosmann T (1983) Rapid colorimetric assay for cellular growth and survival: application to proliferation and cytotoxicity assays. J. Immunol. Methods 65, 55–63. [DOI] [PubMed] [Google Scholar]
- Pessina A, Mineo E, Gribaldo L, Mancina G, Neri MG, Moran E, Cleary I, Clynes M (1993) Susceptibility of leukemia cell lines to quinolones and induction of resistance to ciprofloxacin in WEHI‐3B (D+) leukemia cells. Cancer J. 6, 291–297. [Google Scholar]
- Pessina A, Raimondi A, Croera C, Acchini M, Mineo E, Foti P, Neri MG (2001) Altered DNA‐cleavage activity of topoisomerase II from WEHI‐3B leukemia cells resistant to ciprofloxacin. Anticancer Drugs 12, 441–441. [DOI] [PubMed] [Google Scholar]
- Schendel SL, Montal M, Reed JC (1998) Bcl‐2 family proteins as ion‐channels. Cell Death Differ. 5, 372–380. [DOI] [PubMed] [Google Scholar]
- Schlesinger PH, Gross A, Yin XM, Yamamoto K, Saito M, Waksman G, Korsmeyer SJ (1997) Comparison of the ion channel characteristics of proapoptotic BAX and antiapoptotic Bcl‐2. Proc. Natl. Acad. Sci. USA 94, 11357–11362. [DOI] [PMC free article] [PubMed] [Google Scholar]
- Strobel T, Swanson L, Korsmeyer S, Cannistra SA (1996) Bax enhances paclitaxel‐induced apoptosis through a p53‐indipendent pathway. Proc. Natl. Acad. Sci. USA 93, 14094–14099. [DOI] [PMC free article] [PubMed] [Google Scholar]
- Terzoudi GI, Manola K, Pantelias GE, Iliakis G (2005) Checkpoint Abrogation in G2 compromises repair of chromosomal breaks in ataxia telangiectasia cells. Cancer Res. 65, 11292–11296. [DOI] [PubMed] [Google Scholar]
- Thomson M (2002) Evidence of undiscovered cell regulatory mechanisms: phosphoproteins and protein kinases in mitochondria. Cell. Mol. Life Sci. 59, 213–219. [DOI] [PMC free article] [PubMed] [Google Scholar]
- Tortora G, Ciardiello F (2002) Protein kinase A type I. Clin. Cancer Res. 8, 303–304. [PubMed] [Google Scholar]
- Towbin H, Staehelin T, Gordon J (1979) Electrophoretic transfer of proteins from polyacrylamide gels to nitrocellulose sheets: procedure and some applications. Proc. Natl. Acad. Sci. USA 76, 4350–4354. [DOI] [PMC free article] [PubMed] [Google Scholar]


