

Abstract
Objective: In Alzheimer's disease, toxic soluble and insoluble forms of amyloid beta (Aβ) cause synaptic dysfunction and neuronal loss. Given its potential role in producing a toxic host microenvironment for transplanted donor stem cells, we investigated the interaction between Aβ and proliferation, survival, and differentiation of bone marrow‐derived mesenchymal stem cells (BM‐MSC) in culture.
Materials and methods: We used BM‐MSC that had been isolated from mouse bone marrow and cultured, and we also assessed relevant reaction mechanisms using gene microarray, immunocytochemistry, and inhibitors of potential signalling molecules, such as mitogen‐activated protein kinase (MAPK)/extracellular signal‐regulated kinase (ERK)1/2 and tyrosine protein kinase.
Results and conclusions: Interestingly, we found that treatment with aggregated (1–40 or 1–42) and oligomeric (1–42) Aβ promoted neuronal‐like differentiation of BM‐MSC without toxic effects. This was not dependent on soluble factors released from BM‐MSC progeny nor solely on formation of Aβ fibrils. The effect of Aβ is mediated by G‐protein coupled receptors, neuropeptide Y1 (NPY1R) and serotonin (5‐hydroxytryptamine) receptor 2B, via phosphatidylinositol‐3‐OH kinase‐dependent activation of the MAPK/ERK1/2. Our results lend support to the idea that reciprocal donor stem cell–host interactions may promote a regenerative response that can be exploited by epigenetic modulation of NPY/serotonergic gene expression, for stem cell therapy, in Alzheimer's disease.
Introduction
In addition to their traditional lineages, bone marrow‐derived mesenchymal stem cells (BM‐MSC) may be experimentally induced to form many other cell types, including neuronal and myogenic cells (1, 2). This plasticity has raised prospects for their potential use to treat a wide range of diseases, including neurodegenerative disorders such as Alzheimer's disease (AD) (3, 4, 5, 6). However, understanding of the biological mechanisms underlying this phenotypic plasticity and whether these mechanisms are inherently cell‐ and/or end‐organ–specific, remain limited. AD brain pathology is characterized by self‐aggregation of mainly insoluble fibrillar amyloid beta (Aβ) in the form of senile plaques (7, 8). The possibility that differing conformations of Aβ may contribute to AD pathology via different mechanisms, has been raised (9). Furthermore, recent studies have suggested that Aβ, by an effect on the protein dynamin, may be implicated in deficient synaptic vesicle recycling resulting in early cognitive decline in AD (10). Dynamin is essential for internalization of G‐protein‐coupled receptors (GPCR) and is linked to a role in memory and learning (10, 11, 12). Previous studies have shown that Aβ can adversely affect mitotic cells, including inhibition of proliferation of astrocytes and PC12 cells (13, 14), induction of apoptosis in microglia (15), and disruption of neurogenesis in neuronal precursor cells (16). Conversely, however, in vitro evidence supports a positive neurogenic effect for Aβ or its precursor (β amyloid precursor protein), promoting differentiation into neurons of human neural stem cells and neural stem cells isolated from rat embryo or mouse hippocampi (17, 18).
In order to predict success of cell therapy for diseases such as AD, it is crucial to understand more fully the effect of pathophysiological processes on survival, differentiation and interaction with replacement cell types. In an attempt to answer this question prior to establishing transplantation procedures in an animal model of AD, we studied the effect of Aβ including oligomeric and fibrillar forms, on proliferation, survival, and differentiation of BM‐MSCs in culture. To address the mechanism by which this occurs, we used gene microarrays and inhibitors of signal transduction pathways known to be involved in neurogenesis. Here we demonstrate that aggregated Aβs (Αβ1–40 and 1–42), which includes both oligomeric and fibrillar forms, and Aβ1–42 enriched for oligomeric forms, induced neuronal differentiation of BM‐MSC, evidenced by increased expression of neuronal markers, in the absence of change in rate of cell death or proliferation. This effect was not attributable to production of BM‐MSC‐specific trophic factors. Gene microarray and real‐time polymerase chain reaction (PCR) analysis confirmed up‐regulation in expression of the neurotransmitter NPY, the GPCR 5‐hydroxytryptamine receptor 2B (5‐HT2B), and matrix metalloproteinase 12 (MMP12). Protein analysis demonstrated increased expression of NPY and 5‐HT2B together with a smaller increase in MMP12. NPY is known to attenuate learning impairment and mediate its effect via GPCR, NPY1R (19, 20), whose increased expression was also confirmed in this analysis. Inhibition of the ERK1/2‐mitogen‐activated protein kinase (MAPK) cell signalling pathway via phosphatidylinositol‐3‐OH kinase (PI(3)K)‐dependent activation abolished neuronal differentiation, which suggests that action of GPCR is mediated by this signalling cascade. In view of recent data, we have also investigated the interaction between Aβ and dynamin in our treated cells. These experiments confirmed an increase in dynamin protein expression providing a potential mechanistic link between GPCRs and neuroplasticity, in response to Aβ in BM‐MSCs which will form the focus of further investigation.
Materials and methods
BM‐MSC culture
To obtain BM‐MSC, tibias and femurs were dissected from 4‐ to 6‐week‐old C57BL/6J (Harlan, Loughborough, UK), NPY‐deficient mice (Jackson Laboratories, Bar Harbor, ME, USA). Bone marrow cells were prepared and maintained in MesenCultTM MSC Basal Medium8 and Mesenchymal Stem Cell Stimulatory Supplements (Stem Cell Technologies, Sheffield, UK) with antibiotics, according to our previous report (3, 4, 5). Animals were housed and treated according to the UK Animals (Scientific Procedures) Act of 1986. Cell cultures were grown for 7 days, and the plastic‐adherent cell population (BM‐MSC) was used for subsequent experiments.
Aβ treatment/preparation
BM‐MSCs were plated at a density of 18 000 cells/cm2 on eight‐well glass slide chambers (Nalge Nunc International, Rochester, NY, USA). To analyse the effects of Aβ treatment, cells were treated with 0.1, 0.5, 1, 5, or 10 µm of Aβ1–40, 42, and 25–35. Cells in parallel wells received a vehicle of sterile water of equal volume without addition of peptide (untreated group). Immunocytochemical staining was performed at different time points (1, 3, or 5 days after treatment) from 2 days postplating (dpp). Lyophilized, HPLC‐purified Aβ was purchased from Bachem, St Helens, UK. Peptides were reconstituted in sterile water at a concentration of 400 µm and incubated at 37 °C for 3 days or 24 h to form aggregated Aβ (that is, containing oliogomeric and fibrillar Aβ) or maintained at 4 °C in soluble or non‐aggregated form. Soluble oligomeric and insoluble fibrillar Aβ1–42 were prepared using the method of Dahlgren et al. (21). For ease, the term aggregated Aβ is used throughout to denote a preparation containing both oligomeric and fibrillar forms.
Inhibitor treatment
The following inhibitors were used: PD98059 (a highly selective MAP/ERK kinase (MEK) inhibitor), bisindolylmaleimide I (protein kinase C inhibitor) and LY294002 (PI(3)K inhibitor) were obtained from Calbiochem (San Diego, CA, USA); U0126, which specifically inhibits both MEK1/2 directly upstream of ERK1/2, was obtained from Upstate (Billerica, MA, USA); 6E10 was obtained from Signet (Dedham, MA, USA); and Genistein, an inhibitor of tyrosine protein kinase, was obtained from Sigma‐Aldrich (St. Louis, MO, USA). Inhibitor stocks were diluted in dimethyl sulphoxide and stored in aliquots at –80 °C until use. BM‐MSCs were treated for 5 days beginning 2 dpp in the presence or absence of Aβs.
BM‐MSC conditioned medium
To obtain conditioned medium (CM), BM‐MSC at 2 dpp were treated with Aβ at a concentration of 5 µm for a period of 5 days, or were maintained untreated. At 7 dpp, medium was removed and cells were fixed for immunostaining. BM‐MSC CM was added to non‐treated cells at 2 dpp for 5 days in the presence or absence of 6E10 antibody. 6E10 antibody acts to specifically block action of Aβ, allowing direct discrimination between the effect of Aβ and soluble factors released to the medium from BM‐MSC.
Immunocytochemistry
BM‐MSCs were fixed with 4% paraformaldehyde for 20 min, permeabilized with an ethanol acetic acid solution (19 : 1) at –20 °C for 20 min, blocked with 10% foetal bovine serum, and incubated with primary antibodies overnight at 4 °C. Identical negative controls were similarly processed, with the omission of the primary antibody step. Monoclonal anti‐neuronal nuclei (NeuN), anti‐oligodendrocyte (O1), anti‐β‐tubulin isotype III (β‐tubulin) and polyclonal anti‐glial fibrillary acid protein (GFAP) (rabbit) were obtained from Chemicon (Temecula, CA, USA). Monoclonal anti‐dynamin 1, polyclonal anti‐dynamin 2 (goat) and anti‐SR‐2B (goat) for 5‐HT2B, were purchased from Santa Cruz Biotechnology (Santa Cruz, CA, USA). After incubation, slides were washed and incubated with appropriate secondary antibodies conjugated with AlexaFluor 488 (green fluorescence) or AlexaFluor 568 (red fluorescence) (Molecular Probes, Carlsbad, CA, USA).
Flow cytometry
Apoptosis was determined using Annexin‐V‐FLUOS and propidium iodide double staining (Chemicon), according to the manufacturer's instructions and as previously published (22). Cell cycle fractions were determined by propidium iodide nuclear staining, and analysis was performed by applying the diploid cell cycle model, using the MODFIT LT™ (Verity Software House Inc., Topsham, ME, USA).
BeadChip microarray analysis
Five hundred nanograms of total RNA from BM‐MSC or NIH3T3 fibroblasts treated with 5 µm aggregated Aβs for 5 days and time‐matched cells treated with sterile water as vehicle (control) were used to generate biotin‐labelled cRNA using the Illumina RNA Amplification kit (Applied Biosystems, Stockholm, Sweden) and Biotin‐16‐UTP (Chemicon), following the manufacturers’ instructions. Labelled cRNA (250 ng per array) was hybridized to the Illumina Sentrix® Mouse‐6 BeadChip array according to the manufacturer's instructions (Illumina, San Diego, CA, USA). After washing, scanning of the BeadChip arrays was performed with an Illumina BeadArray Reader. Data processing and analysis were performed with GeneSpring (version 7.3, Agilent Technologies, Santa Clara, CA, USA) using the absolute analysis data generated by BeadStudio software (Illumina). Fluorescent intensity of each array was normalized to median value, and then each gene set normalized to that of BM‐MSC or NIH3T3 cells treated with vehicle only. Transcripts that had a raw signal of greater than 50 in at least one experimental condition were filtered by Student's t‐test at P‐value of 0.05. A total of 228 transcripts was returned and further filtered to identify differentially regulated transcripts that differed in expression when comparing control versus Aβs treatment in each group. Differential expression was defined as those transcripts that had a difference of > 1.5‐fold enriched or < 0.67‐fold depleted. Statistical analyses were performed using GeneSpring software (Student's t‐test, significance level set at P < 0.05). In hierarchical clustering performed with GeneSpring, we used average linkage with elucidation distance to cluster the microarray samples on the basis of their expression profiles.
Real‐time PCR
For validation of the microarray data, cDNA was synthesized from total RNA (1 µg) by using StrataScript® RT/RNase Block Enzyme mixture (Stratagene, La Jolla, CA, USA) and an oligo (dT) primer according to the manufacturer's instructions and used as the template for quantitative real‐time PCR. Real‐time PCR was performed in a 96‐well plate using a 7300 ABI prism sequence detection system (Applied Biosystems, Foster City, CA, USA) according to the manufacturer's instructions. PCR primers used were: NPY‐forward: 5′‐CCGCTCTGCGACACTACATC‐3′, NPY‐reverse: 5′‐GGCGTTTTCTGTGCTTTCCT‐3′; MMP12‐forward: 5′‐CATGAAGCGTGAGGATGTAG‐3′, Mmp12‐reverse: 5′‐TAGTTGAAGTCTCCGTGAGC‐3′; Wisp1 (WNT1 inducible signalling pathway protein 1)‐forward: 5′‐GCCTAGGTATCTCCACTCGGATCT‐3′, Wisp1‐reverse: 5′‐TGTTCCTGCGGAAGCTGAGT‐3′; 5‐HT2B‐forward: 5′‐CCGATTGCCCTCTTGACAA‐3′, 5‐HT2B‐reverse: 5′‐TGCATGATGGAGGCAGTTGA‐3′; Oligo1‐forward: 5′‐GTCCTGGATCTAGGCAGAGC‐3′, Oligo1‐reverse: 5′‐CTACATCGCTCCTTGGAACA‐3′; GLAST‐forward: 5′‐TGGAAGACATGGGTGTGATT‐3′, GLAST‐reverse: 5′‐TAGAGGAGAGGCAGGACGAT‐3′; pax6‐forward: 5′‐GCCAGCAACACTCCTAGTCA‐3′, pax6‐reverse: 5′‐CATGGAACCTGATGTGAAGG‐3′; GAPDH‐forward: 5′‐ACTCCCACTCTTCCACCTTCG‐3′, GAPDH‐reverse: 5′‐ATGTAGGCCATGAGGTCCACC‐3′. The GAPDH gene was used as an internal standard to normalize CT values for each sample. Relative expression between BM‐MSC control versus Aβ‐treated BM‐MSC was calculated using the relative curve standard method as described in the SYBR green protocol (Applied Biosystems). Statistical analyses were performed using Prism software (version 2.0, GraphPad Software Inc., San Diego, CA, USA).
Western blotting
BM‐MSC cultures were incubated with aggregated Aβs for 5 days with or without inhibitors, then harvested for Western blotting. Membranes were blocked with 5% skimmed milk and sequentially incubated with primary antibodies against total and phosphorylated ERK1/2 (p42/44) (Thr202/Tyr204), total and phosphorylated MEK1/2 (Ser217/221) (Cell Signaling Technology, Beverly, MA, USA), polyclonal anti‐SR‐2B (goat) for 5‐HT2B, monoclonal anti‐dynamin 1 for dynamin 1, and polyclonal anti‐dynamin 2 (goat) for dynamin 2 (Santa Cruz Biotechnology), anti‐neuropeptide Y (rabbit) for NPY and anti‐neuropeptide Y1 (rabbit) for recognizing the C‐ or N‐terminal region of NPY1R receptor (Alpha Diagnostic International, San Antonio, TX, USA) and polyclonal anti‐MMP12 (rabbit) for MMP12 (Chemicon). The MMP12 antibody used was generated to human determinants and cross‐reactivity to murine cells is unclear. Standardization was performed by re‐probing the blots with all antibodies and actin (1 : 1000, Sigma). Blots were developed using enhanced chemiluminescence detection system (ECL; Amersham Biosciences, Buckinghamshire, UK).
Data analysis for immunocytochemistry
Results are expressed as mean ± standard error of fluorescence intensity of positive cells for each antibody, from several independent experiments performed in triplicate or quadruplicate. Data were normalized in relation to their own appropriate control group (the fluorescence intensity of cells treated with Aβ divided by fluorescence intensity of the untreated cells). In each culture, fluorescence intensity of 20 predetermined images was quantified using Zeiss Axiovert S100 fluorescence microscopy equipped with Metamorph 6.2r4 Universal Imaging Corporation (Downingtown, PA, USA) as described previously (23, 24).
Statistical analysis
Differences among groups except for microarray and real‐time PCR analysis were examined using analysis of variance, followed by the Tukey HSD test using SAS statistical package (release 8.1; SAS Institute Inc., Cary, NC, USA). P < 0.05 was considered to be significant.
Results
Aggregated Aβs induce expression of neuronal markers in BM‐MSCs, with no change in apoptotic nor proliferation rates
To determine the effect of Aβ peptides in inducing neuronal differentiation of BM‐MSCs, varying concentrations of aggregated Aβ1–40, 1–42, or 25–35 were added at 2 dpp, and cells then immunostained with antibodies to β‐tubulin, NeuN, GFAP or O1 where aggregated Aβ peptide preparations contained both oligomeric and fibrillar forms. Number of cells positive for these target markers, as identified by increase in fluorescence intensity, was analysed compared to controls (Fig. 1a–f).
Figure 1.
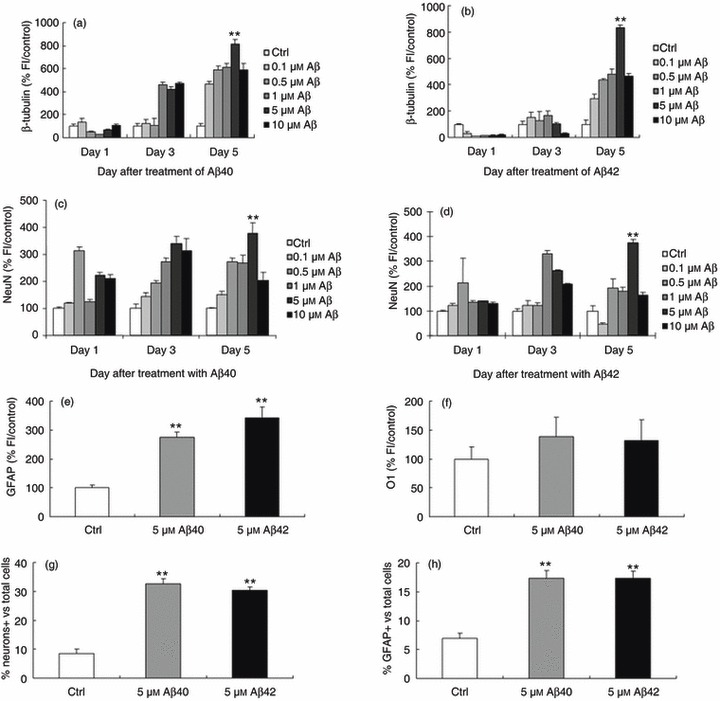
Aggregated amyloid beta (Aβ) containing both oligomeric and fibrillar forms promote neuronal differentiation. The number of cells staining positive for β‐tubulin, NeuN and GFAP represented by an increase in fluorescence intensity compared to untreated controls is shown. Concentrations at 5 µm for both Aβ1–40 and 1–42 peptides produced a significant increase in fluorescence intensity compared to controls. (a,b) β‐tubulin (812 ± 37 and 834 ± 19%, respectively, P < 0.0001). (c,d) NeuN (378 ± 38 and 339 ± 28, respectively, P < 0.0001). (e) GFAP (274 ± 18 and 341 ± 39, respectively, P < 0.0001). (f) Neither 5 µm Aβ1–40 nor 1–42 produced a significant increase in O1 staining. The number of cells expressing target neuronal markers per total number of cells, (g) β‐tubulin (control, 8.6 ± 1.35; Aβ40, 32.6 ± 1.92; Aβ42, 30.4 ± 1.06), (h) GFAP (control, 6.9 ± 0.95; Aβ40, 17.3 ± 1.35; Aβ42, 17.3 ± 1.25). Error bars: standard error of the mean from one representative of a total of three experiments done in triplicate. *P < 0.001; **P < 0.0001, relative to control (analysis of variance followed the Tukey HSD test).
For Aβ1–40, 1–10 µm of peptide increased the number of cells positive for β‐tubulin III antibody at 3 days, and all concentrations increased the number of cells positive compared to control, at 5 days after treatment (Fig. 1a). For Aβ1–42, 0.5–10 µm of peptide likewise induced increases in number of cells positive but only at 5 days after treatment (Fig. 1b). For both Aβs, a 5‐µm concentration induced a statistically significant effect at 5 days after treatment (812 ± 37 and 834 ± 19%versus control, respectively, P < 0.0001, Fig. 1a,b). For NeuN staining, as with β‐tubulin, 5‐µm concentration of Aβs produced a statistically significant increase in intensity of fluorescence staining compared to controls at 5 days (378 ± 38 and 339 ± 28, respectively, P < 0.0001, Fig. 1c,d). We also performed experiments using the glial cell marker GFAP and the oligodendrocyte marker O1 at 5 µm concentration. As with β‐tubulin and NeuN, we saw a significant increase in intensity of GFAP in response to 5 µm Aβs at 5 days after treatment (274 ± 18 and 341 ± 39, respectively, P < 0.0001, Fig. 1e) but no significant difference for O1 with 5 µm Aβs (Fig. 1f).
Using this concentration 5 µm Aβs in subsequent experiments, number of cells expressing target markers β‐tubulin (Fig. 1g: control, 8.6 ± 1.35; Aβ40, 32.6 ± 1.92; Aβ42, 30.4 ± 1.06; P < 0.0001) and GFAP (Fig. 1h: control, 6.9 ± 0.95; Aβ40, 17.3 ± 1.35; Aβ42, 17.3 ± 1.25; P < 0.0001), expressed as a percentage of total number of cells in the population, were calculated (representative immunocytochemistry images, Fig. S1, Supporting Information). In order to verify that this positive immunostaining was consistent with neuronal and/or glial differentiation pattern, quantitative real‐time PCR was also performed. This verified up‐regulated expression of the neuronal and glial markers GLAST, Oligo1 and pax6, in response to both Aβ1–40 and 1–42 treatment (Fig. S2, Supporting Information).
Differentiation pattern, confirming expression of a variety of neuronal‐specific markers using both immunocytochemistry and quantitative PCR, strongly suggests that BM‐MSC response to Aβs treatment is unlikely to be attributable to non‐specific staining of non‐neuronal cells. Aggregated or non‐aggregated Aβ25–35 (Fig. S2) and non‐aggregated forms of the Aβs tested under identical experimental conditions failed to produce a statistically significant increase in expression of any of the β‐tubulin, NeuN or GFAP markers (Fig. S3, Supporting Information). Based on these results, we focused on BM‐MSC treated with 5 µm Aβs at 5 days after treatment in the aggregated form for all subsequent experiments.
To determine whether increased expression of neuronal markers by BM‐MSC in response to Aβ arises from neuronal differentiation of existing cells or is indirectly attributable to alterations in cell numbers or cell death, we incubated BM‐MSCs with sterile water (control) or 5 µm aggregated Aβs for 5 days. Cell death was determined using propidium iodide/Annexin‐V staining method and cell cycle fractions by propidium iodide staining. These experiments demonstrated that apoptosis forward scatter profiles in control cultures did not change with addition of 5 µm Aβ1–40 or 1–42 (Fig. 2a), a finding supported by lack of expression of apoptosis‐related genes on microarray analysis (Table 1). Cell cycle profiling confirmed that there were no significant changes in the proportion of BM‐MSC at S phase of the cell cycle in treated versus control conditions (Fig. 2b).
Figure 2.
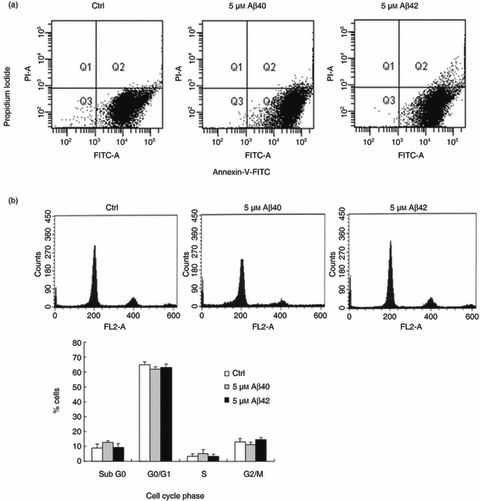
Aggregated amyloid beta (Aβ) treatment of bone marrow‐derived mesenchymal stem cells (BM‐MSC) produced no significant changes in apoptosis and cell cycling. (a) BM‐MSCs treated with aggregated 5 µm Aβs at 2 dpp and analysed for apoptotic cells after 5 days incubation by propidium iodide/Annexin‐V staining and fluorescence‐activated cell sorting method. BM‐MSC cultures treated with Aβs show no change in apoptosis forward scatter profiles compared to controls. (b) Cell cycle profiling confirmed that there were no significant changes in the proportion of BM‐MSC at S phase of the cell cycle in treated versus control conditions. The graphs show mean ± standard error of the mean from one representative of three different experiments done in triplicate.
Table 1.
Summary of genes represented in Fig. 5b, uniquely or mutually up‐ or down‐regulated according to amyloid beta (Aβ) treatment (P < 0.05)
| Abbreviation | Name | GenBank accession no. | Fold change | P | ||
|---|---|---|---|---|---|---|
| Aβ1−40 | Aβ1−42 | Aβ1−40 | Aβ1−42 | |||
| NPY | Mus musculus neuropeptide Y | NM_023456.2 | 2.141 | 1.437 | 0.0276 a | 0.0482 a |
| MMP12 | Mus musculus matrix metalloproteinase 12 | NM_008605.1 | 2.717 | 1.684 | 0.018 a | 0.0337 a |
| 5‐HT2B | Mus musculus 5‐hydroxytryptamine (serotonin) receptor2B | NM_008311.1 | 1.683 | 1.556 | 0.0436 b | 0.0578 |
| Wisp1 | Mus musculus WNT1 inducible signalling pathway protein 1 | NM_018865.1 | 1.404 | 1.523 | 0.0736 | 0.0482 b |
| Dlgap4 | Discs, large homolog‐associated protein 4 (Drosophila) | BC024558 | 1.505 | 1.741 | 0.0482 c | 0.0369 c |
| Atp5l | ATP synthase | XM_125157.1 | 0.619 | 0.549 | 0.0485 c | 0.0333 c |
| Clta | Mus musculus clathrin, light polypeptide | NM_016760.1 | 0.596 | 0.592 | 0.0447 c | 0.0403 c |
| F13a | Coagulation factor XIII | NM_028784 | 0.516 | 0.581 | 0.0435 c | 0.0392 c |
| Gpr171 | G protein‐coupled receptor 171 | NM_173398.1 | 0.471 | 0.651 | 0.0444 c | 0.0498 c |
| Nptn | Neuroplastin, Mus musculus stromal cell derived factor receptor1 | NM_009145.1 | 0.661 | 0.639 | 0.0498 c | 0.0517 c |
| Sfrp1 | Secreted frizzled‐related sequence protein 1 | 0.619 | 0.71 | 0.0381 c | 0.0507 c | |
| Usmg5 | Mus musculus upregulated during skeletal muscle growth 5 | XM_123431.1 | 0.604 | 0.606 | 0.0517 c | 0.0358 c |
| Zbtb7a | Zinc finger and BTB domain containing 7a | AK033556 | 0.486 | 0.573 | 0.0225 c | 0.0476 c |
Mutually up‐regulated genes.
b Uniquely up‐regulated genes.
c Mutually down‐regulated genes.
Neuronal differentiation of BM‐MSC is an Aβ‐specific effect
Increased expression of neuronal markers could have arisen from the ability of adult BM‐MSC to spontaneously express certain neuronal phenotype markers in culture, in the absence of specialized induction regents (25, 26). Since our previous results have confirme that the observed increase in neuronal differentiation in treated cells is over and above baseline in identical control cells, it is unlikely to be a spontaneous phenomenon. However, it is possible that the neurogenic effect is not Aβ‐related and arises non‐specifically through release of a soluble factor from cells within the BM‐MSC subpopulation. To determine whether this was the case, we examined the ability of 6E10, a mouse monoclonal anti‐human Aβ protein, to inhibit the Aβ‐related neurogenic effect. We obtained CM from BM‐MSCs treated with (CM+) or without (CM–) 5 µm aggregated Aβs for 5 days starting at 2 dpp. Under these conditions, as expected, 5 µm Aβs induced an increase in number of cells expressing the neuronal marker β‐tubulin (799 ± 45% and 781 ± 52%versus control, respectively, P < 0.0001) and this was specifically abolished by addition 6E10 (1 : 100) (Fig. 3a,c). The CM (+ or –) was next added to untreated 2 dpp cultures either in the presence or absence of 6E10 antibody. Cells were fixed for immunostaining after 5 days. These results demonstrate that only the CM produced by Aβ1–40‐stimulated or 1–42‐stimulated BM‐MSC (i.e. CM+) produced a specific increase in neurogenesis (P < 0.0001) (Fig. 3b,d). Addition of anti‐Aβ antibody blocked this increase, suggesting that CM‐induced neuronal differentiation was caused by residual Aβs in the CM and that neuronal differentiation induced by Aβs was indeed a direct effect on the BM‐MSCs (Fig. 3b,d). We also stained parallel experiments using the neuronal marker NeuN. As with β‐tubulin, the results showed a significant increase in expression of neuronal markers by BM‐MSCs exposed to the CM from Aβ‐treated cultures and addition of anti‐Aβ blocked this increase (Fig. S4, Supporting Information). These results indicate that neuronal differentiation of BM‐MSC is an Aβ‐specific effect.
Figure 3.
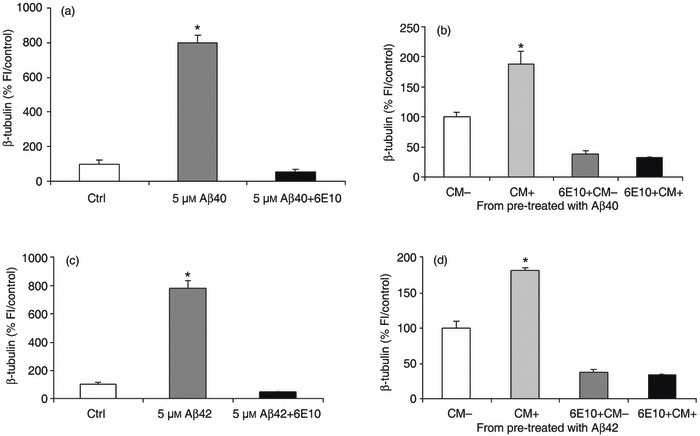
Neuronal differentiation of bone marrow‐derived mesenchymal stem cell (BM‐MSC) is an amyloid beta (Aβ)‐specific effect. (a,c) Neuronal differentiation induced by treatment with 5 µm aggregated Aβ1–40 and 1–42 (799 ± 45% and 781 ± 52% versus control, respectively, P < 0.0001) is completely abolished by the 6E10 anti‐Aβ antibody (1 : 100) (5 µm Aβs + 6E10). (b,d) The BM‐MSCs exposed to conditioned medium (CM) from Aβ1–40‐ or 1–42‐treated wells (CM+; b and d, respectively) show a significant increase in neuronal number compared to cells exposed to CM from untreated wells (CM–), as defined by β‐tubulin staining. The 6E10 antibody abolishes completely the neuronal differentiation produced by CM+ (6E10+ CM+). Data represent mean ± standard error of the mean of normalized data versus control by fluorescence intensity from one representative experiment of four done in quadruplicate. *P < 0.0001, relative to control or CM–.
Oligomeric and fibrillar species of Aβs have differential affects
Differing conformations of Aβ may be responsible for neurotoxicity and cell death that are pathognomonic of AD (9, 27). Thus, we have prepared Aβs using a protocol that allows enrichment for either soluble oligomeric or fibrillar forms of Aβ (21), and directly compared their effects with aggregated preparations (containing both oligomeric and fibrillar forms) on neuronal differentiation of BM‐MSC. Aggregated 5 µm Aβs both produced an increase in the percentage of neurons as identified in initial experiments (P < 0.0001, Fig. 4a,b) whereas for enriched samples, only 5 µm soluble oligomeric Aβ1–42 produced an increase in neuronal number that reached significance (P < 0.05). Treatment of BM‐MSCs with Aβs enriched for fibrillar forms, and non‐aggregated forms, produced no significant change in neuronal number (Fig. 4a,b and Fig. S4). These results indicate that different conformations of Aβ have a differential affect on neuronal differentiation of BM‐MSC and suggest that aggregated Aβs forms in general, and soluble oligomeric Aβ1–42 in particular, are the active species.
Figure 4.
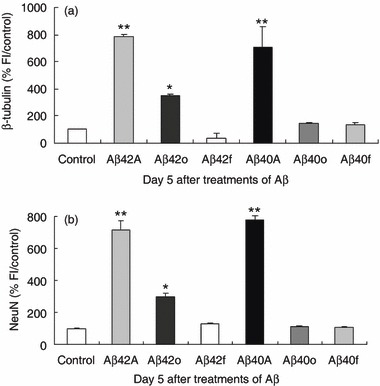
Amyloid beta (Aβ) enriched for oligomeric and fibrillar species have differential affects on neuronal differentiation. To test the effect of the state of aggregation of Aβ on neuronal differentiation, we prepared aggregated Aβ (Aβ42A/Aβ40A) and Aβ enriched for soluble oligomeric (Aβ42o/Aβ40o) and fibrillar forms (Aβ42f/Aβ40f). (a) Bone marrow‐derived mesenchymal stem cells (BM‐MSC) treated with 5 µm aggregated forms (Aβ42A, Aβ40A) showed an increase in neuronal cell number as previously demonstrated in Fig. 1. Soluble oligomeric forms (5 µm) of Aβ42o but not Aβ40o similarly produced a significant increase in neuronal cell number. Insoluble Aβ42f/Aβ40f produced no significant change in percentage of neurons compared to control. (b) To confirm that this was not a non‐specific effect on non‐neuronal cells, the increase in neuronal numbers with aggregated forms (Aβ42A, Aβ40A), soluble oligomeric (Aβ42 o/Aβ40 o) and insoluble fibrillar forms (Aβ42f/Aβ40f) was assessed using another neuronal marker, NeuN. Graphs show mean ± SEM from one representative of four different experiments done in quadruplicate. *P < 0.05; **P < 0.0001, relative to control.
Aβ induces neurogenesis via NPY, 5‐HT2B and dynamin, and this is mediated by activation of ERK1/2‐directed signalling pathways
We were interested in determining to what extent the transcriptome of BM‐MSC treated with aggregated Aβs or control vehicle, differed from that of NIH3T3 cells (non‐neuronal cells with BM‐MSC‐like morphology) treated in a similar manner. Hierarchical clustering of the whole filtered data set generated a dendogram where each column represents a cell type/treatment condition and each row a transcript. The second order branching classed peptide‐treated BM‐MSC samples as more closely related to one another than to NIH3T3. In NIH3T3 cells, Aβ‐treated samples did not cluster together (Fig. 5a). These analyses indicate that gene expression profiles in BM‐MSC elicited by treatment of Aβs were globally distinct from those of vehicle‐treated control and Aβ‐treated NIH3T3 cells. We next asked what is unique about the transcriptional profile of BM‐MSC treated with the peptides. Proportions of transcripts that are differentially expressed according to treatment and cell type are displayed in Venn diagrams (Fig. 5b–e). The results indicate that treatment with Aβ1–42 induced more gene expression change in both BM‐MSC and NIH3T3 (66 and 108 transcripts) than Aβ1–40 (37 and 22 transcripts, respectively), indicating a peptide‐specific effect (Fig. 5b,c). Of note, comparing transcript profiles between cell types (Fig. 5d,e), Aβ1–40 showed an absence of overlap in shared transcripts between BM‐MSC and NIH3T3, and Aβ1–42 produced an overlap of only 8.8% (14/160), thereby confirming a cell‐specific effect.
Figure 5.
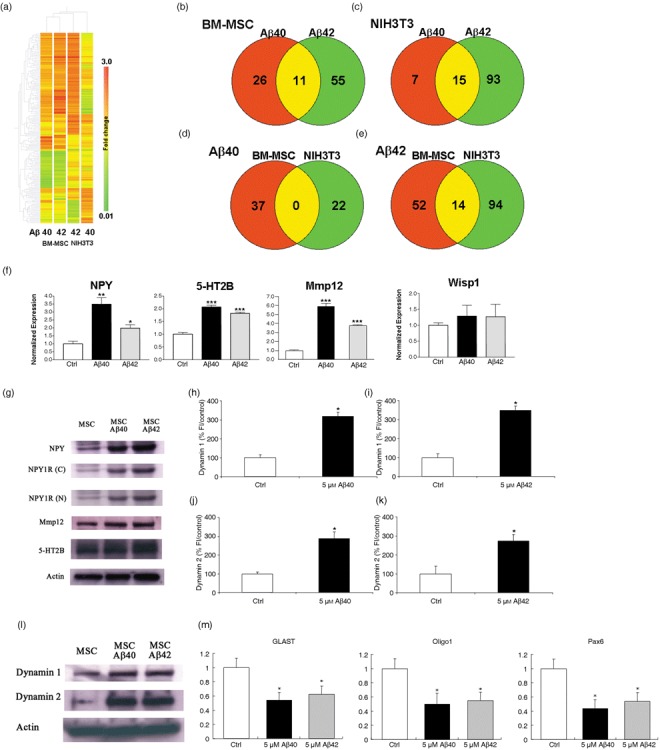
Amyloid beta (Aβ) induces neurogenesis via the action of NPY and dynamin associated GPCR signalling and this is mediated by activation of ERK1/2‐directed signalling pathways. Hierarchical clustering and Venn diagrams demonstrate the difference in transcript distribution between bone marrow‐derived mesenchymal stem cells (BM‐MSC) and NIH3T3 cells treated with either Aβ1–42 or Aβ1–40. (a) Hierarchical clustering analysis of a list of significantly differentially expressed transcripts (228 transcripts). Transcripts that had a raw signal of greater than 50 in at least one experimental condition were filtered by Student's t‐test at P < 0.05. Columns of BM‐MSCs and NIH3T3 cells treated with Aβ peptides only are shown. Transcripts are ordered by default gene trees generated in GeneSpring 7.3. (b,c) Venn diagrams showing transcript distribution in NIH3T3 and BM‐MSC elicited in response to Aβ treatment. Aβ1–42 peptide induces more gene expression change than Aβ1–40 in both cell types (66 and 108, BM‐MSC and NIH3T3 respectively). (d) Aβ1–40 induces no overlap in expressed genes in both cell types whereas (e) Aβ1–42 induces minimal overlap of shared genes (14/160 = 8.8%). The diagrams were generated from lists of transcripts that are > 1.5‐fold enriched or < 0.67 depleted, relative to non‐treated control. (f) Real‐time polymerase chain reaction (PCR) was used to validate microarray analysis for four genes: NPY, 5‐HT2B, MMP12 and Wisp 1. There was a significant increase in expression of the genes NPY, 5‐HT2B and MMP12 for both Aβ treatments relative to that in control untreated cells. Changes in Wisp1 expression are not significant. For each transcript, amplicon abundance is normalized to GAPDH abundance because this housekeeping gene is approximately equal across all microarray chips. The normalized amplicon levels are then expressed as a mean ratio versus that measured in untreated BM‐MSC ± SEM *P < 0.05; **P < 0.01; triple asterisk, P < 0.001, relative to control (Student's t‐test). (g) Representative Western blot analysis shows increased expression of NPY and its Y1 receptor (using antibodies NPY1R‐N‐terminus, 11 kDa and NPY1R‐C‐terminus, 11 kDa). NPY and the Y1 receptor are endogenously expressed in BM‐MSC. Treatment with Aβ1–42 and Aβ1–40 induced an increase in NPY and NPY1R. Protein expression for MMP12 was increased for each Aβ peptide treatment compared to control. Protein expression using the 5‐HT2B polyclonal antibody produced an equivocal result. (h–l) BM‐MSC cultures treated with 5 µm Aβs for 5 days showed a significant increase in fluorescent staining intensity for both dynamin 1 and 2 staining together with an increase in protein expression. *P < 0.0001, relative to control. (m) Quantitative real‐time PCR demonstrating neuronal‐specific down‐regulation of GLAST, Oligo1 and Pax6 genes in response to Aβ treatment using NPY‐deficient mice. *P < 0.001, relative to control.
Of these transcripts, only those that demonstrated a significant change in level of expression compared to untreated control are summarized in a subset in Table 1. For the preliminary analysis it was decided to concentrate further only on genes that are specifically up‐regulated and on those thought to have a particular role in relation to neuronal differentiation. Four genes were thus of particular interest. NPY and MMP12 were significantly up‐regulated in both treatment conditions, 5‐HT2B was significantly up‐regulated in Aβ1–40‐treated cells only, and Wisp1 was significantly up‐regulated in Aβ1–42‐treated cells only. All four of these genes have been implicated in other studies, in regulating neuroproliferation or neurogenesis (19, 20, 28, 29, 30, 31, 32, 33).
Quantitative real‐time PCR analysis was used to validate the microarray data and confirmed that levels of NPY, 5‐HT2B and MMP12 were significantly increased by Aβ treatment. We failed to confirm up‐regulation of Wisp1 in this quantitative analysis (Fig. 5f). Subsequent Western blot analysis confirmed expression at the protein level for both NPY and MMP12 (Fig. 5g). Recent studies have demonstrated that NPY regulates neuronal precursor proliferation in the adult mammal via an effect on the GPCR, NPY1R (19, 20). To explore if neuronal differentiation in our cultures was NPY1R‐mediated, immunoblot analysis was performed using antibodies raised to the N and C‐terminal proteins. The results also confirmed an increase in expression of NPY1R, most marked in Aβ1–42‐treated BM‐MSC. Furthermore, we used quantitative real‐time PCR analysis in NPY‐deficient mice to identify the potential role of NPY in the BM‐MSC by the Aβ treatments. Levels of GFAP, Oligo1 and Pax6 were decreased compared to control mice (Fig. 5m). Results for protein expression of 5‐HT2B, also a GPCR, were equivocal, but immunocytochemical analysis is suggestive of an increase in expression in response to Aβs compared to control cells (Fig. 5g and Fig. S6, Supporting Information).
Recent experimental data have linked early cognitive decline in AD to deleterious effects of Aβ on dynamin 1 degradation (10), where dynamin is a GTPase implicated in internalization of GPCR (11). Since 5‐HT2B and NPY1R are GPCRs, we were interested to understand whether Aβ treatment also influenced dynamin expression in our BM‐MSC. The results demonstrate an increase in expression of both dynamin 1 and 2 in response to Aβs (Fig. 5h–k) together with an increase in protein expression in treated cells compared to control (Fig. 5l).
The ability of Aβs to induce neuronal differentiation is mediated by PI(3)K‐dependent activation of ERK1/2
Previous studies have demonstrated that NPY can increase neuronal precursor cell proliferation, and MMP12 has been implicated in control of cell proliferation and migration in the developing mouse brain. Current evidence suggests that downstream cell signalling pathway for both these proteins is mediated through ERK1/2‐MAPK (19, 34); 5‐HT2B stimulation, coincidentally, results in activation of the same pathway (30, 31). In order to elucidate further the possible signal transduction pathways mediating Aβ‐induced neuronal differentiation in our system, we used several direct or indirect inhibitors of the ERK1/2‐MAPK pathway. Incubation of cells with 20 µm U0126, a selective inhibitor of MEK1/2, blocked Aβ‐mediated increase in a percentage of neurons (Fig. 6a,b). To confirm this pathway, we also treated cells with 100 µm PD98059, a highly selective potent MEK inhibitor, producing an identical result (Fig. S7, Supporting Information).
Figure 6.
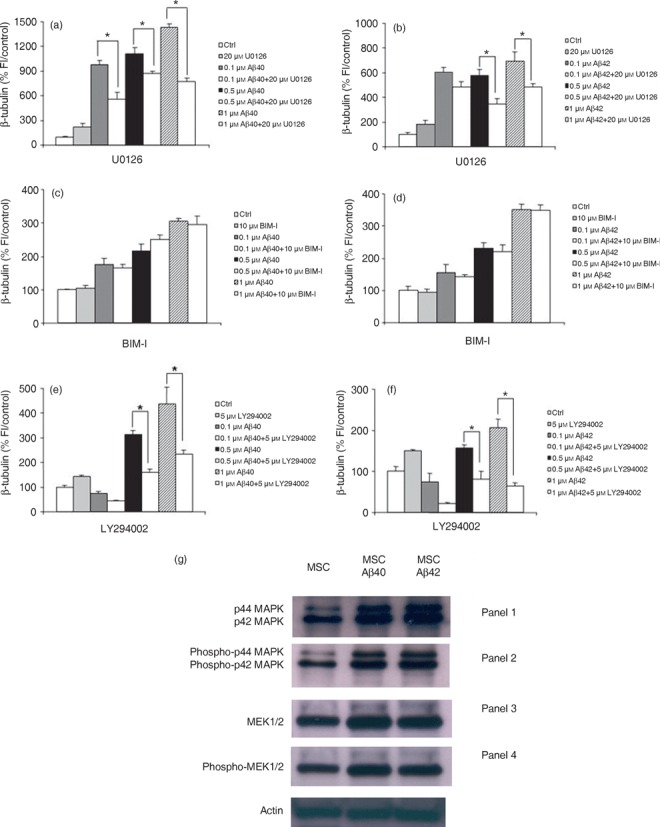
Neuronal differentiation induced by amyloid beta (Aβ) is mediated by ERK1/2 via upstream activation of the PI(3)K‐dependent pathway. Bone marrow‐derived mesenchymal stem cells (BM‐MSC) were treated with aggregated Aβs in the presence or absence of U0126, bisindolylmaleimide I or LY294002. (a,b) MEK blockade with U0126 abolishes Aβ‐induced neuronal differentiation as determined by a decrease in expression of the neuronal marker β‐tubulin. (c,d) Aβs do not induce neuronal differentiation through the protein kinase C pathway. Co‐incubation of cultures for 5 days with Aβ peptides in the presence of the highly specific protein kinase C inhibitor BIM‐1 has no effect on the Aβ‐induced increase in neuronal number. (e,f) PI(3)K mediates the Aβ effect. Co‐incubation of cells for 5 days with Aβs in the presence of 5 µm LY294002 which specifically blocks PI(3)K completely abolished the ability of Aβ to induce neuronal differentiation. The graphs show one representative experiment of between three and four different experiments done in quadruplicate. *P < 0.0001, relative to control. (g) Representative Western blot analysis to examine activation of enzymes in the ERK1/2 signalling pathway using antibodies to endogenous non‐phosphorylated and phosphorylated forms of ERK1/2 (MAP kinase) and MEK1/2. (Panel 1) p44/42 MAP Kinase antibody detects endogenous levels of total ERK1/2 (MAP kinase) protein and shows an increase in expression in treated cells compared to controls. (Panel 2) Lanes 2 and 3 demonstrate that there is an increase in phosphorylated forms of p42/44 MAPK compared to untreated cells with addition of Aβ peptide as detected by phospho‐42/44 MAP kinase antibody. This antibody detects endogenous levels of p42 and p44 ERK1/2 (MAP kinase) when phosphorylated at threonine and tyrosine residues. (Panel 3) Endogenous MEK1/2 detected by the MEK1/2 antibody (Panel 4) confirms an increase in phosphorylated enzyme, phospho‐MEK1/2 compared to untreated cells in response to Aβ treatment.
The ERK1/2 pathway is regulated upstream by a variety of kinases such as PI(3)K and protein kinase C (35). Incubation of BM‐MSCs in 10 µm bisindolylmaleimide I, which specially inhibits protein kinase C, did not abolish the effect of Aβs on neuronal differentiation (Fig. 6c,d). However, treatment with the PI(3)K inhibitor, LY294002, at 5 µm inhibited the Aβ‐induced increase in neurons at both 0.5 and 1 µm Aβ (Fig. 6e,f). Furthermore, genistein, a general tyrosine kinase inhibitor, did not block the ability of Aβs to increase neuronal number (Fig. S7). These results indicate that Aβs regulate neurogenesis of BM‐MSC in vitro by up‐regulation of GPCR and the genes encoding them, and this is mediated by activation of ERK1/2 through the PI(3)K‐dependent pathway.
Endogenous ERKs require phosphorylation by MAPK/ERK kinases or MEKs. MEKs are themselves activated by phosphorylation at serine residues (36, 37). Thus, Western blot analysis was undertaken using antibodies to endogenous non‐phosphorylated and phosphorylated forms of ERK1/2 and MEK1/2 to determine whether these enzymes show specific activation via phosphorylation in response to Aβ treatment. Figure 6g shows that there was an increase in enzyme phosphorylation under the influence of Aβ treatment for p42/44MAPK and MEK1/2 compared to control cells. These results confirm the inhibitor data above and lend further weight to the conclusion that the mechanism of neuronal differentiation is mediated by a signal transduction pathway that includes MEK1/2 and ERK1/2.
Discussion
Preliminary experimental treatments for AD have included attempts to disrupt amyloidogenesis in human patients, by using immunotherapy (38). Increasing knowledge of the pathogenicity in AD now reveals that, most likely, multiple conformations of Aβ, including soluble oligomeric forms, contribute to neurotoxic damage by non‐overlapping mechanisms (9). Cell replacement strategies for AD ultimately offer the prospect of replacing damaged cells or protecting damaged neurons by delivery of essential gene products. However, the likely success of such therapies will be determined, in part, by reciprocal interaction between the toxic host microenvironment and replacement cell survival/plasticity.
BM‐MSCs have been used extensively in successful intracerebral engraftment strategies in animal models of neurological disease, but not in AD (3, 4, 5, 39). Our focus of interest is in understanding the synergistic relationship between host and graft in order to better predict therapeutic success in human patients. In the present study, we used in vitro culture of BM‐MSCs as an experimental paradigm to demonstrate that aggregated Aβs containing both oligomeric and fibrillar forms promote BM‐MSC plasticity by inducing neuronal differentiation. The underlying mechanism involves up‐regulation of GPCR and the genes encoding them and is mediated downstream by activation of the ERK1/2‐MAPK signalling pathway.
Other authors have examined interaction between Aβ and stem cells. Our findings are supported by those of López‐Toledano and Shelanski, who isolated neural stem cells from the hippocampi of postnatal day 0 mice or striata from embryonic day 15 rats and demonstrated a neurogenic effect with Aβ1–42 oligomers but not fibrils (17). In their study, similarly, activation of the ERK signalling pathway was confirmed, however, dissimilarly, inhibition of PI(3)K, did not abolish the neurogenic effect. These results suggest that neuronal differentiation of stem cells may be activated through a shared final common path but that upstream cell signalling is unique between each cell type. Unlike the study by López‐Toledano and Shelanski, our study uniquely showed that for BM‐MSC, aggregated Aβ1–40 also induced neuronal differentiation and this result may be attributable to a difference in the cell type used.
Deshpande et al. have previously demonstrated that the conformational state of Aβ plays a significant role in neurotoxicity and that oligomeric forms are especially implicated (10). Using a different protocol for enrichment, these authors showed that oligomeric forms of Aβ peptides produced massive neuronal cell death in human cortical neurons and this was a concentration‐dependent effect. Interestingly, however, at low concentration, the neurotoxic effect was minimal.
Fibrillization of Aβ is preceded by multiple conformational changes collectively known as Aβ‐derived diffusible ligands (40), oligomers‐composed of 15–20 monomers (41), protofibrils (42), and dodecameric oligomers Aβ*56 (43). These intermediate Aβ species are collectively known as ‘soluble Aβ’. Soluble forms of Aβ are known to correlate with severity of cognitive impairment in AD patients, suggesting that oligomeric forms are the primary toxic species (9). In our study, we were interested in knowing which of the oligomeric and fibrillar forms in the aggregated preparations of Aβ is the active species in inducing neuronal differentiation. We prepared both non‐aggregated and aggregated Aβ and enriched both for oligomeric and fibrillar forms using an established method. Non‐aggregated preparations produced no differentiation of BM‐MSC. Of the enriched preparations, only Aβ1–42 containing soluble oligomeric forms replicated the ability to induce neuronal differentiation, suggesting that the oligomeric form within the preparation is the active species.
Previous studies have demonstrated that despite applying oligomer‐ and fibril‐forming conditions to Aβ1–40, it remains primarily as unassembled monomeric peptide with only sparse oligomeric species and protofibrils (22). These results may account for the inability of enriched oligomeric Aβ1–40 to produce a differentiating effect. In summary, our findings suggest that the neurogenic effect of Aβ is dependent on the state of aggregation of Aβ , most particularly, on the generation of oligomeric forms.
BM‐MSCs have the potential to develop into cells with multiple lineages and can be rapidly induced in vitro to differentiate into neurons (1, 2, 44). Microarray analysis of naive BM‐MSC has identified expression of mRNAs and proteins typically associated with neuronal cells and microenvironment is substantially influential in driving differentiation down the neuronal pathway (45). Increase in the number of new neurons over baseline controls in response to Aβ treatment in the absence of increase in cell proliferation or cell death in our experiments suggests that Aβ is acting on neuronal‐type progenitors within this population, driving them towards a neuronal phenotype. Since 6E10, an Aβ antibody, could abolish the Aβ‐induced neurogenic response, it is unlikely to be due to cell death/damage signals or release of diffusible factors or trophic factors (46) and supports the suggestion that Aβ itself is the active agent.
Using gene microarray and protein expression analysis, we observed up‐regulation of MMP12, the neurotransmitter NPY, and GPCR NPY1R and 5‐HT2B, although the latter could not be confirmed by Western blot analysis. NPY is a neurotransmitter released by interneurons in the dentate gyrus. Previous studies have demonstrated that NPY is a specific neuroproliferative factor for hippocampal neurogenesis mediating its effect through the GPCR NPY1R and by activation of ERK1/2 (20, 21). 5‐HT2B also belongs to the GPCR family. The signal transduction pathways activated downstream of 5‐HT2B include Ras and ERK12 pathways (30, 31). MMP12 is constitutively expressed in the developing mouse brain and is involved in cell migration. In vitro studies have demonstrated its expression in oligodendrocytes in large amounts, and that this expression correlates with periods of process extension and oligodendrocyte maturation (32). Therefore, one explanation for the expression of MMP12 expressed in our treated BM‐MSC cultures is that it arises directly from oligodendrocyte‐like cells induced by Aβ.
Our experiments, using specific inhibitors of the ERK1/2 and MEK1/2 signalling pathway, confirmed that NPY, most likely acting via the NPY1R receptor, and 5‐HT2B and MMP12 exert their influence by downstream activation of MEK1/2 and ERK1/2 in Aβ‐treated BM‐MSC. Inhibition of neurogenesis with LY294002 suggests that PI(3)K is directly involved in this process. This contrasts with in vivo experiments in the mouse where NPY induces neuronal precursor proliferation by upstream protein kinase C‐dependent activation of ERK1/2 (19). These results suggest that Aβ‐directed neuronal differentiation of BM‐MSC may be mediated by a unique mechanism.
Finally, of particular interest in the light of findings from other authors is the further observation, demonstrated here, that expression of dynamin 1 and 2 is increased in response to Aβ treatment in BM‐MSC. Dynamin has a clear role in mediating GPCR internalization (11) and Aβ‐induced dynamin 1 degradation has been implicated in synaptic dysfunction and early cognitive decline in AD (10). Increased expression of dynamin 1 (and 2) demonstrated here is thus consistent with up‐regulation of the GPGR NPY1R, perhaps indicating increase in receptor‐mediated endocytosis in response to Aβ in the cultures. NPY is known to attenuate learning impairment (19, 20), and dynamin is linked to a role in learning and synaptic plasticity via its binding to Arc/Arg3.1 (10, 47).
This work lends support to the idea that in AD, the pathophysiological environment may significantly influence stem cell neuroplasticity and that specific genes, NPY and dynamin associated with GPCR signalling may be responsible. Additional studies are required to understand more fully the nature of the interaction between Aβ, GPCR and intracellular signalling pathways together with functional assessment to determine if Aβ‐treated BM‐MSCs have physiological characteristics of mature central nervous system neurons. Exploitation of such knowledge brings with it the possibility of manipulating BM‐MSC fates via Aβ peptide‐responsive, neuronal‐modulation to prevent cognitive decline, disrupt amyloidogenesis and protect against neuronal damage in AD patients.
Supporting information
Figure S1. Representative immunocytochemical staining showing increased expression of the target neuronal markers (β‐tubulin and GFAP) in response to treatment with Aβ1–40 and 42 compared to control.
Figure S2. Quantitative real‐time PCR demonstrating neuronal‐specific up‐regulation of GLAST, Oligo1 and Pax6 genes in response to Aβ treatment. *P < 0.0001, relative to control.
Figure S3. To determine the effect of Aβ peptides in inducing neuronal differentiation of BM‐MSCs, varying concentrations of non‐aggregated and aggregated Aβ25–35 peptide were added at 2 dpp, and cells immunostained with antibodies to (a) β‐tubulin (b) NeuN or (c) GFAP between 1 and 5 days post‐treatment. No increase in expression of neuronal markers was detected under any treatment condition.
Figure S4. To determine the effect of non‐aggregated forms of the Aβ peptides in inducing neuronal differentiation, varying concentrations of Aβ1–42 and Aβ1–40 were added at 2 dpp and cells immunostained with antibodies to (a,d) β‐tubulin III (b,e) NeuN or (c,f) GFAP between 1 and 5 days post‐treatment. Non‐aggregated forms of Aβs did not produce increased expression of any neuronal marker under any treatment condition.
Figure S5. Neuronal differentiation of BM‐MSC is an Aβ‐specific effect. CM was obtained from BM‐MSCs treated with or without 5 µM aggregated Aβs for 5 days starting at 2 dpp. (a,c) Under these conditions, as expected, 5 µM Aβ1–40 and 1–42 peptides induced an increase in the number of cells expressing the neuronal marker NeuN. CM was added to untreated 2 dpp cultures either in the presence or absence of 6E10 antibody. Cells were fixed for immunostaining after 5 days. These results demonstrate that only the CM produced by (b) Aβ1–40 – stimulated or (d) β1–42 – stimulated BM‐MSC produced a specific increase in neurogenesis (P < 0.0001). Addition of anti‐Aβ antibody blocked this increase, suggesting that the CM‐induced neuronal differentiation was caused by residual Aβs in the CM and that the neuronal differentiation induced by Aβs is a direct effect on the BM‐MSCs.
Figure S6. Immunofluorescent staining of Aβ‐treated BM‐MSC with polyclonal anti‐SR‐2B for 5‐HT2B. 5 µM Aβ1–40 and 1–42 showing general increase in cytoplasmic staining. Scale bar = 100 µm.
Figure S7. Aβ‐induced neuronal differentiation is mediated by ERK1/2 but not by tyrosine protein kinase signalling. BM‐MSCs were treated at 2 dpp for 5 days at different concentrations (0.1–1 µM) of aggregated Aβs in the presence or absence of PD98059 or Genistein. (a,b) MEK blockade with PD98059 abolishes Aβ‐induced neuronal differentiation as determined by a decrease in expression of the neuronal marker β‐tubulin. Incubation with 100 µM PD98059 alone produced no effect on neuronal cell number. (c,d) Tyrosine protein kinase inhibition does not alter the Aβ‐induced increase in neuronal markers. Five days co‐incubation of BM‐MSC with Aβs in the presence of the tyrosine protein kinase inhibitor, genistein does not block the Aβ‐induced neurogenic effect. The graphs show one representative experiment of between three and four different experiments done in quadruplicate. *P < 0.0001, relative to control.
Please note: Wiley‐Blackwell are not responsible for the content or functionality of any supporting materials supplied by the authors. Any queries (other than missing material) should be directed to the corresponding author for the article.
Supporting info item
Acknowledgements
Our work in this field is supported by the Big Lottery Fund in association with the Alzheimer's Society and Alzheimer's Research Trust (to J.E.C.). In addition, it was partially supported by a grant (SC4170) from Stem Cell Research Center of the 21st Century Frontier Research Program funded by the Ministry of Science and Technology, Republic of Korea (to H.K.J.). We would like to thank the Alzheimer's Disease Society QRD monitors Peter Dwyte, Ian Munroe, Meg Gilpin and Aubrey Milstein for their support.
References
- 1. Jiang Y, Jahagirdar BN, Reinhardt RL, Schwartz RE, Keene CD, Ortiz‐Gonzalez XR, Reyes M, Lenvik T, Lund T, Blackstad M, Du J, Aldrich S, Lisberg A, Low WC, Largaespada DA, Verfaillie CM (2002) Pluripotency of mesenchymal stem cells derived from adult marrow. Nature 418, 41–49. [DOI] [PubMed] [Google Scholar]
- 2. Prockop D (1997) Marrow stromal cells as stem cells for nonhematopoietic tissues. Science 276, 71–74. [DOI] [PubMed] [Google Scholar]
- 3. Jin HK, Carter JE, Huntley GW, Schuchman EH (2002) Intracerebral transplantation of mesenchymal stem cells into acid sphingomyelinase‐deficient mice delays the onset of neurological abnormalities and extends their life span. J. Clin. Invest. 109, 1183–1191. [DOI] [PMC free article] [PubMed] [Google Scholar]
- 4. Bae JS, Furuya S, Shinoda Y, Endo S, Schuchman EH, Hirabayashi Y, Jin HK (2005) Neurodegeneration augments the ability of bone marrow‐derived mesenchymal stem cells to fuse with Purkinje neurons in Niemann‐Pick type C mice. Hum. Gene Ther. 16, 1006–1011. [DOI] [PubMed] [Google Scholar]
- 5. Bae JS, Han HS, Youn DH, Carter JE, Modo M, Schuchman EH, Jin HK (2007) Bone marrow‐derived mesenchymal stem cells promote neuronal networks with functional synaptic transmission after transplantation into mice with neurodegeneration. Stem Cells 25, 1307–1316. [DOI] [PubMed] [Google Scholar]
- 6. Miyahara Y, Nagaya N, Kataoka M, Yanagawa B, Tanaka K, Hao H, Ishino K, Ishida H, Shimizu T, Kangawa K, Sano S, Okano T, Kitamura S, Mori H (2006) Monolayered mesenchymal stem cells repair scarred myocardium after myocardial infarction. Nat. Med. 12, 459–465. [DOI] [PubMed] [Google Scholar]
- 7. Hardy J, Selkoe DJ (2002) The amyloid hypothesis of Alzheimer's disease: progress and problems on the road to therapeutics. Science 297, 353–356. [DOI] [PubMed] [Google Scholar]
- 8. Mattson MP (2004) Pathways towards and away from Alzheimer's disease. Nature 430, 631–639. [DOI] [PMC free article] [PubMed] [Google Scholar]
- 9. Deshpande A, Mina E, Glabe C, Busciglio J (2006) Different conformations of amyloid beta induce neurotoxicity by distinct mechanisms in human cortical neurons. J. Neurosci. 26, 6011–6018. [DOI] [PMC free article] [PubMed] [Google Scholar]
- 10. Kelly BL, Vassar R, Ferreira A (2005) β‐Amyloid‐induced dynamin 1 depletion in hippocampal neurons. A potential mechanism for early cognitive decline in Alzheimer disease. J. Biol. Chem. 280, 31746–31753. [DOI] [PMC free article] [PubMed] [Google Scholar]
- 11. Zhang J, Ferguson SS, Barak LS, Menard L, Caron MG (1996) Dynamin and β‐arrestin reveal distinct mechanisms for G protein‐coupled receptor internalization. J. Biol. Chem. 271, 18302–18305. [DOI] [PubMed] [Google Scholar]
- 12. Ni Y, Zhao X, Bao G, Zou L, Teng L, Wang Z, Song M, Xiong J, Bai Y, Pei G (2006) Activation of β2‐adrenergic receptor stimulates gamma‐secretase activity and accelerates amyloid plaque formation. Nat. Med. 12, 1390–1396. [DOI] [PubMed] [Google Scholar]
- 13. Kerokoski P, Soininen H, Pirttila T (2001) β‐Amyloid (1–42) affects MTT reduction in astrocytes: implications for vesicular trafficking and cell functionality. Neurochem. Int. 38, 127–134. [DOI] [PubMed] [Google Scholar]
- 14. Luo Y, Sunderland T, Roth GS, Wolozin B (1996) Physiological levels of β‐amyloid peptide promote PC12 cell proliferation. Neurosci. Lett. 217, 125–128. [PubMed] [Google Scholar]
- 15. Korotzer AR, Pike CJ, Cotman CW (1993) β‐Amyloid peptides induce degeneration of cultured rat microglia. Brain Res. 624, 121–125. [DOI] [PubMed] [Google Scholar]
- 16. Haughey NJ, Liu D, Nath A, Borchard AC, Mattson MP (2002) Disruption of neurogenesis in the subventricular zone of adult mice, and in human cortical neuronal precursor cells in culture, by amyloid β‐peptide: implications for the pathogenesis of Alzheimer's disease. Neuromolecular Med. 1, 125–135. [DOI] [PubMed] [Google Scholar]
- 17. López‐Toledano MA, Shelanski ML (2004) Neurogenic effect of β‐amyloid peptide in the development of neural stem cells. J. Neurosci. 24, 5439–5444. [DOI] [PMC free article] [PubMed] [Google Scholar]
- 18. Kwak YD, Brannen CL, Qu T, Kim HM, Dong X, Soba P, Majumdar A, Kaplan A, Beyreuther K, Sugaya K (2006) Amyloid precursor protein regulates differentiation of human neural stem cells. Stem Cells Dev. 15, 381–389. [DOI] [PubMed] [Google Scholar]
- 19. Hansel DE, Eipper BA, Ronnett GV (2001) Neuropeptide Y functions as a neuroproliferative factor. Nature 410, 940–944. [DOI] [PubMed] [Google Scholar]
- 20. Howell OW, Doyle K, Goodman JH, Scharfman HE, Herzog H, Pringle A, Beck‐Sickinger AG, Gray WP (2005) Neuropeptide Y stimulates neuronal precursor proliferation in the post‐natal and adult dentate gyrus. J. Neurochem. 93, 560–570. [DOI] [PubMed] [Google Scholar]
- 21. Dahlgren KN, Manelli AM, Stine WB Jr, Baker LK, Krafft GA, LaDu MJ (2002) Oligomeric and fibrillar species of amyloid‐β peptides differentially affect neuronal viability. J. Biol. Chem. 277, 32046–32053. [DOI] [PubMed] [Google Scholar]
- 22. Georgakis GV, Li Y, Humphreys R, Andreeff M, O’Brien S, Younes M, Carbone A, Albert V, Younes A (2005) Activity of selective fully human agonistic antibodies to the TRAIL death receptors TRAIL‐R1 and TRAIL‐R2 in primary and cultured lymphoma cells: induction of apoptosis and enhancement of doxorubicin‐ and bortezomib‐induced cell death. Br. J. Haematol. 130, 501–510. [DOI] [PubMed] [Google Scholar]
- 23. Basheer R, Arrigoni E, Thatte HS, Greene RW, Ambudkar IS, McCarley RW (2002) Adenosine induces inositol 1,4,5‐trisphosphate receptor‐mediated mobilization of intracellular calcium stores in basal forebrain cholinergic neurons. J. Neurosci. 22, 7680–7686. [DOI] [PMC free article] [PubMed] [Google Scholar]
- 24. Lazarov O, Robinson J, Tang YP, Hairston IS, Korade‐Mirnics Z, Lee VM, Hersh LB, Sapolsky RM, Mirnics K, Sisodia SS (2005) Environmental enrichment reduces Aβ levels and amyloid deposition in transgenic mice. Cell 120, 701–713. [DOI] [PubMed] [Google Scholar]
- 25. Deng J, Petersen BE, Steindler DA, Jorgensen ML, Laywell ED (2006) Mesenchymal stem cells spontaneously express neural proteins in culture and are neurogenic after transplantation. Stem Cells 24, 1054–1064. [DOI] [PubMed] [Google Scholar]
- 26. Chen Y, Teng FY, Tang BL (2006) Coaxing bone marrow stromal mesenchymal stem cells towards neuronal differentiation: progress and uncertainties. Cell. Mol. Life Sci. 63, 1649–1657. [DOI] [PMC free article] [PubMed] [Google Scholar]
- 27. Gong Y, Chang L, Viola KL, Lacor PN, Lambert MP, Finch CE, Krafft GA, Klein WL (2003) Alzheimer's disease‐affected brain: presence of oligomeric Aβ ligands (ADDLs) suggests a molecular basis for reversible memory loss. Proc. Natl. Acad. Sci. USA 100, 10417–10422. [DOI] [PMC free article] [PubMed] [Google Scholar]
- 28. Amoyel M, Cheng YC, Jiang YJ, Wilkinson DG (2005) Wnt1 regulates neurogenesis and mediates lateral inhibition of boundary cell specification in the zebrafish hindbrain. Development 132, 775–785. [DOI] [PubMed] [Google Scholar]
- 29. Fiorica‐Howells E, Maroteaux L, Gershon MD (2000) Serotonin and the 5‐HT (2B) receptor in the development of enteric neurons. J. Neurosci. 20, 294–305. [DOI] [PMC free article] [PubMed] [Google Scholar]
- 30. Launay JM, Birraux G, Bondoux D, Callebert J, Choi DS, Loric S, Maroteaux L (1996) Ras involvement in signal transduction by the serotonin 5‐HT2B receptor. J. Biol. Chem. 271, 3141–3147. [DOI] [PubMed] [Google Scholar]
- 31. Nebigil CG, Launay JM, Hickel P, Tournois C, Maroteaux L (2000) 5‐Hydroxytryptamine 2B receptor regulates cell‐cycle progression: cross‐talk with tyrosine kinase pathways. Proc. Natl. Acad. Sci. USA 97, 2591–2596. [DOI] [PMC free article] [PubMed] [Google Scholar]
- 32. Larsen PH, Yong VW (2004) The expression of matrix metalloproteinase‐12 by oligodendrocytes regulates their maturation and morphological differentiation. J. Neurosci. 24, 7597–7603. [DOI] [PMC free article] [PubMed] [Google Scholar]
- 33. Larsen PH, DaSilva AG, Conant K, Yong VW (2006) Myelin formation during development of the CNS is delayed in matrix metalloproteinase‐9 and ‐12 null mice. J. Neurosci. 26, 2207–2214. [DOI] [PMC free article] [PubMed] [Google Scholar]
- 34. Alexander JP, Acott TS (2003) Involvement of the Erk‐MAP kinase pathway in TNFα regulation of trabecular matrix metalloproteinases and TIMPs. Invest. Ophthalmol. Vis. Sci. 44, 164–169. [DOI] [PubMed] [Google Scholar]
- 35. Chang L, Karin M (2001) Mammalian MAP kinase signalling cascades. Nature 410, 37–40. [DOI] [PubMed] [Google Scholar]
- 36. Seger R, Krebs EG (1995) The MAPK signaling cascade. FASEB J. 9, 726–735. [PubMed] [Google Scholar]
- 37. Zanke BW, Rubie EA, Winnett E, Chan J, Randall S, Parsons M, Boudreau K, McInnis M, Yan M, Templeton DJ, Woodgett JR (1996) Mammalian mitogen‐activated protein kinase pathways are regulated through formation of specific kinase‐activator complexes. J. Biol. Chem. 271, 29876–29881. [DOI] [PubMed] [Google Scholar]
- 38. Schenk D (2002) Amyloid‐β immunotherapy for Alzheimer's disease: the end of the beginning. Nat. Rev. Neurosci. 3, 824–828. [DOI] [PubMed] [Google Scholar]
- 39. Lindvall O, Kokaia Z (2006) Stem cells for the treatment of neurological disorders. Nature 441, 1094–1096. [DOI] [PubMed] [Google Scholar]
- 40. Lambert MP, Barlow AK, Chromy BA, Edwards C, Freed R, Liosatos M, Morgan TE, Rozovsky I, Trommer B, Viola KL, Wals P, Zhang C, Finch CE, Krafft GA, Klein WL (1998) Diffusible, nonfibrillar ligands derived from Aβ1–42 are potent central nervous system neurotoxins. Proc. Natl. Acad. Sci. USA 95, 6448–6453. [DOI] [PMC free article] [PubMed] [Google Scholar]
- 41. Kayed R, Head E, Thompson JL, McIntire TM, Milton SC, Cotman CW, Glabe CG (2003) Common structure of soluble amyloid oligomers implies common mechanism of pathogenesis. Science 300, 486–489. [DOI] [PubMed] [Google Scholar]
- 42. Nguyen HD, Hall CK (2004) Molecular dynamics simulations of spontaneous fibril formation by random‐coil peptides. Proc. Natl. Acad. Sci. USA 101, 16180–16185. [DOI] [PMC free article] [PubMed] [Google Scholar]
- 43. Lesne S, Koh MT, Kotilinek L, Kayed R, Glabe CG, Yang A, Gallagher M, Ashe KH (2006) A specific amyloid‐β protein assembly in the brain impairs memory. Nature 440, 352–357. [DOI] [PubMed] [Google Scholar]
- 44. Pittenger MF, Mackay AM, Beck SC, Jaiswal RK, Douglas R, Mosca JD, Moorman MA, Simonetti DW, Craig S, Marshak DR (1999) Multilineage potential of adult human mesenchymal stem cells. Science 284, 143–147. [DOI] [PubMed] [Google Scholar]
- 45. Egusa H, Schweizer FE, Wang CC, Matsuka Y, Nishimura I (2005) Neuronal differentiation of bone marrow‐derived stromal stem cells involves suppression of discordant phenotypes through gene silencing. J. Biol. Chem. 280, 23691–23697. [DOI] [PubMed] [Google Scholar]
- 46. Ourednik V, Ourednik J (2004) Multifaceted dialogue between graft and host in neurotransplantation. J. Neurosci. Res. 76, 193–204. [DOI] [PubMed] [Google Scholar]
- 47. Tzingounis AV, Nicoll RA (2006) Arc/Arg3.1: linking gene expression to synaptic plasticity and memory. Neuron 52, 403–407. [DOI] [PubMed] [Google Scholar]
Associated Data
This section collects any data citations, data availability statements, or supplementary materials included in this article.
Supplementary Materials
Figure S1. Representative immunocytochemical staining showing increased expression of the target neuronal markers (β‐tubulin and GFAP) in response to treatment with Aβ1–40 and 42 compared to control.
Figure S2. Quantitative real‐time PCR demonstrating neuronal‐specific up‐regulation of GLAST, Oligo1 and Pax6 genes in response to Aβ treatment. *P < 0.0001, relative to control.
Figure S3. To determine the effect of Aβ peptides in inducing neuronal differentiation of BM‐MSCs, varying concentrations of non‐aggregated and aggregated Aβ25–35 peptide were added at 2 dpp, and cells immunostained with antibodies to (a) β‐tubulin (b) NeuN or (c) GFAP between 1 and 5 days post‐treatment. No increase in expression of neuronal markers was detected under any treatment condition.
Figure S4. To determine the effect of non‐aggregated forms of the Aβ peptides in inducing neuronal differentiation, varying concentrations of Aβ1–42 and Aβ1–40 were added at 2 dpp and cells immunostained with antibodies to (a,d) β‐tubulin III (b,e) NeuN or (c,f) GFAP between 1 and 5 days post‐treatment. Non‐aggregated forms of Aβs did not produce increased expression of any neuronal marker under any treatment condition.
Figure S5. Neuronal differentiation of BM‐MSC is an Aβ‐specific effect. CM was obtained from BM‐MSCs treated with or without 5 µM aggregated Aβs for 5 days starting at 2 dpp. (a,c) Under these conditions, as expected, 5 µM Aβ1–40 and 1–42 peptides induced an increase in the number of cells expressing the neuronal marker NeuN. CM was added to untreated 2 dpp cultures either in the presence or absence of 6E10 antibody. Cells were fixed for immunostaining after 5 days. These results demonstrate that only the CM produced by (b) Aβ1–40 – stimulated or (d) β1–42 – stimulated BM‐MSC produced a specific increase in neurogenesis (P < 0.0001). Addition of anti‐Aβ antibody blocked this increase, suggesting that the CM‐induced neuronal differentiation was caused by residual Aβs in the CM and that the neuronal differentiation induced by Aβs is a direct effect on the BM‐MSCs.
Figure S6. Immunofluorescent staining of Aβ‐treated BM‐MSC with polyclonal anti‐SR‐2B for 5‐HT2B. 5 µM Aβ1–40 and 1–42 showing general increase in cytoplasmic staining. Scale bar = 100 µm.
Figure S7. Aβ‐induced neuronal differentiation is mediated by ERK1/2 but not by tyrosine protein kinase signalling. BM‐MSCs were treated at 2 dpp for 5 days at different concentrations (0.1–1 µM) of aggregated Aβs in the presence or absence of PD98059 or Genistein. (a,b) MEK blockade with PD98059 abolishes Aβ‐induced neuronal differentiation as determined by a decrease in expression of the neuronal marker β‐tubulin. Incubation with 100 µM PD98059 alone produced no effect on neuronal cell number. (c,d) Tyrosine protein kinase inhibition does not alter the Aβ‐induced increase in neuronal markers. Five days co‐incubation of BM‐MSC with Aβs in the presence of the tyrosine protein kinase inhibitor, genistein does not block the Aβ‐induced neurogenic effect. The graphs show one representative experiment of between three and four different experiments done in quadruplicate. *P < 0.0001, relative to control.
Please note: Wiley‐Blackwell are not responsible for the content or functionality of any supporting materials supplied by the authors. Any queries (other than missing material) should be directed to the corresponding author for the article.
Supporting info item