

Abstract
Abstract. Objective: The aim of this study was to establish a preclinical mouse model to study metastases of paediatric rhabdomyosarcoma at the macroscopic and cellular levels, with different imaging methods. Experimental Design: The alveolar rhabdomyosarcoma cell line Rh30 was stably transfected with the red fluorescent protein (DsRed2) then was xenotransplanted (intravenous injection [n = 8], and footpad injection [n = 8]) into nude mice (NMRI nu/nu). Macroscopic imaging of metastases was performed using DsRed2‐fluorescence and flat‐panel volumetric computed tomography scan. In a further series of animals (n = 8), in vivo cell trafficking of rhabdomyosarcoma cells using cellular imaging with an Olympus OV100 variable‐magnification small‐animal imaging system was used. Results: Metastases in the pelvis, thoracic wall and skin were visualized by fluorescence imaging. Pelvic metastases were found after tail vein injection and at other metastatic sites after footpad injection. Flat‐panel volumetric computed tomography scan data allowed highly specific analysis of contrast between tumour and surrounding tissue. Correlation between fluorescence and flat‐panel volumetric computed tomography scan imaging data was observed. Single‐cell imaging visualized tumour cells in the vessels and demonstrated the arrest of tumour cells at vessel junctions followed by extravasation of the tumour cells. Conclusion: We established a model for visualization of experimental metastatic invasion and describe relevant tools for imaging childhood rhabdomyosarcoma metastases at the macroscopic and cellular levels. Imaging of cell trafficking visualized the behaviour of tumour cells and development of metastases by accumulation and extravasation of rhabdomyosarcoma cells.
INTRODUCTION
Rhabdomyosarcoma (RMS) is the most common paediatric soft tissue sarcoma. Approximately two thirds of all sarcomas and 7–8% of all solid malignant tumours in children are RMS (McDowell 2003). The two main histopathological subtypes of this malignancy in children are embryonal and alveolar RMS (Pappo et al. 1995). Prognosis of this malignancy is still poor and patients’ likelihood of survival depends on localization of the primary lesion (Cocker et al. 2000; Christ et al. 2001), histological subtype (Newton et al. 1995; Cocker et al. 2000), stage of disease (Lawrence et al. 1997; Cocker et al. 2000), and the age at diagnosis (Crist et al. 1990; Cocker et al. 2000). A common problem in this disease is metastatic invasion and local tumour recurrence. Metastatic invasion more commonly occurs in the alveolar subtype (Koscielniak et al. 2002).
Several models have been described for investigation of RMS in vitro and in vivo. However, investigations on behaviour and development of metastases are limited due to a lack of early stage visualization of the tumour cells. We have previously described that imaging of RMS xenografts using red fluorescent protein (DsRed2)‐fluorescence is feasible in nude mice and allows real‐time tracking of tumour growth. Additionally, we showed that transfection of those tumour cells with DsRed2 had no impact on the behaviour of these cells concerning cell growth, histology, viability and cytogenetics (Seitz et al. 2006).
In the present study, we investigated the feasibility of in vivo detection of RMS metastases using DsRed2. Furthermore, we demonstrated vascularization of the tumours with other novel imaging techniques such as flat panel volumetric computed tomography scan (fpVCT). Finally, using fluorescent cancer cells and the highly sensitive Olympus OV100 small‐animal imaging system, we visualized real‐time tumour cell trafficking in live mice in order to visualize tumour cell migration in the vasculature, cell accumulation and extravasation as a basis for metastatic invasion.
MATERIALS AND METHODS
The cell line
The alveolar RMS cell line Rh30 (DSMZ, Braunschweig, Germany) was cultured in Dulbeco's modified Eagle's medium (DMEM) supplemented with 10% foetal calf serum, 1% L‐Glu and 2.5% HEPES in a humidified atmosphere containing 5% CO2 at 37 °C. All cells were mycoplasma‐negative.
DsRed2‐transfection
Transfection of the tumour cells was carried out by lipofection. Two hundred microlitres OptiMem (Gibco, Eggenstein, Germany) and 5 µL lipofectamine (Invitrogen, Karlsruhe, Germany) were incubated with 5 µg pDsRed2‐N1‐DNA (BD Biosciences Clontech, Palo Alto, CA, USA) for 30 min at room temperature to form a lipofectamine‐DsRed2 complex. The complex was then added to Rh30 cells (in 6‐well‐plates at 1 × 10⁶ cells/well) with incubation for 5 h at 37 °C. Transfection was stopped by adding 10% foetal calf serum in DMEM, to the cells. The transfection rate was determined after 24 h using fluoresence microscopy (excitation 561 nm, emission 587 nm). DsRed2‐positive cells were isolated by fluorescence‐activated cell sorting (FACSVantage SE, BD, Heidelberg, Germany) 96 h after transfection. Selected cells were immediately re‐suspended in DMEM as described above and the selection antibiotic G418 (1.6 mg/mL) was added. In order to establish a pure DsRed2‐positive cell line, transfected cells were cloned after selection. Successful transfection was demonstrated by detection of DsRed2 mRNA using single‐cell RT‐PCR after laser microdissection (PALM Robo, Microlaser Technologies, Bernried, Germany; Software PALM Robo version 1.21). Details of the PCR have been described previously (Seitz et al. 2006).
Cell morphology
Cytological analysis of the transfected and untransfected cell lines was performed by a pathologist, carried out by light microscopy using high power fields (×400). Cells were grown on microscopic slides and haematoxylin and eosin staining was performed. The size of 75 tumour cells was measured using the Zeiss Axioskop 40 microscope with AxioVision software (Zeiss, Bernried, Germany).
Experimental metastatic invasion
DsRed2‐transfected cells were cloned as described above. One week prior to injection, G418 selection was removed and cells were maintained in the described culture medium. Approximately 1 × 10⁶ tumour cells (100 µL) were injected into the tail vein or into the right hind footpad of 6–8‐week‐old female nude mice (NMRI nu/nu, University Hospital Tuebingen, Germany; weight 20–25 g, n = 8 per group). Animals were observed for 8–10 weeks, kept under pathogen‐free conditions, fed an autoclaved standard diet and given free access to sterilized water.
In vivo optical fluorescence imaging
Animals were inspected for possible metastases twice a week, with a cold light source (KL 1500, Schott, Mainz, Germany) and a green excitation filter (HQ 535, Chroma Technology Corp., Rockingham, VT, USA) and a red emission filter (OG 590 LP, Chroma Technology Corp.). Animals were put into a dark room, and the filter and light setup were installed. The light beam was focused on to the animal, the investigations being without anaesthesia.
Flat‐panel volumetric computed tomography
Flat‐panel volumetric computed tomography (General Electric Global Research, Niskayuna, NY, USA) was used as an additional method for detection of RMS metastases in vivo and was carried out 8–10 weeks after tumour cell injection. This technique was only used to scan animals in which DsRed2 fluorescence revealed tumour masses larger than 0.5 cm3, in order to reduce unnecessary anaesthesia and contrast media application. Prior to scanning, animals were anaesthetized by Ketamin (Ketavet®, Pfizer, Karlsruhe, Germany) and Rompun® (Bayer Healthcare, Leverkusen, Germany) via intraperitoneal injection. Anaesthetized animals were centred on the fpVCT gantry axis of rotation. Two hundred microlitres of an iodine contrast medium (Isovist, Schering, Berlin, Germany) were then applied intravenously into the tail vein 30 s prior to imaging. The scanner consists of a modified circular computed tomography gantry and two amorphous silicon flat‐panel X‐ray detectors each (20.5 × 20.5 cm2) with a matrix of 1024 × 1024, 200 µm detector elements. A step‐and‐shoot acquisition mode was used. Standard Z‐coverage of one step was 4.21 cm. All data sets were acquired with the same protocol: 1000 views per rotation, 8‐s rotation time, 360 used detector rows and 80 kVp and 100 mA. A modified Feldkamp algorithm was used for image reconstruction resulting in isotropic high resolution volume data set (512 × 512 matrix, resolution about 150 µm).
Real‐time subcellular imaging in live animals with the Olympus OV100 variable‐magnification small‐animal imaging system
The OV100 (Olympus Corp., Tokyo, Japan) contains an MT‐20 light source (Olympus Biosystems, Planegg, Germany) and an F‐View II extended CCD camera (Olympus Optical GmbH, Hamburg, Germany). The system allows real‐time invasive imaging of fluorescent tumours at the single‐cell level, as well as non‐invasive imaging at the macroscopic level in live animals. Technical details of the system have been previously described by Yamauchi et al. A further series of animals (NMRI nu/nu, n = 8) were used for these experiments. Animals were injected with green fluorescent protein‐expressing tumour cells (approximately 1 × 10⁶ tumour cells/100 µL) into the tail vein. Animals were then anaesthetized by a combination of Ketamin and Rompun by intraperitoneal injection. An arc‐shaped incision was made in the abdominal skin in order to prepare a skin flap (Yamauchi et al. 2006). Care was taken to avoid injury of the epigastric cranialis vein and artery. The skin flap was spread and fixed on a flat stand. Cancer cell trafficking was imaged in real time within the skin flap. For evaluation of possible extravasation of the tumour cells, images were acquired every hour for a maximum of 12 h. Vessel structures at the inside of the skin flap were directly imaged using overview mode to detect single cells. Traced single cells were then analysed in high magnification mode. A high range of 1.6–16× magnification and a field of view ranging from 6.9 to 0.69 mm was used. Digital images and film sequences were stored on a PC system (Fujitsu Siemens, Munich, Germany). Other unlabelled cells moving within the blood stream, containing autofluorescence signals in the red range, that is, erythrocytes, could be excluded from the image by setting up the camera integration time in combination with a specific filter setup.
All animal studies were approved by the regional government ethical committee for animal studies, Tuebingen/Germany (CK 01/05).
RESULTS
Cell morphology
The overall transfection rate of the RMS with DsRed2 was 55%. Morphological features of the tumour cells were consistent with those of a sarcoma (Seitz et al. 2006). The cells were mostly stellate, exhibiting cytoplasmic processes of varying length, but some were spindle shaped (Fig. 1a–c); nuclei were round to oval. No morphological differences between transfected and non‐transfected cells were observed. Fluorescence microscopy revealed a pure red‐fluorescent cell population (Fig. 1d). The size of adherent tumour cells under cell culture conditions ranged from 30 to 219 µm with a mean length of 73.4 ± 4.54 µm.
Figure 1.
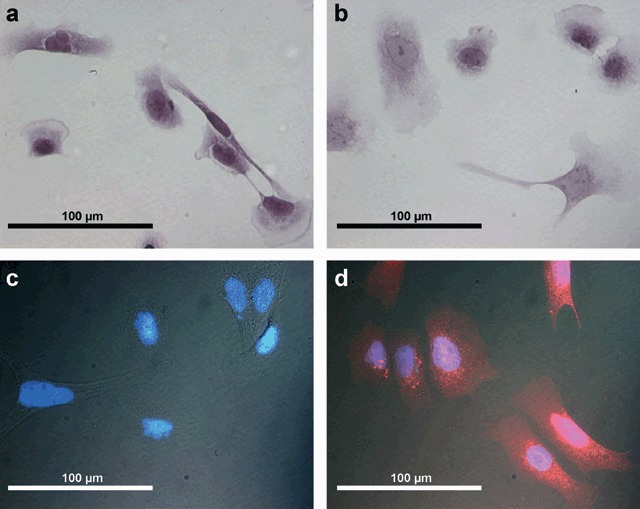
(a) Cell morphology of untransfected Rh30 cells (H&E staining). (b) Rh30 cells (H&E staining) after transfection with DsRed2 showing no changes in cell morphology. (c) Fluorescence microscopy of Rh30 cells without transfection with DsRed2 (nucleus stained with DAPI). (d) Fluorescence microscopy of Rh30 cells after transfection showing red fluorescent cells.
In vivo optical fluorescence imaging
Metastases could be clearly imaged through the mouse skin, by fluorescence, after an observation period of eight to 10 weeks. The metastases were found in 3/8 (intravenous injection) – 4/8 (footpad injection) of the animals. Animals undergoing footpad injection showed metastases in the neck and the thoracic wall (Fig. 2a), while those that had undergone tail vein injection‐developed pelvic metastases (Fig. 2b). A lung metastasis was found in one animal only, after tail vein injection and could be detected by fpVCT alone (please see below).
Figure 2.
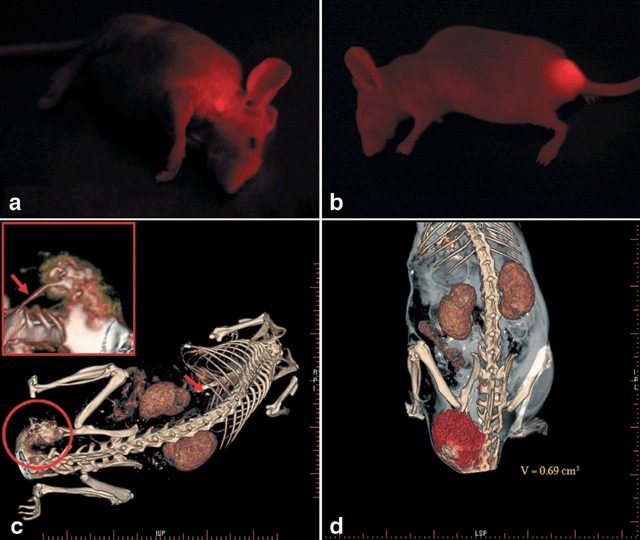
(a) In vivo optical fluorescence imaging of alveolar childhood rhabdomyosarcoma metastasis in the neck of a nude mouse (NMRI nu/nu) six weeks after right‐hind‐footpad injection of tumor cells expressing DsRed2. (b) In vivo optical fluorescence imaging of alveolar childhood rhabdomyosarcoma metastasis in the pelvis of a nude mouse (NMRI nu/nu) eight weeks after tail‐vein injection of tumor cells expressing DsRed2. (c) High resolution flat panel volumetric CT scan of a nude mouse (NMRI nu/nu) showing a pelvic metastasis. Reconstructed imaging data is focussed on tumor and vessel structures. Arrow indicates single lung metastases; Small section shows magnification of the tumor and vessel structures showing vessel supply from the aorta and the vertebral artery. (d) Reconstruction of fpVCT data mainly focussed on tumor volume (V = tumor volume).
Flat‐panel volumetric computed tomography
Flat panel volumetric computed tomography data allowed for highly specific analysis of contrast between tumour and surrounding tissue. Varying types of data reconstruction were used in order to visualize different structures within the body. Data reconstruction was mainly focused on tumour volume (Fig. 2d), bony structures and vessels. As stated above, in animals following tail vein injection (n = 3), a large pelvic mass with expansion to the tail could be clearly detected and discriminated from surrounding tissue. These tumours were supplied with blood from tumour vessels originating from the aorta or the vertebral arteries (Fig. 2c). Resolution of the images was approximately 150 µm. In one animal, a lung metastasis could be identified, which could not be detected by fluorescence imaging. Otherwise, concordance between fluorescence and fpVCT imaging was found in all examined animals. fpVCT was only used in animals with tumour masses larger than 0.5 cm3 in order to avoid unnecessary application of anaesthetics and contrast media.
In vivo cell trafficking
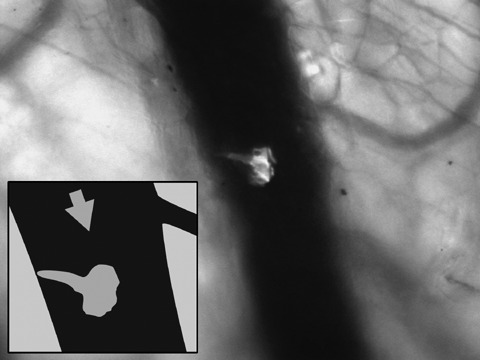
Real‐time subcellular imaging was successfully performed using the Olympus OV‐100; fluorescent cells could be immediately imaged after tail vein injection. Cancer cells were tracked along greater vessels (Fig. 3), often arrested at vessel junctions especially in those of small diameter (Fig. 4). Tumour cells in greater vessels were more spherical in shape (Fig. 3), while in contrast, those in vessels with smaller diameter seemed deformed by stretching (Fig. 4). At some vessel junctions, an accumulation of cancer cells was found; Fig. 5 shows tumour cell accumulation at a vessel junction. In larger vessels, some cells attached to the vessel wall. After 12 h, extravasation of tumour cells with detection of them both within the vessel wall and outside the vessel was found in a few observed areas in two animals (Fig. 6). Extravasated cells were found in spatial relationships to the vessels.
Figure 3.
Visualization of a single rhabdomyosarcoma cell trafficking through a larger vessel in a nude mouse (NMRI nu/nu) using the Olympus OV100 (focussed on parts of a skin flap) for fluorescence imaging. The cell started docking at the vessel wall. Arrow indicates direction of blood flow.
Figure 4.
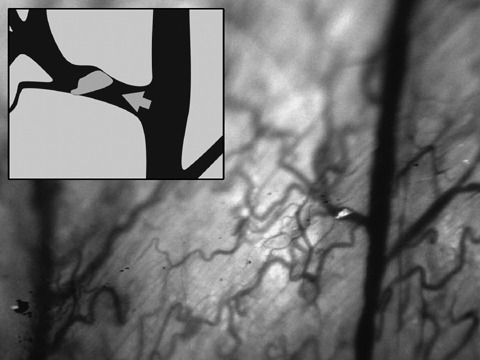
Image of single rhabdomyosarcoma cell (using the OV100) arresting at a vessel junction with a small diameter. Other cells are deformed by stretching by the small diameter of the vessel. Arrow indicates direction of blood flow.
Figure 5.
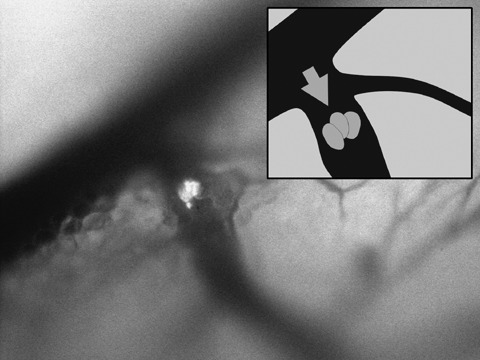
Accumulation of three rhabdomyosarcoma cells in a smaller vessel. Arrow indicates direction of blood flow.
Figure 6.
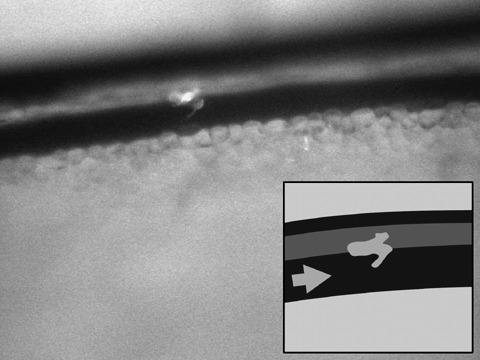
Extravasation of a rhabdomyosarcoma cell (observation time: 12 hours). Arrow indicates direction of blood flow.
DISCUSSION
The mechanism of metastatic invasion in childhood RMS is still not completely understood. In general, metastatic invasion might be promoted by cell arrest in the microcirculation, extravasation of tumour cells and growth into early micrometastases (Luzzi et al. 1998; Chambers et al. 2002; Yamauchi et al. 2006). Therefore, novel methods for detection and in vivo visualization of trafficking RMS cells are required in order to learn about development and behaviour of metastases, in more detail.
Experimental metastatic invasion can be induced by various techniques using different injection sites, which result in diverse types of metastases. Right‐hind footpad injection is a commonly used technique for induction of experimental metastases and normally leads to the development of lung metastases (Yamamoto et al. 2003b). In our study, the number of metastases detected by fluorescence was lower than expected. The reasons remains unclear, but might be caused by specific behaviour and large size of these tumour cells. Subcutaneous metastases at the neck and thoracic wall might develop by accumulation of cells at junctions of vessels with narrow diameters. After tail vein injection, development of lung metastases was anticipated (Yamamoto et al. 2003a), although interestingly, we detected metastases of RMS in the pelvis by fluorescence. This might be caused by arrest of large tumour cells at the confluence of the tail vein. After accumulation of the tumour cells, extravasation and development of micrometastases might take place, which may cause development of pelvic metastases. The low number of metastases in general seems to be caused by the metastatic behaviour of this specific cell line (Wysoczynski et al. 2007), which correlates with the clinical observation that metastatic invasion in children with RMS, also is low (Koscielniak et al. 2002).
Resolution of computed tomography and magnetic resonance tomography is often not high enough to visualize very small vessels, supplying a tumour. fpVCT is a novel technique and represents implementation of conventional computed tomography with increased isotropic resolution (Valencia et al. 2006); we found that metastases could easily be detected by fpVCT. Additional information concerning blood supply of these tumours was collected revealing multiple blood supply from different origins. fpVCT is a very useful tool to detect small nodules such as lung metastases, calculate tumour volumes and investigate blood supply, in experimental RMS, and offers a close correlation to fluorescence imaging.
Using the OV100 variable‐magnification imaging system, childhood RMS cells were continuously imaged in real time. After tail vein injection, tumour cells could be observed in different vessels, and in contrast to local application of tumour cells (Yamauchi et al. 2006), we used systemic application of these cells in order to identify their typical in vivo behaviour. Cancer cells could be observed within the normal blood flow, as they moved over blood vessel walls or when they arrested at vessel junctions. We found that tumour cells accumulated at vessel junctions with small diameters, due to the large size of the cells. Yamauchi et al. have also shown that cancer cells could not traffic in capillaries below approximately 8 µm in diameter and could become arrested (Yamauchi et al. 2005). Cancer cells seemed to be deformed in narrow‐diameter vessels, whereas cells in larger ones they appeared to be more spherical. Extravasation of the tumour cells was rarely observed; cells were either seen docking on the walls of larger vessels or arresting at vessel junctions. The ability for malignant cells to extravasate seems to be tumour‐cell‐type‐dependent; breast cancer cells frequently extravasate, whereas other tumour cells such as those of fibrosarcomas show only low extravasation frequency (Yamauchi et al. 2006) and Koop et al. have reported that extravasation time differs from organ to organ (Koop et al. 1995).
Finally, we conclude that red fluorescent protein is a promising tool for in vivo visualization of childhood RMS metastases, which allows a fast and non‐invasive detection method to identify the exact location of these tumour cells. fpVCT is an effective instrument for investigation of angiogenesis in these tumours showing an extensive tumour blood supply from major vessels. The OV100 variable‐magnification imaging system offers new options for further understanding of the development and behaviour of metastases in vivo. We believe that initiation of RMS metastases might develop at vessel junctions with small diameters due to arrest of tumour cells at these locations or after docking of these cells in larger vessels, resulting in extravasation. These imaging techniques should lead to a much deeper understanding of the mechanism of metastatic cell invasion and should help to identify novel and variable treatment targets.
ACKNOWLEDGEMENTS
The authors thank Hannes Schramm (Department of Photography, University Hospital Tuebingen) for his support.
REFERENCES
- Chambers AF, Groom AC, MacDonald IC (2002) Dissemination and growth of cancer cells in metastatic sites. Nat. Rev. Cancer 2, 563–572. [DOI] [PubMed] [Google Scholar]
- Christ WM, Anderson JR, Meza JL, Fryer C, Raney RB, Ruymann FB, Breneman J, Qualman SJ, Wiener E, Wharam M, Lobe T, Webber B, Maurer HM, Donaldson SS (2001) Intergroup rhabdomyosarcoma study‐IV: results of patients with non‐metastatic disease. J. Clin. Oncol. 19, 3091–3102. [DOI] [PubMed] [Google Scholar]
- Cocker HA, Pinkerton CR, Kelland LR (2000) Characterization and modulation of drug resistance of human paediatric rhabdomyosarcoma cell lines. Br. J. Cancer 83, 338–345. [DOI] [PMC free article] [PubMed] [Google Scholar]
- Crist WM, Garnsey L, Beltangady MS, Gehan E, Ruymann F, Webber B, Hays DM, Wharam M, Maurer HM (1990) Prognosis in children with rhabdomyosarcoma: a report of the intergroup rhabdomyosarcoma studies I and II. Intergroup Rhabdomyosarcoma Committee. J. Clin. Oncol. 8, 443–452. [DOI] [PubMed] [Google Scholar]
- Koop S, MacDonald IC, Luzzi K, Schmidt EE, Morris VL, Grattan M, Khokka R, Chambers AF, Groom AC (1995) Fate of melanoma cells entering the microcirculation: over 80% survive and extravasate. Cancer Res. 55, 2520–2523. [PubMed] [Google Scholar]
- Koscielniak E, Morgan M, Treuner J (2002) Soft tissue sarcoma in children: prognosis and management. Paediatr. Drugs 4, 21–28. [DOI] [PubMed] [Google Scholar]
- Lawrence W Jr, Anderson JR, Gehan EA, Maurer H (1997) Pretreatment TNM staging of childhood rhabdomyosarcoma: a report of the Intergroup Rhabdomyosarcoma Study Group. Children's Cancer Study Group. Pediatric Oncology Group. Cancer 80, 1165–1170. [PubMed] [Google Scholar]
- Luzzi KJ, MacDonald IC, Schmidt EE, Kerkvliet N, Morris VL, Chambers AF, Groom AC (1998) Multistep nature of metastasis inefficiency: dormancy of solitary cells after successful extravasation and limited survival of early micrometastasis. Am. J. Pathol. 153, 865–873. [DOI] [PMC free article] [PubMed] [Google Scholar]
- McDowell HP (2003) Update on childhood rhabdomyosarcoma. Arch. Dis. Child. 88, 354–357. [DOI] [PMC free article] [PubMed] [Google Scholar]
- Newton WA Jr, Gehan EA, Webber BL, Marsden HB, Van Unnik AJ, Hamoudi AB, Tsokos MG, Shimada H, Harms D, Schmidt D,Ninfo V, Cavazzana AO, Gonzalez‐Crussi F, Parham DM, Reiman HM, Asmar L, Beltangady MS, Sachs NE, Triche TJ, Maurer HM (1995) Classification of rhabdomyosarcomas and related sarcomas. Pathologic aspects and proposal for a new classification – an Intergroup Rhabdomyosarcoma Study. Cancer 76, 1073–1085. [DOI] [PubMed] [Google Scholar]
- Pappo AS, Shapiro DN, Crist WM, Maurer HM (1995) Biology and therapy of pediatric rhabdomyosarcoma. J. Clin. Oncol. 13, 2123–2129. [DOI] [PubMed] [Google Scholar]
- Seitz G, Warmann SW, Fuchs J, Mau‐Holzmann UA, Ruck P, Heitmann H, Hoffman RM, Mahrt J, Müller GA, Wessels JT (2006) Visualization of xenotransplanted human rhabdomyosarcoma after transfection with red fluorescent protein. J. Pediatr. Surg. 41, 1369–1376. [DOI] [PubMed] [Google Scholar]
- Valencia R, Stuermer EK, Dullin C, Herrmann KP, Kluever I, Zaroban A, Sehmisch S, Funke M, Knollmann F (2006) Feasibility of flat‐panel volume tric computed tomography (fpVCT) in experimental small animal imaging of osteoporosis – initial experience. Radiologe 46, 893–899. [DOI] [PubMed] [Google Scholar]
- Wysoczynski M, Miekus K, Jankowski K, Wanzeck J, Bertolone S, Janowska‐Wieczorek A, Ratajczak J, Ratajczak MZ (2007) Leukemia inhibitory factor: a newly identified metastatic factor in rhabdomyosarcomas. Cancer Res. 67, 2131–2140. [DOI] [PubMed] [Google Scholar]
- Yamamoto N, Yang M, Jiang P, Xu M, Tsuchiva H, Tomita K, Moosa AR, Hoffman RM (2003a) Real‐time imaging of individual fluorescent‐protein color‐coded metastatic colonies in vivo . Clin. Exp. Metastasis 20, 633–638. [DOI] [PubMed] [Google Scholar]
- Yamamoto N, Yang M, Jiang P, Xu M, Tsuchiva H, Tomita K, Moossa R, Hoffman RM (2003b) Determination of clonality of metastasis by cell‐specific color‐coded fluorescent protein imaging. Cancer Res. 63, 7785–7790. [PubMed] [Google Scholar]
- Yamauchi K, Yang M, Jiang P, Xu M, Yamamoto N, Tsuchiva H, Tomita K, Moossa AR, Bouvet M, Hoffman RM (2006) Development of real‐time subcellular dynamic multicolour imaging of cancer‐cell trafficking in live mice with a variable‐magnification whole‐mouse imaging system. Cancer Res. 66, 4208–4214. [DOI] [PubMed] [Google Scholar]
- Yamauchi K, Yang M, Jiang P, Yamamoto N, Xu M, Amoh Y, Tsuji K, Bouvet M, Tsuchiya H, Tomita K, Moossa AR, Hoffman RM (2005) Real‐time in vivo dual‐color imaging of intracapillary cancer cell and nucleus deformation and migration. Cancer Res. 65, 4246–4252. [DOI] [PubMed] [Google Scholar]