

Summary
Background and aims
Great interest persists in useful therapeutic targets in glioblastoma (GBM). Deregulation of microRNAs (miRNAs) expression has been associated with cancer formation through alterations in gene targets. In this study, we reported the role of miR‐101 in human glioblastoma stem cells (GSCs) and the potential mechanisms.
Methods and results
Quantitative real‐time PCR showed that miR‐101 expression was decreased in GSCs. Overexpression of miR‐101 reduced the proliferation, migration, invasion, and promoted apoptosis of GSCs. One direct target of miR‐101, the transcription factor Kruppel‐like factor 6 (KLF6), was identified using the Dual‐Luciferase Reporter Assay System, which mediated the tumor suppressor activity of miR‐101. This process was coincided with the reduced expression of Chitinase‐3‐like protein 1 (CHI3L1) whose promoter could be bound with and be promoted by KLF6 demonstrated by luciferase assays and chromatin immunoprecipitation assays. The downregulation of CHI3L1 led to the inactivation of MEK1/2 and PI3K signal pathways. Furthermore, nude mice carrying the tumors of overexpressed miR‐101 combined with knockdown of KLF6 produced the smallest tumors and showed the highest survival rate.
Conclusions
Our findings provided a comprehensive analysis of miR‐101 and further defining it as a potential therapeutic candidate for GBM.
Keywords: CHI3L1, Glioblastoma stem cells, KLF6, microRNAs, mir‐101
Introduction
Glioblastoma (GBM) is the most aggressive type of malignant glioma in adults. Despite the recent advanced treatment using combinations of surgery and adjuvant therapy, GBM is associated with a median survival of only 1–2 years 1, 2. Evidence indicates the presence of a subpopulation which exhibits stem cell‐like properties, and this subpopulation has been referred as glioblastoma stem cells (GSCs) 3, 4, 5, 6. These cells display the abilities of self‐renewal, multilineage differentiation, and high oncogenic potential 4, 7, and contribute to the therapy resistance and tumor recurrence 8, 9, 10. Therefore, elucidation of the molecular mechanisms underlying GSCs maintenance offers new focus toward the development of improved antiglioblastoma therapies.
microRNAs (miRNAs) are short noncoding endogenous RNAs that regulate gene expression by targeting mRNA for deregulation or translational repression 11. Accumulated evidences have shown that miRNAs regulate a wide variety of physiological and pathological processes. Deregulation of miRNAs expression has been associated with tumor formation through alterations in either oncogenic or tumor suppressor gene targets, resulting in the alteration of diverse cellular processes, such as cell proliferation, migration, invasion, and apoptosis 12, 13, 14.
Previous studies have shown that miR‐101 is associated with many important biological processes such as cell proliferation, invasion, and angiogenesis 15, 16, 17. In recent years, several published studies have proved that miR‐101 was downregulated in various cancers 18, 19, 20 and acted as a tumor suppressor 21, 22. The low levels of miR‐101 inversely correlate with patient survival in different types of cancers 19, 23. In addition, it has been reported that miR‐101 could induce apoptosis and suppress tumorigenicity in vitro and in vivo, inhibit the gastric cancer cells migration and invasion 18, and counteract tumor development and progression by targeting multiple oncogenes including proto‐oncogene MYCN in neuroblastoma 20, 24, 25. In prostate cancer stem cells, studies have shown that miR‐101 played a protective role by directly targeting enhancer of zeste homolog 2 26. Moreover, in high‐grade gliomas (III and IV), the expression of miR‐101 was significantly downregulated 27. However, limited knowledge is available concerning whether miR‐101 expression affects the biological processes of GSCs, and the underlying molecular mechanism remains unclear.
In this study, we aimed to identify the function of miR‐101 in GSCs. Further the mechanism of impairing GSCs oncogenic ability by miR‐101 would be investigated. Moreover, whether Kruppel‐like factor 6 (KLF6) would be a direct target of miR‐101 and the downstream signaling molecules regulated by KLF6 would also be identified. Our findings will provide new insights into the molecular functions of miR‐101 as well as their regulatory mechanisms in GSCs.
Materials and Methods
Tumor Samples and Cell Culture
Glioma tissues and normal brain tissues (NBTs) were obtained from patients undergoing surgery at the Shengjing Hospital of China Medical University according to the protocols approved by the Internal Review Board. The procedures were in accordance with the provisions of the Declaration of Helsinki (as revised in Edinburgh 2000) and approved by the Ethics Committee. All patients provided written informed consent. After surgical removal, specimens were subjected to enzymatic dissociation as described previously 7, 28. GSCs were obtained from GBM tissues. For in vitro expansion of GSCs, cells were cultured in DMEM/F‐12 medium containing basic fibroblast growth factor (bFGF, 20 ng/mL, Life Technologies Corporation, Carlsbad, CA, USA), epidermal growth factor (EGF, 20 ng/mL, Life Technologies Corporation, Gaithersburg, MD, USA), and B27 serum‐free supplement (20 mg/mL, Life Technologies Corporation, Grand Island, NY, USA). Human embryonic kidney (HEK) 293T cells were obtained from Shanghai Institutes for Biological Sciences Cell Resource Center, cultured in high‐glucose DMEM supplemented with 10% fetal bovine serum (FBS, Life Technologies Corporation, Paisley, UK). All cells were incubated at 37°C in a humidified incubator with 5% CO2.
Isolation and Identification of GSCs
For the limiting dilution assay and primary sphere formation assay, sphere cells were dissociated into a single cell and planted in 96‐well plates, as described by Singh et al. 7. For differentiation assay of tumor spheres, cells were plated onto glass coverslips coated with poly‐L‐ornithine (BD Biosciences, Franklin Lakes, NJ, USA) in cultural medium with 10% FBS. Immunocytochemistry was performed as described by Singh et al. 7. Spheres and differentiated cells were stained with the antibodies as follows: anti‐Nestin (1:100, Santa Cruz Biotechnology, Santa Cruz, CA, USA), anti‐CD133 (1:100, Santa Cruz Biotechnology), anti‐GFAP (1:100, Abcam, Cambridge, MA, USA), and anti‐beta‐tubulin III (1:100, Santa Cruz Biotechnology). Then, cells were incubated with cy3‐labeled goat anti‐mouse and FITC‐labeled goat anti‐rabbit antibodies (1:200, Beyotime Institute of Biotechnology, Jiangsu, China), and counterstained using DAPI.
RNA Isolation, Reverse Transcription, and Quantitative Real‐Time PCR (qRT‐PCR)
Total RNA was extracted from the cells with Trizol reagent (Life Technologies Corporation). Taqman MicroRNA Reverse Transcription Kit and TaqMan Universal Master Mix II with the TaqMan MicroRNA Assay of miR‐101 and U6 (Applied Biosystems, Foster City, CA, USA) were used to detect the miR‐101 expression. For quantification of KLF6 mRNA, reverse transcription and real‐time PCR were performed using the High‐Capacity cDNA Reverse Transcription Kits and TaqMan Universal Master Mix II with the KLF6 and GAPDH gene expression assays (Applied Biosystems), respectively. U6 and GAPDH were used as endogenous controls. Relative expression of the tested genes was calculated using relative quantification () method.
Lentivirus Vector Construction and Infection
Human full‐length KLF6 gene with its 3′‐UTR sequences and short‐hairpin RNA directed against human KLF6 gene were ligated into the LV5‐CMV‐GFP‐EF1a‐Puro vector and LV3‐CMV‐GFP‐Puro vector (GenePharma, Shanghai, China), respectively. Virus particles were harvested 48 h after the cotransfection of lentiviral vectors or their control lentivirus vectors (NC) with packaging vectors into HEK 293T cells using Lipofectamine 2000 (Life Technologies Corporation). Cells were then infected with lentivirus or their NC. GFP‐positive cells were picked as KLF6 (+)‐NC, KLF6 (+), KLF6 (−)‐NC, and KLF6 (−), and then used for subsequent assays.
Cell Transfections
Using lipofectamine 2000 reagent (Life Technologies Corporation), GSCs were transfected with pre‐miR‐101, anti‐miR‐101, or their respective negative control (NC, nontargeting sequence) which were synthesized from Life Technologies Corporation. At 6‐h posttransfection, the medium was replaced with fresh medium. The levels of miR‐101 in the transfected cells were verified by qRT‐PCR. Because the highest transfection efficiency was occurred at 48 h, 72‐h posttransfection was considered as the harvest time in the subsequent experiments. GSCs transfected with miRNAs were divided into 5 groups as follows: control group (cells given no miRNAs), pre‐miR‐101‐NC group, pre‐miR‐101 group, anti‐miR‐101‐NC group, and anti‐miR‐101 group. Those stable expressing cells cotransfected with pre‐miR‐101 (or anti‐miR‐101) were divided into nine groups as follows: control group, pre‐miR‐101‐NC+KLF6(+)‐NC group (KLF6(+)‐NC stable expressing cells cotransfected with pre‐miR‐101‐NC), pre‐miR‐101+KLF6(+) group (KLF6(+) stable expressing cells cotransfected with pre‐miR‐101), pre‐miR‐101‐NC+KLF6(−)‐NC group (KLF6(−)‐NC stable expressing cells cotransfected with pre‐miR‐101‐NC), pre‐miR‐101+KLF6(−) group (KLF6(−) stable expressing cells cotransfected with pre‐miR‐101), anti‐miR‐101‐NC+KLF6(+)‐NC group (KLF6(+)‐NC stable expressing cells cotransfected with anti‐miR‐101‐NC), anti‐miR‐101+KLF6(+) group (KLF6(+) stable expressing cells cotransfected with anti‐miR‐101), anti‐miR‐101‐NC+KLF6(−)‐NC group (KLF6(−)‐NC stable expressing cells cotransfected with anti‐miR‐101‐NC), and anti‐miR‐101+KLF6(−) group (KLF6(−) stable expressing cells cotransfected with anti‐miR‐101).
Proliferation Assay
Cells were seeded in 96‐well plates. After transfected for 72 h, cells per well were added 20 μl of Cell Counting Kit‐8 (Beyotime Institute of Biotechnology) and incubated at 37°C for 2 h. The absorbance was measured at 450 nm.
Quantization of Apoptosis by Flow Cytometry
Apoptosis was assessed using ApoScreen Annexin V Apoptosis detection kit (SouthernBiotech, Birmingham, AL, USA). Cells were washed, resuspended in Annexin‐V binding buffer, and incubated with 10 μL of Annexin‐V‐PE for 15 min at 4°C. Without washing, 380 μL of cold‐binding buffer and 10 μL of 7‐AAD solution were added. Cells were measured using flow cytometry (FACScan, BD Biosciences).
Cell Migration and Invasion Assay
Twenty‐four‐well chambers with 8 μm pore size (Corning) were used in cell migration and invasion assay. Cells were dissociated in 100 μL serum‐free medium and added to the upper chamber. The lower chamber was added with 600 μL of medium with 10% FBS. After 48 h of incubation, the chambers were removed from the plates and cells on the upper surface of chambers were wiped with a cotton swab. Cells were fixed and then stained with 20% Giemsa. For the cell invasion assay, the procedure was similar to the above one, but the upper chamber was precoated with a 500 ng/μL matrigel solution (BD Biosciences). Chambers were subjected to a microscopic inspection and counted in five randomly selected fields.
Western Blot Analysis
Total protein was extracted using RIPA buffer containing 50 mM0020HEPES, 1 mM EDTA (pH 8.0), protease inhibitors and phosphatase inhibitors (Beyotime Institute of Biotechnology), subjected to SDS‐PAGE and electrophoretically transferred to PVDF membranes. After blocking with Tris‐buffered saline‐Tween (TBST) containing 5% nonfat milk, the membranes were then incubated overnight at 4°C with individual primary antibodies as follows: KLF6 (1:500, Santa Cruz Biotechnology), CHI3L1 (1:500, Santa Cruz Biotechnology), MEK1/2, p‐MEK1/2 (1:500, Santa Cruz Biotechnology), PI3K, p‐PI3K (1:500, Santa Cruz Biotechnology), and GAPDH (1:1000, Santa Cruz Biotechnology). After this, the membranes were incubated with horseradish peroxidase‐conjugated secondary antibody (Santa Cruz Biotechnology) at room temperature for 1 h. Immunoblots were visualized by ECL chemiluminescent detection system (Santa Cruz Biotechnology). The relative integrated density values (IDVs) were calculated based on GAPDH as an internal control.
Reporter Vector Constructs and Luciferase Assays
To determine the effect of miR‐101 on KLF6 3′‐UTR and the functional binding sites in the 3′‐UTR of KLF6, the full‐length 3′‐UTR fragments of KLF6 gene and its mutant of the miR‐101 binding sites were subcloned into a pmirGlo Dual‐luciferase miRNA Target Expression Vector (Promega, Madison, WI, USA) to form KLF6‐3′UTR‐Wt and KLF6‐3′UTR‐Mut (GenePharma), respectively. HEK 293T cells seeded in 24‐well plates were cotransfected with KLF6‐3′UTR‐Wt (or KLF6‐3′UTR‐Mut) and the indicated miRNAs. Luciferase assays were performed 48 h later using the Dual‐Luciferase Reporter Assay System (Promega).
To determine the responsive KLF6‐binding regions in the human CHI3L1 promoter, promoter activities were measured using Dual‐Luciferase Reporter Assay System (Promega) as described previously 29. Human CHI3L1 promoter and its fragments were amplified from human genomic DNA, and then subcloned into pGL3‐Basic vector (Promega). Human full‐length KLF6 was constructed in pEX3 vector (GenePharma). The firefly luciferase activity was normalized to renilla luciferase activity for each individual analysis.
Chromatin Immunoprecipitation (ChIP) Assay
ChIP was performed according to the protocol provided in Simple ChIP Enzymatic Chromatin IP Kit (Cell signaling Technology, Danvers, MA, USA) as previously described 29. GSCs were treated with 1% formaldehyde before cell lysis and DNA fragmentation. 2% aliquots of lysates were saved as “Input” fractions, and the remaining lysates were immunoprecipitated with normal rabbit IgG or anti‐KLF6 antibody. DNA was extracted for PCR amplification of the following DNA fragments: putative binding site 1 of CHI3L1 gene using the primers 5′‐AAAGGGCTGGTTTGCC‐3′and 5′‐CAGATACCTGTTTGAGACGC‐3′, yielding a 183‐bp product; putative binding site 2 of CHI3L1 gene using the primers 5′‐GAGGAAGGCTGGGAAATG‐3′ and 5′‐CCAGAGGAGGGTTGAGAAA‐3′, yielding a 140‐bp product; control of CHI3L1 gene using the primers 5′‐CCCCAAATGAACCAGAAG‐3′ and 5′‐TCGGTGAATACTAAAGAGGC‐3′, yielding a 115‐bp product.
Tumor Xenograft Experiments
For the in vivo study, the stable GSCs were used. Lentiviruses encoding pre‐miR‐101 were generated using pLenti6.3/V5–DEST Gateway Vector Kit (Life Technologies Corporation). The pre‐miR‐101 was ligated into the pLenti expression vector. Lentiviruses were generated in 293FT cells, using the ViraPower Packaging Mix. miR‐101 (+) stable expressing cells were picked and used for subsequent assays. To generate the stable cells expressing both miR‐101 (+) and KLF6 (−), the lentiviruses of miR‐101 were transduced in KLF6 (−) stable expressing cells.
The nude mice were divided into control group (only GSCs), miR‐101 (+) group (miR‐101 overexpression stable GSCs), KLF6 (−) group (KLF6 inhibition stable GSCs), and miR‐101 (+)+KLF6 (−) group (miR‐101 overexpression and KLF6 inhibition stable GSCs). For subcutaneous implantation, 3 × 10⁵ cells were injected subcutaneously into the right flanks of 4‐week‐old BALB/c athymic nude mice (Cancer Institute of the Chinese Academy of Medical Science, Shanghai, China). Tumor volume was determined by caliper measurements every 5 days and calculated according to the formula: volume (mm3) = length × width2/2. For orthotopic tumor inoculations, 3 × 10⁵ cells suspended in 5 μL 1 × PBS were injected into the right striatum of the mice. The survived number of nude mice was recorded every 5 days. All animal experiments were carried out under the approval of the Animal Care Committee of the Shengjing Hospital and conducted in accordance with guidelines for the welfare and use of animals in cancer research 30.
Statistical Analysis
Data are presented as the mean ± standard deviation (SD). Differences were analyzed using the Student t‐test or one‐way ANOVA, and P < 0.05 was considered statistically significant.
Results
Isolation and Identification of GSCs, and miR‐101 was Expressed at a Low Level in Glioma Tissues and GSCs
As shown in Figure 1A‐a, cells obtained from GBM tissues were cultured in the serum‐free medium and then formed stem cell spheres. Sphere generated again from a single cell by a second‐round sphere‐forming assay, exhibiting the ability for self‐renewal (Figure 1A‐b). Cell spheres were positive to neural stem cell lineage markers Nestin and CD133 (Figure 1B). To further identify the differentiation ability, cell spheres were differentiated and stained for GFAP and beta‐tubulin III lineage markers, suggesting that the isolated GSCs possessed the differentiation ability of neuronal and astrocytic lineages (Figure 1C).
Figure 1.
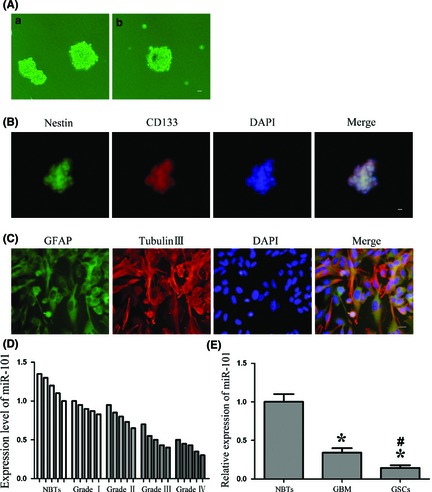
Isolation and identification of GSCs, and miR‐101 expression in glioma tissues and GSCs. (A) a: the spheres formed in the serum‐free medium. b: the second‐round sphere‐forming assay. (B) Cell spheres stained for Nestin (green) and CD133 (red) by immunofluorescence analysis. (C) Cell spheres were differentiated and stained for GFAP (green) and beta‐tubulin III (red) by immunofluorescence analysis. Nuclei (blue) were labeled with DAPI. Scale bars represent 20 μm. (D) Expression levels of miR‐101 in glioma tissues and normal brain tissues (NBTs). (E) MiR‐101 expression in NBTs, GBM, and GSCs. Data are presented as the mean ± SD (n = 5, each group). *P < 0.05 versus NBTs group, # P < 0.05 versus GBM group.
Real‐time PCR analysis confirmed that the miR‐101 expression was lower in glioma tissues than NBTs (Figure 1D). In addition, the miR‐101 expression was significantly decreased in GSCs compared with GBM or NBTs (Figure 1E). Therefore, these results indicated that the low‐expressed miR‐101 might be involved in maintaining GSCs characteristics and promoting GBM development.
Overexpression of miR‐101 Inhibited the Proliferation, Cell Migration, and Invasion, and Promoted Apoptosis of GSCs
We next assessed the functional role of miR‐101 in GSCs. As shown in Figure 2A, overexpression of miR‐101 resulted in the decreased proliferation of GSCs, and miR‐101 inhibition promoted GSCs proliferation as compared to the respective NC. Similarly, overexpression of miR‐101 led to a significant induction of apoptosis, while miR‐101 inhibition led to a significant suppression of apoptosis in GSCs (Figure 2B). As shown in Figure 2C, miR‐101 overexpression significantly decreased the migration and invasion of GSCs and vice versa. These results clearly revealed that overexpression of miR‐101 inhibited the oncogenic role of GSCs.
Figure 2.
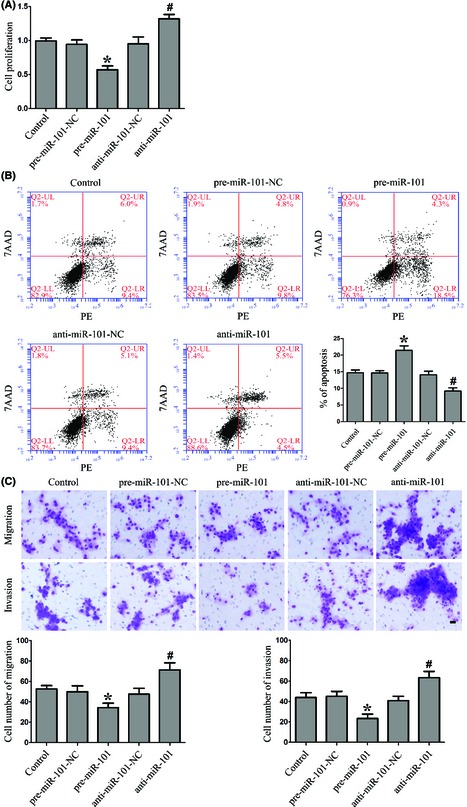
Effect of miR‐101 on proliferation, apoptosis, migration, and invasion of GSCs. (A) CCK8 assay to evaluate the proliferation effect of miR‐101 on GSCs. (B) Flow cytometry analysis of GSCs with the changed expression of miR‐101. (C) Quantification of cell migration and invasion with the changed expression of miR‐101. Representative images and accompanying statistical plots were presented. Data are presented as the mean ± SD (n = 5, each group). *P < 0.05 versus pre‐miR‐101‐NC group, # P < 0.05 versus anti‐miR‐101‐NC group. Scale bars represent 20 μm.
Overexpression of miR‐101 Inhibited KLF6 Expression by Targeting its 3′‐UTR
To uncover the potential mRNA targets of miR‐101 in GSCs, the bioinformatics databases (Targetscan, Pictar, RNAhybrid) were used. Results showed that hundreds of targets could be regulated by miR‐101, and those which has been reported to play important roles in stem cells were chosen for the further experiments, such as KLF6, SOX9, and epithelial membrane protein 1 (EMP1) 31, 32, 33. GSCs were transfected with pre‐miR‐101 or anti‐miR‐101, and we assessed the protein levels of KLF6 which was one of the miR‐101‐targeted genes by Western blot. Results showed that the effects of miR‐101 overexpression or inhibition on the protein expression levels of KLF6 were quite significant. There was no obvious difference of KLF6 mRNA among the five groups (Figure 3A). However, the protein expression of KLF6 in GSCs changed conversely with the expression of miR‐101, which suggested that KLF6 might act as one target of miR‐101 (Figure 3B). As shown in Figure 3C, the expression levels of KLF6 were higher in GSCs than GBM and NBTs. The results revealed that KLF6 played an oncogenic role in GSCs.
Figure 3.
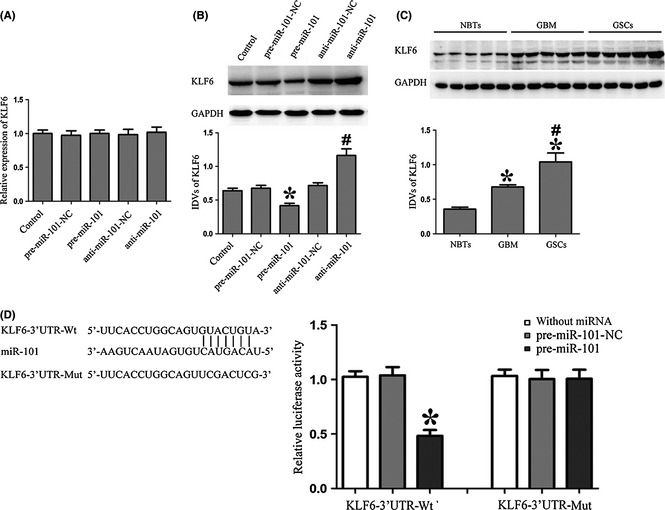
Overexpression of miR‐101 inhibited KLF6 expression by targeting its 3′‐UTR. (A) The qRT‐PCR analysis of the KLF6 expression regulated by miR‐101 in GSCs. (B) Western blot analysis of the KLF6 expression regulated by miR‐101 in GSCs. The IDVs of KLF6 are shown using GAPDH as an endogenous control. *P < 0.05 versus pre‐miR‐101‐NC group, # P < 0.05 versus anti‐miR‐101‐NC group. (C) KLF6 protein expression in normal brain tissues (NBTs), GBM and GSCs. *P < 0.05 versus NBTs group, # P < 0.05 versus GBM group. (D) The predicted miR‐101 binding sites in the 3′‐UTR region of KLF6 (KLF6‐3′UTR‐Wt) and the designed mutant sequence (KLF6‐3′UTR‐Mut) are indicated. Luciferase reporter assay of HEK 293T cells transfected with KLF6‐3′UTR‐Wt (or the KLF6‐3′UTR‐Mut) and the indicated miRNAs. From left to right, the lanes are without miRNA, pre‐miR‐101‐NC, and pre‐miR‐101 groups, respectively. Data are presented as the mean ± SD (n = 5, each group). * P < 0.05 versus KLF6‐3′UTR‐Wt+ pre‐miR‐101‐NC group.
Using TargetScan 6.2, KLF6 was predicted to harbor one putative miR‐101 binding sites in the 3′‐UTR. To determine whether KLF6 3′‐UTR is a direct target of miR‐101, pre‐miR‐101 and KLF6 3′‐UTR reporter construct (KLF6‐3′UTR‐Wt) was cotransfected into HEK293T cells and luciferase activity was measured. Overexpression of miR‐101 strongly decreased the luciferase activities, while transfection of pre‐miR‐101‐NC did not change the luciferase activities. These results indicated that miR‐101 targeted the 3′‐UTR of KLF6. To find out whether miR‐101 directly targets KLF6 through the putative binding site, pre‐miR‐101 and the KLF6 3′‐UTR mutated reporter construct (KLF6‐3′UTR‐Mut) was cotransfected into cells. Overexpression of miR‐101 did not change the luciferase activities (Figure 3D), which indicated that KLF6 was a direct target of miR‐101 with the specific binding site.
Overexpression of miR‐101 Inhibited the Proliferation, Cell Migration, and Invasion, and Promoted Apoptosis of GSCs by Downregulating KLF6
To determine whether the tumor suppressive effects of miR‐101 are mediated by KLF6, the expression levels of miR‐101 and KLF6 in GSCs were altered prior to the assessment of proliferation, migration, invasion, and apoptosis. MiR‐101 overexpression combined with KLF6 inhibition resulted in decreased proliferation of GSCs, while miR‐101 inhibition combined with KLF6 overexpression increased the proliferation of GSCs as compared to control. Furthermore, compared with KLF6 overexpression combined with miR‐101 overexpression or inhibition groups, KLF6 inhibition combined with miR‐101 overexpression or inhibition resulted in the decreased proliferation of GSCs (Figure 4A). Similar to the above results, miR‐101 overexpression combined with KLF6 inhibition led to a significant induction of apoptosis, whereas miR‐101 inhibition combined with KLF6 overexpression led to a significant inhibition of apoptosis in GSCs. Additionally, KLF6 inhibition combined with miR‐101 overexpression or inhibition led to a significant induction of apoptosis as compared to KLF6 overexpression combined with miR‐101 overexpression or inhibition groups (Figure 4B). Furthermore, miR‐101 overexpression combined with KLF6 inhibition decreased the migration and invasion of GSCs as compared to control, and miR‐101 inhibition combined with KLF6 overexpression showed reverse results. Compared with KLF6 overexpression combined with miR‐101 overexpression or inhibition groups, KLF6 inhibition combined with miR‐101 overexpression or inhibition resulted in significantly decreased migration and invasion of GSCs (Figure 4C). These results strongly suggested that miR‐101 could inhibit the oncogenic role of GSCs by downregulating KLF6.
Figure 4.
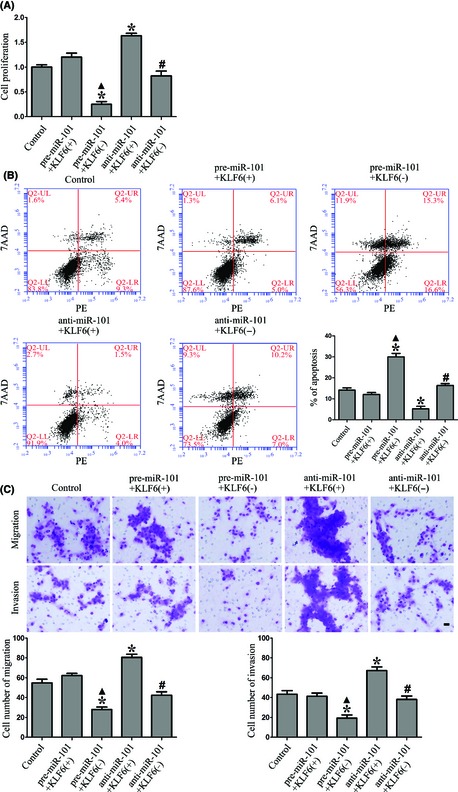
Overexpression of miR‐101 inhibited the proliferation, cell migration, invasion, and promoted apoptosis of GSCs by downregulating KLF6. (A) CCK8 assay to evaluate the proliferation effect of miR‐101 on GSCs by downregulating KLF6. (B) Flow cytometry analysis of GSCs regulated by miR‐101 and KLF6. (C) Quantification of cell migration and invasion regulated by miR‐101 and KLF6 in GSCs. Representative images and accompanying statistical plots were presented. Data are presented as the mean ± SD (n = 5, each group). *P < 0.05 versus control group, ▲ P < 0.05 versus pre‐miR‐101+KLF6(+) group, # P < 0.05 versus anti‐miR‐101+KLF6(+) group. Scale bars represent 20 μm.
Overexpression of miR‐101 Inhibited CHI3L1 Expression and the Activation of MEK1/2 and PI3K Pathways by Downregulating KLF6
Previous study showed that the patient survival and independent predictor of outcome in GBM were associated with nine genes, such as Chitinase‐3‐like protein 1 (CHI3L1), galectin 3, and podoplanin 34. Our results showed that the expression level of CHI3L1 was significantly higher in GSCs than that in GBM (Figure 5A). To further clarify whether CHI3L1 was involved in the tumor suppressive effects of miR‐101, the expression of CHI3LI was detected in miR‐101 overexpression or inhibition groups. Results showed that miR‐101 overexpression reduced and miR‐101 inhibition increased CHI3LI expression in GSCs (Figure 5B). However, CHI3LI was predicted to harbor none putative miR‐101 binding sites in the 3′‐UTR, suggesting that it was not regulated directly by miR‐101. Additionally, through analyzing the DNA sequence of CHI3L1 promoter, two putative KLF6 binding sites were found, which suggested CHI3L1 might be a target gene of KLF6. To clarify whether miR‐101 could inhibit the expression of CHI3L1 by downregulating KLF6, the combinations of transfection were conducted. miR‐101 overexpression combined with KLF6 inhibition significantly decreased the CHI3LI expression in GSCs as compared to control, and miR‐101 inhibition combined with KLF6 overexpression showed a reverse result. Furthermore, KLF6 inhibition combined with miR‐101 overexpression or inhibition resulted in the decreased expression of CHI3LI in GSCs as compared to KLF6 overexpression combined with miR‐101 overexpression or inhibition groups (Figure 5C). These results demonstrated that miR‐101 inhibited the expression of CHI3L1 by downregulating KLF6.
Figure 5.
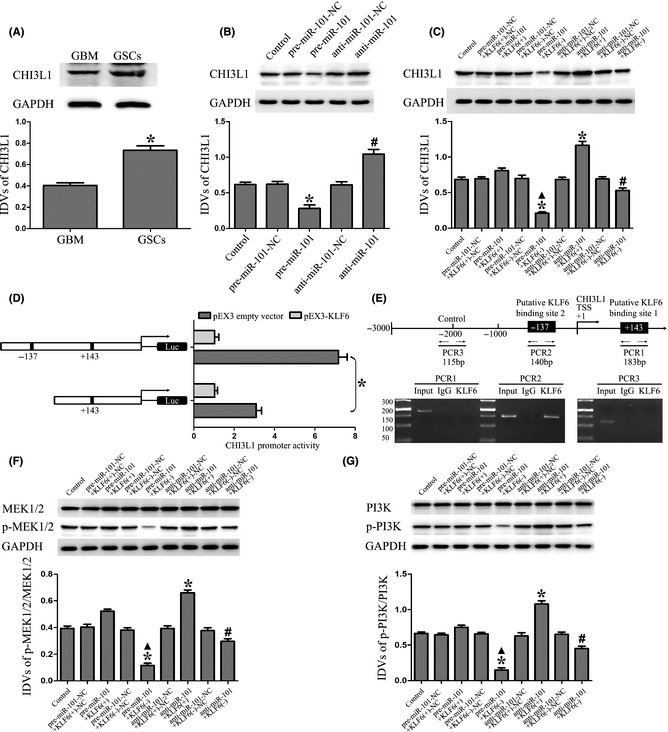
Overexpression of miR‐101 inhibited the expression of CHI3L1 and activation of MEK1/2 and PI3K pathways by downregulating KLF6. (A) CHI3L1 protein expression in GBM and GSCs. *P < 0.05 versus GBM group. (B) Western blot analysis of the CHI3L1 expression regulated by miR‐101 in GSCs. * P < 0.05 versus pre‐miR‐101‐NC group, # P < 0.05 versus anti‐miR‐101‐NC group. (C) Western blot analysis of the CHI3L1 expression regulated by miR‐101 and KLF6 in GSCs. The IDVs of CHI3L1 are shown using GAPDH as an endogenous control. *P < 0.05 versus control group, ▲ P < 0.05 versus pre‐miR‐101+KLF6(+) group, # P < 0.05 versus anti‐miR‐101+KLF6(+) group. (D) KLF6 on promoter activity of CHI3L1 in GSCs. The deletion construct on the promoter of CHI3L1 is shown in Y‐bar. X‐bar shows the promoter activity which has been normalized with the reference vector (pRL‐TK) and relative to the activity of pEX3 empty vector. (E) KLF6 bound to the promoter of CHI3L1 in GSCs. Putative KLF6 binding sites are indicated. ChIP analysis of immunoprecipitates from GSCs using normal rabbit IgG as a negative control. The immunoprecipitates were analyzed by PCR. (F) Western blot analysis of the p‐MEK1/2/MEK1/2 expression regulated by miR‐101 and KLF6 in GSCs. (G) Western blot analysis of the p‐PI3K/PI3K expression regulated by miR‐101 and KLF6 in GSCs. Data are presented as the mean ± SD (n = 5, each group). *P < 0.05 versus control group, ▲ P < 0.05 versus pre‐miR‐101+KLF6(+) group, # P < 0.05 versus anti‐miR‐101+KLF6(+) group.
To determine whether KLF6 could activate the promoter of CHI3L1, luciferase assays were performed. The position of transcription start site (TSS) was predicted by DBTSS HOME. KLF6 binds “CACCC” and “GC box” sequence which is the promoter elements of target genes 35, 36. Through the DNA sequence analyses between the 1000‐bp region upstream of the TSS and its 200‐bp downstream sequence, two putative KLF6 binding sites were confirmed. So the deletion construct was generated and assayed for the activity. Wild‐type, deletion construct, and putative KLF6 binding sites were indicated. Cotransfected with pEX3‐KLF6, CHI3L1 promoter activities were upregulated 7.17‐ and 3.1‐fold. Deletion of the −137 site region significantly reduced the promoter activity of CHI3L1. These results suggest that functional element which is necessary for high CHI3L1 promoter activity is likely to reside in the −137 site region of it (Figure 5D). To determine whether KLF6 interacts with the CHI3L1 promoter in vivo, ChIP assays were conducted. As shown in Figure 5E, there was an interaction of KLF6 with putative binding site 2 of CHI3L1. There was no interaction of KLF6 with the control region which was the 1000 bp upstream region of the putative binding site. These results demonstrated that KLF6 could upregulate the promoter activity and bind to the CHI3L1 promoter in GSCs.
As shown in Figure 5F, miR‐101 overexpression combined with KLF6 inhibition significantly decreased the p‐MEK1/2/MEK1/2 expression in GSCs as compared to control, and miR‐101 inhibition combined with KLF6 overexpression increased the p‐MEK1/2/MEK1/2 expression. Furthermore, KLF6 inhibition combined with miR‐101 overexpression or inhibition resulted in the decreased expression of p‐MEK1/2/MEK1/2 in GSCs as compared to KLF6 overexpression combined with miR‐101 overexpression or inhibition groups. The same changes of the p‐PI3K/PI3K expression were also observed as the expression of p‐MEK1/2/MEK1/2 in GSCs (Figure 5G). These results demonstrated that miR‐101 could inhibit the activation of MEK1/2 and PI3K pathways by downregulating KLF6.
Overexpressed miR‐101 Combined with Knockdown of KLF6 Suppressed Tumor Growth and had High Survival Rates in Nude Mice
As shown in Figure 6A,B, miR‐101 overexpression, KLF6 inhibition, or miR‐101 overexpression combined with KLF6 inhibition produced smaller tumors than control. miR‐101 overexpression combined with KLF6 inhibition resulted in smaller tumor volume than miR‐101 overexpression or KLF6 inhibition groups individually. In addition, miR‐101 overexpression combined with KLF6 inhibition made longer survival rate than miR‐101 overexpression or KLF6 inhibition groups individually, with a median survival of 25 days with control, 38 days with miR‐101 overexpression, 39 days with KLF6 inhibition, and 49 days with miR‐101 overexpression combined with KLF6 inhibition (Figure 6C). These data showed that nude mice carrying GSCs overexpressed miR‐101 combined with knockdown of KLF6 produced the smallest tumors and had the highest survival rate.
Figure 6.
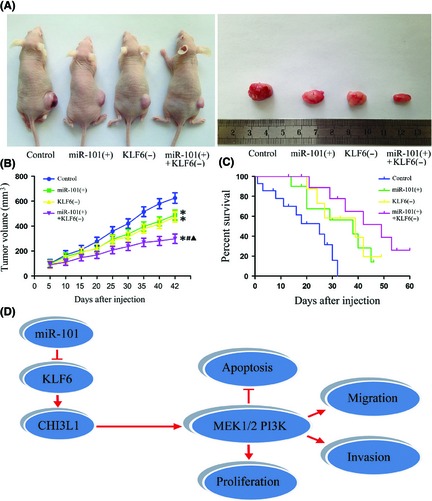
Tumor xenograft experiments. (A) Representative image for tumor growth is shown. Nude mice were subcutaneously injected in the right flank. A sample tumor from respective group was shown. (B) Tumor growth curves in nude mice. Tumor volume was calculated every 5 days after injection. *P < 0.05 versus control group, # P < 0.05 versus miR‐101 (+) group, ▲ P < 0.05 versus KLF6 (−) group. (C) The curves of survival for 60 days (n = 15). (D) The schematic cartoon of the mechanism underlying suppression of GSCs by miR‐101.
Discussion
In the present study, we demonstrated that miR‐101 expression was decreased in GSCs. In addition, overexpression of miR‐101 inhibited the proliferation, cell migration, and invasion, and promoted apoptosis of GSCs. However, there was a significant inverse correlation between miR‐101 and KLF6 expression. We further demonstrated that miR‐101 could inhibit KLF6 expression by targeting its 3′‐UTR. Furthermore, it was also confirmed that KLF6 was involved in the miR‐101‐mediated inhibition of GSCs malignant behaviors. Further, overexpression of miR‐101 inhibited the expression of CHI3L1 by downregulating KLF6 which could positively control the promoter activities via binding to the promoter of CHI3L1. Moreover, the MEK1/2 and PI3K signaling pathways were blocked by miR‐101 through targeting KLF6. The in vivo studies also showed that nude mice carrying GSCs overexpressed miR‐101 combined with knockdown of KLF6 produced the smallest tumors and had the highest survival rate.
Our present data indicated that miR‐101 was inversely correlated with histopathological grade of human glioma and was much lower in GSCs than that in their parental cells GBM, suggesting that it was a tumor suppressor in GSCs. In several types of cancers including neuroblastoma, miR‐101 has also been demonstrated to be downregulated 20, 25, 37, 38. To investigate the functional role of miR‐101 in GSCs, we conducted proliferation, cell migration, and invasion assay as well as flow cytometry, which confirmed that overexpression of miR‐101 inhibited proliferation, migration, invasion, and promoted apoptosis of GSCs. We identified miR‐101 as a tumor suppressor to inhibit the malignant behaviors of GSCs, thereby suppressing the growth and infiltration of GSCs, and highlighted the therapeutic potential of miR‐101 in GBM treatment. A growing number of studies have implicated that miR‐101 might act as a tumor suppressor to inhibit the expression of oncogenic genes 21, 22.
KLF6 was confirmed as the target of miR‐101 by assessing mRNA and protein levels after miR‐101 overexpression or inhibition. KLF6, a zinc finger transcription factor, is ubiquitously expressed in human tissues and has recently been discovered to regulate many pathways such as cell proliferation, apoptosis, differentiation, and development 39, 40. Further, we confirmed that KLF6 had an increased expression level in GSCs compared with GBM and NBTs, suggesting its oncogenic role in GSCs. This was consistent with the previous study showing that the spliced forms of KLF6 are oncogenic factor in human glioblastoma 41. Mechanistically, we identified KLF6 as a direct target of miR‐101 by dual‐luciferase reporter assay. It was indicated that miR‐101 might regulate gene expression by inhibiting translation through complementarity to targeted KLF6 mRNAs at the 3′‐UTRs. We further investigated that whether KLF6 mediated the tumor suppressor activity of miR‐101. Results indicated that overexpression of miR‐101 could inhibit proliferation, cell migration, invasion, and promote apoptosis of GSCs by downregulating KLF6. The in vivo studies also showed that nude mice carrying GSCs overexpressed miR‐101 combined with knockdown of KLF6 tumors produced the smallest tumors and had the highest survival rate. The smallest tumors produced by the combination of overexpressed miR‐101 and inhibited KLF‐6 suggested that other factors or signal pathways might be involved in this inhibitory effect, exhibiting a synergistic inhibitory effect of miR‐101 overexpression and KLF6 inhibition. Previous studies showed that overexpression of miR‐101 downregulated enhancer of zeste homolog 2 which could upregulate p53 expression in human lung cancer 38, 42, and KLF6 silencing upregulated p53 expression in hepatocellular carcinoma cell lines 43. Moreover, overexpressed miR‐101 could inhibit the activation of Wnt pathway and the expression of c‐myc which were upregulated by KLF6 inhibition 44, 45, 46. Taken together, the above factors and signal pathway might be involved in this synergistic inhibitory effect caused by the combination of overexpressed miR‐101 and inhibited KLF6, but the exhaustive mechanism needs to be further investigated.
CHI3L1, a member of 18‐glycosyl hydrolase family, plays an important role in disease onset and progression 47. It is a prognostic biomarker for poor survival in inflammation‐related disease and aggressive cancers 48, 49, 50. In addition, CHI3L1 has been shown to promote glioma proliferation and invasiveness, and its expression was correlated with aggressive and recurrent gliomas 48, 51, 52. Our results proved that CHI3L1 had an increased expression level in GSCs compared with GBM, suggesting the oncogenic role of it in GSCs. Furthermore, as there are two putative KLF6 binding sites in the CHI3L1 promoter, we determined whether miR‐101 could inhibit the expression of CHI3L1 by downregulating KLF6. Results showed that overexpression of miR‐101 inhibited the expression of CHI3L1 by downregulating KLF6. To further clarify the potential mechanisms of the regulation of CHI3L1 by KLF6, luciferase assay and ChIP assay were conducted. Results showed that KLF6 could promote the promoter activities of CHI3L1 via binding to the putative binding site 2 in promoter region.
CHI3L1 was found to promote the coordination of Syn‐1 and integrin αvβ3 and induce intracellular signaling of FAK and extracellular signal‐regulated kinase (ERK) 53, 54. Moreover, CHI3L1‐induced tumor cell survival was through phosphoinositide‐3‐kinase (PI3K)‐AKT activation, a common pathway that mediates survival of multiple types of cells 55, 56. CHI3L1 can increase proliferation and migration of bronchial smooth muscle cell through mitogen‐activated protein kinase (MAPK) pathway‐dependent mechanisms 57. Thus, the detection of MEK1/2 and PI3K signal pathways was carried out to illustrate the mechanisms underlying the KLF6‐dependent tumor suppressive effects on GSCs by miR‐101. Our study suggested that overexpression of miR‐101 inhibited the activation of MEK1/2 and PI3K pathways by downregulating KLF6. Therefore, the decreased expression of CHI3L1 might block the activation of MEK1/2 and PI3K signaling pathways to inhibit the proliferation, cell migration, invasion, and promote apoptosis of GSCs. The mechanism underlying suppression of GSCs by miR‐101 is schematically presented in Figure 6D.
In conclusion, our study revealed that overexpression of miR‐101 inhibited the proliferation, cell migration, invasion, and promoted apoptosis of GSCs by directly targeting KLF6. Downregulated KLF6 inhibited CHI3L1 expression and further blocked the activation of the MEK1/2 and PI3K signaling pathways. Therefore, miR‐101 may represent a promising therapeutic strategy for the treatment of human glioblastoma.
Conflict of Interest
The authors declare no conflict of interest.
Acknowledgments
This work is supported by grants from the Natural Science Foundation of China (81172197, 81171131, 81272564, 81272795, 81372484, and 81372682), the Natural Science Foundation of Liaoning Province in China (No. 201102300), Liaoning Science and Technology Plan Projects (No. 2011225020), Shenyang Science and Technology Plan Projects (nos. F11‐264‐1‐15, F12‐277‐1‐05, F13‐318‐1‐16, F13‐318‐1‐19, and F13‐220‐9‐15), and Outstanding Scientific Fund of Shengjing Hospital (No. 201304).
References
- 1. Bartek J Jr, Ng K, Bartek J, Fischer W, Carter B, Chen CC. Key concepts in glioblastoma therapy. J Neurol Neurosurg Psychiatry 2012;83:753–760. [DOI] [PubMed] [Google Scholar]
- 2. Wen PY, Kesari S. Malignant gliomas in adults. N Engl J Med 2008;359:492–507. [DOI] [PubMed] [Google Scholar]
- 3. Galli R, Binda E, Orfanelli U, et al. Isolation and characterization of tumorigenic, stem‐like neural precursors from human glioblastoma. Cancer Res 2004;64:7011–7021. [DOI] [PubMed] [Google Scholar]
- 4. Singh SK, Hawkins C, Clarke ID, et al. Identification of human brain tumour initiating cells. Nature 2004;432:396–401. [DOI] [PubMed] [Google Scholar]
- 5. Lee J, Kotliarova S, Kotliarov Y, et al. Tumor stem cells derived from glioblastomas cultured in bFGF and EGF more closely mirror the phenotype and genotype of primary tumors than do serum‐cultured cell lines. Cancer Cell 2006;9:391–403. [DOI] [PubMed] [Google Scholar]
- 6. Mazzoleni S, Politi LS, Pala M, et al. Epidermal growth factor receptor expression identifies functionally and molecularly distinct tumor‐initiating cells in human glioblastoma multiforme and is required for gliomagenesis. Cancer Res 2010;70:7500–7513. [DOI] [PubMed] [Google Scholar]
- 7. Singh SK, Clarke ID, Terasaki M, et al. Identification of a cancer stem cell in human brain tumors. Cancer Res 2003;63:5821–5828. [PubMed] [Google Scholar]
- 8. Chen J, Li Y, Yu TS, et al. A restricted cell population propagates glioblastoma growth after chemotherapy. Nature 2012;488:522–526. [DOI] [PMC free article] [PubMed] [Google Scholar]
- 9. Gilbert CA, Ross AH. Cancer stem cells: Cell culture, markers, and targets for new therapies. J Cell Biochem 2009;108:1031–1038. [DOI] [PMC free article] [PubMed] [Google Scholar]
- 10. Zhou BB, Zhang H, Damelin M, Geles KG, Grindley JC, Dirks PB. Tumour‐initiating cells: Challenges and opportunities for anticancer drug discovery. Nat Rev Drug Discov 2009;8:806–823. [DOI] [PubMed] [Google Scholar]
- 11. Bartel DP. MicroRNAs: Genomics, biogenesis, mechanism, and function. Cell 2004;116:281–297. [DOI] [PubMed] [Google Scholar]
- 12. Medina PP, Slack FJ. microRNAs and cancer: An overview. Cell Cycle 2008;7:2485–2492. [DOI] [PubMed] [Google Scholar]
- 13. Gangaraju VK, Lin H. MicroRNAs: Key regulators of stem cells. Nat Rev Mol Cell Biol 2009;10:116–125. [DOI] [PMC free article] [PubMed] [Google Scholar]
- 14. Ventura A, Jacks T. MicroRNAs and cancer: Short RNAs go a long way. Cell 2009;136:586–591. [DOI] [PMC free article] [PubMed] [Google Scholar]
- 15. Smits M, Nilsson J, Mir SE, et al. miR‐101 is down‐regulated in glioblastoma resulting in EZH2‐induced proliferation, migration, and angiogenesis. Oncotarget 2010;1:710–720. [DOI] [PMC free article] [PubMed] [Google Scholar]
- 16. Cao P, Deng Z, Wan M, et al. MicroRNA‐101 negatively regulates Ezh2 and its expression is modulated by androgen receptor and HIF‐1alpha/HIF‐1beta. Mol Cancer 2010;9:108. [DOI] [PMC free article] [PubMed] [Google Scholar]
- 17. Semaan A, Qazi AM, Seward S, et al. MicroRNA‐101 inhibits growth of epithelial ovarian cancer by relieving chromatin‐mediated transcriptional repression of p21(waf(1)/cip(1)). Pharm Res 2011;28:3079–3090. [DOI] [PubMed] [Google Scholar]
- 18. Wang HJ, Ruan HJ, He XJ, et al. MicroRNA‐101 is down‐regulated in gastric cancer and involved in cell migration and invasion. Eur J Cancer 2010;46:2295–2303. [DOI] [PubMed] [Google Scholar]
- 19. Pang Y, Young CY, Yuan H. MicroRNAs and prostate cancer. Acta Biochim Biophys Sin (Shanghai) 2010;42:363–369. [DOI] [PubMed] [Google Scholar]
- 20. Su H, Yang JR, Xu T, et al. MicroRNA‐101, down‐regulated in hepatocellular carcinoma, promotes apoptosis and suppresses tumorigenicity. Cancer Res 2009;69:1135–1142. [DOI] [PubMed] [Google Scholar]
- 21. Zhang Y, Guo X, Xiong L, et al. MicroRNA‐101 suppresses SOX9‐dependent tumorigenicity and promotes favorable prognosis of human hepatocellular carcinoma. FEBS Lett 2012;586:4362–4370. [DOI] [PubMed] [Google Scholar]
- 22. Schwarzenbacher D, Balic M, Pichler M. The role of microRNAs in breast cancer stem cells. Int J Mol Sci 2013;14:14712–14723. [DOI] [PMC free article] [PubMed] [Google Scholar]
- 23. Lu L, Tang D, Wang L, et al. Gambogic acid inhibits TNF‐alpha‐induced invasion of human prostate cancer PC3 cells in vitro through PI3K/Akt and NF‐kappaB signaling pathways. Acta Pharmacol Sin 2012;33:531–541. [DOI] [PMC free article] [PubMed] [Google Scholar]
- 24. Strillacci A, Griffoni C, Sansone P, et al. MiR‐101 downregulation is involved in cyclooxygenase‐2 overexpression in human colon cancer cells. Exp Cell Res 2009;315:1439–1447. [DOI] [PubMed] [Google Scholar]
- 25. Buechner J, Tomte E, Haug BH, et al. Tumour‐suppressor microRNAs let‐7 and mir‐101 target the proto‐oncogene MYCN and inhibit cell proliferation in MYCN‐amplified neuroblastoma. Br J Cancer 2011;105:296–303. [DOI] [PMC free article] [PubMed] [Google Scholar]
- 26. Li K, Liu C, Zhou B, et al. Role of EZH2 in the growth of prostate cancer stem cells isolated from LNCaP Cells. Int J Mol Sci 2013;14:11981–11993. [DOI] [PMC free article] [PubMed] [Google Scholar]
- 27. Visani M, de Biase D, Marucci G, et al. Expression of 19 microRNAs in glioblastoma and comparison with other brain neoplasia of grades I‐III. Mol Oncol 2014;8:417–430. [DOI] [PMC free article] [PubMed] [Google Scholar]
- 28. Bao S, Wu Q, McLendon RE, et al. Glioma stem cells promote radioresistance by preferential activation of the DNA damage response. Nature 2006;444:756–760. [DOI] [PubMed] [Google Scholar]
- 29. Ma J, Wang P, Liu Y, Zhao L, Li Z, Xue Y. Kruppel‐Like Factor 4 Regulates Blood‐Tumor Barrier Permeability via ZO‐1, Occludin and Claudin‐5. J Cell Physiol 2014;229:916–926. [DOI] [PubMed] [Google Scholar]
- 30. Workman P, Aboagye EO, Balkwill F, et al. Guidelines for the welfare and use of animals in cancer research. Br J Cancer 2010;102:1555–1577. [DOI] [PMC free article] [PubMed] [Google Scholar]
- 31. Zhao X, Monson C, Gao C, et al. Klf6/copeb is required for hepatic outgrowth in zebrafish and for hepatocyte specification in mouse ES cells. Dev Biol 2010;344:79–93. [DOI] [PMC free article] [PubMed] [Google Scholar]
- 32. Guo W, Keckesova Z, Donaher JL, et al. Slug and Sox9 cooperatively determine the mammary stem cell state. Cell 2012;148:1015–1028. [DOI] [PMC free article] [PubMed] [Google Scholar]
- 33. Nagata S, Hirano K, Kanemori M, Sun LT, Tada T. Self‐renewal and pluripotency acquired through somatic reprogramming to human cancer stem cells. PLoS ONE 2012;7:e48699. [DOI] [PMC free article] [PubMed] [Google Scholar]
- 34. Colman H, Zhang L, Sulman EP, et al. A multigene predictor of outcome in glioblastoma. Neuro Oncol 2010;12:49–57. [DOI] [PMC free article] [PubMed] [Google Scholar]
- 35. Kojima S, Hayashi S, Shimokado K, et al. Transcriptional activation of urokinase by the Kruppel‐like factor Zf9/COPEB activates latent TGF‐beta1 in vascular endothelial cells. Blood 2000;95:1309–1316. [PubMed] [Google Scholar]
- 36. Warke VG, Nambiar MP, Krishnan S, et al. Transcriptional activation of the human inducible nitric‐oxide synthase promoter by Kruppel‐like factor 6. J Biol Chem 2003;278:14812–14819. [DOI] [PubMed] [Google Scholar]
- 37. Hu Z, Lin Y, Chen H, et al. MicroRNA‐101 suppresses motility of bladder cancer cells by targeting c‐Met. Biochem Biophys Res Commun 2013;435:82–87. [DOI] [PubMed] [Google Scholar]
- 38. Cho HM, Jeon HS, Lee SY, et al. microRNA‐101 inhibits lung cancer invasion through the regulation of enhancer of zeste homolog 2. Exp Ther Med 2011;2:963–967. [DOI] [PMC free article] [PubMed] [Google Scholar]
- 39. Black AR, Black JD, Azizkhan‐Clifford J. Sp1 and Kruppel‐like factor family of transcription factors in cell growth regulation and cancer. J Cell Physiol 2001;188:143–160. [DOI] [PubMed] [Google Scholar]
- 40. Bieker JJ. Kruppel‐like factors: Three fingers in many pies. J Biol Chem 2001;276:34355–34358. [DOI] [PubMed] [Google Scholar]
- 41. Tchirkov A, Sapin V, Marceau G, et al. Increased expression of the oncogenic KLF6‐SV1 transcript in human glioblastoma. Clin Chem Lab Med 2010;48:1167–1170. [DOI] [PubMed] [Google Scholar]
- 42. Xia H, Zhang W, Li Y, Guo N, Yu C. EZH2 silencing with RNA interference induces G2/M arrest in human lung cancer cells in vitro. Biomed Res Int 2014;2014:348728. [DOI] [PMC free article] [PubMed] [Google Scholar]
- 43. Sirach E, Bureau C, Peron JM, et al. KLF6 transcription factor protects hepatocellular carcinoma‐derived cells from apoptosis. Cell Death Differ 2007;14:1202–1210. [DOI] [PubMed] [Google Scholar]
- 44. Wang L, Zhang X, Jia LT, et al. c‐Myc‐mediated epigenetic silencing of MicroRNA‐101 contributes to dysregulation of multiple pathways in hepatocellular carcinoma. Hepatology 2014;59:1850–1863. [DOI] [PubMed] [Google Scholar]
- 45. Strillacci A, Valerii MC, Sansone P, et al. Loss of miR‐101 expression promotes Wnt/beta‐catenin signalling pathway activation and malignancy in colon cancer cells. J Pathol 2013;229:379–389. [DOI] [PubMed] [Google Scholar]
- 46. Sangodkar J, Shi J, DiFeo A, et al. Functional role of the KLF6 tumour suppressor gene in gastric cancer. Eur J Cancer 2009;45:666–676. [DOI] [PMC free article] [PubMed] [Google Scholar]
- 47. Henrissat B, Bairoch A. New families in the classification of glycosyl hydrolases based on amino acid sequence similarities. Biochem J 1993;293(Pt 3):781–788. [DOI] [PMC free article] [PubMed] [Google Scholar]
- 48. Ku BM, Lee YK, Ryu J, et al. CHI3L1 (YKL‐40) is expressed in human gliomas and regulates the invasion, growth and survival of glioma cells. Int J Cancer 2011;128:1316–1326. [DOI] [PubMed] [Google Scholar]
- 49. Nutt CL, Betensky RA, Brower MA, Batchelor TT, Louis DN, Stemmer‐Rachamimov AO. YKL‐40 is a differential diagnostic marker for histologic subtypes of high‐grade gliomas. Clin Cancer Res 2005;11:2258–2264. [DOI] [PubMed] [Google Scholar]
- 50. Lee CG, Da Silva CA, Dela Cruz CS, et al. Role of chitin and chitinase/chitinase‐like proteins in inflammation, tissue remodeling, and injury. Annu Rev Physiol 2011;73:479–501. [DOI] [PMC free article] [PubMed] [Google Scholar]
- 51. Phillips HS, Kharbanda S, Chen R, et al. Molecular subclasses of high‐grade glioma predict prognosis, delineate a pattern of disease progression, and resemble stages in neurogenesis. Cancer Cell 2006;9:157–173. [DOI] [PubMed] [Google Scholar]
- 52. Pelloski CE, Mahajan A, Maor M, et al. YKL‐40 expression is associated with poorer response to radiation and shorter overall survival in glioblastoma. Clin Cancer Res 2005;11:3326–3334. [DOI] [PubMed] [Google Scholar]
- 53. Shao R, Hamel K, Petersen L, et al. YKL‐40, a secreted glycoprotein, promotes tumor angiogenesis. Oncogene 2009;28:4456–4468. [DOI] [PMC free article] [PubMed] [Google Scholar]
- 54. Francescone RA, Scully S, Faibish M, et al. Role of YKL‐40 in the angiogenesis, radioresistance, and progression of glioblastoma. J Biol Chem 2011;286:15332–15343. [DOI] [PMC free article] [PubMed] [Google Scholar]
- 55. Chetty C, Lakka SS, Bhoopathi P, Rao JS. MMP‐2 alters VEGF expression via alphaVbeta3 integrin‐mediated PI3K/AKT signaling in A549 lung cancer cells. Int J Cancer 2010;127:1081–1095. [DOI] [PMC free article] [PubMed] [Google Scholar]
- 56. Inoue T, Meyer T. Synthetic activation of endogenous PI3K and Rac identifies an AND‐gate switch for cell polarization and migration. PLoS ONE 2008;3:e3068. [DOI] [PMC free article] [PubMed] [Google Scholar]
- 57. Tang H, Sun Y, Shi Z, et al. YKL‐40 induces IL‐8 expression from bronchial epithelium via MAPK (JNK and ERK) and NF‐kappaB pathways, causing bronchial smooth muscle proliferation and migration. J Immunol 2013;190:438–446. [DOI] [PubMed] [Google Scholar]