

Abstract
Objectives: The luminal surface of the gut is lined with a monolayer of epithelial cells that acts as a nutrient absorptive engine and protective barrier. To maintain its integrity and functionality, the epithelium is renewed every few days. Theoretical models are powerful tools that can be used to test hypotheses concerning the regulation of this renewal process, to investigate how its dysfunction can lead to loss of homeostasis and neoplasia, and to identify potential therapeutic interventions. Here we propose a new multiscale model for crypt dynamics that links phenomena occurring at the subcellular, cellular and tissue levels of organisation.
Methods: At the subcellular level, deterministic models characterise molecular networks, such as cell‐cycle control and Wnt signalling. The output of these models determines the behaviour of each epithelial cell in response to intra‐, inter‐ and extracellular cues. The modular nature of the model enables us to easily modify individual assumptions and analyse their effects on the system as a whole.
Results: We perform virtual microdissection and labelling‐index experiments, evaluate the impact of various model extensions, obtain new insight into clonal expansion in the crypt, and compare our predictions with recent mitochondrial DNA mutation data.
Conclusions: We demonstrate that relaxing the assumption that stem‐cell positions are fixed enables clonal expansion and niche succession to occur. We also predict that the presence of extracellular factors near the base of the crypt alone suffices to explain the observed spatial variation in nuclear beta‐catenin levels along the crypt axis.
Introduction
Tissue renewal and regeneration are crucial for the survival and longevity of multicellular organisms. Replacement of the outer layers of the epidermis, for instance, ensures maintenance of the skin's structure and mechanical properties, despite its continuous and direct exposure to a wide range of damaging factors (1). Another rapidly renewing tissue, the intestinal epithelium, is completely replaced every 2–3 and 3–5 days in mice and humans, respectively (2, 3). This process is driven by a small number of stem cells located at the base of the crypts of Lieberkühn (Fig. 1). It has been estimated that there are about 20 million of these crypts in the human large intestine (4). Intestinal stem cells are believed to proliferate occasionally, producing on average one replacement stem cell and one semi‐differentiated transit cell. These transit‐amplifying cells divide several times, while migrating upwards, before undergoing terminal differentiation. At the crypt orifice, mature cells are shed into the intestinal lumen (5).
Figure 1.

Normal colonic mucosa. (a) Microdissection image courtesy of the Department of Pathology, Ninewells Hospital, Dundee, UK. The circular structures correspond to cross‐sections of crypts of Lieberkühn. The space between these glands contains connective tissue (the lamina propria), blood vessels and lymphatics. (b) Schematic of a colonic crypt. The epithelial cells lining the crypts reside on a basement membrane. Murine and human intestinal crypts contain about 250 and 2000 epithelial cells, respectively (4, 20).
Extensive experimental evidence demonstrates that Wnt signalling plays a central role in maintaining the intestinal stem‐cell niche and regulating normal crypt dynamics (6, 7, 8). In particular, it has been proposed that a spatial gradient of extracellular Wnt factors along the crypt axis determines position‐dependent rates of cell proliferation, differentiation and death (9). Wnt signalling is initiated when extracellular Wnt factors bind to specific receptors on the cell surface. This triggers a cascade of intracellular reactions, leading eventually to the inhibition of a protein complex containing the APC tumour suppressor. As this destruction complex is responsible for maintaining cytoplasmic β‐catenin at low levels, inactivation of the complex leads to accumulation of β‐catenin, which then travels to the nucleus, binds to a transcription factor of the TCF/LEF family, and induces transcription of Wnt targets. These include genes coding for proteins involved in cell‐cycle control, migration and apoptosis. Mutations in key components of the Wnt pathway, such as APC and β‐catenin, are responsible for the initiation of the vast majority of colorectal cancers, including most hereditary cases (6). It is notable that β‐catenin is a multifunctional protein that is essential not only for Wnt signalling but also for cell–cell adhesion (10, 11, 12). At the cell membrane, it binds to the cytoplasmic tail of E‐cadherin (13), which constitutes the primary component of lateral adherens junctions.
Despite the fact that the large bowel is an extensively studied system, several fundamental biological questions remain unanswered. The position and number of intestinal stem cells have, for example, still to be confirmed experimentally. It is also unclear how different cellular processes are regulated and coordinated to maintain crypt homeostasis. As a crypt is a complex, highly‐regulated system, a theoretical approach is valuable for attaining deeper understanding of its dynamics. Mathematical and computational modelling, in particular, are powerful tools that can provide insights that complement and reinforce knowledge acquired by experimental methods (14, 15, 16). Models for crypt dynamics have, for instance, been used to investigate the mechanisms of cell migration (e.g., 17), tissue recovery following irradiation (e.g., 18), malignant transformation (e.g., 19), and stem‐cell dynamics (e.g., 20). Existing models, including these, were generally created to answer specific questions and, therefore, focused largely on a single level of organisation (for example, subcellular pathways).
Until recently, the majority of mathematical models have treated cells as black boxes, with prescribed properties, and have been used to predict their behaviour at the tissue level. In contrast, bioinformatics aims to understand processes at the gene and protein level. Systems biology is generally defined as the study of multiple interacting pathways. All these approaches operate at a specific scale (or small number of scales) and constitute a vital first step in analysing biological systems from a theoretical viewpoint. Biological function, however, arises from the complex interplay between many processes that operate on (and across) different length and time scales. Recent advances in computational resources mean that it is now possible to build and simulate detailed multiscale models of complex biological systems, linking subcellular, cellular and macroscale components and phenomena (21, 22, 23, 24). Here we adopt such an integrative approach to construct a virtual colonic crypt and investigate its properties. In our model, every virtual cell carries a continuum cell‐cycle control model that is coupled to an intracellular Wnt signalling network: given a certain Wnt stimulus, the Wnt model determines availability of key components of the cell‐cycle model, which in turn defines whether a cell is ready to divide or differentiate. As a natural consequence, spatial variations in the extracellular Wnt signal translate into position‐dependent cell proliferation and differentiation rates. Furthermore, as Wnt signalling is allowed to interfere with cell–cell junctions, variable adhesion can occur within our in silico crypts. At the macroscale, a mechanical model based on Meineke et al. (25), describing the attachment of cells to the underlying substrate and the attractive/repulsive forces between cells, determines cell migration. The tessellation‐based model of Meineke et al. has two major advantages over earlier two‐dimensional grid models (e.g., 17): the in silico cells have polygonal shapes that resemble real cells, and cell division results in local cell rearrangements only, preventing the breaking of numerous cell–cell contacts after each cell division. The level of detail incorporated into each level of organisation enables us to manipulate model settings and parameter values, and assess their effects on the behaviour of the system as a whole.
The remainder of this paper is organised as follows. In the next section, we focus on the technical details of our work. We introduce the lattice‐free model of Meineke et al., which forms the basis for our multiscale intestinal crypt (25). The new features that we incorporate include coupling cellular processes (for example, cell division) and mechanical features (for example, cell–cell adhesion) to key subcellular pathways, such as Wnt signalling and cell‐cycle control. In the Results section, we use our model to carry out a large number of microdissection and labelling‐index experiments in silico, providing new insight into the interpretation of assays of this type. In addition, we track individual cells and lineages in time, and compare our model simulations with results from recent clonal expansion experiments (26, 27). We also examine the links between Wnt signalling and cell–cell adhesion in the gut (10, 11). Finally, in the Discussion, we summarise our key findings, highlighting advantages and limitations of our multiscale approach, before discussing directions for further research. A summary of the notation and the parameter values we use is provided in the Appendix.
Multiscale model
We have modelled the three‐dimensional tubular crypt as an unfolded rectangular surface with periodic boundary conditions on the left and right sides (Fig. 1b) (for details on the implementation of the required periodicity, see (28)) and monitored a discrete set of points, representing cell centres. The structure of the multiscale model used to obtain the behaviour of every point is depicted in Fig. 2. It includes three interlinked modules; namely, a Wnt signalling model, a cell‐cycle model and a mechanical model. In response to inter‐ and extracellular signals, the Wnt model provides two important pieces of information: intracellular gene expression levels for target proteins and an intercellular ‘adhesion potential’ for the cell as a whole. The former influence production of key cell‐cycle control proteins, whereas the latter affects the strength of adhesion/repulsion forces between neighbouring cells. Following Meineke et al. (25), we have characterised the connections between adjacent cells as springs and used the Voronoi tessellation generated by the cell centres to define the size and shape of each cell. Below, we summarise the Meineke et al. model and then explain the new features that have been incorporated.
Figure 2.

Schematic of our multiscale model for the dynamics of a colonic crypt. During a model simulation, the occurrence of cellular events (proliferation, differentiation, migration) is monitored at discrete time steps, tn. By coupling Wnt signalling, cell cycle, and mechanical models, we are able to predict the spatio‐temporal behaviour of every cell at time tn+1, given the state of the system at time tn (e.g. intracellular protein levels, cell position, Wnt stimulus, location of neighbouring cells) and the system parameters.
The Meineke et al. model
Below, we summarise the assumptions underpinning the Meineke et al. model (25); for further details the reader is referred to the original paper. A crypt from the small intestine is modelled as a two‐dimensional cylindrical surface populated with stem, transit and differentiated cells. The model also accounts for the presence of Paneth cells, which are absent from most of the large intestine. Cellular processes, which are monitored at discrete times, tn (tn +1 = tn + Δt, with Δt a small time step), are characterised as follows:
-
•
Cell division: Only stem and transit cells can divide. Following division, a new cell‐cycle time is assigned to each daughter cell. The duration of the G1 phase is assumed to be a uniformly‐distributed random variable, whereas the duration of the remaining phases of the cell cycle is kept constant. The ‘direction of division’ is stochastic: one daughter cell occupies the site of the mother cell, while the other is placed a fixed distance, L 0, away.
-
•
Cell differentiation: Stem cells divide asymmetrically (one daughter cell remains in the stem‐cell pool, whereas the other becomes a transit cell). Transit cells undergo terminal differentiation after a fixed number of generations.
-
•
Cell death: The model does not account explicitly for cell death. Instead, cells that move above the top of the crypt are no longer monitored.
-
•
Cell migration: Stem and Paneth cells do not move in the Meineke et al. model. The displacement of transit and differentiated cells is driven by mitotic pressure. The centres of neighbouring cells are attached by linear, over‐damped springs (Fig. 3); the movement of cell i depending on Fi, the net spring force it experiences at time tn:
Figure 3.

Schematic diagram of the mechanical model. Black points correspond to cell centres. Each pair of neighbouring cells (identified using a Delaunay triangulation) is attached by a spring. Solid lines represent the associated Voronoi tessellation, which is a partition of two‐dimensional space that assigns a polygon Pi to each cell centre ci such that all points in Pi are closer to ci than to any other cell centre. Five neighbouring cells surround the central cell i, highlighted in grey.
| (1) |
with the damped motion of the cell centre being defined by
| (2) |
In (1), (2), µ is the spring constant connecting any pair of adjacent cells, η is the drag coefficient, ri denotes the position vector of the centre of cell i, and uij is a unit vector pointing from i to j. The sum in eqn (1) is over all cells j that are adjacent to cell i. As the bottom of the crypt is filled with stationary Paneth and stem cells, proliferation‐mediated compression of springs leads to upward movement. The equilibrium spring length between cells i and j is constant and equal for every cell type (i.e. Lij(t) ≡ L), unless i and j are newborn sister cells in which case the equilibrium spring length increases linearly from L 0 to L during M phase (this prevents cells from springing apart abruptly).
-
•
Cell shape and size: Given the positions of cell centres, cell shape and size are determined from the associated Delaunay triangulation and Voronoi tesselation (Fig. 3).
In the next section, we explain how we have adapted this model to develop a multiscale approach. The most important new feature is the coupling between subcellular and cellular phenomena (Fig. 2), with nonlinear ordinary differential equations (ODEs) describing the behaviour of the Wnt signalling pathway and cell‐cycle control.
Modelling Wnt signalling
To account for the regulatory role of the Wnt pathway, we impose a Wnt profile on the two‐dimensional crypt surface. The lowest and highest Wnt‐factor levels are located at the top and bottom of the crypt, respectively. For simplicity, we assume that the signal remains unchanged during a given simulation and that cell i detects only the Wnt level at its centre. To characterise the cells’ Wnt response, we use a recent model of the Wnt pathway (29), formulated as a system of nonlinear ODEs (summarised in the Appendix), that predicts temporal changes in concentrations of 10 components of the Wnt pathway within a single cell. During our multiscale simulations, we solve the system of ODEs numerically for each cell i to calculate concentrations at time tn +1 based on initial concentrations and Wnt exposure at time tn. In particular, since the Wnt model incorporates the dual role of β‐catenin in Wnt signal transduction and cell–cell adhesion, we can quantify the levels of adhesion and transcription complexes (CAiand CTi, respectively, for cell i).
Wnt‐dependent cell‐cycle model
We have used the level of transcription complexes, CTi, and associated target‐protein synthesis rates to link the output of the Wnt model to the cell‐cycle model proposed by Swat et al. (30). We chose this particular model because it includes cyclin D, a known Wnt target that, together with c‐myc, promotes G1/S transition and thereby cell proliferation (cf. 31). The model equations are provided in the Appendix. According to the resulting Wnt‐dependent cell‐cycle (WCC) model, cells exposed to a strong Wnt signal can produce cyclin D faster and, consequently, progress more quickly through the cell cycle than cells exposed to low Wnt. Hence, inclusion of a spatially varying Wnt signal into our multiscale model gives rise to cell cycles whose duration is position‐dependent. Additionally, due to the cell‐cycle model's bistability, there is a threshold Wnt level below which the G1/S checkpoint can never be passed. We view such growth‐arrested cells as differentiated. Local cell rearrangements can occasionally cause a cell to re‐enter more favourable Wnt conditions and, in particular, to undergo dedifferentiation. It is important to point out that a cell's dedifferentiation probability strongly depends on its position along the crypt axis (that is, on how far the cell has to migrate downwards against the general cell‐movement stream in order to reach favourable Wnt conditions). These predictions are in agreement with the ‘spiral model of cell and tissue organisation’ and account for the experimental observation that crypts can recover following stem cell depletion (32).
Figure 4 illustrates the impact of the WCC model on our multiscale model. Figure 4a depicts the predicted cell‐cycle times as a function of distance along the vertical crypt axis for a crypt populated with motionless cells (that is, every cell is exposed to a constant Wnt signal throughout its cell cycle); the corresponding Wnt stimulus is shown in the lower panel. Figure 4b, in contrast, shows the actual cell‐cycle times recorded during a multiscale‐crypt simulation. For every cell, we plotted the cell‐cycle time as a function of the cell's position at the time of division. The deviation between Figs. 4a and 4b is due to cell displacements taking place in the crypt: during the course of their cell cycle, in silico cells move upwards into gradually lower Wnt environments. Consequently, the recorded cell‐cycle times are shorter than would be anticipated from the Wnt exposure level at division. This is best exemplified by those cells in Fig. 4b that proliferate under no‐Wnt conditions (that is, more than 10 length units away from the crypt base). These cells had already committed to cell division before entering an unfavourable Wnt region. Hence, Fig. 4 reveals the effects of interactions taking place across different time and length scales (extracellular Wnt factors, Wnt signalling, cell‐cycle control, proliferation and migration), and thus reflects the truly multiscale nature of our virtual crypt.
Figure 4.

Predicted position‐dependent cell‐cycle times in the intestinal crypt. Distance along the vertical crypt axis is expressed in units of length L. The total height of the virtual crypt is 25. (a) Duration of the cell cycle as predicted by the WCC model alone (Wnt model + Cell‐cycle model). The curve corresponds to motionless cells exposed to a constant Wnt level. The predicted Wnt threshold for cell division is about 0.66. (b) Duration of the cell cycle as a function of cell position at division, as predicted by our multiscale crypt model (Wnt model + Cell‐cycle model + Mechanical model). Here, due to upward cell migration, cells are exposed to decreasing Wnt levels during their cell cycle. (c) Normalised Wnt stimulus as a function of height along the crypt axis.
Modelling cell–cell and cell–matrix adhesion
As we represent three‐dimensional cells of fixed height by a two‐dimensional model, cells adhere to their neighbours and underlying substrate by one‐dimensional cell–cell contact edges and two‐dimensional cell–matrix contact areas, respectively. In Meineke et al.'s model, the attractive and repulsive forces due to cell–cell interactions depend only on whether the spring connecting the cell centres is under tension or compression. As spring parameters are assumed to be constant, cell–cell bonds have the same strength for any pair of neighbouring cells. Consequently, distant neighbouring cells are strongly attracted towards each other even when their cell–cell contact edge is very short. Here we relax the assumption that the strength of the spring connecting two cells is constant and suppose instead that it increases as the cell–cell contact length expands. The spring constant, µij(t), depends on eij(t), the length of the edge between neighbouring cells i and j, in the following way:
| (3) |
where L is distance between neighbouring cell centres in an equilibrim, hexagonal lattice. We note that in such a regular lattice, eij(t) ≡ L/√3 and µij (t) ≡ µ so that we recover the original Meineke et al. model.
Regarding cell–cell adhesion, in addition to equation (3) we have considered another layer of complexity. At the molecular level, it is the number of lateral junctions that determines the strength of the bond between two adjacent cells. To take this into account, we quantified the Wnt‐dependent concentration of adhesion complexes (CAi), based on Van Leeuwen et al. (29), and then used this information to derive an expression for the spring constant between cells i and j, thereby explicitly linking cell–cell adhesion to Wnt signalling:
| (4) |
with i and j adjacent cells and Qij the number of effective adhesion‐complexes between these cells. The perimeter and surface area of cell * are denoted as E * and B *, respectively. Finally, symbol QA (≈ 3.02) is a β‐catenin scaling factor, defined as the number of effective adhesion complexes per cell edge in a hexagonal lattice in the absence of a Wnt signal (the scaling factor guarantees that under equilibrium conditions, equation (4) reduces to µij(t) ≡ µ). (2), (4) illustrate how we couple Wnt signalling to cell migration.
Intestinal epithelial cells are not only anchored to each other, but also adherent to their basement membrane (Fig. 1). In the original Meineke et al. model, this cell–matrix adhesion was assumed to give rise to a drag term, the associated drag coefficient being constant. We relax this assumption, supposing instead that the drag coefficient is proportional to the surface area of contact between a cell and the underlying basement membrane (as the surface increases, the number of focal adhesions binding the cell to the basement membrane will increase). Therefore, we suppose that ηi(t), the damping constant of each cell i, is a linearly increasing function of its surface area, Bi
| (5) |
with d 0 = 0.1 and d 1 = 2(1 – d 0)/(√3L 2). For an equilibrium, hexagonal lattice we have Bi ≡ √3L 2/2 and, thus, recover the Meineke et al. model, with ηi(t) ≡ η.
Additional model assumptions
We described above how, in our multiscale model, an intracellular Wnt‐dependent cell‐cycle model determines when a cell is ready to divide. Following Meineke et al. (25), the direction of division is random in our simulations. However, daughter cells are now placed a fixed distance, L 0/2, in opposite directions from the mother cell, so that the centre of mass is conserved. Several other features distinguish our approach from that of Meineke et al. (25). We consider colonic crypts and, therefore, do not include Paneth cells. Furthermore, we do not pin stem cells at the base of the crypt: we allow them to move freely in response to local spring‐mediated biomechanical forces. Movement of cells below the bottom of the crypt is prevented as follows. Any cell centre pushed off the lower edge of the two‐dimensional surface is moved to a new position located a distance λ above the edge, with λ a uniformly‐distributed random variable taking values between 0 and 0.05L. This simple manipulation reproduces the effects of attractive and repulsive forces that exist between cells at the spherical base of a real crypt. As will be shown in the Results section, stem cell mobility has a significant impact on crypt dynamics by enabling gradual replacement of the stem‐cell pool. Hence, the directions of division and migration will determine whether a cell leaves or remains within the stem‐cell niche, the niche being defined by a strong Wnt signal. As stem cells are no longer immortal, niche succession can take place (20, 33).
For our simulations, the in silico cells were initially started at equilibrium, each pair of neighbouring cells being separated by a distance L so that they form a regular, hexagonal lattice (for example, 23 cells per crypt circumference and 30 cells per crypt side). The simulation is stopped when the crypt reaches a quasi‐steady state in which the cell production rate equals the cell removal rate. It is this state that constitutes the starting point for our virtual experiments at the initial instant t = 0.
Default multiscale crypt model
The modular nature of the multiscale model enables us to easily modify individual assumptions and analyse their effects on the system as a whole (Fig. 2). In what follows, we will start from the simplest possible version of our model that we term the default multiscale crypt (DMC) model, and gradually incorporate new layers of complexity such as a detailed model of the Wnt signalling pathway and area‐dependent cell‐matrix adhesion. The DMC model is characterised by the following settings:
-
•
Wnt profile: The Wnt signal decreases linearly from one at the crypt base to zero at the orifice. (A normalised signal of strength one corresponds to a maximum Wnt exposure situation in which the Wnt receptors are continuously stimulated.)
-
•
Cell‐cycle model: At the start of the simulation, we assign a G1 time from a uniform distribution to each cell. The duration of G2, M and S phases is assumed to be constant. When the total cell‐cycle time elapses, a cell divides producing two daughter cells, both sensitive to their surroundings. If the extracellular Wnt level is favourable, the newborn cells are assigned new cell‐cycle times. Under adverse conditions, cells leave the cell cycle and differentiate.
-
3
• Mechanical model: We assume equal spring parameter values for all cells. Stem cells are not fixed in position.
Technology aspects: Integrative Biology and the Cancer, Heart and Soft Tissue Environment (Chaste) project
The work presented in this paper was carried out as part of the Integrative Biology project (34), an international endeavour that aims to build and simulate detailed multiscale models of the heart (e.g., 35), and colorectal cancer (e.g., 36). The modelling efforts revealed a number of computational demands, which are likely to arise in any project of this kind. First, commercial software packages, such as MatLab and Mathematica, which are often used by individual researchers to solve small numerical problems, are unsuitable for large‐scale models and research teams. Second, the code has to be robust, fast, efficient, and well documented. Third, the software has to be flexible, so that it can easily be extended to accommodate new biological information and models. Finally, general functions, such as mesh operators, ODE solvers, finite‐element methods and parameter‐estimation procedures, need to be designed in such a way that they can be used for different applications. Meeting these technological needs led to the creation of the Cancer, Heart and Soft Tissue Environment (Chaste) project, which is designed to produce well‐engineered computational tools for biomedical applications (28, 37).
The key features of Chaste are as follows:
-
•
Implementation: The main Chaste code is written in C++.
-
•
Software engineering approach: Chaste is based on an agile software‐development technique known as eXtreme Programming (XP). The primary practices are: (i) test‐driven development; (ii) pair programming, combined with pair rotation; (iii) collective code ownership; and (iv) creation of high‐quality supporting infrastructure and documentation.
-
•
Graphics: A crypt visualisation tool was created in Java. The user can choose to display the network of springs (Delaunay triangulation) or the shapes of cells (Voronoi tessellation). Cells can be coloured according to their type, mutation status, or intracellular β‐catenin localisation. Partial results can be plotted while a simulation is still running.
-
•
Computational demands: Simulating the dynamics of a representative crypt for 3 days (based on a multiscale model with subcellular Wnt and cell‐cycle ODEs) requires about one computing hour on a Linux PC with a 2GHz processor.
-
•
Cancer Chaste team: The number of authors on this paper reflects the size of the team (including software engineers, scientific programmers and mathematicians) involved in building the multiscale crypt models, developing the Chaste framework and implementing the code.
-
•
Open source: Chaste is freely available under an open source license from http://www.comlab.ox.ac.uk/Chaste.
Results
Mitotic labelling indexes
Mitotic labelling experiments are widely used to generate information about the cytokinetic organisation and dynamics of intestinal crypts (e.g., 38, 39). These experiments involve injecting laboratory rodents intraperitoneally with a substance (3HTdR or BrdU) that is incorporated into cells during the S phase of the cell cycle. When a labelled cell divides, it produces two labelled daughter cells. As a consequence of subsequent cell division and migration events, distribution of label within the crypt changes over time. Information on this distribution is obtained by dissecting the crypts longitudinally and recording positions of labelled cells along the two dissection lines. Given a sample containing a certain number of crypts, the outcome of the experiment is summarised in the form of a labelling‐index (LI) curve, showing percentage of labelled cells per cell position at the time of sacrifice.
We have used our multiscale model to perform a large number of in silico LI experiments. At time t = 0, we labelled every cell that was in S phase. The simulation proceeds under the assumption that labelled cells behave in the same manner as their unlabelled counterparts, except that they transmit label to their daughters. After a fixed time, we stop the simulation and cut the resulting crypt longitudinally (see Fig. 5). In a perfect dissection, the angle of section, θ, would be 90° (Fig. 5a,c). However, to emulate the level of precision achieved experimentally, we select θ randomly, subject only to the constraint that cells from both the base and top of the cylinder must be included in the section. Thereafter, from the bottom of the crypt upwards, we enumerate those cells whose nuclei are within a fixed range from the dissection line (Fig. 5c,d). Finally, by averaging the results of a large number of independent crypt simulations, we calculate how the percentage of labelled cells varies with position along the dissection line.
Figure 5.

Virtual dissection experiments. θ is the angle of section. (a) Vertical section of a cylindrical crypt and (c) corresponding dissection lines on the two‐dimensional rolled‐out surface. (b) Skewed section of the same crypt and (d) resulting dissection lines. The numbers in (c) and (d) represent the recorded cell positions along the dissection lines. In (c), there are labelled cells at positions 1, 2, 3, 4, and 5 along the dissection lines. In (d), the labelled cells are at positions 1, 2, 3, 5, 6 and 7, for the same crypt.
In Fig. 6 we present results from a set of virtual microdissection experiments performed with our DMC model. LIs were obtained 40 min and 9 h after exposure to the label. Figure 6a corresponds to LI data obtained from simulations mimicking real experiments. Importantly, working in silico enables us to assess whether these LI data reflect true localisation of the labelled cells. To this end, we calculated the average number of labelled cells as a function of distance from the crypt base (Fig. 6b), with distance expressed in units of length L, and compared these with the outcome of our LI experiments. The simple WCC model included in our DMC crypt gives rise to clearly segregated proliferative and differentiated populations (see the two populations in the NN‐crypt in the Appendix). We also detect an abrupt boundary between labelled and unlabelled cells in the averaged data (Fig. 6b). In contrast, standard microdissection experiments provide LI curves that descend gradually (Fig. 6a), suggesting a smooth decrease in the percentage of labelled cells with increasing distance from the crypt base. The data also suggest that some labelled cells are able to reach positions as high as 30 in 9 h. We thus conclude that standard LI experiments may tend to overestimate the position of the labelled cells. The discrepancies between Figs. 6a and 6b are not only due to dissection artefacts illustrated in Fig. 5, but also partly to the chosen model crypt geometry and associated cell packing. In the Discussion section, we will address crypt‐geometry and cell size‐related issues in more detail.
Figure 6.

Virtual labelling‐index experiments. Data obtained from 250 crypt simulations performed with our DMC model. (a) Percentage of labelled cells per position along the dissection lines (Fig. 5c,d). Bullet points and crosses correspond to results obtained 40 min and 9 h after labelling, respectively. (b) True percentage of labelled cells as a function of distance from the virtual crypt base. Grey and black bars represent the results obtained 40 min and 9 h after labelling, respectively; whiskers show the corresponding variances. Height along the crypt axis is expressed in units of length L.
Clonal expansion and niche succession
Analysis of mitochondrial DNA (mtDNA) mutations has recently provided new insight into long‐term crypt dynamics. A cell contains thousands of mitochondria, each carrying several mtDNA copies. Consequently, only those cells with a significant percentage of mutant mtDNA molecules will express a mutant phenotype (for example, cytochrome c oxidase (CcO) deficiency). Taylor, Wright, McDonald and co‐workers (26, 27, 40) have applied dual histochemistry techniques to human colon samples in order to distinguish wild‐type (brown‐stained) from CcO deficient (blue‐stained) cells. In addition to wild‐type crypts, they observed crypts either partially or wholly filled with blue cells. In the former, ‘there is a ribbon of CcO‐deficient cells within an otherwise normal crypt that is entirely compatible with the view that there are multiple stem cells in some crypts’ (27).
Our multiscale model is ideally suited to study expansion of a clonal population in silico. The main advantage is the ability to follow the clone's progress in real time, something that is impossible with current experimental techniques. In Fig. 7, columns I and II depict six snapshots from a simulation performed with the Meineke et al. model (25). The two columns show exactly the same sequence but display cells according to different criteria: at time t = 0 (top panels), in column I we view every single cell as a clone of size one and, therefore, give it a different colour; in column II we highlight one particular single‐cell clone (blue) and distinguish between differentiated cells (pink), proliferative cells (yellow) and motionless stem cells (green). Hence, column I shows how clonal composition of the crypt changes, whereas column II highlights how the blue‐labelled population evolves in time. The results in column II reveal that, according to the model by Meineke et al., the blue‐stained stem cell invariably generates a thin, blue trail that moves upwards towards the crypt's orifice. Discontinuities in the clone can occur, due to waiting times between consecutive cell divisions. Importantly, although the trail's pattern can change in time, it is unable to expand laterally. Meineke et al.'s approach thus fails to explain the broad, wavy CcO‐deficient ribbons described by Taylor et al. (27). This model limitation is a consequence of the assumption that stem‐cell positions are fixed: this enforces asymmetric division (stem cells are ‘immortal’) and prevents propagation of the label within the stem‐cell pool.
Figure 7.

Clonal expansion in the crypt. Each column shows six snapshots from two independent in silico experiments performed with the Meineke et al. (columns I and II) and DMC (columns III and VI) model, respectively. At time t = 0 (see arrows in upper row), a single cell is stained with a blue dye. This label is transmitted from generation to generation without losing intensity, giving rise to a clonal population of blue‐stained cells. Row 2: t = 40 h; row 3: t = 100 h; row 4: t = 300 h; row 5: t = 800 h; row 6: t = 1340 h. Columns I and III show the clonal composition of the crypt. At time t = 0 (row 1), every cell in the crypt is regarded as a clonal population of size one and therefore given a different colour. Initially there are about 240 lineages. Columns II and IV highlight how the blue‐labelled populations evolve in time. Proliferative and differentiated cells are represented in yellow and pink, respectively. In column II, the stem cells, which are pinned to the base of the crypt, are highlighted in green. In the DMC simulation (columns III and IV), the population highlighted in blue eventually takes over the crypt (i.e. after 1340 h only one of the original lineages remains). As niche succession is a purely stochastic process, every stem cell has a probability 1/NS of becoming dominant, with NSthe number of stem cells.
Columns III and IV of Fig. 7 show the outcome of an analogous simulation carried out with our DMC model. Here stem cells are not pinned to their initial positions and, in particular, local cell rearrangements determine whether, following stem‐cell division, daughter cells remain in the stem‐cell pool or not. Hence, depending on the fate of their daughter cells, stem cells can effectively divide asymmetrically (renewing themselves and producing a transit cell) or undergo symmetric division (producing two stem cells or two transit cells). As a result, a certain level of replacement takes place within the stem‐cell pool. Over time, clonal populations will either continue expanding in size (for example, blue‐stained lineage in III and IV) or become extinct (for example, any other lineage in III and IV). In our simulations, different lineages have no selective advantage over each other and, thus, the crypt's clonal progression is purely stochastic. As exemplified in column III, the progeny of one stem cell can eventually take over the whole stem‐cell pool. This phenomenon is often termed niche succession and leads to the formation of a monoclonal crypt (20). Our model predictions are therefore consistent with experimental evidence obtained by McDonald et al. (26) and have important biomedical implications. For example, it has been proposed that monoclonal, mutant crypts constitute the earliest stage of colorectal adenomas (41). These monocryptal lesions can expand further by crypt fission (40).
Variable cell–cell and cell–matrix adhesion
In order to assess the effect of model assumptions, we considered four possible scenarios, labelled as follows:
-
(NN)
DMC model (constant spring parameters);
-
(YN)
Area‐dependent cell–matrix adhesion;
-
3
(NY) Contact edge‐dependent cell–cell adhesion; and
-
(YY)
Contact edge‐dependent cell–cell adhesion and cell size‐dependent cell–matrix adhesion.
To compare their impact on cell kinetics, we followed the dynamics of a DMC crypt for 800 h and then repeated the exercise for each of the other settings above; results are summarised in Fig. 8 (the resulting crypts are shown in the Appendix). The left panel shows average cell area as a function of cell position along the vertical crypt axis, whereas the right panel provides the corresponding average shape values (defined as cell perimeter2/area). In an equilibrium hexagonal lattice (broken lines), every cell has a surface area of √3L 2/2 ≅ 0.866 and shape value 8√3 ≅ 13.86. First, under YN, we incorporated cell size‐dependent cell–matrix adhesion into the model, by assuming that the damping constant of every cell is a linearly increasing function of its surface area (eqn 5). Comparing this with the NN data, we observe that YN cells located near the base of the crypt are larger than their NN counterparts (Fig. 8a). That is, in the YN crypt there are substantially fewer cells concentrated at the very bottom of the crypt. This model prediction can be explained as follows. From (2), (5) we deduce that if two cells of different sizes are attached by a compressed spring, they move apart at different velocities, the smaller cell moving more rapidly than the larger one. Consequently, small newborn cells leave the base of the crypt quicker than in the DMC model.
Figure 8.

Dependence of cell size and geometry on cell adhesion. Simulation time = 800 h (the resulting crypts are shown in the Appendix). NN = DCM model; YN = area dependent cell–matrix adhesion only; NY = contact‐edge dependent cell–cell adhesion only; YY = contact‐edge dependent cell–cell adhesion and cell‐size dependent cell–matrix adhesion; EQ = values for hexagonal equilibrium lattice. The distance from the crypt base, y, is expressed in units of length L. (a) Average cell area as a function of cell position. (b) Average shape value (perimeter2/area) as a function of cell position.
We then incorporated contact‐edge‐dependent cell–cell adhesion into our DMC model (NY). Interestingly, in Fig. 8b, the NY curve is closer to the equilibrium value (broken line) than the NN curve, which means that the NY model extension causes cells to become more hexagonal in shape. Furthermore, in contrast to the previous model extension (YN), we now obtain a densely populated crypt, with small cells packed closely together throughout the entire crypt (Fig. 8a). These changes distort LI curves (not shown), as sections cut through a higher number of nuclei, and have important repercussions for crypt dynamics. When cells divide, their perimeters and contact edges shorten and, as a consequence of eqn (3), their spring constants decrease accordingly. Consequently, as the simulation evolves, the reciprocal forces exerted by neighbouring cells continue to drop gradually, which could eventually lead to a critical situation in which migration ceases completely. The abrogation of cell displacement and resulting crypt degeneration can, however, be prevented by accounting for both variable cell–matrix and cell–cell adhesion (YY).
Predicting intracellular β‐catenin localisation
The observation that β‐catenin is not only a central player in Wnt signalling, but also in E‐cadherin‐mediated cell–cell adhesion, has stimulated a debate about how its dual function is regulated (11, 12). On the one hand, it has been proposed that the fate of β‐catenin is simply determined by competition between its binding partners (Hypothesis I). If β‐catenin binds to the transcription factor TCF/LEF, it will act in Wnt signalling, whereas if it binds to an adhesion molecule it will move to the cell membrane. On the other hand, it has been suggested that extracellular Wnt stimuli induce a conformational change in β‐catenin that favours TCF/LEF binding (Hypothesis II; 11). Phosphorylation of β‐catenin at Tyr‐142 provides a possible mechanism (42). We have recently developed a mathematical model of the Wnt signalling network to investigate these two hypotheses (29). By incorporating this signalling model into our integrative model, we can now gain further multicellular, spatial insight into their biological implications.
To compare the hypotheses above, we ran two equivalent crypt simulations, based on Hypotheses I (purely competitive scenario) and II (two molecular forms of β‐catenin), respectively. At every time step, the Wnt model (29) quantifies concentrations of adhesion complexes (β‐catenin bound to E‐cadherin), CAi, and transcription complexes (β‐catenin bound to TCF/LEF), CTi. Given the final crypts obtained from the simulation, the Chaste graphics tool enables us to display these two β‐catenin pools on the membrane and the cytoplasm, respectively. Results presented in Fig. 8 show that β‐catenin distribution pattern depends on whether Hypothesis I or II is active. Under Hypothesis I, near the base of the crypt, where the Wnt signal is strongest, high levels of β‐catenin are found both on the cell membranes and in the cell nuclei (Fig. 9a). Under Hypothesis II, in contrast, at the bottom of the crypt, Wnt signalling can sequester β‐catenin from the cell membrane (Fig. 9b). Finally, near the top of the crypt, where extracellular Wnt stimulus is absent, β‐catenin is located predominantly in cell–cell adhesion complexes, independent of which hypothesis is active. Indeed, according to the Wnt model, under long‐term no‐Wnt conditions, the two hypotheses are undistinguishable and the steady‐state levels of adhesion and transcription complexes are CAi* = 18.14 nM and CTi* = 2.54 nM, respectively (29).
Figure 9.

Subcellular localisation of β‐catenin based on the Wnt model proposed by Van Leeuwen et al. ( 29 ) coupled to the cell‐cycle model by Swat et al. ( 30 ). Duration of the simulation = 630 h. Small crypts have been used here, to facilitate visualisation of β‐catenin's localisation. (a) and (b) show the model predictions according to Hypotheses I (purely competitive scenario) and II (two forms of β‐catenin), respectively. In (b), the rate of Wnt‐induced change of conformation of β‐catenin has been chosen such that cell–cell adhesion decreases with increasing Wnt. (c) Level of intracellular transcription complexes, CTi (nM). (d) Level of membrane‐bound adhesion complexes, CAi (nM).
Discussion
Biological systems are characterised by feed‐forward and feed‐back loops, not only within a particular time and length scale, but also across scales. Thus, to understand fully the (mal)function of complex biological systems, we must develop integrative models that link phenomena operating at (and across) different spatial and temporal scales. This is a non‐trivial task that can very quickly lead to a computationally intractable model. It is therefore essential to choose carefully which processes are modelled, and to simplify them as much as possible. In this paper, we have presented a multiscale model that describes intestinal tissue renewal and which couples the following fundamental processes (Fig. 2):
-
•
Subcellular level: Wnt signalling, cell–cell adhesion and cell‐cycle control;
-
•
Cellular level: Cell division, migration and differentiation;
-
•
Macroscale level: Extracellular Wnt profile, cell–cell adhesion, and cell–matrix adhesion.
Following Meineke et al. (25), we modelled connections between cells as springs and used the Voronoi tesselation associated with the cell centres to determine size and shape of every cell in the aggregate. However, instead of assuming that cell‐cycle progression, cell–matrix adhesion and differentiation states are intrinsic properties of cells, we allowed these features to be influenced by intra‐, inter‐ and extracellular cues. The resulting multiscale model has the advantage that it can be used, for example, to investigate how specific manipulations propagate across organisation levels, analyse the effect of genetic alterations on crypt dynamics (for example, mutations in the Wnt network), and explore potential interactions between phenomena occurring at different levels of organisation.
In this paper, we have used our model to investigate the effect of Wnt signalling and variable cell adhesion on turnover of cells within a normal colonic crypt. Each cell carries its own intracellular Wnt signalling and cell‐cycle models, and these dictate whether it will divide or differentiate. In addition, since β‐catenin is a key player in both signal transduction and E‐cadherin‐mediated adhesion, Wnt signalling can interfere with cell–cell adhesion, and vice versa. As a result, by superimposing a Wnt profile on the two‐dimensional crypt surface (cf. 9), the model naturally predicts position‐dependent rates of proliferation, differentiation and cell–cell adhesion. Hence, the Wnt model plays a central role in regulating crypt dynamics. Concerning adhesion, the original Meineke et al. (25) approach did not distinguish between forces of adhesive activity at cell interfaces and those in the cytoskeleton, as the drag coefficient in eqn (2) blends dissipation in cells and friction at cell boundaries (with the underlying matrix or with neighbours). We have overcome this biomechanical weakness by incorporating contact edge‐dependent cell–cell adhesion and cell size‐dependent cell–matrix adhesion. Hence, whereas in Meineke et al. the Voronoi tesselation constitutes a mere visualisation tool (Fig. 3), in our integrative model it can influence cell movement indirectly.
Among the new insights gained from our simulations, we highlight the following. First, virtual clonal expansion experiments reveal that stem cell motility, and subsequent gradual replacement of the stem‐cell pool, make niche succession and monoclonal conversion possible. This is in agreement with predictions from other, spatially‐averaged models (20, 33), and recent mtDNA mutation studies (26, 27). Second, we can predict intracellular localisation of β‐catenin, thereby providing a new tool for studying interactions between cell–cell adhesion and Wnt signalling (11, 12). Third, virtual microdissection experiments suggest that LI data tend to overestimate position of the labelled cells and are therefore unlikely to provide an accurate image of distribution of proliferative cells in the crypt. Fourth, our integrative model reveals that presence of Wnt factors at the very bottom of the crypt suffices to emulate observed position‐dependent nuclear β‐catenin levels and proliferative hierarchy in the colonic crypt. This is due to a delay in elimination of transcription complexes when cells move upwards into a no‐Wnt environment. Hence, a Wnt gradient along the vertical crypt axis is not essential for normal crypt dynamics. Finally, one of the major advances of a mathematical modelling approach is that it can provide dynamic information. For instance, in silico it is feasible to dissect the same crypt twice at different times after labelling, something that is impossible in vivo. We can also track the spatio‐temporal behaviour of every single cell in real time, as illustrated in Fig. 7. These data complement the static information obtained through empirical mtDNA studies (26, 27, 40), and should lead to a deeper understanding of crypt dynamics and monoclonal conversion.
Two particularly interesting, distinctive features of our multiscale model are the gradual nature of differentiation and associated interpretation of stemness. Previous modelling approaches have considered stemness as an intrinsic property of cells: that is, a high self‐renewal capacity (e.g., 25) or a long cell‐cycle time (43). Similarly, transit‐amplifying cells have been defined as rapidly cycling cells with intrinsic limited self‐renewal capacity. Here, in contrast, both the replicative lifespan and the duration of the cell cycle depend on the availability of extracellular Wnt factors and, thus, indirectly on cell migration. Consequently, in the context of our model, there are neither transit nor stem cells per se, but a continuum range of cells that proliferate at different rates. Plasticity of these ‘semi‐differentiated cells’ is best illustrated by acceleration of the cell cycle predicted in response to downward migration along the crypt axis (Fig. 4). The composition of our virtual crypts and degree of reversibility of cell differentiation are consistent with conclusions from existing mathematical models (19, 32), as well as with results from recent empirical studies (44). Our approach has serious implications for tumourigenesis, as it affords aberrant semi‐differentiated cells the ability to increase their replicative capacity under certain conditions and in particular, to become cancer stem cells (45, 46, 47, 48). That is, in our model, every semi‐differentiated cell constitutes a potential target for malignant transformation (49).
In an attempt to minimise the complexity of the model, we have oversimplified some phenomena involved in crypt dynamics. First, we consider the pool of terminally differentiated cells to be homogeneous and, therefore, do not characterise the specific behaviour and function of different specialised cell types, such as goblet, columnar and neuroendocrine cells (in the small intestine, the presence of Paneth cells further complicates the situation). Second, for the current version of our work, we also ignore any cross‐talk between epithelial and stromal cells. Mesenchymal cells, for instance, may play a key role in maintaining the crypt niche (8). Third, regarding Wnt signalling, we do not model receptor–ligand interactions explicitly. In particular, the Wnt profile represents an effective Wnt signal detected by a cell, rather than an extracellular Wnt factor concentration. Consequently, the levels and roles of different Wnt factors (e.g., Wnt‐1 and Wnt‐2 proteins) are not taken into account. We also exclude the question of whether the gradients in one crypt influence those of the neighbouring crypts. Furthermore, the model could also be extended to encompass connective tissue and blood vessels surrounding the crypts, thereby making it possible to account for additional macroscale features and phenomena, such as blood supply, metabolite diffusion, and cell adaptation under varying nutrient availability. The necessary modules could, for instance, be developed following Alarcón et al. (50) and Smallbone et al. (51). Finally, there are no biological mechanisms regulating cell death: cells are simply removed from the system when they reach the top of the crypt. To simulate cell shedding properly, we would need to accommodate biochemical networks that regulate programmed cell death as well as biomechanical cell detachment (5). At the macroscale, this poses the additional problem of dealing with gaps in the tissue.
Our current modelling efforts are concentrated in refining the multiscale model in two ways (Fig. 2); namely constructing more realistic crypt geometry and introducing cell‐size control. Below we expand briefly on each of these model developments and their motivation. Concerning crypt geometry, here we have modelled the three‐dimensional crypt as a circular cylinder, thereby ignoring the rounded shape of the crypt base. This assumption has the undesired effect of overestimating the number of stem cells, which has a significant impact on macroscale features, such as the distribution of labelled cells and the niche succession time (Fig. 6). To improve the quality of our predictions, we have devised a second type of virtual crypt. In this model, in silico cells are constrained to populate a fixed surface in three‐dimensional space. The surface is defined as the set of points (x, y, z) satisfying a condition z = f(x, y), where f is chosen in such a way that the resulting surface resembles a colonic crypt (with vertical axis x = z = 0). Instead of computing the spatio‐temporal behaviour of every cell directly on the surface, we consider their projection onto the plane z = 0. We can then employ the existing Chaste framework to obtain the Voronoi tessellation for the two‐dimensional plane projection.
In vivo the size of an epithelial cell results from gradual cell‐growth processes, which depend on the availability of nutrients and growth factors in the surrounding medium, the cell's metabolic rate, and progress through the cell cycle. In the tesselation‐based approach, however, cell size and shape are determined solely by the relative spatial position of adjacent cells in the two‐dimensional aggregate (Fig. 3). Consequently, cells can only adopt polygonal shapes dictated by the Voronoi tesselation. Moreover, during a representative crypt simulation, the changes in size of a single cell do not follow a typical biological growth curve. Instead, cell size suffers from random noise caused by relative movement of its neighbours. Furthermore, as the Voronoi tesselation is recalculated after division, daughter cell sizes can differ substantially from half the size of the original mother cell. Finally, cell death cannot be included directly: cells adjacent to an apoptotic cell would undergo sudden, unrealistic changes in geometry to refill the resulting gap in the tissue. A better control of cell size is thus needed in our multiscale model. To achieve this goal, we are investigating various alternative mechanical models (for critical reviews on modelling cell aggregates, see (52) and (53)). Cell‐vertex models, for instance, monitor spatio‐temporal dynamics of the cell's vertices, instead of their centres, thereby ruling over its boundaries and gaining control of its size (54, 55).
Figure 10 exemplifies the kind of experimental data on intestinal tissue dynamics and morphology currently available to modellers: images of intestinal crypts revealing blue‐stained (CcO‐deficient) clones (Fig. 10a), LI curves (Fig. 10b), and high‐resolution three‐dimensional images showing both crypt and cell geometry (Fig. 10c,d). Unfortunately, as most experimental methods yield qualitative output, there is still insufficient quantitative information to fully parameterise, calibrate and validate our multiscale model. In particular, accurate values for many kinetic cell‐cycle and Wnt signalling coefficients are lacking. Consequently, at this stage, only those predictions that are qualitative in nature can be directly compared with the experimental data (see column IV of Fig. 7, and Fig. 10a). Other useful applications of the present model include enhancing our understanding of generic behaviour of the system, comparing alternative mechanisms of action (e.g., β‐catenin patterns in Fig. 9), generating new hypotheses (e.g., Fig. 6), providing dynamic insight that complements static empirical information (e.g., column IV in Fig. 7, and Fig. 10a), and identifying those parameter values that have the most dramatic effect on the system's dynamics and which should, therefore, be determined most accurately. We are actively collaborating with several experimental groups, not only to measure such parameters, but also to test in the laboratory some of the hypotheses generated from our modelling efforts. Importantly, we anticipate that, as further data become available, our model will provide increasingly more specific predictions, for instance, on the average duration of niche succession, and fit the LI data in Fig. 10b. In summary, limited availability of high‐quality quantitative data constitutes a major bottleneck hampering full exploitation of mathematical modelling techniques in biology and medicine. This highlights an urgent need for generation of such data and, in particular, for development of techniques to extract quantitative information from empirical data (Fig. 10a,c,d). We hope that the simulations presented here will stimulate further progress in this direction.
Figure 10.

Examples of available experimental data on intestinal tissue architecture and dynamics. (a) Intestinal crypt showing a ribbon of CcO deficient cells; image from (61), reproduced with permission. (b) Labelling indexes obtained 2 h (○), 24 h (•) and 48 h (□) after exposure to bromodeoxyuridine. For the corresponding methodology, see the Appendix. (c) Three‐dimensional rendered image of the surface of mouse colon. The nuclei (blue) are stained with DAPI and F‐actin (red) is stained with rhodamine phalloidin. Whole‐mount of tissue imaged using a multiphoton microscope. Scale bar = 60 µm. (d) Three‐dimensional rendered image of mouse colon stained for F‐actin showing the arrangement of the tube‐like crypt lumen. Whole‐mount of tissue imaged using a multi‐photon microscope. Scale bar = 60 µm. Images (c) and (d) courtesy of Dr. Paul Appleton, Näthke Lab, Cell and Developmental Biology, University of Dundee.
The multiscale nature of our model opens the door to a myriad of in silico experiments. In a follow‐up to this paper that focuses entirely on normal intestinal tissue renewal, we will investigate the effect of mutations in subcellular networks (Wnt signalling) on the crypt as a whole. In particular, we will use our multiscale model to compare top‐down and bottom‐up hypotheses for crypt invasion (41, 56), and investigate whether not only stem cells, but also transit cells, could be targets for malignant transformation. Thereafter, we will extend the model to characterise the early stages of colorectal carcinogenesis. In the cylindrical and projection models described above, the shape of the virtual crypt remains unchanged throughout the simulation period. Although this may be a good approximation for normal crypts, a more flexible approach is required to describe deformation and buckling of the basement membrane occurring during crypt budding and fission. Developing an integrative tissue remodelling approach constitutes a serious mathematical challenge; to date intestinal tissue folding has been addressed for crypt sections only (e.g., 57, 58). A second exciting line of research is applying our multiscale model to examine the role of various feedback loops and, in particular, to investigate interactions between phenomena occurring at different spatial and temporal scales. Among such applications are Wnt‐mediated contact inhibition (59) and dilution of intracellular macromolecules by cell growth processes.
Acknowledgements
The authors wish to thank Owen Sansom and Mohammad Ilyas for fruitful discussions on Wnt signalling and crypt dynamics and Eleanor Boston, Carina Edwards and Matthew Johnston for their participation in various Chaste programming sessions. We gratefully acknowledge the support provided by the EPSRC (GR/S72023/01 and EP/F011628). P.K.M. was partially supported by a Royal Society Wolfson Merit Award. P.M. and P.K.M. were partly supported by NIH Grant U56CA113004 from the National Cancer Institute. B.D. thanks Cancer Research UK for financial support. HMB and PKM were partially supported by PMI2 (British Council).
Notation
| Abbreviation | Interpretation |
|---|---|
| 3HTdR | 3H‐methyl‐thymidine (tritiated thymidine) |
| APC | Adenomatosis polyposis coli tumour suppressor gene |
| CcO | Cytochrome c oxidase |
| Chaste | Cancer, Heart, and Soft Tissue Environment Project |
| CRC | Colorectal cancer |
| DMC | Default multiscale crypt model |
| LI | Position‐dependent labelling index (i.e. percentage of labelled cells per position along the dissection line) |
| ODE | Ordinary differential equation |
| WCC | Wnt‐dependent cell‐cycle model (i.e. 30 coupled to 29) |
| XP | Extreme programming |
| Symbol | Interpretation |
| ηi(t) | Drag coefficient for cell i |
| η | Constant drag coefficient (cf. 25) |
| λ | Uniformly distributed random variable (new distance above crypt base) |
| µij(t) | Spring constant for neighbouring cells i and j |
| µ | Spring constant. In the simulations we use µ/η = 0.01 (cf. 25) |
| Bi(t) | Surface area of two‐dimensional cell i |
| CAi(t) | Concentration of adhesion complexes in cell i |
| CTi(t) | Concentration of transcription complexes in cell i |
| ci(t) | Centre of cell i, ci = (xi, yi) |
| d 0 = 0.1 | Cell–matrix adhesion parameters |
| d 1 = 1.04 | |
| eij(t) | Length of contact edge between cells i and j |
| Ei(t) | Perimeter of cell i |
| Fi(t) | Total spring force acting on cell i |
| Lij(t) | Equilibrium spring length for cells i and j |
| L 0 | Dimensionless initial distance between two daughter cells |
| L = 1 | Dimensionless distance between adjacent cells in an equilibrium, hexagonal lattice |
| NS(t) | Total number of stem cells |
| Pi(t) | Voronoi polygon associated with ci |
| Qij(t) | Number of adhesion complexes between cells i and j |
| Q A ≈ 3.02 | Adhesion complexes per cell edge in an equilibrium lattice in the absence of Wnt |
| ri(t) | Position vector for cell i's centre |
| S ω(x, y) | Wnt signal at position (x, y) |
| t | Time |
| tn | Discrete simulation time, tn +1 = tn + Δt with Δt = 30 s (cf. 25). |
| uij(t) | Unit vector pointing from the centre of cell i to the centre of cell j |
| y | Height up vertical crypt axis (expressed in units of length L) |
Differential cell–cell adhesion
(A1)

[ Variable cell–cell and cell‐matrix adhesion. Same data as shown in Fig. 7 (simulation time = 800 h). Proliferative and differentiated cells are represented in pale and dark grey, respectively. (NN) Simulations performed with the default multiscale crypt (DMC) model; (YN) DMC model extended to include area‐dependent drag (5); (NY) DMC model extended to include edge‐dependent adhesion (3); (YY) DMC model extended to include both edge‐dependent cell–cell adhesion and area‐dependent drag ((3), (5)). ]
The Wnt signalling module
The Wnt module (cf. 29) provides expressions for the change in the levels of active APC complex, D, free axin, X, free cell–cell adhesion molecules, A, free transcription factors, T, and six molecular forms of β‐catenin (Ci, for i = A, c, cT, o, oT, u).
-
•
APC‐mediated degradation of β‐catenin
-
•
Cytoplasmic β‐catenin:
 |
-
•
E‐cadherin‐mediated cell–cell adhesion
• Transcription of Wnt‐target genes
where [CF] = [Cc] + [Co] and [CT] = [CcT] + [CoT]. The transcription complexes, CT, induce the transcription of the Wnt target genes. The symbols si denote synthesis/assembly rates of the substrate/complex indicated as subscript. Similarly, di denote degradation/dissociation rates. The symbol pc represents the Tyr‐phosphorylation rate of open‐form β‐catenin. Finally, pu is the rate of Ser/Thr‐phosphorylation of β‐catenin by the APC complex. The values of dD, dDx, dX and pc are assumed to increase linearly with the strength of the Wnt signal, S ∞. For further details on the Wnt signalling module, such as the chosen parameter values, the reader is referred to the original paper (29).
The WCC model
The cell‐cycle model proposed by Swat et al. (30) characterises the dynamics of the following molecular components of the cell‐cycle control system: phosphorylated and unphosphorylated retinoblastoma protein (i.e. pRbp and pRb, respectively), the transcription factor E2F1, and active and inactive cyclin D kinase complexes (i.e. CycDa and CycDi, respectively).
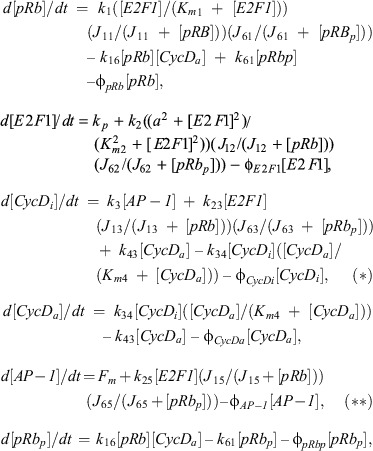 |
where the k's and φ's are non‐negative rate constants, the K's and J's (Michaelis‐Menten) dissociation constants, and Fm the mitotic stimulus. For a detailed description of this model and the values of the parameters, see (30). To couple the Wnt signalling and cell‐cycle networks above, we assume that cyclin D is a Wnt target, and rewrite equation (*) accordingly:
 |
where [CT] is the total level of β‐catenin‐transcription‐factor complexes given by the Wnt model (i.e. we do no longer need equation (**)). The scaling factor σ = 6 × 10⁻³ accounts for the fact that β‐catenin and AP‐1 are present at very different levels within the cell (e.g. according to Swat et al. (30), 8 × 10⁻³ < [AP‐1] < 1.24 nM, whereas in Lee et al. (60), 25 < [β‐catenin] < 155 nM).
Methodology for colon bromodeoxyuridine scoring
Wild‐type C57BL/6 mice were given a single intraperitoneal injection of 0.25 ml of bromodeoxyuridine (BrdU) (Amersham Biosciences, Little Chalfont, UK) (Fig. 10). Mice were sacrificed at 2, 24 and 48 h post‐injection, with three mice in each group. The entire colon was dissected from each mouse and was fixed and processed for histology. BrdU immunohistochemistry was performed on the sections using mouse anti‐BrdU antibody (BD Biosciences, Oxford, UK).
Briefly, slides were de‐waxed in xylene and rehydrated through a gradient of ethanol to water. Antigen retrieval was performed in citrate buffer (Labvision, Astmoor, Runcorn, UK) at 99.9 °C for 20 min. Endogenous peroxidase activity was blocked in 3% hydrogen peroxide solution for 20 min and non‐specific binding prevented by incubation in 10% normal horse serum for 30 min. Mouse anti‐BrdU (BD Biosciences) diluted 1/500 in 10% normal horse serum was applied for 1 h at room temperature, followed by biotinylated anti‐mouse antibody for 30 min. Antibody binding was detected using the streptavidin‐biotin method (Vectastain Elite ABC kit, Vector Laboratories, Peterborough, UK) and 3,3‐diaminobenzidine as chromogen (Vector Laboratories).
The number and position of the BrdU‐labelled cells was scored in 25 colonic crypts in each mouse. The mean number of labelled cells at each position within the crypt was then calculated for each time‐point. This was used to generate the cumulative frequency plots, demonstrating the change in the position of labelled cells at the three time‐points.
References
- 1. Alonso L and Fuchs E (2003) Stem cells of the skin epithelium. Proc Natl Acad Sci USA 100, 11830–11835. [DOI] [PMC free article] [PubMed] [Google Scholar]
- 2. Okamoto R, Watanabe M (2004) Molecular and clinical basis for the regeneration of human gastrointestinal epithelia. J. Gastroenterol. 39, 1–6. [DOI] [PubMed] [Google Scholar]
- 3. Ross MH, Kaye GI, Pawlina W (2003) Histology: A Text and Atlas. Philadelphia: Lippincott Williams & Wilkins. [Google Scholar]
- 4. Potten CS, Booth C, Hargreaves D (2003) The small intestine as a model for evaluating adult tissue stem cell drug targets. Cell Prolif. 36, 115–129. [DOI] [PMC free article] [PubMed] [Google Scholar]
- 5. Bullen TF, Forrest S, Campbell F, Dodson AR, Hershman MJ, Pritchard DM, Turner JR, Montrose MH, Watson AJ (2006) Characterization of epithelial cell shedding from human small intestine. Lab. Invest. 86, 1052–1063. [DOI] [PubMed] [Google Scholar]
- 6. Ilyas M (2005) Wnt signalling and the mechanistic basis of tumour development. J. Pathol. 205, 130–144. [DOI] [PubMed] [Google Scholar]
- 7. Sansom OJ, Reed KR, Hayes AJ, Ireland H, Brinkmann H, Newton IP, Batlle E, Simon‐Assmann P, Clevers H, Nathke IS, Clarke AR, Winton DJ (2004) Loss of Apc in vivo immediately perturbs Wnt signaling, differentiation, and migration. Genes Dev. 18, 1385–1390. [DOI] [PMC free article] [PubMed] [Google Scholar]
- 8. Van de Wetering M, Sancho E, Verweij C, De Lau W, Oving I, Hurlstone A, Van Der Horn K, Batlle E, Coudreuse D, Haramis AP, Tjon‐Pon‐Fong M, Moerer P, Van Den Born M, Soete G, Pals S, Eilers M, Medema R, Clevers H (2002) The β‐catenin/TCF‐4 complex imposes a crypt progenitor phenotype on colorectal cancer cells. Cell 111, 241–250. [DOI] [PubMed] [Google Scholar]
- 9. Gaspar C, Fodde R (2004) APC dosage effects in tumorigenesis and stem cell differentiation. Int. J. Dev. Biol. 48, 377–386. [DOI] [PubMed] [Google Scholar]
- 10. Gottardi CJ, Gumbiner BM (2004) Distinct molecular forms of β‐catenin are targeted to adhesive or transcriptional complexes. J. Cell Biol. 167, 339–349. [DOI] [PMC free article] [PubMed] [Google Scholar]
- 11. Harris TJC, Peifer M (2005) Decisions, decisions: β‐catenin chooses between adhesion and transcription. Trends Cell Biol. 15, 234–237. [DOI] [PubMed] [Google Scholar]
- 12. Nelson WJ, Nusse R (2004) Convergence of the Wnt, β‐catenin and cadherin pathways. Science 303, 1483–1487. [DOI] [PMC free article] [PubMed] [Google Scholar]
- 13. Perez‐Moreno M, Jamora C, Fuchs E (2003) Sticky business: orchestrating cellular signals at adherens junctions. Cell 112, 535–548. [DOI] [PubMed] [Google Scholar]
- 14. Di Ventura B, Lemerle C, Michalodimitrakis K, Serrano L (2006) From in vivo to in silico biology and back. Nature 443, 527–533. [DOI] [PubMed] [Google Scholar]
- 15. Kitano H (2002) Computational systems biology. Nature 420, 206–210. [DOI] [PubMed] [Google Scholar]
- 16. May RM (2004) Uses and abuses of mathematics in biology. Science 303, 790–793. [DOI] [PubMed] [Google Scholar]
- 17. Loeffler M, Potten CS, Paulus U, Glatzer J, Chwalinski S (1988) Intestinal crypt proliferation. II. Computer modelling of mitotic index data provides further evidence for lateral and vertical cell migration in the absence of mitotic activity. Cell Tissue Kinet 21, 247–258. [DOI] [PubMed] [Google Scholar]
- 18. Paulus U, Potten CS, Loeffler M (1992) A model of the control of cellular regeneration in the intestinal crypt after perturbation based solely on local stem cell regulation. Cell Prolif. 25, 559–578. [DOI] [PubMed] [Google Scholar]
- 19. Johnston MD, Edwards CM, Bodmer WF, Maini PK, Chapman SJ (2007) Mathematical modelling of cell population dynamics in the colonic crypt and colorectal cancer. Proc. Natl. Acad. Sci. USA 104, 4008–4013. [DOI] [PMC free article] [PubMed] [Google Scholar]
- 20. Yatabe Y, Tavaré S, Shibata D (2001) Investigating stem cells in human colon by using methylation patterns. Proc. Natl. Acad. Sci. USA 98, 10839–10844. [DOI] [PMC free article] [PubMed] [Google Scholar]
- 21. Alarcón T, Byrne HM, Maini PK (2004) Towards whole‐organ modelling of tumour growth. Prog. Biophys. Mol. Biol. 85, 451–472. [DOI] [PubMed] [Google Scholar]
- 22. Crampin EJ, Halstead M, Hunter P, Nielsen P, Noble D, Smith N, Tawhai M (2004) Computational physiology and the Physiome project. Exp. Physiol. 89, 21–26. [DOI] [PubMed] [Google Scholar]
- 23. Ramis‐Conde I, Drasdo D, Anderson ARA, Chaplain MAJ (2008) Modelling the influence of the E‐cadherin‐β‐catenin pathway in cancer cell invasion: a multi‐scale approach. Biophys. J. 95, 155–165. [DOI] [PMC free article] [PubMed] [Google Scholar]
- 24. Ribba B, Colin T, Schnell S (2006) A multiscale mathematical model of cancer and its use in analyzing irradiation therapies. Theor. Biol. Med. Model 3, 7. [DOI] [PMC free article] [PubMed] [Google Scholar]
- 25. Meineke FA, Potten CS, Loeffler M (2001) Cell migration and organization in the intestinal crypt using a lattice‐free model. Cell Prolif. 34, 253–266. [DOI] [PMC free article] [PubMed] [Google Scholar]
- 26. McDonald SA, Preston SL, Greaves LC, Leedham SJ, Lovell MA, Jankowski JA, Turnbull DM, Wright NA (2006) Clonal expansion in the human gut: mitochondrial DNA mutations show us the way. Cell Cycle 5, 808–811. [DOI] [PubMed] [Google Scholar]
- 27. Taylor RW, Barron MJ, Borthwick GM, Gospel A, Chinnery PF, Samules DC, Taylor GA, Plusa SM, Needham SJ, Greaves LC, Kirkwood TB, Turnbull DM (2003) Mitochondrial DNA mutations in human colonic crypt stem cells. J. Clin. Invest. 112, 1351–1360. [DOI] [PMC free article] [PubMed] [Google Scholar]
- 28. Pitt‐Francis J, Pathmanathan P, Bernabeu MO, Bordas R, Cooper J, Fletcher AG et al (2009) Chaste: a test driven approach to software development for biological modelling. Comp. Phys. Comm . in press.
- 29. Van Leeuwen IMM, Byrne HM, Jensen OE, King JR (2007) Elucidating the interactions between the adhesive and transcriptional functions of β‐catenin in normal and cancerous cells. J. Theor. Biol. 247, 77–102. [DOI] [PubMed] [Google Scholar]
- 30. Swat M, Kel A, Herzel H (2004) Bifurcation analysis of the regulatory modules of the mammalian G1/S transition. Bioinformatics 20, 1506–1511. [DOI] [PubMed] [Google Scholar]
- 31. Sansom OJ, Meniel VS, Muncan V, Phesse TJ, Wilkins JA, Reed KR, Vass JK, Athineos D, Clevers H, Clarke AR (2007) Myc deletion rescues Apc deficiency in the small intestine. Nature 446, 1–4. [DOI] [PubMed] [Google Scholar]
- 32. Potten CS, Loeffler M (1990) Stem cells: attributes, cycles, spirals, pitfalls and uncertainties. Lessons for and from the crypt. Development 119, 1001–1020. [DOI] [PubMed] [Google Scholar]
- 33. Van Leeuwen IMM, Byrne HM, Jensen OE, King JR (2006) Crypt dynamics and colorectal cancer: advances in mathematical modelling. Cell Prolif. 39, 157–181. [DOI] [PMC free article] [PubMed] [Google Scholar]
- 34. Gavaghan DJ, Simpson AC, Llod S, McRandal DF, Boyd DR (2005) Towards a Grid infrastructure to support integrative approaches to biological research. Philos. Transact. A Math. Phys. Eng. Sci. 363, 1829–1841. [DOI] [PubMed] [Google Scholar]
- 35. Noble D (2006) Systems biology and the heart. Biosystems 83, 75–80. [DOI] [PubMed] [Google Scholar]
- 36. Van Leeuwen IMM, Edwards CM, Ilyas M, Byrne HM (2007) Towards a multiscale model for colorectal cancer. World J. Gastroenterol. 13, 1399–1407. [DOI] [PMC free article] [PubMed] [Google Scholar]
- 37. Pitt‐Francis J, Bernabeu MO, Cooper J, Garny A, Momtahan L, Osborne J, Pathmanathan P, Rodriguez B, Whiteley JP, Gavaghan DJ (2008) Chaste: using agile programming techniques to develop computational biology software. Philos. Transact. A Math. Phys. Eng. Sci. 266, 3111–3136. [DOI] [PubMed] [Google Scholar]
- 38. Kaur P, Potten CS (1986) Cell migration velocities in the crypts of the small intestine after cytotoxic insult are not dependent on mitotic activity. Cell Tissue Kinet 19, 601–610. [DOI] [PubMed] [Google Scholar]
- 39. Sunter JP, Appleton DR, De Rodriguez MSB, Wright NA, Watson AJ (1979) A comparison of cell proliferation at different sites within the large bowel of the mouse. J. Anat. 129, 833–842. [PMC free article] [PubMed] [Google Scholar]
- 40. Greaves LC, Preston SL, Tadrous PJ, Taylor RW, Barron MJ, Oukrif D, Leedham SJ, Deheragoda M, Sasieni P, Novelli MR, Jankowski JA, Turnbull DM, Wright NA, McDonald SA (2006) Mitochondrial DNA mutations are established in human colonic stem cells, and mutated clones expand by crypt fission. Proc. Natl. Acad. Sci. USA 103, 714–719. [DOI] [PMC free article] [PubMed] [Google Scholar]
- 41. Preston SL, Wong WM, Chan AOO, Poulson R, Jeffery R, Goodlad RA, Mandir N, Elia G, Novelli M, Bodmer WF, Tomlinson IP, Wright NA (2003) Bottom‐up histogenesis of colorectal adenomas: origin in the monocryptal adenoma and initial expansion by crypt fission. Cancer Res. 63, 3819–3825. [PubMed] [Google Scholar]
- 42. Brembeck FH, Rosario M, Birchmeier W (2006) Balancing cell adhesion and Wnt signalling, the key role of β‐catenin. Curr. Opin. Genet. Dev. 16, 51–59. [DOI] [PubMed] [Google Scholar]
- 43. Lobachevsky PN, Radford IR (2006) Intestinal crypt properties fit a model that incorporates replicative ageing and deep and proximate stem cells. Cell Prolif. 39, 379–402. [DOI] [PMC free article] [PubMed] [Google Scholar]
- 44. Jones PH, Simons BD, Watt FM (2007) Sic Transit Gloria: farewell to the epidermal transit amplifying cell? Cell Stem Cell 1, 371–381. [DOI] [PubMed] [Google Scholar]
- 45. Burkert J, Wright NA, Alison MR (2006) Stem cells and cancer: an intimate relationship. J. Pathol. 209, 287–297. [DOI] [PubMed] [Google Scholar]
- 46. Clarke MF (2004) At the root of brain cancer. Nature 432, 281–282. [DOI] [PubMed] [Google Scholar]
- 47. Ganguly R, Puri IK (2006) Mathematical model for the cancer stem cell hypothesis. Cell Prolif. 39, 3–14. [DOI] [PMC free article] [PubMed] [Google Scholar]
- 48. Mackenzie IC (2005) Retention of stem cell patterns in malignant cell lines. Cell Prolif. 38, 347–355. [DOI] [PMC free article] [PubMed] [Google Scholar]
- 49. Komarova NL, Wang L (2004) Initiation of colorectal cancer. Where do the two hits hit? Cell Cycle 3, 1558–1565. [DOI] [PubMed] [Google Scholar]
- 50. Alarcón T, Byrne HM, Maini PK (2003) A cellular automaton model for tumour growth in inhomogeneous environment. J. Theor. Biol. 225, 257–274. [DOI] [PubMed] [Google Scholar]
- 51. Smallbone K, Gatenby RA, Gillies RJ, Maini PK, Gavaghan DJ (2007) Metabolic changes during carcinogenesis: potential impact on invasiveness. J. Theor. Biol. 244, 703–713. [DOI] [PubMed] [Google Scholar]
- 52. Brodland GW (2004) Computational modelling of cell sorting, tissue engulfment, and related phenomena: a review. Appl. Mech. Rev. 57, 47–76. [Google Scholar]
- 53. Galle J, Aust. G , Schaller G, Beyer T, Drasdo D (2006) Individual cell‐based models of the spatio‐temporal organisation of multicellular systems – achievements and limitations. Cytometry 69A, 704–710. [DOI] [PubMed] [Google Scholar]
- 54. Honda H, Tanemura M, Nagai T (2004) A three‐dimensional vertex dynamics cell model of space‐filling polyhedra simulating cell behavior in a cell aggregate. J. Theor. Biol. 226, 439–453. [DOI] [PubMed] [Google Scholar]
- 55. Weliky M, Oster G (1990) The mechanical basis of cell rearrangement. I. Epithelial morphogenesis during Fundulus epibody. Development 109, 373–386. [DOI] [PubMed] [Google Scholar]
- 56. Shih IM, Wang TL, Traverso G, Romans K, Hamilton SR, Ben‐Sassson S, Kinzler KW, Vogelstein B (2001) Top‐down morphogenesis of colorectal tumors. Proc. Natl. Acad. Sci. USA 98, 2640–2645. [DOI] [PMC free article] [PubMed] [Google Scholar]
- 57. Drasdo D, Loeffler M (2001) Individual‐based models to growth and folding in one‐layered tissues: Intestinal crypts and early development. Nonlinear Anal. 47, 245–256. [Google Scholar]
- 58. Edwards CM, Chapman JS (2007) Biomechanical modelling of colorectal crypt budding and fission. Bull. Math. Biol. 69, 1927–1942. [DOI] [PubMed] [Google Scholar]
- 59. Dietrich C, Scherwat J, Faust D, Oesch F (2002) Subcellular localization of β‐catenin is regulated by cell density. Biochem. Biophys. Res. Commun. 292, 195–199. [DOI] [PubMed] [Google Scholar]
- 60. Lee E, Salic A, Krüger R, Heinrich R, Kirschner MW (2003) The roles of APC and Axin derived from experimental and theoretical analysis of the Wnt pathway. PLoS Biol. 1, 116–132. [DOI] [PMC free article] [PubMed] [Google Scholar]
- 61. Humphries A, Wright NA (2008) Colonic crypt organization and tumorigenesis. Nat. Rev. Cancer 8, 415–424. [DOI] [PubMed] [Google Scholar]