Abstract
Objective: Fractionation of ethyl acetate extract (EA) obtained from Nitraria retusa leaves was assessed using different methods of chromatography, and isorhamnetin3‐O‐rutinoside (I3‐O‐R) was isolated from this extract. Its structure was determined using data obtained from 1H and 13C NMR spectra, as well as by various correlation experiments (COSY, HMQC and HMBC). Both EA extract and I3‐O‐R were investigated for their ability to induce apoptosis in human chronic myelogenous erythroleukaemia cells (K562).
Materials and methods: Apoptosis of cells from the K562 line was detected by DNA fragmentation, PARP cleavage and by evaluating activities of caspases 3 and 8.
Results: Apoptosis, revealed by DNA fragmentation and PARP cleavage, was observed after 48‐h incubation of these human myelogenous erythroleukaemia cells (K562), with the tested products. Likewise, caspase 3 and caspase 8 activities were induced in the presence of the EA extract and I3‐O‐R after 48 h of incubation.
Conclusion: Our results strongly suggest the involvement of the extrinsic pathway of apoptosis in cells treated by both the original EA extract and its major component, I3‐O‐R.
Introduction
Polyphenols particularly flavonoids, which are distributed through many plants, and are present in considerable numbers of fruits, vegetables, spices, medicinal herbs and beverages, have been used to treat many human diseases, such as diabetes, cancers and coronary heart diseases (1). They have a variety of biological activities, such as anti‐allergy, anti‐inflammatory, anti‐oxidative, free radical scavenging and anti‐mutagenic activities (2). Thus, the role of plant‐derived polyphenols in chemoprevention of cancer has emerged as an interesting area of research. Phytotherapy is considered as an alternative treatment, to mitigate against side effects due to indiscriminate use of synthetic drugs.
For many years, anti‐proliferative actions of chemotherapeutic drugs were ascribed solely to their ability to induce genotoxic damage (3). Apoptosis is a form of cell death in which a programmed sequence of events eliminates the concerned cells without damaging neighbouring cells. It is triggered through either a death receptor‐mediated extrinsic pathway or a mitochondrial intrinsic pathway. The extrinsic pathway is initiated by extracellular signals through transmembrane death receptors such as Fas, TNF and TRAIL. In contrast, the intrinsic pathway involves disruption of mitochondrial membrane potential and release of such mitochondrial proteins as cytochrome c and Smac (4). In the case of finding an alternative phytotherapy solution, we have been interested with the described compound present in Nitraria retusa.
Its fleshy red fruits are eaten by humans and are used to prepare drinks. The leaves serve as supplement for tea and also are used as poultices (5). In the study described here, we analysed and compared the effects of a flavonol (I3‐O‐R) and the extract from which it was purified, on a human chronic myelogenous erythroleukaemia (K562) cell line. We have attempted to elucidate the apoptotic pathway and molecular mechanisms responsible for their cytotoxic and apoptotic activities.
Materials and methods
Reagents
All organic solvents used were obtained from Carlo ERBA (Paris, France) and l‐glutamine was purchased from GIBCO BRL Life Technologies (Grand Island, NY, USA). Chromatographic columns were performed with silica gel 60 (Pharmacia Biotech, Uppsala, Sweden), reverse phase C18 column (Merck, Darmstadt, Hesse, Germany) and N‐(1‐naphtyl) ethlenediaminedihydrochloride (EDTA) was purchased from Sigma–Aldrich (Steinheim, Germany). Dimethylsulphoxide (DMSO), monoclonal anti poly ADP‐ribose polymerase (anti‐PARP), goat anti‐mouse alkaline phosphatase conjugated antibody, caspase‐3 and caspase‐8 colorimetric assay kits and 3‐(4,5‐dimethylthiazol‐2‐yl)‐2,5‐diphenyl tetrazolium) (MTT) were purchased from Sigma RBI (St Louis, MO, USA). RPMI‐1640, foetal bovine serum and gentamicin were bought from GIBCO BRL Life Technologies. Proteinase K, sodium dodecyl sulphate (SDS) and RNase were obtained from Sigma Aldrich Co and acrylamide and bisacrylamide, 5‐bromo‐4 chloro‐3 indolyl phosphate (BCIP)/nitro blue tetrazolium (NBT) and Tween 20 were purchased from Promega (Madison, WI, USA). Ethidium bromide (EtBr) and bromophenol blue were purchased from Merck (Darmstadt) and agarose and ployvinylidene difluoride (PVDF) membranes were obtained from Invitrogen, Life Technologies (Glasgow, UK).
Plant materials
Nitraria retusa was collected from saline soils of Sahline, a region situated in the central part of Tunisia, in December 2006. Identification was carried out by Pr. M. Cheieb (Department of Botany, Faculty of Sciences, University of Sfax, Tunisia), according to Flora of Tunisia requirements (6, 7). A voucher specimen (N.r‐12.06) is kept at our laboratory for future reference. Leaves were shade‐dried, powdered and stored in tightly closed containers for further use.
Method of extraction
Dried and powdered leaves (350 g) of N. retusa were first defatted with hexane, then extracted in succession of chloroform, ethyl acetate and methanol, using Soxhlet apparatus (6 h). Four different extracts were obtained. They were concentrated to dryness and kept at 4 °C.
Methods of fractionation and isolation
Ethyl acetate extract (2.8 g) was fractionated by vacuum liquid chromatography (VLC) on a silica gel column (100 × 40 mm i.d.) eluted with CH2Cl2: MetOH with gradual increase of MetOH content (100:0→0:100); 14 fractions (NR 3A – NR 3N) were collected. Fractions F, G, H, I, J and K were gathered (NR 4A) and rechromatographed over an RP18 column using medium liquid pressure column (MPLC) eluted by MeOH‐H2O with gradual decrease in MeOH content (10:90→0:100) leading to 48 sub‐fractions (NR 7A – NR 7AY). Sub‐fractions M, N, O, P and Q were gathered; their purity was verified by thin layer chromatography and then identified by comparison of their nuclear magnetic resonance (NMR) to afford compound 1.
Structural identification of the purified compound
NMR spectroscopy experimentation on compound 1 was performed using a Bruker® Avance spectrometer at 300 MHz (for 1H NMR) and 75 MHz (for 13C NMR) with dimethyl sulphoxide (DMSO‐d6) as solvent. Fast atom bombardment mass spectra (FAB–MS) (negative‐ion mode, glycerol matrix) were recorded on an R210C (VG Instruments, Altrincham, UK) spectrometer equipped with an IPC (P2A) MSCAN WALLIS computer system. COSY, HMQC and HMBC spectra were obtained using usual pulse sequences.
Cell culture
Human chronic myelogenous leukaemia CML cell line K562 was obtained from the American Type Culture Collection (Rockville, MD, USA). Cells were cultured in RPMI‐1640 medium supplemented with 10% (v/v) foetal calf serum, 0.1 mg/ml gentamicin and 2 mm l‐glutamine as complete growth medium, and were incubated at 37 °C in an incubator with 5% CO2 in humidified atmosphere. Every 2 days cells were split, for subculture with fresh medium.
Assay for cytotoxic activity
Cytotoxicity of N. retusa extract and I3‐O‐R against the K562 cells was estimated by the 3‐(4,5‐dimethylthiazol‐ 2‐yl)‐2,5‐diphenyltetrazolium bromide (MTT) assay, based on reduction of MTT by mitochondrial dehydrogenases in viable cells. The resulting blue formazan product was measured spectrophotometrically (8). Cells were seeded in 96‐well plates at concentration of 5 × 10⁴ cells/well and incubated at 37 °C for 24 h in a 5% CO2‐enriched atmosphere. Extracts were first dissolved in 1% DMSO, then in the cell culture medium. They were incubated again at 37 °C for 48 h with each of the tested extracts and I3‐O‐R at concentrations ranging from 10 to 800 μg/ml. Next, media were removed and cells in each well were incubated in 50 μl of MTT solution (5 mg/ml) at 37 °C for 4 h. MTT solution was then discarded and 50 μl of 100% DMSO was added to dissolve the insoluble formazan crystals. Optical density was measured at 540 nm. Each drug concentration was tested in triplicate.
Cytotoxic effects of the extract and compound were estimated in terms of population growth inhibition percentage and expressed as IC50‐concentration of extract that reduces absorbance of treated cells by 50%, with reference to control (cells treated with DMSO); IC50 values were graphically obtained from the dose–response curves. We determined IC50 values when cytotoxicity resulted in more than 50% at screening concentrations.
DNA fragmentation analysis
DNA fragmentation was analysed by agarose gel electrophoresis as described by Wang et al. (9), with slight modifications. K562 cells (1.5 × 10⁶ cells/ml) were exposed to the extract for 24 and 48 h and harvested by centrifugation. Cell pellets were resuspended in 200 μl of lysis buffer (50 mm Tris–HCl, pH 8.0, 10 mm EDTA, 0.5%N‐lauroyl sarcosine sodium salt) at room temperature for 1 h, then centrifuged at 12 000 g for 20 min at 4 °C. The supernatant was incubated overnight at 56 °C with 250 μg/ml proteinase K. Cell lysates were then treated with 2 mg/ml RNase A and incubated at 56 °C for 2 h. DNA was extracted using chloroform/phenol/isoamyl alcohol (24/25/1, v/v/v) and precipitated from the aqueous phase by centrifugation at 14 000 g for 30 min at 0 °C. DNA solution was transferred to 1.5% agarose gel and electrophoresis was carried out at 67 V for 3/4 h with TAE (Tris 40 mm, sodium acetate 20 mm, EDTA 1 mm) as running buffer. DNA in the gel was visualized using ethidium bromide (0.5 μg/ml) under UV light (9).
Western blot analysis
Cells were lysed in lysis buffer (62.5 mm Tris–HCl and 6 m urea, pH = 6.8) and protein concentrations were determined in lysates using the Bradford method (10). Equal amounts of proteins (40 μg) were separated by sodium dodecyl sulphate polyacrylamide gel electrophoresis (SDS–PAGE), and transferred into PVDF membrane, which was blocked with 5% non‐fat milk in 0.1% Tween 20‐phosphate buffer saline (PBST) overnight at 4 °C. Membranes were then incubated with primary antibody anti‐PARP at 1:100 dilution for 2 h at room temperature. The membrane was then washed and incubated in goat anti‐mouse alkaline phosphatase‐conjugated antibody at 1:7500 dilution for 1 h. Next, the membrane was washed and chromogenic substrate BCIP/NBT was added to localize antibody binding proteins. Protein levels were determined by computer‐assisted densitometric analysis (Densitometer, GS‐800, Bio‐Rad Quantity One, California, USA).
Investigation of caspase 3 and caspase 8 induction
Cells were cultured (106 cells/ml) in 25 cm2 flasks for 24 h in absence or presence of EA extract and I3‐O‐R at 37 °C. Controls were performed at the same time using 0.5% DMSO. Cells were then harvested and centrifuged at 600 g and pellets were incubated in ice cold lysis buffer (250 mm HEPES, pH 7.4, 25 mm CHAPS, 25 mm DTT) for 15 min, then centrifuged at 16 000 g for 20 min. Supernatants (cell extracts eventually containing caspase 3 and caspase 8) were retrieved and aliquots corresponding to 50 μg total protein were incubated along with acetylated tetrapeptide Ac‐DEVD substrate labelled with chromophore p‐nitroaniline (p‐NA) for caspase 3 assay, or Ac‐IETD‐p‐NA substrate for caspase 8 assay, in presence of each caspase buffer in a 96‐well flat bottomed microplate. Active caspase 3 and caspase 8 provoke cleavage and release of p‐NA from the substrate. Free p‐NA results in yellow colouration detected spectrophotometrically at 405 nm. Blanks were performed simultaneously containing assay buffer (200 mm HEPES, pH 7.4, 1% CHAPS, 50 mm DTT, 20 mm EDTA, for caspase 3 assay) and (200 mm HEPES, pH 7.4, 1% CHAPS, 50 mm DTT, 20 mm EDTA, 50% sucrose for caspase 8 assay) substrate, but without cell lysate. Standard curve analysis was performed to determine correspondence between absorbance and p‐NA concentration, then results were expressed as caspase 3 and caspase 8 specific activity (μmol p‐NA per min/ml protein), calculated as indicated by the manufacturer (Caspase‐3, Caspase‐8, Assay Kit Colorimetric, Sigma).
Statistical analysis
Data were collected and expressed as mean ± SD of three independent experiments and analysed for statistical significance using one‐way ANOVA, followed by Dunnett’s test using statistica (Version 6.0; Statsoft Inc., Tulsa, OK, USA), to compare results achieved for control (untreated cells) with those of cells treated with the tested samples. Statistical differences determined at p < 0.05. IC50 values from in vitro data were calculated by regression analysis.
Results
Phytochemical study and determination of extract yield, total polyphenol, flavonoid, tannin and sterol contents of Nitraria retusa leaf extract
Using 350 g of powder from leaves of N. retusa, we obtained 2.8 g of EA extract, corresponding to yield of 0.8%. The phytochemical study of N. retusa EA extract showed presence of high quantities of tannins (22.62%) and flavonoids (20.17%) (Table 1).
Table 1.
Quantitative phytochemical screening of ethyl acetate extract from Nitraria retusa leaves. Structural identification of compound 1 purified from EA extract, was established using spectroscopic analysis, specially analysis of negative fast atom bombardment mass spectra (FAB‐MS), 1H NMR (nuclear magnetic resonance) spectroscopy, 13C NMR spectroscopy and direct comparison with published data
| Extract content (%) | Ethyl acetate extract |
|---|---|
| Tannins | 22.62 ± 0.015 |
| Flavonoids | 20.17 ± 0.005 |
| Polyphenols | 6.83 ± 0.08 |
| Sterols | 8.68 ± 0.01 |
Results are presented as means ± SD of three experiments.
Identification of purified compound
Structural identification of compound 1 purified from EA extract, was established using spectroscopic analysis, specially analysis of negative fast atom bombardment mass spectra (FAB‐MS), 1H NMR (nuclear magnetic resonance) spectroscopy, 13C NMR spectroscopy and direct comparison with published data. This predominant compound is a flavonol identified as isorhamnetin3‐O‐rutinoside (I3‐O‐R) (Fig. 1).
Figure 1.
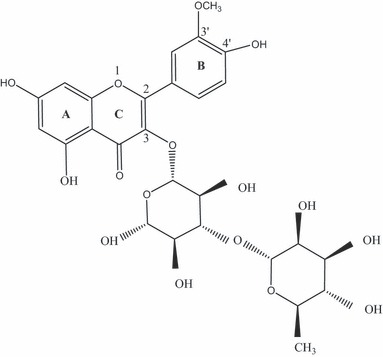
Chemical structure of Isorhamnetin3‐o‐rutinoside.
Cytotoxic activity
The cytotoxicity study showed that tested concentrations of N. retusa EA extract weakly inhibited cell population growth of the tested malignant cells. Inhibition rates of cell population growth were 25.74%, 31.39% and 36.78%, after incubation with 200, 400 and 800 μg/ml respectively, after incubation with 500 lg/ml with 13‐O‐R, the inhibition rate was 50% (Fig. 2).
Figure 2.
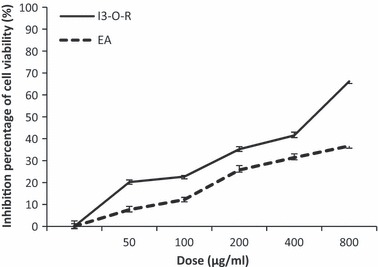
Inhibitory effect, of EA extract and I3‐O‐R on viability of K562 cells. Results are represented by the means ± SD of n = 3. *P < 0.05 means a significant difference between the untreated and treated cells.
Induction of ladder DNA fragmentation
At exposure to different concentrations of EA extract (Fig. 3, tracks B, C, D) and I3‐O‐R (Fig. 3, tracks E, F, G) for 48 h, fragmentation DNA profile was clearly observed in K562 cells compared to control cells, which did not result in DNA laddering (Fig. 3, track A).
Figure 3.
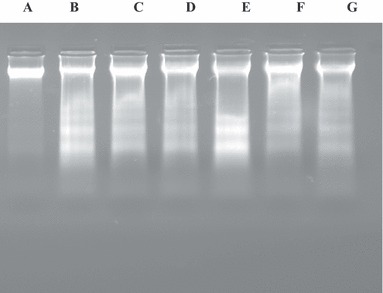
Gel agarose (1,5%) profile of DNA from K562 cells treated with EA and I3OR. Effect of different concentrations of ethyl acetate (EA) extract and I3‐O‐R (Isorhamnetin 3‐O‐Rutinoside) on DNA fragmentation of K562 cells after 48 h incubation. A: untreated cells, B: 800 μg/ml EA extract, C: 400 μg/ml EA extract, D: 200 μg/ml EA extract, E: 1000 μg/ml I3‐O‐R, F: 500 μg/ml I3‐O‐R, G: 250 μg/ml I3‐O‐R.
Effect of EA extract and I3‐O‐R on proteolysis of PARP
DNA fragmentation is often associated with activation of a family of cysteine proteases, the caspases. Caspase 3 in particular, seems to play an important role in several models of apoptosis (11). Thus we investigated enzymatic activation of apoptotic proteins (caspases), by measuring cleavage of PARP (116 kDa), a caspase 3 substrate, into fragments of 85 and 31 kDa. As shown in 4, 5, when cells were treated with EA extract and with I3‐O‐R, increase in intensity of the 85 kDa fragment and/or decrease or total disappearance of the 116 kDa band, were observed at the tested doses after 48 h incubation.
Figure 4.
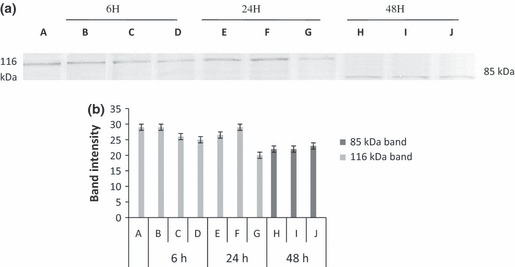
(a) Revelation of PARP expression changes in K562 cells, treated with EA extract. K562 cells were treated with 800, 400 and 200 μg/ml of ethyl acetate (EA) extract for 6, 24 and 48 h. Protein extracts were subjected to western blotting to determinate immunoreactivity of PARP, as described in methods section. PARP 116 kDa and 85 kDa bands are shown. A: Untreated cells, B: 800 μg/ml, C: 400 μg/ml, D: 200 μg/ml, E: 800 μg/ml, F: 400 μg/ml, G: 200 μg/ml, H: 800 μg/ml, I: 400 μg/ml, J: 200 μg/ml. (b) Quantification by scanning densitometry of PARP bands intensity [quantified band intensity by computer‐assisted densitometric analysis (Densitometer, GS‐800, BioRad Quantity One)]. A: Untreated cells, B: 800 μg/ml, C: 400 μg/ml, D: 200 μg/ml, E: 800 μg/ml, F: 400 μg/ml, G: 200 μg/ml, H: 800 μg/ml, I: 400 μg/ml, J: 200 μg/ml.
Figure 5.
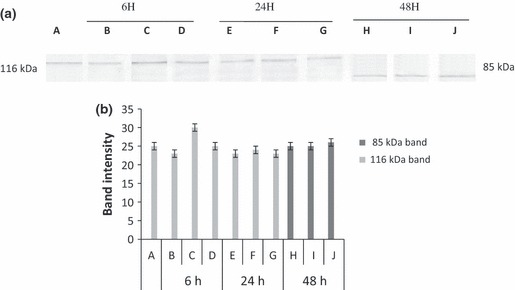
(a) Revelation of PARP expression changes in K562 cells, treated with Isorhamnetin 3‐O‐rutinoside. K562 cells were treated with 1000, 500 and 250 μg/ml of Isorhamnetin 3‐O‐rutinoside for 6, 24 and 48 h. Protein extracts were subjected to western blotting to determinate immunoreactivity of PARP, as described in methods section. PARP 116 kDa and 85 kDa bands are shown. A: Untreated cell, B: 1000 μg/ml, C 500 μg/ml, D: 250 μg/ml, E: 1000 μg/ml, F: 500 μg/ml, G: 250 μg/ml, H: 1000 μg/ml, I: 500 μg/ml, J: 250 μg/ml. (b) Quantification by scanning densitometry of PARP bands intensity [quantified band intensity by computer‐assisted densitometric analysis (Densitometer, GS‐800, BioRad Quantity One)]. A: Untreated cell, B: 1000 μg/ml, C 500 μg/ml, D: 250 μg/ml, E: 1000 μg/ml, F: 500 μg/ml I3‐O‐R, G: 250 μg/ml, H: 1000 μg/ml, I: 500 μg/ml, J: 250 μg/ml.
Caspase 3 and caspase 8 activation assay
The cellular pathway of cell death induced by EA extract and I3‐O‐R was examined by assessing caspase 3 and caspase 8 activities, which play a critical role in apoptosis. Following 24 and 48 h treatment of K562 cells with the chosen concentrations of each of EA extract and I3‐O‐R, caspase 3 and caspase 8 activities were measured and compared to those of control cells. As shown in 6, 7, K562 cells treated with EA extract and I3‐O‐R for 24 and 48 h, had significant concentration‐dependent increase in caspase 3 and caspase 8 activities. These results suggest that apoptosis induced by the tested EA extract and I3‐O‐R may occur through activation of common executors of apoptosis such as caspase 3, by activation of caspase 8.
Figure 6.
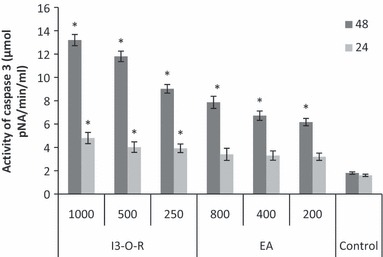
Effect of EA extract and I3‐O‐R‐ on caspase‐3 activity in K562 cells. Lysates prepared from cells treated with EA extract and I3‐O‐R for 24 and 48 h, were assayed for in vitro caspase‐3 activity. The rate of cleavage of the caspase substrate DEVD‐pNA was measured at 405 nm. The results are presented as the mean ± SD. The experiments were done in triplicate. *P < 0.05 means a significant difference between the control and treated cells. Control: cells treated by the vehicle only.
Figure 7.
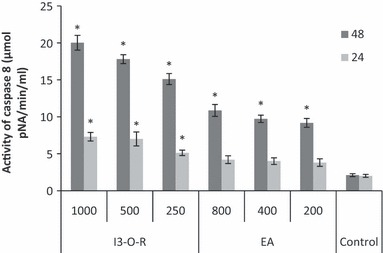
Effect of EA extract and I3‐O‐R on caspase‐8 activity in K562 cells. Lysates obtained from cells treated with the EA extract and I3‐O‐R 24 and 48 h were assayed for in vitro caspase‐8 activity. The rate of cleavage of the caspase substrate IETD‐pNA measured at 405 nm. The results are presented as the mean ± SD. The experiments were done in triplicate. *P < 0.05 means a significant difference between the control and treated cells. Control: cells treated by the vehicle only.
Discussion
Flavonoids have been shown to possess cytotoxic effects against some cancer cells, such as those of colon cancer (12), cervical cancer (13), prostate cancer (14), human chronic myelogenous erythroleukaemia (K562) (1) and lung cancer (15). In our study, we confirmed the cytotoxic effects of N. retusa extracts on human leukaemia (K562) cells. We have shown that EA extract and I3‐O‐R were able to induce cytotoxicity in K562 cells in a dose‐dependent manner.
We believe that presence of the double bond C2–C3 in the I3‐O‐R structure is involved in cytotoxicity of the purified compound as well as in its original extract, as it is a major component of EA extract. This hypothesis is in accordance with results described by Plochmann et al. (16) who reported that the C2–C3 bond is the origin of high cytotoxicity (3–10 times) of some flavonoids like quercetin, apigenin and luteolin, compared to their slightly different structural compounds, taxifolin, naringenin and eriodictyole respectively, which do not have the double C2–C3 bond (4). Presence of the double C2–C3 bond in some flavonoid structures is also correlated with inhibition of farnesyl transferase (FTase) activity. This enzyme catalyses addition of the isoprene farnezyl group on a variety of cell protein, and its inhibition causes tumour cell population growth arrest (17).
Also, presence of the B ring in I3‐O‐R structure could be one of the cytotoxicity factors. According to Plochmanns et al. (16), B ring flavonoids are more cytotoxic than their structural analogues without the B‐ring (chalcone, phloretin and phloroacetophenone). Moreover, the low number of hydroxyl group (single OH) on ring B of I3‐O‐R (major component of EA extract), constitutes a supplementary argument in favour of cytotoxicity revealed by EA and I3‐O‐R. Our deduction is supported by findings of Kim et al. (18) which led them to conclude that the more OH groups on ring B decrease, the more toxicity of flavonoids increases, for example kampferol with a single OH on B‐ring, is more cytotoxic than myricetin and quercetin with more than one OH group on ring B. Cytotoxicity of I3‐O‐R can also be related to the presence of the OH group, at C4 of ring B of the tested flavonoid. This hypothesis is supported by studies of Michels et al. (19) and Agullo et al. (20), who have shown that C4 hydroxylated flavonoids are more cytotoxic than methylated ones. We also believe that absence of any hydroxyl group on C3 should enhance cytoxicity as reported by Plochmann et al. (16), for apeginin, luteolin and eriodictyol, and by Li et al. (21) for alnusine.
Table 2.
Data RMN (300 MHz/75 MHz), DMSO‐d6
| No. carbone | 1H | 13C | HMBC |
|---|---|---|---|
| 2 | 156.3 | ||
| 3 | 133.0 | ||
| 4 | 177.3 | ||
| 5 | 161.2 | ||
| 6 | 6.2 (1H, d, J = 2.0) | 98.7 | C‐5, C‐8, C‐10 |
| 7 | 164.2 | ||
| 8 | 6.4 (1H, d, J = 2.0) | 93.8 | C‐6, C‐7, C‐9, C‐10 |
| 9 | 156.4 | ||
| 10 | 104.0 | ||
| 1′ | 121.0 | ||
| 2′ | 8.0 (1H, d, J = 1.8) | 113.4 | C‐2, C‐3′, C‐4′ |
| 3′ | 147.0 | ||
| 4′ | 143.1 | ||
| 5′ | 6.9 (1H, d, J = 8.2) | 115.1 | C‐1′, C‐3′ |
| 6′ | 7.5 (1H, dd, J = 8.5, 1.8) | 122.0 | C‐2, C‐2′, C‐4′ |
| ‐OCH3 | 3,85, s | 55.9 | C‐3′ |
| 5‐OH | 12.6 | C‐6, C‐5, C‐10 | |
| 7‐OH | 9.8 | ||
| 1′′ | 5,4 | 101.8 | C‐3 |
| 2′′ | 3,56, m | 71.1 | |
| 3′′ | 3,41, m | 73.0 | |
| 4′′ | 70.4 | ||
| 5′′ | 3,59, m | 73.5 | |
| 6′′ | 3,30–3,60 | 65.1 | |
| 1′′′ | 4,42 | 100.0 | C‐2′′′, C‐3′′′, C‐6′′ |
| 2′′′ | 68.3 | ||
| 3′′′ | 3,28 | 70.6 | |
| 4′′′ | 3,06 | 71.9 | |
| 5′′′ | 3,61 | 68.0 | |
| 6′′′ | 1,04, d, | 17.9 | C‐5′′′, C‐4′′′ |
| OH‐ | 4,56, 4,82, 5,2, 5,4 |
| 13C | 1H | HMBC | Cosy | C |
|---|---|---|---|---|
| 177.3 | C4 | |||
| 164.2 | C7 | |||
| 161.2 | C5 | |||
| 156.4 | C9 | |||
| 156.3 | C2 | |||
| 149.4 | C4′ | |||
| 147.0 | C3′ | |||
| 133.0 | C3 | |||
| 122.0 | 7.5 (1H, dd, J = 8.5, 1.8) | 113.4, 149.4, 156.3 | 6.9, 8.0 | C6′ |
| 121.0 | C1′ | |||
| 115.1 | 6.9 (1H, d, J = 8.2) | 121.0, 147.0 | 7.5 | C5′ |
| 113.4 | 8.0 (1H, d, J = 1.8) | 122.0, 147.0, 149.4, 156.3 | 7.5 | C2′ |
| 104.0 | C10 | |||
| 101.8 | 5.4 (1H, d, J = 7.5) | 133.0 | 3.60 | C1′′ |
| 100.0 | 4.4 (1H) | 65.1, 68.3, 70.6 | 3.36 | C1′′′ |
| 98.7 | 6.2 (1H, d, J = 2.0) | 93.8, 104.0, 161.2 | 6.4 | C6 |
| 93.8 | 6.4 (1H, d, J = 2.0) | 98.7, 104.0, 156.4, 164.2 | 6.2 | C8 |
| 73.5 | 3.59 (1H) | 5.4, 5.2(OH) | C5′′ | |
| 73.0 | 3.41 (1H) | 4.95(OH) | C3′′ | |
| 71.9 | 3.06 (1H) | 4.56(OH) | C4′′′ | |
| 71.1 | 3.56 (1H) | C2′′ | ||
| 70.6 | 3.28 (1H) | C3′′′ | ||
| 70.4 | 3.37 (1H) | C4′′ | ||
| 68.3 | 3.36 (1H) | C2′′′ | ||
| 68.0 | 3.61 (1H) | C5′′′ | ||
| 65.1 | 3.30–3.60 (2H) | C6′′ | ||
| 55.9 | 3.85 (O–CH3, 3H) | 147.0 | ||
| 17.9 | 1.04 (3H) | 68.0, 71.9 | ||
| 12.6 (5‐OH) | 98.7, 104.0, 161.2 | |||
| 9.8 (7‐OH) |
Isorhamnetin3‐o‐rutinoside, Bruker® Avance spectrometer, operating at 300 MHz for 1H and 75 MHz for 13C (DMSO‐d6)
Presence of an orthohydroxyl group on the ring B of I3‐O‐R could participate in the cytotoxic potential of this molecule; Plochmann et al. (16) have reported that the orthohydroxylated ring B of quercetin is three times more cytotoxic than ring B metahydroxylated of morine. Likewise, we believe that presence of methoxyl group on C3 of the isorhamnetin moiety participates in the cytotoxicity of I3‐O‐R; methoxylation has been described to increase hydrophobicity of flavonoids and consequently their cytotoxicity (19).
Presence of carbonyl function on C4 of ring C may be involved in I3‐O‐R cytotoxicity, as has been advanced by Brusselmans (22), who reported that flavonoids with such carbonyl function induce inhibition of fatty acid synthesis and thus, population growth arrest and cell death. Nonetheless, EA extract exhibited lower cytotoxicity compared to its major constituent, I3‐O‐R, which could be explained by presence in the extract of compounds with antagonistic effects and also that I3‐O‐R was diluted in the original EA extract.
In the present study, we have shown that flavonol isolated from N. retusa, induced apoptosis in K562 cells. Thus, we investigated the role of the caspase cascade in flavonoid‐induced apoptosis, as its related signalling pathways have been reported (23) to influence progression of cancer. Induction of apoptosis appears to be an alternative in preventive strategies for cancer therapy (24) and previous studies have shown that polyphenols and particularly some flavonoids cause apoptosis through induction of Bax with concomitant suppression of Bcl‐2. Other molecules and pathways are recognised including up‐regulation of death receptor 5, modulation of IGFBP‐3, involvement of p38‐MAPK, and inhibition of PI‐3‐kinase/Akt and ERK pathways (14). However, different mechanisms have been linked to flavonoid‐mediated cytotoxicity.
Results of the present study clearly demonstrate that the EA extract and its major constituent (I3‐O‐R) suppressed K562 cells’ viability by inducing apoptosis after 48 h incubation. Treatment with the tested products caused induction of caspase 3 activity and degradation of poly (ADP‐ribose) polymerase, which precede onset of apoptosis; PARP is a substrate for caspase 3, it is a 116‐kDa enzyme involved in DNA repair (25, 26). Activated caspase 3 cleaves PARP between amino acids 216 and 217, generating 85‐ and 31‐kDa inactive fragments and loss of PARP function precludes DNA repair, which contributes to apoptotic cell death (16, 27).
There are two major signalling pathways of caspase‐mediated apoptosis, death receptor or extrinsic pathway and mitochondrial or intrinsic pathway. The death receptor pathway mediated distinctively by active/cleaved caspase 8 plays a fundamental role in maintenance of tissue homoeostasis, especially in the immune system. The mitochondrial pathway distinctively mediated by active/cleaved caspase 9 is used extensively in response to extracellular cues and internal insults such as DNA damage (14).
Our results have shown that after 48 h incubation of K562 cells with different doses of tested samples, we obtained highest caspase 3 and caspase 8 inducing activities, as well as more effective PARP cleavage (116 kDa band disappeared in favour of 85 kDa band). We may thus conclude that the tested samples provoke a cytotoxic effect on K562 cells by activating the extrinsic pathway of apoptosis. Activation of caspase 8 leads to activation of caspase 3 and subsequently induces PARP cleavage and DNA fragmentation (which was also observed after 48 h incubation). However, we cannot exclude participation of other pathways of the apoptotic effect observed with both EA extract and I3‐O‐R.
Acknowledgements
We would like to acknowledge the ‘Ministry of Higher Education, Scientific Research and Technology, Tunisia’, for the financial support of this study and the ‘Ministry of Foreign Affairs, France (Action Intégrée de Coopération Inter universitaire Franco‐Tunisienne, CMCU 07 G0836 PAR)’. The authors are grateful to Pr Lotfi Chouchene and all members of the laboratory of Immunology, Faculty of Medicine, Monastir, Tunisia.
References
- 1. Bouhlel Chatti I, Limem I, Boubaker I, Skandrani I, Kilani S, Bhouri W et al. (2009) Phytochemical, antibacterial, antiproliferative, and antioxidant potentials and DNA damage‐protecting activity of Acacia salicina extracts. J. Med. Food 12, 675–683. [DOI] [PubMed] [Google Scholar]
- 2. Cipák L, Rauko P, Miadoková E, Cipáková I, Novotný L (2003) Effects of flavonoids on cisplatin‐induced apoptosis of HL‐60 and L1210 leukemia cells. Leuk. Res. 27, 65–72. [DOI] [PubMed] [Google Scholar]
- 3. Skandrani I, Boubekar J, Bhouri W, Limem I, Kilani S, Ben Sghaier M et al. (2009) Leaf extracts from Moricandia arvensis promote antiproliferation of human cancer cells, induce apoptosis and enhance antioxidant activity. Drug Chem. Toxicol. 33, 20–27. [DOI] [PubMed] [Google Scholar]
- 4. Kim JY, Chung JY, Park JE, Lee SG, Kim YJ, Cha MS et al. (2007) Benzo[a]pyrene induces apoptosis in RL95‐2 human endometrial cancer cells by cytochrome P450 1A1 activation. Endocrinology 10, 5112–5122. [DOI] [PubMed] [Google Scholar]
- 5. Boubaker J, Skandrani I, Bouhlel I, Ben sghaier M, Neffati A, Ghedira K et al. (2010) Mutagenic, antimutagenic and antioxidant potency of leaf extracts from Nitraria retusa . Food Chem. Toxicol. 48, 2283–2290. [DOI] [PubMed] [Google Scholar]
- 6. Pottier‐Alaptite G (1979) Flora of Tunisia, dicotyledonous angiosperm‐apetalous‐dialpétaes, Tunisia official printing house, pp. 291–293.
- 7. Cheib M, Boukhris M (1998) Flora succint and illustrated flora of the arid zone and Sahara of Tunisia, Tunisia official printing house, pp. 43–44.
- 8. Carmichael J, DeGraff WG, Gazdar AF, Minna JD, Mitchell JB (1987) Evaluation of a tetrazolium‐based semiautomated colorometric assay; assessment of chemosensitivity testing. Cancer Res. 47, 936–942. [PubMed] [Google Scholar]
- 9. Wang T, Hicks KB, Moreau R (2002) Antioxidant activity of phytosterols, oryzanol and other phytosterols conjugates. J. Am. Oil Chem. Soc. 79, 1201–1206. [Google Scholar]
- 10. Bradford MM (1976) A rapid and sensitive method for the quantitation of microgram quantities of protein utilizing the principle of protein‐dye binding. Anal. Biochem. 72, 248–254. [DOI] [PubMed] [Google Scholar]
- 11. Martin SJ, Newmeyer DD, Mathias S, Farschon DM, Wang HG, Reed JC et al. (1995) Cell‐free reconstitution of Fas‐UV radiation‐ and ceramide‐induced apoptosis. EMBO J. 14, 5191–5200. [DOI] [PMC free article] [PubMed] [Google Scholar]
- 12. Takagaki N, Sowa Y, Oki T, Nakanishi R, Yogosawa S, Sakai T (2005) Apigenin induces cell cycle arrest and p21/WAF1 expression in a p53‐independent pathway. Int. J. Oncol. 26, 185–189. [PubMed] [Google Scholar]
- 13. Chiang LC, Ng LT, Lin IC, Kuo PL, Lin CC (2006) Antiproliferative effect of apigenin and its apoptotic induction in human Hep G2 cells. Cancer Lett. 237, 207–214. [DOI] [PubMed] [Google Scholar]
- 14. Qiang Z, Xin‐Huai Z, Zhu‐Jun W (2009) Cytotoxicity of flavones and flavonols to a human esophageal squamous cell carcinoma cell line (KYSE‐510) by induction of G2/M arrest and apoptosis. Toxicol. In Vitro 23, 797–807. [DOI] [PubMed] [Google Scholar]
- 15. Leung HW, Lin CJ, Hour MJ, Yang WH, Wang MY, Lee HZ (2007) Kaempferol induces apoptosis in human lung non‐small carcinoma cells accompanied by an induction of antioxidant enzymes. Food Chem. Toxicol. 45, 2005–2013. [DOI] [PubMed] [Google Scholar]
- 16. Plochman K, Korte G, Koutsilieri E, Riederer P, Rethwilm A, Schreir P et al. (2007) Structure‐activity relationships of flavonoid‐induced cytotoxicity on human leukemia cells. Arch. Biochem. Biophys. 460, 1–9. [DOI] [PubMed] [Google Scholar]
- 17. Kang HM, Kim JH, Lee MY, Son KH, Yang DC, Baek NI et al. (2004) Relationship between flavonoids structure and inhibition of farnesyl protein transferase. Nat. Prod. Res. 18, 349–356. [DOI] [PubMed] [Google Scholar]
- 18. Kim JD, Liu L, Guo W, Meydani M (2006) Chemical structure of flavonols in relation to modulation of angiogenesis and immune‐endothelial cell adhesion, J . Nutr. Biochem. 17, 165–176. [DOI] [PubMed] [Google Scholar]
- 19. Michels G, Mohamed GA, Weber N, Chovolon Y, Kampkotter A, Watjen W et al. (2006) Effects of methylated derivatives of luteolin from cyperus alopecuroides I Rat H4IIE hepatoma cells. Basic Clin. Pharmacol. Toxicol. 98, 168–172. [DOI] [PubMed] [Google Scholar]
- 20. Agullo G, Gamet‐Payrastre L, Fernandez Y, Anciaux N, Demingné C, Rémésy C (1996) Comparative effects of flavonoids on the growth, viability and metabolism of a chronic adenocarcinoma cell line (HT29 cells). Cancer Lett. 105, 61–70. [DOI] [PubMed] [Google Scholar]
- 21. Li F, Awale S, Tezuka Y, Kadota S (2008) Cytotoxic constituent from Brazilianred propolis and their structure‐activity relationship. Bioorg. Med. Chem. 16, 5434–5440. [DOI] [PubMed] [Google Scholar]
- 22. Brusselmans K, Vrolix R, Verhoeven G, Swinnen JV (2005) Induction for cancer cell apoptosis by flavonoids is associated with their ability to inhibit fatty acid synthase activity. J. Biol. Chem. 280, 5636–5645. [DOI] [PubMed] [Google Scholar]
- 23. Lowe SW, Lin AW (2000) Apoptosis in cancer. Carcinogenesis 21, 485–495. [DOI] [PubMed] [Google Scholar]
- 24. Reed JC, Pellecchia M (2005) Apoptosis‐based therapies for hemato‐logic malignancies. Blood 106, 408–418. [DOI] [PubMed] [Google Scholar]
- 25. Bhouri W, Bouhlel I, Boubaker J, Kilani S, Ghedira K, Chekir Ghedira L (2011) Induction of apoptosis in human lymphoblastoid cells by kaempferol 3‐O‐β‐isorhamninoside and rhamnocitrin 3‐O‐β‐isorhamninoside from Rhamnus alaternus L. (Rhamnaceae). Cell Prolif. 44, 283–290. [DOI] [PMC free article] [PubMed] [Google Scholar]
- 26. Woo M, Hakem R, Soengas MS, Duncan GS, Shahinian A, Kagi D et al. (1998) Essential contribution of caspase‐3/CPP32 to apoptosis and its associated nuclear changes. Genes Dev. 12, 806–819. [DOI] [PMC free article] [PubMed] [Google Scholar]
- 27. Pipper AA, Verma A, Zhang J, Snyder SH (1999) Poly (ADP‐ribose) polymerase, nitric oxide and cell death. Trends Pharmacol. Sci. 20, 171–181. [DOI] [PubMed] [Google Scholar]


