Abstract
Abstract. Tetraploid Meth‐A cells were polyploidized by demecolcin, an inhibitor of spindle fibre formation in M phase, and then released from the drug 1, 2, 3 and 4 days after the addition. Octaploid cells were successfully established from cell populations including hexadecaploid cells produced by 2, 3 and 4 days of exposure to demecolcin. One‐day‐treated cells were polyploidized octaploid cells, but they returned to tetraploid cells. All of the octaploid Meth‐A cells showed essentially the same features. The octaploid Meth‐A cells had eight homologous chromosomes and double the DNA content of the parent tetraploid cells. The doubling time of octaploid Meth‐A cells was 30.2 h, somewhat longer than the 28.3 and 24.0 h of tetraploid and diploid cells, respectively. The fractions of cells in the G1, S and G2/M phases were essentially the same in diploid, tetraploid and octaploid Meth‐A cells. The cell volume of octaploid Meth‐A cells was about two times that of the tetraploid cells. It was concluded that octaploid Meth‐A cells were established from transient hexadecaploid cells produced by the polyploidization of tetraploid cells that had been established from diploid cells.
INTRODUCTION
The Meth‐A cell line, a methylcholanthrene‐induced sarcoma cell line, always contains a small population of large cells that are produced from diploid cells by spontaneous polyploidization and are removed eventually by apoptosis (Fujikawa‐Yamamoto et al. 1997a). Meth‐A cells may be particularly susceptible to polyploid transformation. Several important characteristics of polyploidized Meth‐A cells have been studied including DNA synthesis (Fujikawa‐Yamamoto et al. 1997b), apoptosis (Fujikawa‐Yamamoto et al. 1997a; Zong et al. 1998), growth in vivo (Zong et al. 1998), cell surface hydrocarbon chains (Fujikawa‐Yamamoto et al. 2000b) and involvement of protein kinase C (1995, 2000); however, the cells used were in a transient state of polyploidization.
Demecolcin (Colcemid) antagonizes tublin polymerization and induces the disassembly of microtubules into monomers (Inoue 1981), which inhibits spindle fibre formation in M phase, resulting in polyploidization of many cells. Though Meth‐A cells can be artificially polyploidized by any of demecolcin, paclitaxel (an inhibitor of depolymerization of microtubules), K‐252a and staurosporine (inhibitors of protein kinases), the cell cycle response is different after the removal of these drugs, suggesting that there are structural differences of DNA in artificially polyploidized cells (Fujikawa‐Yamamoto et al. 2001a).
A tetraploid Meth‐A cell line was reproducibly established from diploid Meth‐A cells highly polyploidized by demecolcin (Fujikawa‐Yamamoto et al. 2001a). Tetraploid Meth‐A cells had four homologous chromosomes and double the DNA content of the parent diploid cells. The tetraploid Meth‐A cells showed marked suppression of growth at low temperature (Fujikawa‐Yamamoto et al. 2001b) and high tolerance to severe deprivation of nutriments (Fujikawa‐Yamamoto et al. 2002), suggesting that the diploid‐tetraploid transformation accompanies functional alteration.
While these diploid and tetraploid Meth‐A cell lines may provide a cell system for investigating the alterations induced by polyploidization, an octaploid Meth‐A cell line has also been desired to make a complete cell system for studying polyploid cells. Furthermore, it was not clear whether the tetraploid cell line could be established from transient tetraploid cells produced by polyploidization of diploid cells. To examine whether or not octaploid Meth‐A cells are established from transient octaploid cells, we designed this experiment to produce transient octaploid and hyperploid cells.
Graves & McMillan (1984) reported that the duration of S phase was almost constant regardless of the DNA content. Although several studies have reported a constant duration of the S phase regardless of the polyploidization of cultured cells (Graves & McMillan 1984; Usui et al. 1991; Brenneisen et al. 1994; Watters et al. 1994; Jordan et al. 1996; Zhang et al. 1996; Fujikawa‐Yamamoto et al. 1997b), alterations in cell cycle parameters with ploidy have not been well studied.
In this study, octaploid Meth‐A cell lines were reproducibly established from hexadecaploid Meth‐A cells produced by demecolcin, and were examined in comparison with diploid and tetraploid Meth‐A cells regarding cell cycle, cell volume and morphology. A model of DNA structure in cells will be presented to explain the mechanism of establishment of octaploid Meth‐A cells.
MATERIALS AND METHODS
Cells
Meth‐A cells (a methylcholanthrene‐induced mouse abdominal dropsy sarcoma cell line) were maintained in a humidified atmosphere of 5% CO2 at 37 °C as a suspension culture in a Leibovitz's L15: Ham's F10 mixture (7 : 3) supplemented with 10% foetal bovine serum (CELLect GOLD, ICN Biomedicals, Aurora, OH, USA), streptomycin (100 µg/mL) and penicillin (50 units/mL). The tetraploid and octaploid Meth‐A cells were cultured under the same conditions described above.
Drug treatment and drug release
Exponentially growing tetraploid Meth‐A cells were plated in eight culture flasks (25 cm2, Corning Costar Co., Acton, MA, USA) at a density of about 5 × 10⁵ cells/flask. Twelve hours thereafter, the cells were exposed to demecolcin (270 nm, Funakoshi, Tokyo, Japan). The cells were released from the drug exposure at 24, 48, 72 or 94 h after drug addition by centrifugation and re‐suspension in drug‐free medium. The Meth‐A cells were subcultured through medium changes and the cell density was maintained at more than 1 × 10⁴ cells/flask. The cell number was counted using a haemocytometer at the time of subculturing. Cellular DNA content was checked by flow cytometry (FCM) when the cells multiplied sufficiently to obtain DNA histograms.
Cell growth
Octaploid Meth‐A cells cultured continuously for 6 months were used. The cells were subcultured everyday by 1 : 2 or 1 : 4 dilutions in culture flasks (25 cm2, Corning Costar Co., MA, USA), and the residual cells were enumerated. Diploid and tetraploid Meth‐A cells were prepared as controls for the measurements. Octaploid Meth‐A cells stored at −135 °C in early passages were resolved in the culture, and compared with the octaploid cells cultured long‐term.
Cell preparation for FCM and cell counting
The cells were fixed with 20% ethanol, and then incubated with 0.25% RNase (Type II‐A, Sigma, St Louis, MO, USA) for 3 h at 4 °C. The cells were counted using a haemocytometer. Immediately before the measurements, the cells were stained with PI (propidium iodide, 7.5 × 10⁻⁵ m) and examined for red fluorescence by FCM. Under these staining conditions, the signal due to residual double‐stranded RNA is negligible and the relative intensity of the red fluorescence corresponds to the DNA content (Krishan 1975).
Flow cytometry (FCM)
The fluorescence from individual cells was measured using a FACSORT (Becton Dickinson Immunocytometry Systems, Franklin lake, ND, USA). The fluorescence of individual cells irradiated with a focused laser light at a wavelength of 488 nm was detected using a photomultiplier tube. The relative intensity of red fluorescence (FL2A and FL2H) was measured and DNA histograms were obtained. The forward scatter signals were also recorded at the same time.
Cell cycle analysis
FCM data of FL2H, signals of red‐fluorescence intensity through a logarithmic amplifier, for 10 000 cells were input to CASL software for cell cycle analysis of DNA histograms on a log scale using the transfer software ‘FACS to ASCII’ (free ware), and the DNA histograms were decomposed to cell fractions based on DNA content (Fujikawa‐Yamamoto 1999). CASL is written using Mathematica (Ver. 2.2) with a personal computer (Macintosh) and can analyse DNA histograms with a DNA content of 2c to 128c. The algorithm is similar to Fried's method (Fried et al. 1976; Fried 1977) except that normal distribution functions having the same half‐width instead of the same CV (coefficient of variation) value are used as components.
Chromosome analysis
Exponentially growing diploid, tetraploid and octaploid Meth‐A cells in culture dishes (60 mm diameter, Nalge Nunc International, IL, USA) were exposed to demecolcin at a concentration of 270 nm for 1 h. The cells were centrifuged, swelled with 75 mm KCl, fixed with fixing solution (CH3OH : CH3COOH = 7 : 3) and dropped onto glass slides. The cells were stained with Giemsa solution in order to photograph the chromosomes. Chromosome numbers were counted from the photographs. Karyotype analysis was performed by a Karyovision (Sumitomo Kinzoku, Tokyo, Japan).
Cell volume distribution
Exponentially growing diploid, tetraploid and octaploid Meth‐A cells were fixed with 20% ethanol and resuspended in PBS(–). The distribution of cell volume (Coulter volume) was measured using a Coulter Counter (ZM/256, Coulter Electronics, Fullerton, CA, USA). Note that the Coulter volume depends on the material being tested, because it is calculated based on the resistance of particles.
Observation of cell morphology
Exponentially growing diploid, tetraploid and octaploid Meth‐A cells were washed once with PBS(–) and fixed with methanol. The cells were stained by a haematoxylin/eosin method. Photographs were taken under a microscope (BX 50, Olympus, Tokyo, Japan.) equipped with a digital camera system (DS4040, Olympus). The images were entered into a personal computer and printed out at a given magnification.
RESULTS
To examine the polyploidization by demecolcin, tetraploid Meth‐A cells were prepared in eight culture flasks, exposed to demecolcin for 1, 2, 3 and 4 days (two flasks each), and then released from the drug. Changes in DNA histograms are shown in Fig. 1. The DNA content of the main population was 8c, 8c‐16c, 16c and 16c‐32c at 1, 2, 3 and 4 days after the drug addition, respectively. To determine the ploidy of the cell population, the histogram pattern 2 day after the drug removal was used. At 2 day after the drug removal, the DNA content of the cell population became 8c‐16c, 8c‐32c and 16c‐32c for 1, 2 and 3–4 days exposure of drug, respectively. The tetraploid cells were certainly polyploidized to octaploid, octaploid‐hexadecaploid mixture and hexadecaploid by the drug exposure for 1, 2 and 3–4 days, respectively.
Figure 1.
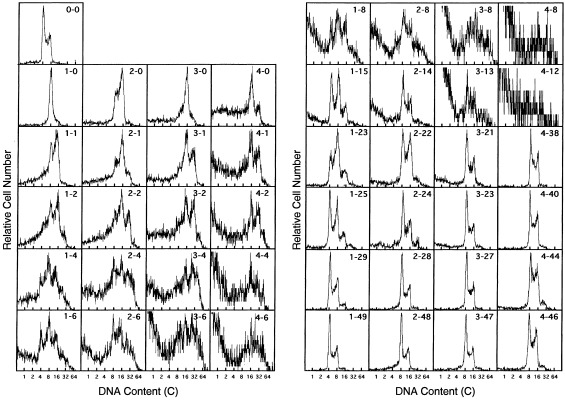
Changes in DNA fluorescence histograms of Meth‐A cells after the addition and removal of demecolcin. Exponentially growing tetraploid Meth‐A cells were exposed to demecolcin at a concentration of 270 nm for 1, 2, 3 or 4 days. The cells were released from the drug and cultured again with occasional subculturing. Paired numerals in the histogram represent the time (days) of the drug removal and the time after removal, in that order. The abscissa represents the relative DNA content (c, complement).
The cell population exposed to demecolcin for 1 day (two flasks) returned to tetraploid through a tetraploid‐octaploid cell mixture at 15–23 days after the drug removal. The cell population exposed to demecolcin for 2, 3 and 4 days became octaploid at 14, 21 and 38 days after drug exposure, respectively, without a transient state of tetraploid‐octaploid cell mixture. It was concluded that stable octaploid cells were obtained from the cell population containing hexadecaploid cells.
The changes in cell number after the drug removal are shown in Fig. 2. Meth‐A cells grew slowly with a doubling time of above 112 h for about 10 days after the demecolcin removal. At this stage, the cells showed hyperploidization and cell death (see Fig. 1). At more than 24 days after the drug release, the Meth‐A cells proliferated rapidly with a doubling time of about 29 and 30 h for tetra‐ and octaploid Meth‐A cells, respectively. No difference was observed between duplicate flasks, except in two flasks exposed to demecolcin for 4 days, in which only one cell in the population in a flasks could proliferate (monoclonal), while the cells in the other flask could not grow. One monoclonal and four polyclonal octaploid Meth‐A cells were obtained.
Figure 2.
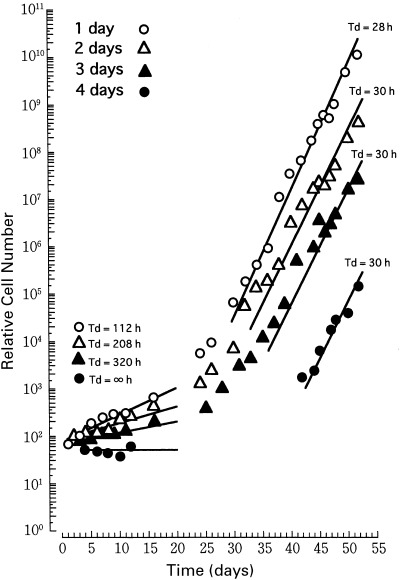
Changes in cell number of Meth‐A cell population after the removal of demecolcin. Exponentially growing tetraploid Meth‐A cells were exposed to demecolcin at a concentration of 270 nm for 1, 2, 3 or 4 days. The cells were released from the drug and cultured again with occasional subculturing. Open circles, open triangles, closed triangles and closed circles correspond to Meth‐A cells treated with demecolcine for 1, 2, 3 and 4 days, respectively. The abscissa represents days after the first release of demecolcin.
The cells were cultured long‐term to establish the octaploid Meth‐A cells and the DNA histograms were measured (Fig. 3). The DNA content of octaploid Meth‐A cells was about four times that of the diploid cells, and it did not change for about 8 months with occasional subculturing of the cells. The estimated passage number was above 180, indicating the establishment of the cell line. No significant difference was observed among five lines of octaploid Meth‐A cells (data not shown). Thereafter, a mixture of five octaploid Meth‐A cell cultures was used as an octaploid Meth‐A cell line.
Figure 3.
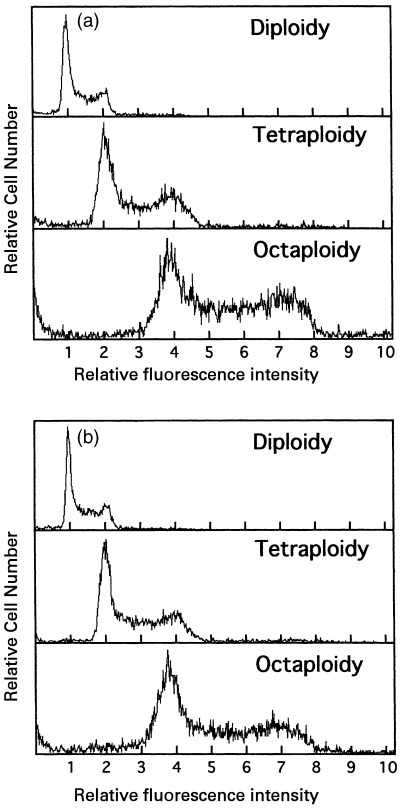
DNA fluorescence histograms of octaploid Meth‐A cells before and after long‐term culturing. (a) and (b) represent DNA histograms at the beginning (0 month) and the end (8 month) of the observation period, respectively. The abscissa represents the relative intensity of red fluorescence.
To examine the integrity of octaploid Meth‐A cells, the chromosomes were examined and compared with those of the diploid (grandparent) and tetraploid (parent) Meth‐A cells. Figure 4 shows the distribution of chromosome numbers and a karyotyping chart for the octaploid Meth‐A cells. The chromosomes numbered 160–180 (about two times that of tetraploidy, Fujikawa‐Yamamoto et al. 2001a) and could be divided into above 20 groups of eight homologous chromosomes, proving that the cells were octaploid.
Figure 4.
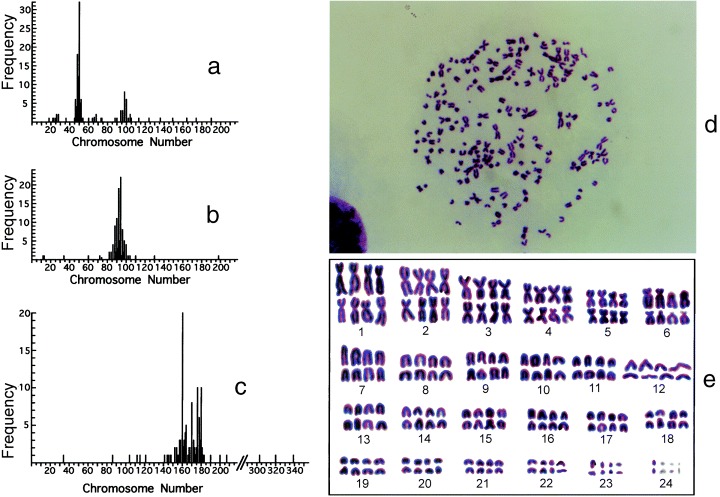
Histograms of chromosome number (a, b and c), a photomicrograph (d), and a karyotyping chart (e) of diploid (a), tetraploid (b) and octaploid (c, d and e) Meth‐A cells. Exponentially growing diploid, tetraploid and octaploid Meth‐A cells were exposed to demecolcin at the concentration of 270 nm for 1 h. The chromosomes were stained with Giemsa solution. The chromosomes of about 100 cells were enumerated from enlarged photographs. In karyotyping, the photomicrograph (d) was used and the assignment for small chromosomes remained obscure. (a) and (b) are of the data from Fujikawa‐Yamamoto et al. (2001a) and they were presented here to facilitate understanding.
To examine the cell cycle parameters, the doubling time and phase fraction of octaploid Meth‐A cells were measured and compared with those of the diploid and tetraploid cells. Figure 5 shows the changes in cell numbers during long‐term culturing (left panel). The doubling times of the cell populations were about 24.0, 28.3 and 30.2 h for diploid, tetraploid and octaploid Meth‐A cells, respectively. We therefore conclude that the doubling time of Meth‐A cells increased with the increase of ploidy under these experimental conditions.
Figure 5.
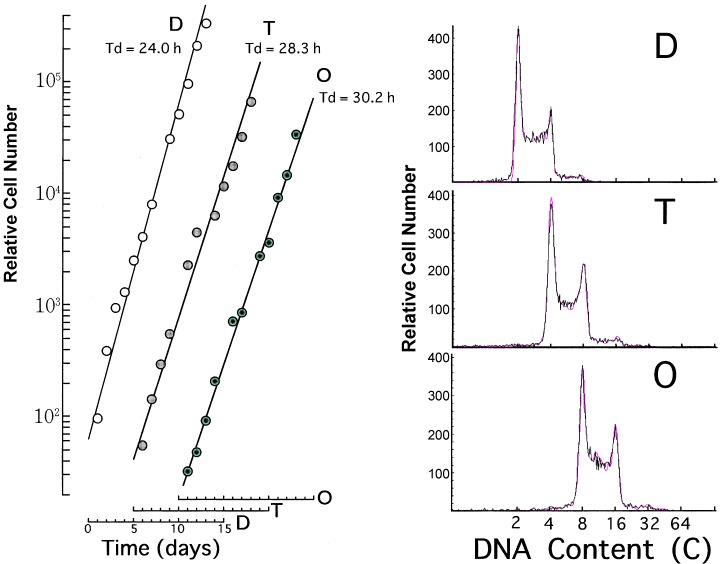
Growth curves (left panel) and representative CASL outputs (right panel) for diploid (D), tetraploid (T) and octaploid (O) Meth‐A cells. Exponentially growing diploid, tetraploid and octaploid Meth‐A cells were cultured long‐term with daily subculturing. Changes in the relative numbers of diploid (open circles), tetraploid (dotted circles) and octaploid (closed circles) Meth‐A cells were enumerated (left panel). The abscissa represents the time (days). Solid lines were drawn to facilitate understanding. In the right panel, solid (black) and dotted (red) lines represent experimental and synthesized histograms, respectively.
Representative outputs of CASL for DNA histograms of exponentially growing diploid, tetraploid and octaploid Meth‐A cells are also shown in Fig. 5 (right panel). The phase fractions obtained using CASL and the calculated durations of G1, S and G2 + M phases are listed in Table 1. The durations of G1, S and G2 + M phases increased 0.3, 2 and −0.4 h with a ploidy increase of 4–8, respectively, though the proportions of these fractions were almost the same in diploid, tetraploid and octaploid Meth‐A cells. We conclude that marked alterations in the phase duration did not occur during the diploid‐tetraploid‐octaploid transformation of Meth‐A cells. No significant difference was observed between octaploid Meth‐A cells re‐cultured after storage at −135 °C and those cultured continuously (data not shown).
Table 1.
Cell cycle parameters of diploid, tetraploid and octaploid Meth‐A cells
| G1 | S | G2/M | |
|---|---|---|---|
| Diploid cells (Td = 24.0 h) | |||
| Fraction* | 0.333 | 0.513 | 0.155 |
| (0.303) | (0.467) | (0.141) | |
| Duration (h)** | 6.3 | 12.7 | 5.0 |
| Tetraploid cells (Td = 28.3 h) | |||
| Fraction* | 0.329 | 0.477 | 0.195 |
| (0.273) | (0.396) | (0.162) | |
| Duration (h)** | 7.3 | 13.7 | 7.3 |
| Octaploid cells (Td = 30.2 h) | |||
| Fraction* | 0.321 | 0.507 | 0.172 |
| (0.265) | (0.418) | (0.142) | |
| Duration (h)** | 7.6 | 15.7 | 6.9 |
Phase fractions of diploid, tetraploid and octaploid Meth‐A cells were determined, omitting those for cells with other ploidy in the Meth‐A cell population. Numbers in parenthesis represent the fraction of the total cell population.
Phase duration was calculated using conventional equations (Watanabe & Okada 1967) employing the doubling time instead of the cycle time.
To examine the morphological characteristics of octaploid Meth‐A cells, light micrographs and the volume distribution of the octaploid cells were compared with those of diploid and tetraploid cells (Fig. 6). Most octaploid Meth‐A cells were mononuclear and exhibited normal cell division. The cell volume (coulter volume) was about two times that of the tetraploid cells, though octaploid cells were derived from hexadecaploid cells whose cell volume was larger than that of octaploid cells (from forward scatter signal intensity of FCM, data not shown), suggesting cell division without DNA replication in hexadecaploid cells.
Figure 6.
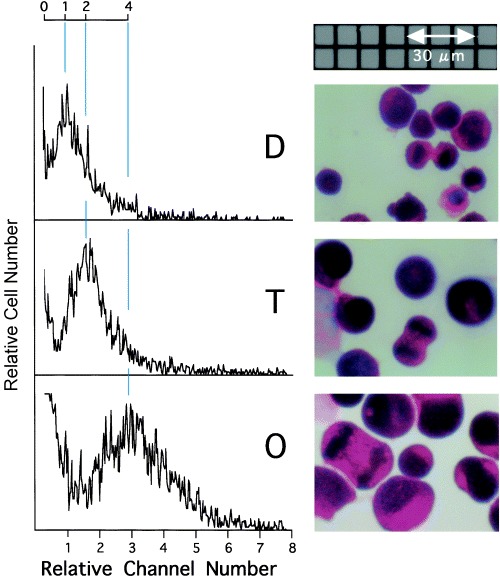
Volume distribution (left panels) and light micrographs (right panels) of diploid (D), tetraploid (T) and octaploid (O) Meth‐A cells. Exponentially growing diploid, tetraploid and octaploid Meth‐A cells were prepared for measurements. The cells were stained with HE. In the left panel, longitudinal lines (blue) and scale were drawn to facilitate understanding.
DISCUSSION
Polyploidization of mammalian cells occurs in various organs, particularly in the aged or partially hepatectomized liver; however, the mechanisms of polyploidization are poorly understood (Mossin et al. 1994; Zong et al. 1994; Fogt & Nanji 1996; Seglen 1997). Harris (1971) and Graves & McMillan (1984) established tetraploid V79 Chinese hamster cells by cloning after demecolcin treatment; however, DNA degradation occurred within 2 months in the tetraploid cells. Establishment of stable polyploid cell lines has been desired for the purpose of studying ploidy. Here, we established an octaploid Meth‐A cell line from tetraploid Meth‐A cells, providing a set of sequentially derived mammalian diploid, tetraploid and octaploid cells.
It is of interest that octaploid Meth‐A cells were established only from the cell populations released from demecolcine exposure for 2, 3 and 4 days, not but 1 day. Though the Meth‐A cell population exposed to demecolcine for 1 day showed octaploid cells 1 day after the drug removal, the octaploid Meth‐A cells could not be established. These results suggest that octaploid Meth‐A cells polyploidized directly from tetraploid cells differ from those made by DNA degradation with a unit of octaploid set of chromosomes in hexadecaploid cells. Different responses of polyploidized cells after the removal of the polyploidizing agent has also been observed in Meth‐A cells (Fujikawa‐Yamamoto et al. 2001a) and V79 cells (Fujikawa‐Yamamoto et al. 2000a).
It is also of interest that the cell volume of octaploid Meth‐A cells was about twice that of tetraploid cells, though the octaploid Meth‐A cells were established from hexadecaploid cells whose volume was larger than twice that of tetraploid cells (data from forward scatter of FCM, data not shown). This fact suggests that cell division occurred without DNA replication in hexadecaploid cells. Presently, we have no evidence to explain these two experimental findings. An understanding of the DNA structure of polyploid cells may be required to explain these results.
1987, 1989a, 1989b, 1996) presented a set of models for the DNA structure in cells. In one model, the double‐stranded DNA in cells has a fractal‐like structure with an S‐shaped unit and homologous chromosomes are orientated point symmetrically (Takahashi 1996). To interpret our experimental results for octaploid Meth‐A cells, Takahashi's model was extended to polyploid cells (Fig. 7).
Figure 7.
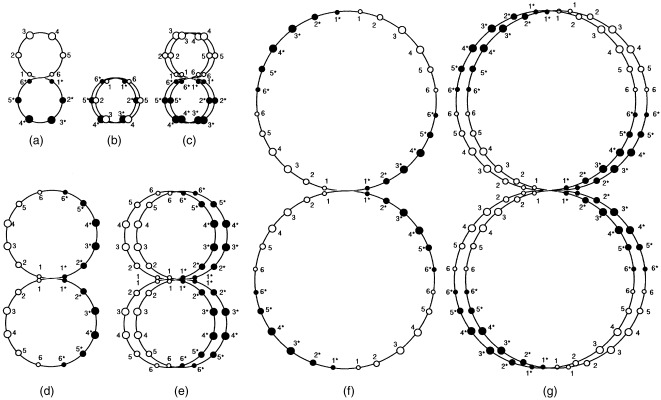
A model of the DNA structure of diploid, tetraploid, octaploid and hexadecaploid cells. In diploid cells (a, b and c), DNA is linked as homologous chromosomes arrange to point symmetrically (a). Circles 1 and 6, 2 and 5, and 3 and 4 represent sets of short, medium‐sized and long chromosomes, respectively. Chromosomes are linked with linker DNA (large circles). 1–6 and 1* to 6* represent paternal and maternal haploid sets, respectively. Except in meiosis, homologous chromosomes cannot close each other in the folded structure in G0/G1 phase (b). (c) is the replicated DNA structure in G2 phase. (d) represents a DNA structure of tetraploid cells in which maternal 1* and paternal 1 DNA of diploid cells are linking. (e) and (g) are the DNA structure of transient octa‐ and hexadecaploid cells, respectively. (f) represents a DNA structure of octaploid.
As shown in Fig. 7, homologous chromosomes cannot close in on each other in the folded structure (Rabl orientation) at G1 phase in diploid cells, but can in tetra‐, octa‐ and hexadecaploid cells. Polyploid cells are made through linking between double‐strand DNA chains at the midpoint. DNA replication of paired double‐strand DNA may be bypassed, resulting in ploidy degradation through cell division without DNA replication. In Fig. 7, two types of DNA structures (E and F) of octaploid cells are shown. E and F represent DNA structures just before the linking of two DNA chains, and after the rearrangement of DNA, respectively. These may correspond to octaploid Meth‐A cells after release from demecolcin exposure for 1 day (E) and established octaploid cells (F), respectively. It is probable that the octaploid Meth‐A cell line was established through DNA pairing between octaploid sets of chromosomes in hexadecaploid cells and subsequent cell division without DNA replication. The cells having DNA structure of D and F may be relatively stable, because pairing of homologous chromosomes are possible only in the G1 phase.
It should be noted that most cells died in the drug exposure and after the drug release. An octaploid cell survived from a population of 5 × 10⁵ cells exposed to demecolcin for 4 days. The numbers of surviving cells from populations of 1, 2 and 3 days exposure of drug were about 33 000 (15 PDL), 4000 (12 PDL) and 250 (8 PDL), which were roughly calculated from the delay of 19, 15 and 10 days, and the doubling time of 30 h, respectively. It seems that most cells died in the process of polyploidization and after the drug removal. Slow growth with a doubling time of above 112 h for about 10 days after the demecolcin removal may be due to cell death.
It is of interest that the phase fractions of the cell populations were almost the same in diploid, tetraploid and octaploid Meth‐A cells, though a small increase in the doubling time was observed, suggesting that octaploid Meth‐A cells have a normal cell cycle. Though tetraploid and octaploid cells are not major cell constituents in mammals, the results obtained here suggest that an increase in ploidy and in cell volume does not impair cell survival. It seems that high stability of ploidy in diploid cells, except meiosis, is attributable to the DNA structure in cells.
ACKNOWLEDGEMENTS
This study was supported in part by a Grant‐in‐Aid for Scientific Research from the Ministry of Education, Culture, Sports, Science and Technology of Japan (13670228), and by a grant for High‐Technology Research Center Project by Kanazawa Medical University (H‐01).
REFERENCES
- Brenneisen P, Gogol J, Bayreuther K (1994) DNA synthesis and Fos and Jun protein expression in mitotic and postmitotic WI‐38 fibroblasts in vitro . Exp. Cell Res. 211, 219. [DOI] [PubMed] [Google Scholar]
- Fogt F, Nanji AA (1996) Alterations in nuclear ploidy and cell phase distribution of rat liver cells in experimental alcoholic liver disease: relationship to antioxidant enzyme gene expression. Toxicol. Appl. Pharmacol. 136, 87. [DOI] [PubMed] [Google Scholar]
- Fried J (1977) Analysis of deoxyribonucleic acid histograms from flowcytofluorometry. Estimation of distribution of cells within S phase. J. Histochem. Cytochem. 25, 942. [DOI] [PubMed] [Google Scholar]
- Fried J, Perez AG, Clarkson BD (1976) Flowcytofluorometric analysis of cell cycle distribution using propidium iodide. Properties of the method and mathematical analysis of the data. J. Cell Biol. 71, 172. [DOI] [PMC free article] [PubMed] [Google Scholar]
- Fujikawa‐Yamamoto K (1999) Cell cycle analysis of DNA histograms in logarithmic scale. Cytometry Res. 9, 73. [Google Scholar]
- Fujikawa‐Yamamoto K, Zong Z, Murakami M, Odashima S, Ikeda T, Yoshitake Y (1997a) Spontaneous polyploidization results in apoptosis in a Meth‐A tumor cell line. Cell Struct. Funct. 22, 399. [DOI] [PubMed] [Google Scholar]
- Fujikawa‐Yamamoto K, Zong Z, Murakami M, Odashima S (1997b) Different manner of DNA synthesis in polyploidizations of Meth‐A and B16F10 cell lines. Cell Struct. Funct. 22, 527. [DOI] [PubMed] [Google Scholar]
- Fujikawa‐Yamamoto K, Yamagishi H, Zong Z, Ohdoi C, Wang S (2000a) Different responses of polyploidized V79 cells after removal of two drugs, demecolcin and K‐252a. Cell Struct. Funct. 25, 41. [DOI] [PubMed] [Google Scholar]
- Fujikawa‐Yamamoto K, Ohdoi C, Yamagishi H, Zong Z, Wang S (2000b) Lectin binding in Meth‐A cells polyploidized by different mechanisms. Cytologia 65, 389. [Google Scholar]
- Fujikawa‐Yamamoto K, Wang S, Yamagishi H, Ohdoi C, Murano H, Ikeda T (2001a) Establishment of a tetraploid Meth‐A cell line through polyploidization by demecolcine but not by staurosporine, K‐252a and paclitaxel. Cell Prolif. 34, 211. [DOI] [PMC free article] [PubMed] [Google Scholar]
- Fujikawa‐Yamamoto K, Wang S, Yamagishi H, Miyagoshi M (2001b) Temperature dependence in proliferation of tetraploid Meth‐A cells in comparison with the parent diploid cells. Cell Struct. Funct. 26, 263. [DOI] [PubMed] [Google Scholar]
- Fujikawa‐Yamamoto K, Ikeda T, Wang S, Yamagishi H, Miyagoshi M (2002) Serum dependence in proliferation of diploid and tetraploid Meth‐A cells. Cytologia 67, 75. [DOI] [PubMed] [Google Scholar]
- Graves JA, McMillan J (1984) Control of DNA synthesis in polyploid mammalian cells. J. Cell. Physiol. 121, 409. [DOI] [PubMed] [Google Scholar]
- Harris M (1971) Polyploid series of mammalian cells. Exp. Cell Res. 66, 329. [DOI] [PubMed] [Google Scholar]
- Inoue S (1981) Cell division and the mitotic spindle. J. Cell Biol. 91, 131. [DOI] [PMC free article] [PubMed] [Google Scholar]
- Jordan MA, Wendell K, Gardiner S, Derry WB, Copp H, Wilson L (1996) Mitotic block induced in HeLa cells by low concentrations of paclitaxel (Taxol) results in abnormal mitotic exit and apoptotic cell death. Cancer Res. 56, 816. [PubMed] [Google Scholar]
- Krishan A (1975) Rapid flow cytofluorometric analysis of mammalian cell cycle by propidium iodide staining. J. Cell Biol. 66, 188. [DOI] [PMC free article] [PubMed] [Google Scholar]
- Mossin L, Blankson H, Huitfeldt H, Segren PO (1994) Ploidy‐dependent growth and binucleation in cultured rat hepatocytes. Exp. Cell Res. 214, 551. [DOI] [PubMed] [Google Scholar]
- Seglen PO (1997) DNA ploidy and autophagic protein degradation as determinants of hepatocellular growth and survival. Cell Biol. Toxocol. 13, 301. [DOI] [PubMed] [Google Scholar]
- Takahashi M (1987) A model for the spatio‐temporal organization of DNA replication in mammalian cells. J. Theol. Biol. 129, 91. [DOI] [PubMed] [Google Scholar]
- Takahashi M (1989a) A model of chromatin‐dependent DNA replication sequences based on the decondensation units hypothesis. J. Theol. Biol. 136, 427. [DOI] [PubMed] [Google Scholar]
- Takahashi M (1989b) A fractal model of chromosomes and chromosomal DNA replication. J. Theol. Biol. 141, 117. [DOI] [PubMed] [Google Scholar]
- Takahashi M (1996) A fractal‐like geometry of the nucleus and its reproduction. A Hypothesis In: Takahashi M. ed. A Genomic Theory of the Tumor Cell Cycle. 1st edn, pp. 1–265. Ube: Private Book. [Google Scholar]
- Usui T, Yoshida M, Abe K, Osada M, Isono K, Beppu T (1991) Uncoupled cell cycle without mitosis induced by a protein kinase inhibitor, K‐252a. J. Cell Biol. 115, 1275. [DOI] [PMC free article] [PubMed] [Google Scholar]
- Watanabe I, Okada S (1967) Effects of temperature on growth rate of cultured mammalian cells (L1578Y). J. Cell Biol. 32, 309. [DOI] [PMC free article] [PubMed] [Google Scholar]
- Watters DJ, Beamish HJ, Marshall KA, Gardiner RA, Seymour GJ, Lavin MF (1994) Accumulation of HL‐60 leukemia cells in G2/M and inhibition of cytokinesis caused by two marine compounds, bistraten A and cycloxazoline. Cancer Chemother. Pharmacol. 33, 399. [DOI] [PubMed] [Google Scholar]
- Zhang Y, Wang Z, Ravid K (1996) The cell cycle in polyploid megakaryocytes is associated with reduced activity of cyclin B1‐dependent cdc2 kinase. J. Biol. Chem. 271, 4266. [DOI] [PubMed] [Google Scholar]
- Zong Z, Fujikawa‐Yamamoto K, Teraoka K, Yamagishi H, Tanino M, Odashima S (1994) Potentiation of K‐252a, a protein kinase inhibitor‐induced polyploidization, by cAMP in cultured fibrosarcoma cell line. Biochem. Biophys. Res. Commun. 205, 746. [DOI] [PubMed] [Google Scholar]
- Zong Z, Fujikawa‐Yamamoto K, Tanino M, Yamagishi H, Gai X, Odashima S (1995) The important role of PKC in controlling polyploidy formation in cultured fibrosarcoma cell line. Biochem. Mol. Biol. Intern. 35, 1009. [PubMed] [Google Scholar]
- Zong Z, Fujikawa‐Yamamoto K, Ota T, Murakami M, Li A, Yamaguchi N, Tanino M, Odashima S (1998) Apoptotic cell death of high polyploid cells in a cultured sarcoma cell line. Cell Struct. Funct. 23, 231. [DOI] [PubMed] [Google Scholar]
- Zong Z, Fujikawa‐Yamamoto K, Li A, Yamaguchi N, Chang Y, Murakami M, Ishikawa Y (2000) Involvement of protein kinase C in taxol‐induced polyploidization in a cultured sarcoma cell line. Eur. J. Pharmacol. 394, 181. [DOI] [PubMed] [Google Scholar]


