

Abstract
Objectives
Physiological oxygen tension plays a critical role in homoeostatic maintenance and development of endochondral bone. Based on the proximity between uncalcified cartilage and subchondral bone, and microchannels that serve as a message delivery network between them, we aimed to explore the influence of low oxygen tension on soluble factor secretion in both chondrocytes and osteoblasts, after co‐culture.
Materials and methods
Contact co‐culture was achieved for morphological observation using red fluorescent protein (RFP)‐labelled chondrocytes and green fluorescent protein (GFP)‐labelled osteoblasts, and non‐contact co‐culture achieved by transwell chambers. This was used to screen genetic variation of growth factors in hypoxia, including respective phenotypic markers, factors involving hypoxia and angiogenesis relationships, bone morphogenetic family proteins, and other general factors.
Results
We observed a significant increase in chondrocyte size following co‐culture, in both normoxia and hypoxia, but not of osteoblasts. Expression of Aggrecan in chondrocytes and alkaline phosphatase in osteoblasts was down‐regulated under hypoxia following co‐culture. Under hypoxia, we found that expression of hypoxia‐inducible factor‐1α, vascular endothelial growth factor‐A/B, VE‐cadherin, bone morphogenetic protein‐2, and insulin‐like growth factor‐1 in chondrocytes, increased, but HIF‐1α, platelet‐derived growth factor, BMP‐5/‐6 and fibroblast growth factor‐1 in osteoblasts, decreased.
Conclusions
These results not only indicate the importance of crosstalk between chondrocytes and osteoblasts but also improve our understanding of the mechanisms underlying homoeostatic maintenance of endochondral bone.
Introduction
For homoeostatic maintenance and normal physiological function of articular joints, cartilage and its underlying bone not only locate together intimately and integrate elaborately, but also elegantly interact with each other to facilitate viability, cell proliferation, migration and differentiation, as well as maintaining their phenotype by direct contact or paracrine secretion of soluble growth factors. In physiological communication processes, oxygen requirement differs due to the different genesis patterns and living environments of chondrocytes and osteoblasts. Chondrocytes grow in a microenvironment of low oxygen tension, while osteogenesis and bone remodelling demand sufficient oxygen supply. Previous studies have demonstrated that hypoxic culture conditions and co‐culture with osteoblasts regulate phenotype maintenance and differentiation level of chondrocytes respectively 1. However, to the best of our knowledge, little is known concerning combined effect of the two approaches.
During endochondral ossification, a well‐organized temporal and spatial pattern proseeds, with chondrocytes forming a columnar layer by high levels of proliferation and differentiation into hypertrophic chondrocytes. These are invaded by blood vessels and are replaced by osteoblasts after apoptosis 2. During this process, chondrocytes and osteoblasts interact precisely, and are tightly regulated by direct contact or by paracrine pathways, in which secreted factors act on receptors to afford intracellular signalling or initiation of selective transcription factors 3. Thus, much attention has been placed on specific processes regulating chondrocyte differentiation when incubated with osteoblasts. Previous in vitro studies that dissect out co‐cultures with osteoblasts, have been found to be an effective approach for regulating differentiation of chondrocytes and eliminating increased chondrocyte death 1, 4. So far, studies investigating relationships between chondrocytes and osteoblasts have been performed in normal oxygen tension (~20%). However, because of the lack of vascular system at that stage, nutrient supply for chondrocytes depends primarily on synovial diffusion. Reduced oxygen tension occurs, ranging from approximately 7% in the superficial zone of articular joint to less than 1% in underlying subchondral bone 5, 6. In order to explore mechanisms of chondrocytes differentiation in such a physiological microenvironment, oxygen tension is usually set between 2% to 5% to facilitate the study of hypoxia‐inducible factors (HIF). One of the numerous hallmarks of the response to hypoxia, HIF‐1 (containing HIF‐1α and HIF‐1β 7), plays a vital role in chondrogenesis, cell proliferation and differentiation 8. Further studies on HIF‐1α and transcription factors in chondrocytes have indicated that expression of marker genes is initiated by HIF‐1α at both the genetic expression level and post‐transcriptional stage 9, 10, 11, 12. Additionally, during growth plate development, hypoxia is considered to be a significant promoter of angiogenesis. VEGF‐A mRNA production in chondrocytes has also been modulated by hypoxia in in vitro studies 13, 14.
Based on previous evidence, we have hypothesized that physiological oxygen tension might modulate expression of general soluble growth factors, following crosstalk between chondrocytes and osteoblasts. To test this, we first established co‐culture using transwell chambers to achieve crosstalk between chondrocytes and osteoblasts, and then the co‐culture system was incubated under hypoxic conditions. Cells in differently treated groups were harvested, and variations in expression of growth factors was assayed.
Materials and methods
Cell culture
Primary calvarial osteoblasts and articular chondrocytes were isolated from newborn rats (1–3 days old). Briefly, animals were sacrificed and tissues sterilized, after which primary chondrocytes were excised with ophthalmic scissors, from exposed knee joint surfaces, and epidermis of knee joints was stripped. Collected knee joints were minced into small pieces. Primary osteoblasts were isolated from rat skulls, fragments of which were washed twice in phosphate‐buffered saline (PBS), and cut into small pieces. Tissues were first trypsinized for 30 min in 0.25% protease solution dissolved in Dulbecco's modified Eagle's medium (high‐glucose DMEM, 0.1 mm non‐essential amino acids, 4 mm L‐glutamine, 1% penicillin‐streptomycin solution, Hyclone, Logan, UT, USA). Then the trypsin‐containing supernatant was removed, replaced and chondrocytes digested with 0.5% type II collagenase for 3 h, and osteoblasts digested in 0.5% type I collagenase for 1 h. Next, type I and type II collagenase‐treated solutions were respectively mixed 1:1 (v/v) with fresh 10% heat‐activated foetal bovine serum (FBS) DMEM (high‐glucose DMEM, 0.1 mm non‐essential amino acids, 4 mm L‐glutamine, 1% penicillin‐streptomycin solution). The mixed solutions were centrifuged at 179 × g for 5 min. After the supernatant was removed, fully supplemented medium, consisting of 10% FBS DMEM with 1% penicillin–streptomycin, was mixed with the two kinds of cells and tissues separately. Then, primary chondrocytes and osteoblasts were seeded into plates or flasks under standard humidified atmosphere of 5% CO2 at 37°C.
To obtain green fluorescent protein (GFP)‐positive osteoblasts and red fluorescent protein (RFP)‐positive chondrocytes, skull and knee joint tissues were collected from enhanced GFP transgenic mice (The Centre of Genetically Engineered Mice, West China Hospital, Sichuan University, Chengdu, China) and DsRed‐Express transgenic mice (The Genetic Centre of Institute of Laboratory Animal Sciences, Chinese Academy of Medical Sciences and Centre of Comparative Medicine, Peking Union Medical College, Beijing, China) respectively. Cell isolation was performed as described above. All experimental procedures were conducted in conformity with institutional guidelines for the care and use of laboratory animals. The protocol was approved by the Research Ethics Committee of State Key Laboratory of Oral Diseases (Permit Number: WCHSIRB‐AT‐2014‐042). All mice were sacrificed by intraperitoneal injection of a lethal dose of 10% chloral hydrate, and all efforts were made to minimize suffering.
Co‐culture system and fluorescence microscopy
Cell–cell direct co‐culture of GFP‐osteoblasts and RFP‐chondrocytes was performed for observation of cell morphology. Osteoblasts and chondrocytes were mixed 1:1, seeded into six‐well plates, and cultured for 1 week at 37°C. Cell morphologies were observed using fluorescence microscopy, after monoculture or co‐culture for 4 and 7 days, under different oxygen conditions.
For non‐contact co‐culture, chondrocytes were seeded into six‐well plates using high‐glucose 10% FBS DMEM with 1% penicillin–streptomycin solution in a humidified atmosphere of 5% CO2 at 37°C, and osteoblasts were implanted on transwell inserts with a 0.4 μm pore size in 10% FBS DMEM. After anchoring, chondrocytes and osteoblasts were equilibrated for 24 h with 10% FBS DMEM. After replacing with 2% FBS DMEM for 16 h starvation, culture medium was changed to 1% FBS DMEM. Meanwhile, inserts were placed in bottom wells for non‐contact co‐culture under oxygen concentration of 20% for chondrocytes and 2% for osteoblasts, respectively. Chondrocytes in bottom wells and osteoblasts in transwell inserts alone were used as controls. After 1, 2, 3 and 5 days incubation, cell lysates (1000 μl) were collected for semi‐quantitative polymerase chain reaction (PCR).
Semi‐quantitative PCR
Briefly, chondrocyte and osteoblast RNA was collected and purified using the RNeasy Plus Mini Kit (Qiagen, Shanghai, China), and with genomic DNA eliminator. Then isolated RNA was dissolved in RNase‐free water and quantified by measuring absorbance at 260 nm using a spectrophotometer, after which RNA samples were treated with DNase I (Mbi, GlenBurnie, MD, USA), and cDNA was prepared in a final volume of 20 μl using a synthesis kit (Mbi). Then, semi‐quantitative PCR was performed using a PCR kit (Mbi) with thermo‐cycler (Bio Rad, Hercules, CA, USA). Expression levels of Aggrecan, type II collagen (COL II), and transcriptional factor SOX9 in chondrocytes, Runt‐related transcription factor 2 ( RUNX2) and ALP in osteoblasts, as well as other soluble growth factors, such as HIF‐1α, IGF‐1, PDGF, transforming growth factor‐β1 (TGF‐β1), FGF‐1, FGF‐2, epidermal growth factor (EGF), VEGF‐A, VEGF‐B, VE‐cadherin and BMP family (BMP‐2, BMP‐4, BMP‐5, BMP‐6 and BMP‐7) were analysed (sequences of forward and reverse primers of mRNA were shown in Table 1). To normalize data, mRNA expression of housekeeping genes, glyceraldehyde‐3‐phosphate dehydrogenase (GAPDH) and beta‐ACTIN gene (β‐ACTIN), were also analysed. BLAST was used to search for all primer sequences to ensure gene specificity. Semi‐quantitative PCRs were performed in a 25 μl volume containing 1 μl cDNA. Cycling conditions consisted of 28–35 amplification cycles of 30 s denaturation at 94°C, 30 s annealing at 55–65°C, and 30 s elongation at 72°C. Products were separated by 2% agarose gel electrophoresis in trisborate/ethylenediaminetetraacetic acid (EDTA) buffer, and stained with ethidium bromide. Data quantification was assessed by optical density with an Image‐Pro Plus 6.0.
Table 1.
Sequences of forward and reverse primers of housekeeping genes and related soluble growth factor genes in osteoblasts and chondrocytes for semi‐quantitative PCR
| mRNA | Product length | Primer pairs | |
|---|---|---|---|
| GAPDH | 233 bp | Forward | ACAGCAACAGGGTGGTGGAC |
| Reverse | TTTGAGGGTGCAGCGAACTT | ||
| β‐ACTIN | 266 bp | Forward | CACCCGCGAGTACAACCTTC |
| Reverse | CCCATACCCACCATCACACC | ||
| HIF‐1α | 122 bp | Forward | CGATGACACGGAAACTGAAG |
| Reverse | CAGATTCAGGTAATGGAGACA | ||
| COL II | 116 bp | Forward | TCAAGTCGCTGAACAACCAG |
| Reverse | G TCTCCGCTCTTCCACTCTG | ||
| Aggrecan | 137 bp | Forward | GCAGCACAGACACTTCAGGA |
| Reverse | CCCACTTTCTACAGGCAAGC | ||
| SOX9 | 120 bp | Forward | TTGGTCCGAGGTCTCTAAGGT |
| Reverse | AAAGTTGTCGCTCCCACTGA | ||
| RUNX2 | 106 bp | Forward | CCTCTGACTTCTGCCTCTGG |
| Reverse | GATGAAATGCCTGGGAACTG | ||
| ALP | 101 bp | Forward | CCTGACTGACCCTTCCCTCT |
| Reverse | CAATCCTGCCTCCTTCCACT | ||
| BMP‐2 | 102 bp | Forward | TCAAGCCAAACACAAACAGC |
| Reverse | CCACGATCCAGTCATTCCA | ||
| BMP‐4 | 101 bp | Forward | GACTTCGAGGCGACACTTCT |
| Reverse | AGCCGGTAAAGATCCCTCAT | ||
| BMP‐5 | 115 bp | Forward | AAGGAGGCTTGGGAGACAAT |
| Reverse | CTGTGAGGCAAACCCAGAAT | ||
| BMP‐6 | 101 bp | Forward | TGTCAGAGGGAGAGGGACTG |
| Reverse | CTTGCGGTTCAGGGAGTGT | ||
| BMP‐7 | 197 bp | Forward | CGCTCCAAGACTCCAAAGAA |
| Reverse | TTCAGAGGGAAGGCACACTC | ||
| VEGF‐A | 154 bp | Forward | TCATCAGCCAGGGAGTCTGT |
| Reverse | TGAGGGAGTGAAGGAGCAAC | ||
| VEGF‐B | 127 bp | Forward | GCAACACCAAGTCCGAATG |
| Reverse | TGGCTTCACAGCACTCTCC | ||
| TGF‐β1 | 204 bp | Forward | CCGCAACAACGCAATCTAT |
| Reverse | CCAAGGTAACGCCAGGAAT | ||
| FGF‐1 | 134 bp | Forward | GGCTCGCAGACACCAAAT |
| Reverse | CGCTTACAACTCCCGTTCTT | ||
| FGF‐2 | 106 bp | Forward | CCATCAAGGGAGTGTGTGC |
| Reverse | TCCAGGCGTTCAAAGAAGAA | ||
| IGF‐1 | 106 bp | Forward | TCTACCTGGCACTCTGCTTG |
| Reverse | GGTCCACACACGAACTGAAG | ||
| PDGF | 100 bp | Forward | GCTGTTCACTTGCTTCTTGC |
| Reverse | AGGCACCACTTCCATTTCTG | ||
| EGF | 141 bp | Forward | GCCACGGTTACATTCACTCC |
| Reverse | TCCAAATCGCCTTCTCTTTC | ||
| VE‐cadherin | 111 bp | Forward | ACGAGGACAGCAACTTCACC |
| Reverse | GCACAGGCAGGTAGTGGAAC | ||
Statistical analysis
After mean OD value of the gene expression in each group (G1 = normoxic monoculture group/G2 = normoxic co‐culture group/G3 = hypoxic monoculture group/G4 = hypoxic co‐culture group) was calculated (Table S1, S2, S4, S5), we tested fold change between the experimental group (G2, G3 and G4 respectively) and control group (G1) by using factorial analysis to determine whether differences existed between groups of different oxygen tension (G3/G1), culture methods (G2/G1) or combined effects (G4/G1) (Table S3 and S6). A post hoc test was used for all pairwise comparisons, and statistical significance was set at P < 0.05.
Results
Cell morphology changes after crosstalk between chondrocytes and osteoblasts
After 4 and 7 days co‐culture under different oxygen conditions (Fig. 1a), morphology of osteoblasts and chondrocytes was observed using fluorescence microscopy (Fig. 1b). There was no significant difference in cell numbers of different groups (Fig. 1c). With co‐culture, cell sizes of chondrocytes were significantly larger compared to 4‐day monoculture cells, which may demonstrate crosstalk between osteoblasts and chondrocytes, but not of osteoblasts alone (Fig. 1d).
Figure 1.
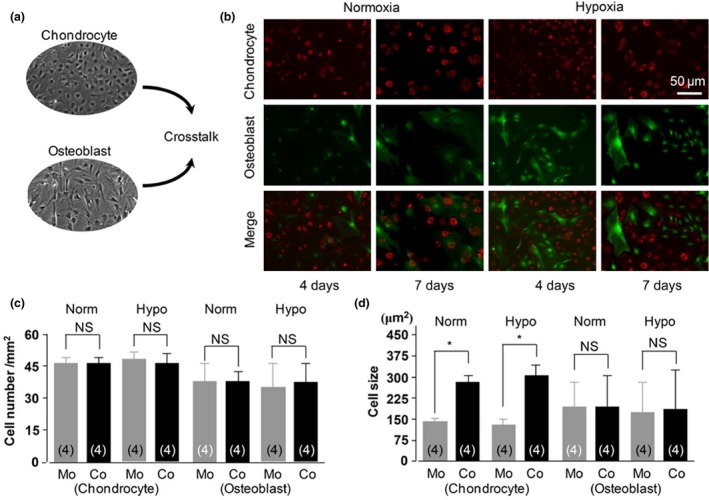
Cell morphology changes after crosstalk between chondrocytes and osteoblasts. non‐contact and contact crosstalk between chondrocytes and osteoblasts, (b) representative cell morphologies in contact cell–cell co‐culture using chondrocytes from RFP‐labelled mice and osteoblasts from GFP‐labelled mice, and (c) unchanged cell numbers in all groups. Norm, normoxia; Hypo, hypoxia; Mo, monoculture; Co, co‐culture; NS, no significant difference; (d) changes of cell sizes. *P < 0.05 for the difference between the monoculture group and co‐culture group (n = 4).
Co‐culture down‐regulated osteoblast‐ and chondrocyte‐specific genes in physiological oxygen tension
Expression of osteoblast and chondrocyte marker genes, both in monoculture and co‐culture groups, was detected at 1, 2, 3 and 5 days. First, we investigated expression of Aggrecan, COL II, and SOX9 in chondrocytes. We found that hypoxia down‐regulated detectable expression levels of the first two marker genes in both co‐culture and monoculture groups. Compared to chondrocyte monocultures, Aggrecan and COL II were expressed at lower levels when incubated with osteoblasts (Aggrecan down to 19.8% and COL II down to 34.1%) compared to monoculture, indicating dedifferentiation performance. Moreover, expression decreased in a time‐dependent manner. However, we observed no significant difference in expression of SOX9 between groups, regardless of hypoxia or co‐culture treatment (Fig. 2a, Table 2a).
Figure 2.
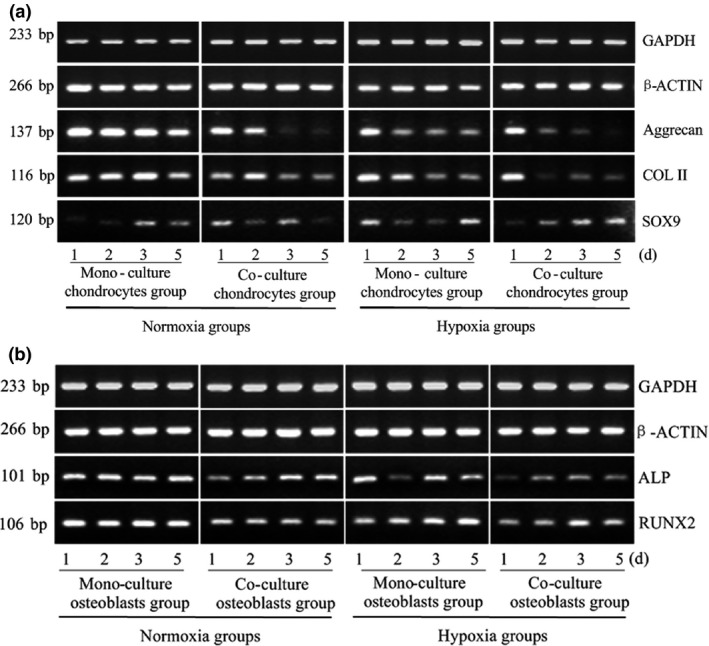
Co‐culture down‐regulates expression of specific genes in both osteoblasts and chondrocytes under physiological oxygen tension. (a) Aggrecan, COL II and SOX9 gene expression in chondrocytes and (b) ALP and RUNX2 gene expression in osteoblasts measured at different oxygen tensions and from different culture methods. GAPDH and β‐ACTIN were used as internal references. The product sizes are indicated in the left lane. The samples were collected at 1, 2, 3 and 5 days. The gels shown are representative of three different experiments (n = 3).
Table 2.
Mean of fold change and statistical differences of gene expression for soluble growth factors regulated by different oxygen tensions and culture methods. (a) Gene expression in chondrocytes; (b) gene expression in osteoblasts
| Growth factor gene | Mean Fold Change (Ratio to normal chondrocytes) | |||||
|---|---|---|---|---|---|---|
| Co‐culture | Hypoxia | Combined effect | ||||
| (a) | ||||||
| Aggrecan | 0.300 | ↓* | 0.274 | ↓* | 0.198 | ↓** |
| Col II | 0.480 | – | 0.619 | – | 0.341 | – |
| SOX9 | 1.227 | – | 2.178 | – | 1.784 | – |
| HIF‐1α | 0.784 | – | 2.077 | ↑* | 1.414 | – |
| VEGF‐A | 1.633 | – | 2.118 | ↑* | 4.457 | ↑* |
| VEGF‐B | 1.819 | ↑* | 2.374 | ↑** | 3.660 | ↑** |
| VE‐cadherin | 1.188 | – | 3.797 | ↑** | 2.664 | ↑** |
| PDGF | 0.471 | – | 0.512 | – | 0.362 | – |
| BMP‐2 | 1.367 | – | 1.768 | ↑* | 1.774 | ↑* |
| BMP‐4 | 1.109 | – | 0.504 | ↓* | 0.388 | – |
| BMP‐5 | 1.437 | – | 1.280 | – | 1.785 | – |
| BMP‐6 | 1.681 | – | – | – | 1.585 | – |
| BMP‐7 | – | – | – | – | – | – |
| IGF‐1 | 2.774 | – | 3.602 | ↑* | 2.291 | ↑** |
| FGF‐1 | 1.371 | – | 1.181 | – | 1.353 | – |
| FGF‐2 | 1.216 | – | 1.326 | – | 1.592 | – |
| TGF‐β1 | 1.167 | – | 1.173 | – | 1.037 | – |
| EGF | – | – | – | – | – | – |
| (b) | ||||||
| ALP | 0.604 | ↓* | 0.686 | ↓* | 0.371 | ↓* |
| RUNX2 | 0.498 | ↓** | 0.650 | – | 0.422 | ↓* |
| HIF‐1α | 0.674 | ↓* | 0.894 | – | 0.376 | ↓*** |
| VEGF‐A | 0.726 | – | 0.965 | – | 1.206 | – |
| VEGF‐B | 0.763 | – | 1.021 | – | 1.250 | – |
| VE‐cadherin | – | – | – | – | – | – |
| PDGF | 0.424 | ↓* | 0.333 | ↓* | 0.318 | – |
| BMP‐2 | 0.776 | ↓* | 1.786 | ↑* | 0.972 | – |
| BMP‐4 | 0.767 | – | 0.835 | – | 1.088 | – |
| BMP‐5 | 0.621 | – | 0.704 | – | 0.400 | ↓* |
| BMP‐6 | 0.425 | ↓* | 0.459 | ↓* | 0.209 | – |
| BMP‐7 | 0.720 | – | 1.158 | – | 0.903 | – |
| IGF‐1 | 0.876 | – | 1.285 | – | 1.170 | – |
| FGF‐1 | 0.519 | ↓* | 1.642 | – | 0.890 | – |
| FGF‐2 | 0.656 | – | 0.541 | – | 0.455 | – |
| TGF‐β1 | 0.960 | – | 0.992 | – | 0.873 | – |
| EGF | – | – | – | – | – | – |
The fold change values were calculated by OD method with Image‐Pro Plus 6.0 based on the semi‐quantitative PCR. ↓ or ↑ indicates trend of fold change.
*A significant difference with respect to normoxic monoculture group, P < 0.05; **P < 0.01; ***P < 0.001.
Co‐culture, normoxic co‐culture group with respect to normoxic monoculture group; Hypoxia, hypoxic monoculture group with respect to normoxic monoculture group; Combined effect, hypoxic co‐culture group with respect to normoxic monoculture group.
Consistent with the inhibited effect on ALP expression under hypoxia, detectable levels of ALP expression also decreased in our co‐culture system; that is, gene expression in the co‐culture group under hypoxic factor was the lowest (down to 37.1%). Expression level of RUNX2, master transcription factor involved in osteoblastogenesis, was reduced in osteoblasts after co‐culture with chondrocytes compared to monoculture (down to 49.8%). Additionally, low oxygen tension had a similar but lower inhibitory effect in monocultured and co‐cultured osteoblasts. Co‐culture and hypoxia suppressed ALP gene expression in osteoblasts (Fig. 2b, Table 2b).
Hypoxia modulated sensitive transcription factor HIF‐1α and induced angiogenesis‐related growth factors after crosstalk between chondrocytes and osteoblasts
Numerous lines of evidence were established to strengthen the solid relationship between hypoxia and angiogenesis. Thus, we explored variation in angiogenesis‐related factors, including HIF‐1α, VEGF‐A/‐B, VE‐cadherin and PDGF. For chondrocytes, expression of HIF‐1α dramatically increased under low oxygen tension (up to 2.077‐fold). However, the effect of co‐culture was weaker than that of hypoxia. Co‐cultured chondrocytes exhibited lower levels of HIF‐1α expression compared to monocultured chondrocytes. In addition, expression of VEGF‐A/‐B and VE‐cadherin in chondrocytes was enhanced significantly in hypoxia after co‐culture with osteoblasts (VEGF‐A, as high as 4.457‐fold; VEGF‐B, 3.660‐fold; and VE‐cadherin, 2.664‐fold). Moreover, our co‐culture system also promoted expression of VEGF‐B in chondrocytes (up to 1.819‐fold, Fig. 3a, Table 2a).
Figure 3.
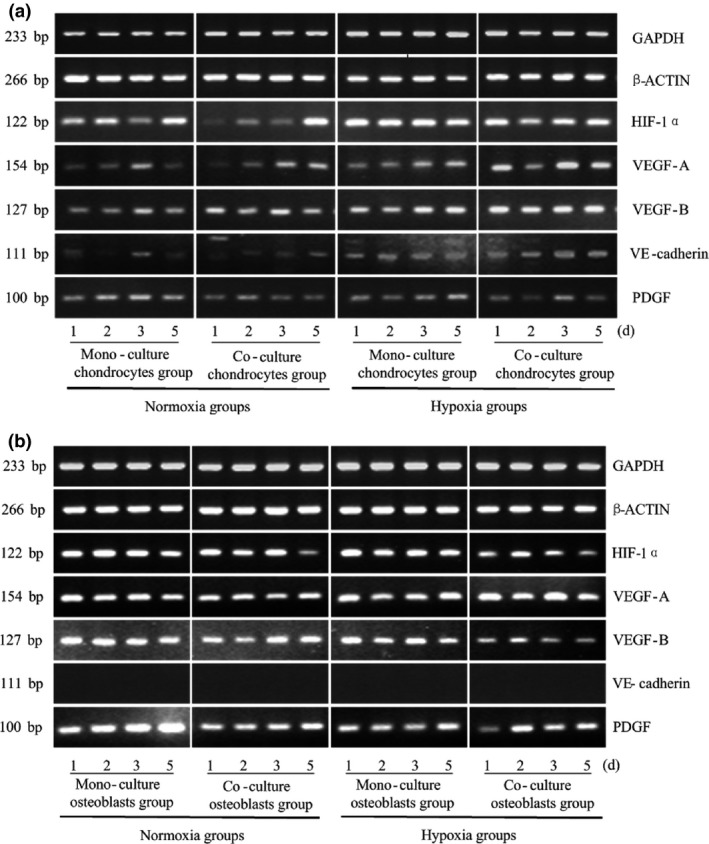
Hypoxia modulates expression of its sensitive transcription factor, HIF ‐1α, and induces expression of angiogenesis‐related growth factors after crosstalk between chondrocytes and osteoblasts. Expression of HIF‐1α, VEGF‐A/‐B, VE‐cadherin and PDGF genes in osteoblasts and chondrocytes measured at different oxygen tensions and from different culture methods. GAPDH and β‐ACTIN were used as reference genes. The product sizes are indicated in the left lane. The samples were taken at 1, 2, 3 and 5 days. The gels shown are representative of three different experiments (n = 3).
Subsequently, we observed that expression of HIF‐1α in osteoblasts was down‐regulated after co‐culture with chondrocytes (down to 67.4%); however, under hypoxic conditions, HIF‐1α expression decreased to 37.6%, a significant difference compared to that of the normoxic monoculture group. Hypoxia and co‐culture treatment both suppressed PDGF expression (down to 33.3% and 42.4% respectively). Analysis of VEGF‐A/‐B expression was inconclusive, and expression of VE‐cadherin was not observed in osteoblasts (Fig. 3b, Table 2b).
Hypoxia modulated BMP family expression after crosstalk between chondrocytes and osteoblasts
BMP, synthesized and secreted by osteoblasts, is a unique growth factor that induces bone formation. In this study, attention was focused on BMP family proteins. In chondrocytes, expression levels of BMP‐6 were detectable, but were not obvious. No significant difference was found in BMP‐5 expression between monoculture or co‐culture groups at two different concentrations of oxygen. For BMP‐4, hypoxia inhibited its expression, particularly when cultured with osteoblasts, and BMP‐2 was expressed more highly in low oxygen tension after co‐culture with osteoblasts (up to 1.774‐fold, Fig. 4a, Table 2a).
Figure 4.
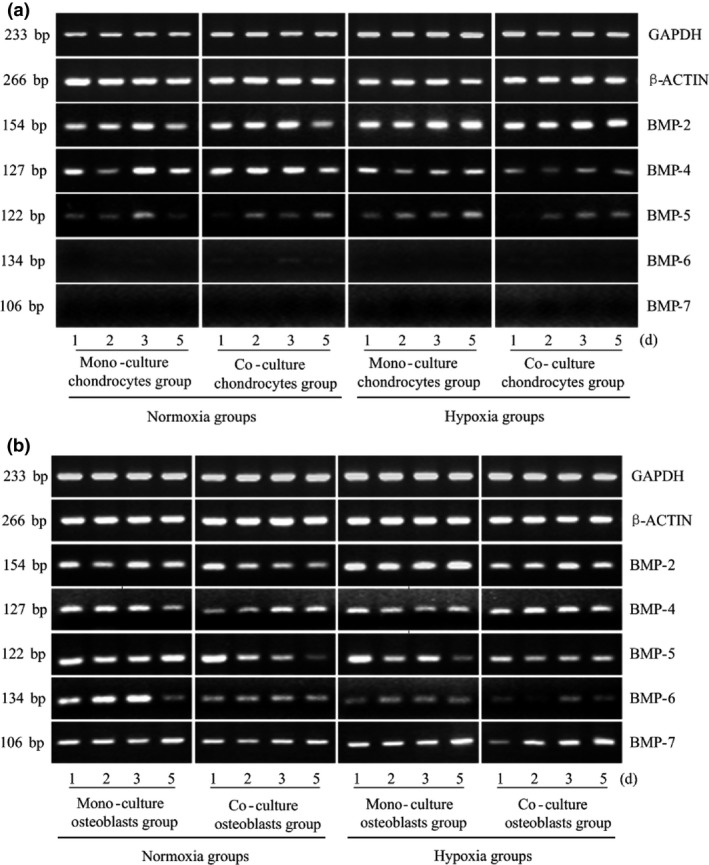
Hypoxia modulates expression of BMP family proteins after crosstalk between chondrocytes and osteoblasts. Gene expressions of BMPs in osteoblasts and chondrocytes measured at different oxygen tensions and from different culture methods. GAPDH and β‐ACTIN were used as reference genes. The product sizes are indicated in the left lane. The samples were taken at 1, 2, 3 and 5 days. The gels shown are representative of three different experiments (n = 3).
However, expression of all BMP family members was detected in osteoblasts. Expression of BMP‐2, with the strongest osteoinductive effect, was increased in both monoculture and co‐culture groups under hypoxic conditions compared to normoxic conditions (up to 1.786‐fold). In contrast, BMP‐2 expression was suppressed when co‐cultured with chondrocytes (down to 77.6%), and combined effects of the two factors were neutralized. No significant difference in BMP‐5 expression was observed under hypoxia or co‐culture, but the coefficient indicated 40% reduction in the hypoxic co‐culture group compared to the control group. In contrast, expression of BMP‐6 was down‐regulated by both hypoxia and co‐culture conditions. Furthermore, in all four compared groups, BMP‐6 expression decreased in a time‐dependent manner. Finally, it was surprising that BMP‐7 was only expressed in osteoblasts, with no obvious differences observed (Fig. 4b, Table 2b).
Other general growth factor changes in hypoxia after crosstalk between chondrocytes and osteoblasts
Changes in expression levels of other growth factors, including IGF‐1, FGF‐1, FGF‐2, TGF‐β1 and EGF, were investigated. In both chondrocytes and osteoblasts, expression of EGF was not detected, and no obvious differences were found in FGF‐2 and TGF‐β1 expression. IGF‐1 expression in chondrocytes was markedly increased under low oxygen tension compared to normal levels (up to 3.602‐fold), and IGF‐1 expression increased to as high as 2.291‐fold in hypoxic co‐cultured cells (Fig. 5a). Co‐culturing reduced expression of FGF‐1 in osteoblasts (Fig. 5b, Table 2).
Figure 5.
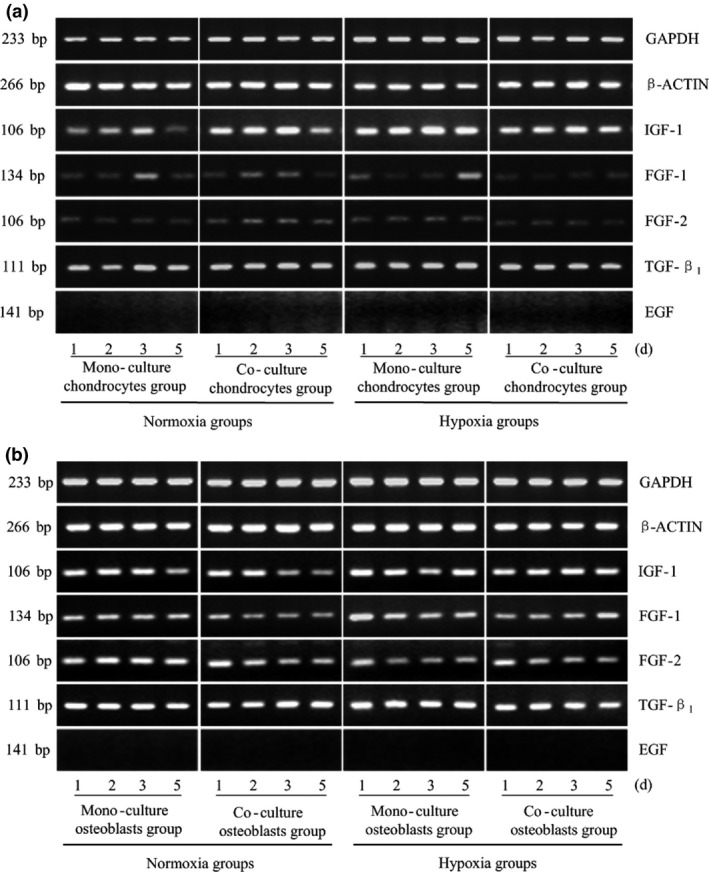
Other general growth factor changes in hypoxia after crosstalk between chondrocytes and osteoblasts. IGF‐1, FGF‐1/‐2, TGF‐β1 and EGF gene expression in osteoblasts and chondrocytes measured at different oxygen tensions and from different culture methods. GAPDH and β‐ACTIN were used as reference genes. The product sizes are indicated in the left lane. The samples were taken at 1, 2, 3 and 5 days. The gels shown are representative of three different experiments (n = 3).
Discussion
Current research on the physiological development of endochondral ossification or pathological progression of osteoarthritis has not included studies that focus on chondrocytes of articular cartilage, due to complicated structures of cartilage, subchondral bone and synovial fluid. Hypoxic culture conditions and co‐culture systems have both been reported in previous studies, to have inductive effects on chondrogenic differentiation, whereas the combined effect of the two approaches has not been reported. Thus, by testing a large gene expression profile of soluble growth factors related to hypoxia and cell differentiation in different cell culture conditions and oxygen tensions, we are able to report novel insights into crosstalk between osteoblasts and chondrocytes, especially the influence on chondrogenesis and angiogenesis.
Our results demonstrated that osteoblasts and chondrocytes influence the other compartments in the co‐culture system. On the 4th day of co‐culture, we observed that cell sizes of chondrocytes were significantly larger than monoculture cells, which may indicate potential effects of co‐cultured osteoblasts on morphological changes to chondrocytes. However, it still needs more potent evidence in future research, to prove this.
We found that significant reductions in specific gene expressions were observed between co‐culture groups and monoculture groups for ALP and RUNX2 in osteoblasts. A previous in vitro study has demonstrated decreased differentiation level of osteoblasts in co‐cultures by measuring ALP activity, which coincides with our results 1, and the possible mechanism may be that in development of growth plates, osteoblasts devote themselves to maintain the phenotype of chondrocytes 15. For chondrocytes, Aggrecan showed lower expression in co‐culture groups, however, which is inconsistent with previous studies. Bovine articular chondrocytes co‐cultured with rat calvarial osteoblasts have exhibited higher levels of proliferation and up‐regulated gene expression of Aggrecan, and type II and type X collagens in vitro, resulting in enhanced differentiation levels compared to that of monoculture groups; furthermore, increased level of this effect depended on whether osteogenic supplements were added to the medium 1. Beyond that, one ex vivo study investigated the influence of subchondral bone in situ on chondrocyte survival. Death of chondrocytes with subchondral bone excised from articular cartilage of bovine explants increased over seven days, especially within the superficial zone. However, in contrast, neither the subchondral bone left attached to articular cartilage group, nor that excised but co‐cultured with the articular cartilage group, exhibited this increase in chondrocyte death, which may be due to release of soluble factors from subchondral bone 4. The inconsistency may be explained in that after massive proliferation, the fate of chondrocytes in development of endochondral ossification is: perhaps from normal chondrocytes into hypertrophic cells, then to apoptosis; or, is that numbers of the chondrocytes differentiate into osteoblasts. In consequence, the possibility, and even necessity, of reciprocal interactions and interdependence between chondrocytes and osteoblasts may be presented, and a potentially biochemical mechanism may explain the interdependence of the two compartments. Lately, existence of dense subchondral vasculature, desired for perfusion of more than 50% glucose, oxygen and other requirements of cartilage, as well as microchannels that serve as a message delivery network between uncalcified cartilage and subchondral bone, have been regarded as the foundations for crosstalk between osteoblasts and chondrocytes 16, 17. An osteoarthritis model also provided evidence that osteoblasts and chondrocytes derived from different tissues, mutually interact with one another in the altered mechanical and biochemical micro‐environment of a progressive joint 18, 19.
In our study, a further potential approach for chondrocyte differentiation was displayed. Hypoxia, lack of availability of oxygen, plays a vital and irreplaceable role, not only in pathological conditions such as tumour progression, but also in physiological development, such as endochondral ossification and survival of joint cartilage 15, 20, 21. In growth plates, hypoxic areas have been identified in the centre of both round and columnar proliferative layers, as well as in upper parts of hypertrophic zones 8, 22. This means that natural chondrocytes grow in a microenvironment with insufficient oxygen. Furthermore, hypoxia has been identified to be a promising approach for adiposed‐derived stem cell or mesenchymal stem cell proliferation and differentiation into chondrocytes 23, 24, 25. To mimic physiological conditions, we established a low oxygen tension environment of 2%. We found that Aggrecan and type II collagen (although no significant difference was observed, the grey lines in PCR also showed a tendency), an early and indispensable marker of chondrocyte differentiation, exhibited a strikingly lower level of expression in hypoxic environments in both co‐culture and monoculture groups, in contrast to the results of clearly increasing up‐regulatory performance dependent on HIF‐activity in hypoxia 10, 11, 12. To the best of our knowledge, the interpretation is that chondrocytes in such an environment may present dedifferentiation to a hypertrophic phenotype, considered over the past decades to be the end stage of chondrocyte differentiation. However, recent findings demonstrate that in the development of growth plates, the fate of chondrocytes divides into two: one is from terminal differentiation to cell death, and the other is to survive as osteoblasts and osteocytes at the chondro‐osseous interface 26. For this hypothesis, and because of increasing evidence that HIF‐1α promotes chondrocyte hypertrophic differentiation 27, further research into expression of type X collagen and its regulative mechanism is necessary.
A conclusive viewpoint has been established that hypoxia triggers a complicated but well‐organized response in cell metabolism involving striking increase in expression of adaptive angiogenesis‐related factors. Under physiological conditions, VEGF is manipulated in two completely different ways during development of the growth plate. In the area of hypertrophic chondrocytes adjacent to bone, high expression of VEGF is independent of HIF‐1α instead of being regulated by RUNX2, whereas in the centre of hypoxic areas, VEGF expression is controlled by HIF‐1α at lower levels 21. In this study, gene expressions of VEGF‐A and VEGF‐B in chondrocytes were strikingly increased under hypoxic culture conditions along with increasing of HIF‐1α. However, in the hypoxic environment, increased level of VEGF in the co‐culture group compared to the monoculture group showed an inconsistent tendency with HIF‐1α. Previous study focusing on regulation of VEGF indicated detectable expression of VEGF still could be observed in the conditional knockout model of HIF‐1α in hypertrophic chondrocytes, which demonstrated that VEGF expression might be regulated by Runx2 instead of HIF‐1α independent in this domain 28. Along with VEGF‐A, expression of a further angiogenesis‐related factor, VE‐cadherin, was enhanced, and vasculogenic mimicry was modulated by HIF‐1α in oesophageal carcinoma cells 29. Due to this close relationship between blood vessel formation and hypoxia, expression of PDGF and VE‐cadherin was also investigated in our work. It was surprising that expression of VE‐cadherin in chondrocytes was strikingly higher under hypoxia. The conclusion may be drawn that hypoxia regulates gene expression of angiogenesis‐related growth factors.
In addition, as the replacement of apoptotic hypertrophic chondrocytes by osteoblasts, blood vessels invade cartilage to facilitate oxygen supply for primary ossification in the growth plate, highlighting the importance between osteoblast survival and sufficient oxygen supply 2. Lower oxygen tension may induce osteoblast apoptosis, as well as their osteogenic potential indicated by down‐regulating ALP, RUNX2 and osteocalcin 30, 31. Furthermore, lower vascular supply related to direct effects of hypoxia may not only block osteoblast function and restrict osteoanabolic activity 32, but also induce osteoclastogenesis and bone resorption 33. In mutual skeletons, a more rapid accumulation of bone was observed with a lack of HIF‐1 in osteoblasts 34. In our work, lower levels of ALP and BMP‐2/‐6 expression in hypoxic co‐cultures were observed. Nevertheless, the process of bone formation is modulated by hypoxia as well, and the detected expression of HIF proteins in osteoblasts provides evidence that the volume and vascular architecture of bone may be manipulated by the HIF pathway 35, 36, 37.
Apart from effects of either co‐culture or hypoxia on differentiation of osteoblasts and chondrocytes, the combined effect may possibly be addressed from the results of significantly changed genes. Shown by the reduced level of ALP of osteoblasts and Aggrecan as well as type II collagen of chondrocytes, we may hypothesis that in the co‐culture system, hypoxia had potentially induced chondrocytes into a dedifferentiation phenotype along with the existing osteoblasts (Fig. 6).
Figure 6.
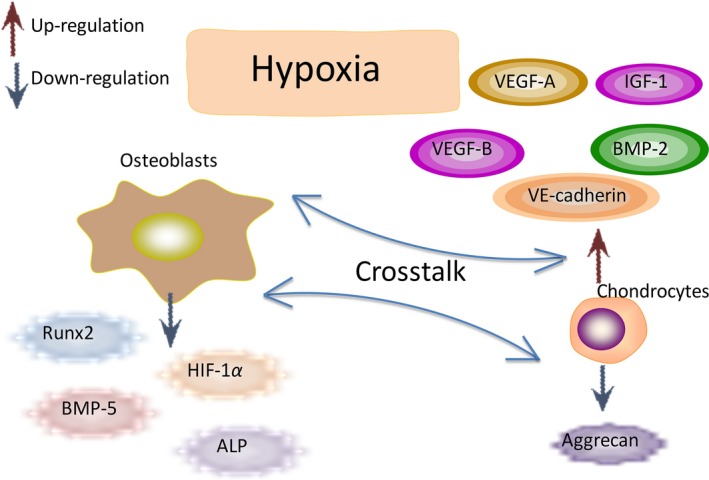
Schematic drawing of molecules secreted by chondrocytes and osteoblasts in hypoxia Physiological Oxygen Tension Modulates the Soluble Growth Factor Profile after Crosstalk between Chondrocytes and Osteoblasts.
There are some limitations in this study. First, recent investigations have contributed much more understanding of the mechanism of physiological bone formation and pathological bone disease such as osteoporosis as well as cartilage disorders such as osteoarthritis 38. Thus, we screened the gene expression profile of growth factors based on the common gene bank. However, the exact mechanisms have not been elucidated and to explore it, a gene micro‐array may be necessary. Secondly, as it was the preliminary stage of our work, semi‐quantitative PCR was performed to detect the approximate differences. Real‐time PCR will be required in future studies.
In conclusion, in this work, we investigated effects of physiological hypoxic culture conditions on cell morphology and differentiation of monocultured osteoblasts and chondrocytes, as well as their co‐cultures. The importance of crosstalk between chondrocytes and osteoblasts was demonstrated by gene expression changes of soluble growth factors, resulting in strikingly reduced chondrogenic differentiation and increased angiogenesis in chondrocytes modulated by lower oxygen tension. In addition, co‐culturing these two cells inhibited the phenotype of osteoblasts in low oxygen tension. These results will facilitate increased understanding of the mechanisms underlying the homoeostatic maintenance of endochondral bone.
Supporting information
Table S1. Optical density (OD) values of relevant genes in normoxic chondrocytes.
Table S2. Optical density (OD) values of relevant genes in hypoxic chondrocytes.
Table S3. Fold change and P values of relevant groups in chondrocytes.
Table S4. Optical density (OD) values of relevant genes in normoxic osteoblasts.
Table S5. Optical density (OD) values of relevant genes in hypoxic osteoblasts.
Table S6. Fold change and P values of relevant groups in osteoblasts.
Acknowledgements
This work was funded by the National Natural Science Foundation of China (81470721, 81321002 and 31170929), and the Sichuan Science and Technology Innovation Team (2014TD0001).
References
- 1. Nakaoka R, Hsiong SX, Mooney DJ (2006) Regulation of chondrocyte differentiation level via co‐culture with osteoblasts. Tissue Eng. 12, 2425–2433. [DOI] [PubMed] [Google Scholar]
- 2. Araldi E, Schipani E (2010) Hypoxia, HIFs and bone development. Bone 47, 190–196. [DOI] [PMC free article] [PubMed] [Google Scholar]
- 3. Mackie EJ, Ahmed YA, Tatarczuch L, Chen KS, Mirams M (2008) Endochondral ossification: How cartilage is converted into bone in the developing skeleton. Int. J. Biochem. Cell Biol. 40, 46–62. [DOI] [PubMed] [Google Scholar]
- 4. Amin AK, Huntley JS, Simpson AH et al (2009) Chondrocyte survival in articular cartilage: the influence of subchondral bone in a bovine model. J. Bone Joint Surg. Br. 91, 691–699. [DOI] [PubMed] [Google Scholar]
- 5. Coimbra IB, Jimenez SA, Hawkins DF et al (2004) Hypoxia inducible factor‐1 alpha expression in human normal and osteoarthritic chondrocytes. Osteoarthritis Cartilage 12, 336–345. [DOI] [PubMed] [Google Scholar]
- 6. Fermor B, Christensen SE, Youn I et al (2007) Oxygen, nitric oxide and articular cartilage. Eur. Cell. Mater. 11, 56–65. [DOI] [PubMed] [Google Scholar]
- 7. Semenza GL (2000) HIF‐1: mediator of physiological and pathophysiological responses to hypoxia. J. Appl. Physiol. 88, 1474–1480. [DOI] [PubMed] [Google Scholar]
- 8. Schipani E, Ryan HE, Didrickson S et al (2001) Hypoxia in cartilage: HIF‐1alpha is essential for chondrocyte growth arrest and survival. Genes Dev. 15, 2865–2876. [DOI] [PMC free article] [PubMed] [Google Scholar]
- 9. Bunn HF, Poyton RO (1996) Oxygen sensing and molecular adaptation to hypoxia. Physiol. Rev. 76, 839–885. [DOI] [PubMed] [Google Scholar]
- 10. Pfander D, Cramer T, Schipani E et al (2003) HIF‐1alpha controls extracellular matrix synthesis by epiphyseal chondrocytes. J. Cell Sci. 116, 1819–1826. [DOI] [PubMed] [Google Scholar]
- 11. Zhang C, Yang F, Cornelia R et al (2011) Hypoxia‐inducible factor‐1 is a positive regulator of SOX9 activity in femoral head osteonecrosis. Bone 48, 507–513. [DOI] [PubMed] [Google Scholar]
- 12. Duval E, Leclercq S, Elissalde JM et al (2009) Hypoxia‐inducible factor 1alpha inhibits the fibroblast‐like markers type I and type III collagen during hypoxia‐induced chondrocyte redifferentiation. Arthritis Rheum. 60, 3038–3048. [DOI] [PubMed] [Google Scholar]
- 13. Chan DA, Sutphin PD, Denko NC et al (2002) Role of prolyl hydroxylation in oncogenically stabilized hypoxia‐inducible factor‐1alpha. J. Biol. Chem. 277, 40112–40117. [DOI] [PubMed] [Google Scholar]
- 14. Steinbrech DS, Mehrara BJ, Saadeh PB et al (1999) Hypoxia regulates VEGF expression and cellular proliferation by osteoblasts in vitro . Plast. Reconstr. Surg. 104, 738–747. [DOI] [PubMed] [Google Scholar]
- 15. Jiang J, Nicoll SB, Lu HH (2005) Co‐culture of osteoblasts and chondrocytes modulates cellular differentiation in vitro. Biochem. Biophys. Res. Commun. 338, 762–770. [DOI] [PubMed] [Google Scholar]
- 16. Giaccia AJ, Simon MC, Johnson R (2004) The biology of hypoxia: the role of oxygen sensing in development, normal function, and disease. Genes Dev. 18, 2183–2194. [DOI] [PMC free article] [PubMed] [Google Scholar]
- 17. Imhof H, Sulzbacher I, Grampp S et al (2000) Subchondral bone and cartilage disease: a rediscovered functional unit. Invest. Radiol. 35, 581–588. [DOI] [PubMed] [Google Scholar]
- 18. Findlay DM, Atkins GJ (2014) Osteoblast‐chondrocyte interactions in osteoarthritis. Curr. Osteoporos. Rep. 12, 127–134. [DOI] [PMC free article] [PubMed] [Google Scholar]
- 19. Yuan XL, Meng HY, Wang YC et al (2014) Bone‐cartilage interface crosstalk in osteoarthritis: potential pathways and future therapeutic strategies. Osteoarthritis Cartilage 22, 1077–1089. [DOI] [PubMed] [Google Scholar]
- 20. Chen EY, Fujinaga M, Giaccia AJ (1999) Hypoxic micro‐environment within an embryo induces apoptosis and is essential for proper morphological development. Teratology 60, 215–225. [DOI] [PubMed] [Google Scholar]
- 21. Schipani E (2005) Hypoxia and HIF‐1 alpha in chondrogenesis. Semin. Cell Dev. Biol. 16, 539–546. [DOI] [PubMed] [Google Scholar]
- 22. Lee J, Siemann DW, Koch CJ et al (1996) Direct relationship between radiobiological hypoxia in tumors and monoclonal antibody detection of EF5 cellular adducts. Int. J. Cancer 67, 372–378. [DOI] [PubMed] [Google Scholar]
- 23. Gomez‐Camarillo MA, Almonte‐Becerril M, Vasquez Tort M et al (2009) Chondrocyte proliferation in a new culture system. Cell Prolif. 42, 207–218. [DOI] [PMC free article] [PubMed] [Google Scholar]
- 24. Krinner A, Zscharnack M, Bader A et al (2009) Impact of oxygen environment on mesenchymal stem cell expansion and chondrogenesis differentiation. Cell Prolif. 42, 271–484. [DOI] [PMC free article] [PubMed] [Google Scholar]
- 25. Choi JR, Pingguan‐Murphy B, Wan Abas WA et al (2014) Impact of low oxygen tension on stemness, proliferation and differentiation potential of human adipose‐derived stem cells. Biochem. Biophys. Commun. 8, 218–224. [DOI] [PubMed] [Google Scholar]
- 26. Tsang KY, Chan D, Cheah KS (2015) Fate of growth plate hypertrophic chondrocytes: death or lineage extension? Dev. Growth Differ. 57, 179–92. [DOI] [PubMed] [Google Scholar]
- 27. Liu L, Simon MC (2004) Regulation of transcription and translation by hypoxia. Cancer Biol. Ther. 3, 492–497. [DOI] [PubMed] [Google Scholar]
- 28. Zelzer E, Glotzer D, Hartmann C et al (2001) Tissue specific regulation of VEGF expression during bone development requires Cbfa1/Runx2. Mech. Dev. 106, 97–106. [DOI] [PubMed] [Google Scholar]
- 29. Grottkau BE, Lin Y (2013) Osteogenesis of adipose‐derived stem cells. Bone Res. 1, 133–145. [DOI] [PMC free article] [PubMed] [Google Scholar]
- 30. Ma HP, Ma XN, Ge BF et al (2014) Icariin attenuates hypoxia‐induced oxidative stress and apoptosis in osteoblasts and preserves their osteogenic differentiation potential in vitro. Cell Prolif. 47, 527–539. [DOI] [PMC free article] [PubMed] [Google Scholar]
- 31. Valorani MG, Montelatici E, Germani A et al (2012) Pre‐culturing human adipose tissue mesenchymal stem cells under hypoxia increases their adipogenic and osteogenic differentiation potentials. Cell Prolif. 45, 225–238. [DOI] [PMC free article] [PubMed] [Google Scholar]
- 32. Frey JL, Stonko DP, Faugere MC et al (2014) Hypoxia‐inducible factor‐1α restricts the anabolic actions of parathyroid hormone. Bone Res. 2, 14005. [DOI] [PMC free article] [PubMed] [Google Scholar]
- 33. Marenzana M, Arnett TR (2013) The key role of the blood supply to bone. Bone Res. 1, 203–215. [DOI] [PMC free article] [PubMed] [Google Scholar]
- 34. Riddle RC, Leslie JM, Gross TS et al (2011) Hypoxia‐inducible factor‐ 1α protein negatively regulates load‐induced bone formation. J. Biol. Chem. 286, 44449–44456. [DOI] [PMC free article] [PubMed] [Google Scholar]
- 35. Wang Y, Wan C, Deng L et al (2007) The hypoxia‐inducible factor alpha pathway couples angiogenesis to osteogenesis during skeletal development. J. Clin. Invest. 117, 1616–1626. [DOI] [PMC free article] [PubMed] [Google Scholar]
- 36. Shomento SH, Wan C, Cao X et al (2009) Hypoxia‐inducible factors 1alpha and 2alpha exert both distinct and overlapping functions in long bone development. J. Cell. Biochem. 109, 196–204. [DOI] [PubMed] [Google Scholar]
- 37. Zou D, Han W, You S et al (2011) In vitro study of enhanced osteogenesis induced by HIF‐1 alpha‐transduced bone marrow stem cells. Cell Prolif. 44, 234–243. [DOI] [PMC free article] [PubMed] [Google Scholar]
- 38. Shen J, Li S, Chen D (2014) TGF‐ß signaling and the development of osteoarthritis. Bone Res. 2 pii: 14002. [DOI] [PMC free article] [PubMed] [Google Scholar]
Associated Data
This section collects any data citations, data availability statements, or supplementary materials included in this article.
Supplementary Materials
Table S1. Optical density (OD) values of relevant genes in normoxic chondrocytes.
Table S2. Optical density (OD) values of relevant genes in hypoxic chondrocytes.
Table S3. Fold change and P values of relevant groups in chondrocytes.
Table S4. Optical density (OD) values of relevant genes in normoxic osteoblasts.
Table S5. Optical density (OD) values of relevant genes in hypoxic osteoblasts.
Table S6. Fold change and P values of relevant groups in osteoblasts.