

Abstract
Abstract. Objectives: To evaluate the effects of rRNA synthesis inhibition on cell cycle progression and cell population growth according to the RB and p53 status. Material and methods: RB‐ and p53‐proficient U2OS cells and the RB‐ and p53‐deficient SAOS‐2 cells were used, rRNA transcription hindered by actinomycin D, and cell cycle analysed by flow cytometry. Results: One hour of actinomycin D treatment induced in U2OS cells a block at the cell cycle checkpoints G1‐S and G2‐M, which was removed only after rRNA synthesis was resumed. rRNA synthesis inhibition did not influence cell cycle progression in SAOS‐2 cells. No effect on cell cycle progression after actinomycin D‐induced rRNA inhibition was also found in U2OS cells silenced for RB and p53 expression. A mild perturbation of cell cycle progression was observed in U2OS cells silenced for the expression of either RB or p53 alone. We also treated U2OS and SAOS‐2 cells with actinomycin D for 1 h/day for 5 days. This treatment lightly reduced growth rate of the U2OS cell population, whereas cell population growth of SAOS‐2 cells was completely inhibited. A marked reduction of ribosome content occurred in SAOS‐2 cells after the long‐term actinomycin D treatment, whereas no modification was observed in U2OS cells. Conclusions: These results demonstrate that inhibition of ribosome biogenesis does not hinder cell cycle progression in RB‐ and p53‐deficient cells. A daily‐repeated transitory inhibition of ribosome biogenesis leads to a progressive reduction of ribosome content with the consequent extinction of cancer cell population lacking RB and p53.
INTRODUCTION
There is increasing evidence that cell growth and cell proliferation are two tightly linked phenomena. In cells stimulated to proliferate a progressive increase in cell constituents occurs that ensures normal‐sized daughter cells (Thomas 2000). Such high level of protein synthesis allows cells to grow in size even during the cell cycle phases, and increased demand for protein synthesis is accomplished by changes in the rate of ribosome biogenesis (Peculis 2002); ribosome biogenesis is a major metabolic demand in a proliferating cell (Schmidt 1999). Ribosome biogenesis rate appears to be regulated by cell proliferation‐controlling processes (Hernandez‐Verdun & Roussel 2003). Reduced mitotic cyclin/Cdk complex activity determines the resumption of ribosomal gene transcription at the exit of mitosis (Sirri et al. 2000), while phosphorylation of the RNA‐polymerase I upstream binding factor (UBF) by G1‐specific cyclin/Cdk complexes stimulate rRNA synthesis during G1 phase progression (Voit et al. 1999). Moreover, nucleolar organization is disrupted and pre‐rRNA processing is hindered by inhibitors of cyclin‐dependent kinases (Sirri et al. 2002). Both the retinoblastoma (pRB) and p53 tumour‐suppressor proteins repress transcription of ribosomal genes by affecting activity of UBF (Voit et al. 1997; Budde & Grummt 1999; Zhai & Comai 2000), while human cancer cells characterized by altered pRB or p53 status exhibit greater nucleolar activity than those with normal pRB and p53 status (Treréet al. 2004). Data also indicate that ribosome biogenesis is tightly coupled and controls cell cycle progression. In partial hepatectomized mice with induced conditional deletion of 40S ribosomal protein S6, hepatocytes with hindered rRNA, but not hindered protein synthesis, failed to enter the S phase (Volarevic et al. 2000). Perturbation of normal rRNA processing and ribosome assembly leads to cell cycle arrest, in a p53‐dependent manner (Pestov et al. 2001). Stimulation and inhibition of rRNA synthesis by insulin and by actinomycin D (ActD) treatment induced a shortening or a lengthening of G1 phase, respectively, in rat hepatoma cells. Accelerated or delayed G1/S‐phase progression has been shown to be the consequence of accelerated or delayed achievement of the appropriate amount of rRNA during the G1 phase (Derenzini et al. 2005). Thus, continuous crosstalk is indicated between ribosome biogenesis and the mechanisms controlling cell cycle progression. From a teleological point of view, this reciprocal control is of great importance for continuously dividing cells as defective ribosome biogenesis might be responsible for generation of ever smaller cells until proliferation would be no longer possible. During cell cycle progression, central mechanisms are active that ensure the proper timing of cell cycle events by enforcing the dependence of late events on the completion of early events (Hartwell & Weinert 1989). These checkpoints exert their function at the G1‐S and G2‐M phase transitions by arresting cells which, for any reason, should not enter the following phase. Inappropriate ribosome biogenesis appears to be one of these reasons (Volarevic et al. 2000; Pestov et al. 2001; Derenzini et al. 2005). The two major tumour‐suppressor proteins, pRB and p53, play a key role in the mechanisms controlling the G1‐S and G2‐M phase checkpoints (Stewart et al. 1995; Weinberg 1995). pRB and p53 tumour‐suppressor pathways are altered in a large fraction of many types of cancers (Sherr 2000; Vogelstein & Kinzler 2004). In these cancers, functional relationship between ribosome biogenesis and cell cycle progression might also be expected to be deregulated, and an artificially induced reduction of ribosome biogenesis rate might no longer cause cell cycle arrest creating the possibility for cancer cells to be able to divide without reaching appropriate size.
Thus, in the present study, we have evaluated the effects of inhibition of rRNA synthesis by low‐dose ActD on cell cycle progression and cell population growth in two osteosarcoma cell lines, the pRB‐ and p53‐proficient U2OS cells and the pRB‐ and p53‐deficient SAOS‐2 cells. With reference to cell cycle progression, we anticipated that in pRB‐ and p53‐proficient U2OS cells, a transient reduction of ribosome biogenesis should induce a block at the G1‐S and G2‐M cell cycle checkpoints, which would be removed when rRNA synthesis was resumed. Whereas, in the pRB‐ and p53‐deficient SAOS‐2 cells, which have no mechanisms to monitor ribosome biogenesis, reduced synthesis of rRNA should not influence cell cycle progression. These different effects on cell cycle progression should have a different impact on cell population growth in the two cell populations. In U2OS cells, the functional checkpoints may allow the cells to have, at the end of the cycle, a normal ribosome complement for production of normal daughter cells, whereas in SAOS‐2 cells ribosome content may be reduced with consequent generation of daughter cells having reduced ribosome complement. Accordingly, long‐term, daily repeated treatment with low‐dose ActD should not greatly modify cell population growth of pRB‐ and p53‐proficient U2OS, whereas cell population growth would be expected to be hindered in the pRB‐ and p53‐deficient SAOS‐2 cells, because the progressive reduction of cell ribosome content should no longer allow cell survival.
MATERIALS AND METHODS
Cell lines and culture conditions
Two human osteosarcoma cell lines were used: U2OS cells normally express pRB and p53 and SAOS‐2 that lack both tumour‐suppressor proteins (Chandar et al. 1992). Monolayer cell cultures were kept at 37 °C in an atmosphere containing 5% CO2 in Dulbecco's modified eagle medium (DMEM; EuroClone, Pero, Italy) supplemented with 20% foetal calf serum (FCS; EuroClone) and in DMEM 10% FCS, respectively. Doubling time of the U2OS cells was 26 h and that of SAOS‐2 cells of 34 h.
Evaluation of rRNA synthesis
The effect of ActD on rRNA synthesis was evaluated in asynchronously growing U2OS and SAOS‐2 cells. rRNA synthesis was assessed according to Derenzini et al. (1987, 2005) by measuring radioactivity incorporated in the RNA fractions extracted at 4 °C (mature rRNA), at 50 °C (precursor rRNA) and at 85 °C (heterogeneous RNA), after [3H]‐uridine (Amersham Biosciences, Piscataway, NJ, USA) treatment. Cells were treated with ActD to a final concentration of 0.04 µg/mL for 1 h. [3H]‐uridine (2.5 µCi/mL) was added for 30 min immediately after ActD treatment and after 7 and 13 h. Results were expressed in d.p.m./µg RNA. Control and ActD‐treated cells were evaluated in triplicate. Differences between groups were tested by Student's t‐test. A P‐value of < 0.05 was considered to be significant.
Cell cycle analysis by DNA flow cytometry
Asynchronously growing U2OS and SAOS‐2 cells were treated with ActD at a final concentration of 0.04 µg/mL for 1 h. Treated and untreated cells were harvested after 3, 7, 10, 13 and 23 h.
U2OS and SAOS‐2 cells were washed with phosphate‐buffered saline (PBS), treated with trypsin‐ethylenediaminetetraacetic acid, were washed off the flask with culture medium and were centrifuged at 250 g for 5 min at room temperature. Cells were washed twice in PBS and were centrifuged at 250 g for 5 min at room temperature and fixed in 70% cold ethanol.
Fixed cells were stored in ethanol at +4 °C until a series of sample tubes had been collected for flow cytometric analysis. Tubes were centrifuged at 250 ×g for 15 min at room temperature, ethanol was removed and the pellets were resuspended in the residual liquid. Aliquots of approximately 1 million cells were washed twice in PBS and then stained with 2 mL of 4′,6‐diamidino‐2‐phenylindole (DAPI) (Sigma 32670; St. Louis, MO, USA) 2 µg/mL in PBS (Otto et al. 1981). Samples were stored in the dark at +4 °C for at least 2 h before analysis. Flow measurements were performed by means of a Partec PAS II (Münster, Germany) flow cytometer equipped with a dual excitation system (argon ion laser and HBO 100 W arc lamp). The ultraviolet 366 nm band of the mercury lamp was used to excite the DAPI bound DNA complex. A preliminary instrument alignment and control was setup (with rat thymocytes stained with DAPI) in order to assure best instrumental analytical performances. Immediately before measurement, each sample was filtered by ‘Filcons’ 100 (ConsulTS, Turin, Italy) to remove cell clusters. For a sample measurement, a minimum of 20 000 events was acquired. The emission blue band between 430 and 490 nm (FL4) was collected, converted and stored as DNA distribution values (histogram) by means of a dedicated computer integrated into the instrument. Data were elaborated and plotted with ‘Flow Max’ software (Partec GmBH, Münster, Germany) installed in the personal computer. Cell cycle analysis and estimation of the three aliquots G0/G1, S and G2 + M were performed by means of the same software.
Evaluation of cell cycle‐related protein expression by immunocytochemical and Western blot analysis
Cell cycle‐related proteins p53, p21, hyper‐phosphorylated pRB, cyclin A and cyclin E were considered. Immunocytochemical analysis was carried out to reveal p53, p21 and the hyper‐phosphorylated form of pRB. Moreover, p53, p21, phospho‐pRB, together with cyclin A and cyclin E were also evaluated by Western blot analysis. For immunocytochemical staining, U2OS cells were asynchronously grown on 22 × 32 mm glass coverslips and were treated with 0.04 µg/mL ActD for 1 h. Untreated control and treated cells were washed in PBS, fixed at 1, 3 and 7 h at the end of the treatment and were permeabilized for 4 min with 2% paraformaldehyde added with 1% Triton X‐100 diluted in PBS. Cells were treated with 1.5% H2O2 for 5 min in the dark in order to suppress endogenous peroxidase activity. Control and ActD treated cells were incubated with anti‐p53 protein monoclonal antibody (clone BP53‐12, Novocastra Laboratories, DBA Italia, Segrate, Milan, Italy, diluted 1 : 150 in PBS containing 1% bovine serum albumin [BSA]) or anti‐p21 protein monoclonal antibody (Clone EA10, Calbiochem, Inalco S.p.A., Milan, Italy, diluted 1 : 450 in PBS containing 1% BSA) or anti‐Phospho‐RB (Ser807/811) antibody from rabbit (Cell Signalling Technology, Celbio S.p.A., Pero, Milan, Italy, diluted 1 : 100 in PBS containing 1% BSA) overnight at 4 °C in a humidified chamber. After incubation cells were washed in PBS and were incubated at first with a biotinylated secondary antimouse antibody (diluted 1 : 500 in PBS containing 1% BSA) for 30 min, and then with the streptavidin‐peroxidase conjugate (diluted 1 : 250 in PBS containing 1% BSA) for 25 min. The streptavidin‐peroxidase complex was visualized using diaminobenzydine. Cells were finally dehydrated and were mounted in a synthetic medium on microscope slides. For the evaluation of the expression of cell cycle‐related proteins by Western blot analysis, non confluent U2OS cells were harvested 3, 7, 9, 13 and 23 h after ActD treatment, along with an untreated control, and total protein was extracted in KH2PO4 0.1 m pH 7.5, Igepal 1% added with complete protease inhibitors cocktail (Roche Diagnostics, Milan, Italy) and 0.1 mmβ‐glycerolphosphate. After 30 min non‐soluble fractions were eliminated by centrifugation at 13 000 g for 15 min at room temperature and supernatants were kept for analysis. All steps were performed at 4 °C. Twenty micrograms of protein in Laemmli buffer were loaded in each lane. Protein samples were electrophoresed in 10% sodium dodecyl sulphate‐polyacrylamide gels and electrotransferred to cellulose nitrate membranes (Hybond C Extra, Amersham, Buckinghamshire, UK). Filters were then saturated with 3.5% non‐fat dry milk, 1.5% BSA in Tris‐buffered saline (TBS) (20 mm Tris‐HCl, 137 mm NaCl, pH 7.6) – 0.1% Tween 20 (Sigma) (TBS‐T) for 1 h at room temperature. Nitrocellulose membranes were then rinsed in TBS‐T and were incubated overnight at 4 °C with primary antibodies in 3.5% BSA TBS‐T. The following primary mouse monoclonal antibodies were used: anti‐p53 (Novocastra) diluted 1 : 1000, anti‐p21 diluted 1 : 100 (Dako, Glodstrup, Denmark), anti‐cyclin A and anti‐cyclin E (Novocastra) diluted 1 : 250, anti‐phospho‐S608‐RB (Neomarkers, Fremont, CA, USA) diluted 1–200 and anti‐β‐actin (Sigma Chemical Company) diluted 1 : 4000. Membranes were washed 1 × 15′ and 2 × 5′ in TBS‐T to remove unbound Ab, and were incubated for 1 h in the presence of horseradish peroxidase‐labelled secondary Ab (dilution 1 : 10 000). After several washings, the horseradish peroxidase activity was detected using enhanced chemiluminescence kit and was revealed on Hyperfilm‐enhanced chemiluminescence films (Amersham, Arlington Heights, IL, USA).
RB1 and TP53 silencing by RNA interference in U2OS cells
Asynchronously growing U2OS cells were subjected to RNA interference (RNAi) to silence RB1 and TP53 expression. U2OS cells grown in DMEM supplemented with 20% FCS were transfected with TP53 (Validated Stealth RNAi DuoPack – Invitrogen, Carlsbad, CA, USA) and RB1 (Stealth RNA Select – Invitrogen) siRNAs and scrambled sequences (Invitrogen) were used as negative controls. Transfections were performed utilizing Lipofectamine 2000 following procedures recommended by the manufacturer (Invitrogen) at a concentration of 10 nm for TP53 and relative scrambled control sequences, and 40 nm for RB1 and relative scrambled control sequences.
RNA interference was performed for TP53 alone, for RB1 alone or for both tumour‐suppressor genes. Evaluation of the efficacy of the interference procedure was carried out as follows. Forty‐eight hours after transfection with RB1 siRNAs and control‐scrambled sequences, the cells were processed for total pRB‐immunocytochemical and Western blot analysis as described above, using monoclonal anti‐RB antibody (Ab‐1, Clone 1F8; Laboratory Vision Corporation, Fremont, CA, USA) diluted 1 : 200 in PBS containing 1% BSA, as primary antibody. For p53 revelation, 48 h after transfection with TP53 siRNAs and control‐scrambled sequences, cells were treated with 0.04 µg/mL ActD for 1 h and were fixed 7 h later. The p53 immunostaining and immunoblotting were performed as reported above. Evaluation of pRB and p53 was also carried out on cells silenced for both RB1 and TP53 gene expression. Effects of rRNA synthesis inhibition on cell cycle progression were evaluated in cells in which either TP53 alone or RB1 alone or both tumour‐suppressor genes had been silenced and in control cells transfected with the scrambled sequences. Forty‐eight hours after transfection, asynchronously growing U2OS cells were treated with ActD 0.04 µg/mL for 1 h. Cells were harvested after 13 and 23 h, respectively, and were processed for cell cycle analysis by DNA flow cytometry, as reported above.
rRNA inhibition and cell population growth
U2OS and SAOS‐2 cells were seeded in retin‐flasks (Retin‐flask, PBI‐Omnialab, Milan, Italy). Six flasks for each cell line were used. In three flasks of U2OS and SAOS‐2 ActD at the final concentrations of 0.04 µg/mL was added for 1 h every day. Cells within six squares in every retin‐flask were counted and cell population growth was evaluated each day for 5 consecutive days.
Quantitative analysis of rRNA cell content
Evaluation of total cellular rRNA content was carried out by RNA electrophoresis and densitometric quantification of bands corresponding to 28S and 18S RNA. Asynchronously growing U2OS and SAOS‐2 cells were treated with ActD 0.04 µg/mL for 1 h for 4 days. Total RNA was extracted from the same number of control and ActD‐treated cells (1 × 10⁶), using Trizol reagent (Invitrogen, Darmstadt, Germany). For each sample, three replicates were analysed. The 28S and 18S RNA bands were visualized after gel electrophoresis in 1% agarose and ethidium bromide staining. Intensity of bands was evaluated using the densitometric software GelPro analyser 3.0 (Media Cybernetics, Silver Spring, MD, USA), and the values expressed in arbitrary units (a.u.).
Evaluation of cell death
In order to estimate the percentage of dead SAOS‐2 cells after the daily treatment with ActD, floating cells in the medium of each flask were transferred to centrifuge tubes. After detachment of adherent cells with trypsin, the cells were mixed with the corresponding floating cells before centrifugation. The cells were then stained with 0.4% trypan blue, and the numbers of trypan blue positive and negative cells were counted, on a haemocytometer, by light microscopy. For detection of apoptotic nuclei, the mixed floating and detached cells were ethanol fixed as for flow cytometric analysis. One hundred microlitres of cell suspension were placed in a 2‐mL conic tube with 500 µL of staining solution (0.5 µg DAPI + 0.5 µg sulforodamine 110 in PBS) and were kept at room temperature in the dark for 30 min. Cells were spun down for 10 min at 150 g. Supernatant fluid was discarded and cell pellets were gently transferred on a glass slide using a micropipette. A coverslide was placed over the liquid drop and cells on the slide were immediately observed (and pictures recorded) using a fluorescence microscope (Darzynkiewicz et al. 1992). Cells were therefore observed without washing in the staining solution. Samples were observed by means of an Olympus BX51 microscope with standard fluorescence equipment (ultraviolet excitation: BP 330–385 nm, DM 400 and barrier filter BA 420). The objective Plan Fl 40X (0.75) was routinely used. Fluorescence microphotographs were taken using a digital camera, Olympus Camedia 4040z. Apoptotic figures were recognized either by fragmentation of nuclei, or by reduced stainability of nuclei or absence of stained nuclei in the cells.
RESULTS
In order to study the effects of reduction of ribosome biogenesis on cell cycle progression and cell population growth in the U2OS and SAOS‐2 osteosarcoma cell lines we used ActD at the dose of 0.04 µg/ml. In agreement with previously reported data (Dousset et al. 2000; Derenzini et al. 2005), we observed that at this dose the drug exclusively hinders rDNA transcription. Asynchronously growing U2OS and SAOS‐2 cells were treated with ActD for 1 h. The drug was then removed and [3H]‐uridine was added for 30 min either immediately after drug treatment or 7 and 13 h thereafter. Untreated cells were used as controls. Measurement of the radioactivity incorporated into RNA fractions showed a marked reduction in [3H]‐uridine incorporation in the RNA extracted fraction at 50 °C (precursor rRNA), 1 and 7 h after drug treatment both in U2OS and in SAOS‐2 cells, whereas 13 h after the end of ActD treatment a recovery of rRNA synthesis occurred in both cell lines (Table 1). No changes were observed in [3H]‐uridine incorporation in the RNA fraction extracted at 85 °C (heterogeneous RNA) (data not shown).
Table 1.
rRNA synthesis in asynchronously growing U2OS and SAOS‐2 cells treated with ActD, measured by the evaluation of [3H]‐uridine radioactivity (d.p.m./µg RNA) incorporated in the RNA fraction extracted at 50 °C (precursor rRNA)
| Cell line | Untreated cells | ActD for 1 h and immediately processed | ActD for 1 h and processed 7 h after drug removal | ActD for 1 h and processed 13 h after drug removal |
|---|---|---|---|---|
| U2OS (mean ± SD) | 6782 ± 274 | 2746 ± 99* | 3046 ± 175* | 4731 ± 157* |
| SAOS‐2 (mean ± SD) | 3131 ± 243 | 1310 ± 36* | 1317 ± 143* | 2541 ± 62** |
P < 0.0001 and
P < 0.01, referred to untreated cells.
Effect of rRNA synthesis inhibition on cell cycle progression
To evaluate the effect of rRNA synthesis inhibition on cell cycle progression, asynchronously growing U2OS and SAOS‐2 cells were treated with ActD at a dose of 0.04 µg/mL, and the DNA content was evaluated by DNA flow cytometry at 3, 7, 10, 13 and 23 h after 1‐h drug treatment (Fig. 1). For each time point, three independent samples were measured. As far as the U2OS cells were concerned, no change in cell cycle progression was observed 3 h after drug treatment, as determined by the evaluation of the percentage in G0/G1, S and G2 + M phase control and ActD treated cells. Seven hours after ActD treatment a small accumulation of cells in G2 + M phase occurred, together with a reduction in the number of cells in S phase. Marked changes in distribution of cells in the cell cycle phases occurred at 10 and mainly at 13 h after drug treatment. At the latter time, cells appeared to equally accumulate in G0/G1 and G2 + M phase with practically no presence in S phase. Morphological examination of the cells showed no mitosis. This indicated therefore that at this time a block in cell cycle progression had occurred both from G1 to S phase and from G2 to M phase. Twenty‐three hours after ActD treatment distribution of U2OS cells in the cell cycle phases showed that these blocks were removed with the passage of cells from G2 + M to G0/G1 phase and from G1 to S phase. Regarding the SAOS‐2 cells, flow cytometric analysis did not reveal significant changes in distribution of cells in the cycle phases at any time after ActD treatment, thus indicating that inhibition of ribosome biogenesis does not cause any block of cell cycle progression of SAOS‐2 cells. In Fig. 1, the profiles relative to the distribution of control and ActD‐treated SAOS‐2 cells, 10, 13 and 23 h after drug treatment, appear.
Figure 1.
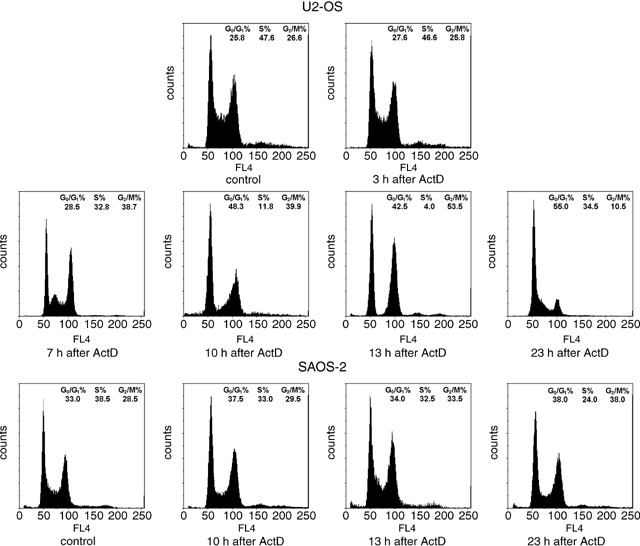
Representative flow cytometric DNA profiles of asynchronously growing U2OS and SAOS‐2 cells after DAPI staining. U2OS cells treated with ActD for 1 h were analysed 3, 7,10, 13 and 23 h after the end of drug treatment. Note the cell accumulation in G0/G1 and G2 + M phases at 10 and, mainly, at 13 h after the end of ActD treatment, indicating that a block in cell cycle progression has occurred at this latter time. At 23 h after the end of ActD treatment, the DNA profile shows a transition of cells from G0/G1 to S phase and from G2 + M to G1 phase, indicating a restart of cell cycle progression. In SAOS‐2 cells treated with ActD for 1 h and analysed 10, 13 and 23 h after the end of drug treatment, the flow cytometric DNA profiles are similar to that of control SAOS‐2 cells, indicating that the cell cycle progression is not affected by ActD treatment. The values of the percentage of the cells in the cell cycle phases reported in the upper right represent the mean of three different measurements.
rRNA synthesis inhibition activates the p53‐p21Cip1‐pRB pathway in U2OS cells
Flow cytometric analysis indicated that ActD treatment caused cell cycle arrest in G1 and G2 phases only in the pRB‐ and p53‐proficient U2OS cells. In order to ascertain whether this arrest was related to normal status of pRB and p53 in these cells, we carried out a time‐course study on expression of p53 and p21Cip1, and on the phosphorylation of pRB after 1‐h ActD treatment in the U2OS cells, both by immunocytochemical and Western blot analysis (Fig. 2). The level of wild‐type p53 is very low in normally proliferating cells (Ljungman 2000). In response to a variety of cellular stresses, short‐lived p53 is stabilized and accumulates in the cell nucleus, thus inducing cell cycle arrest or apoptosis (Levine 1997). Therefore, in normally proliferating cells, p53 is not detectable by common immunocytochemical methods. In Fig. 2a1, asynchronously proliferating U2OS cells are shown that were stained using anti‐p53 monoclonal antibodies. Few nuclei appeared to be very weakly stained. One hour after ActD treatment, all U2OS cell nuclei were positive for p53 immunostaining and 4 h after the end of drug treatment, cell nuclei were deeply stained (Fig. 2a2). p21Cip1 is a member of the Cip/Kip family of cyclin‐dependent kinase inhibitors and its expression is induced by p53 (Sherr 1996). Here, the level of p21Cip1 expression, as visualized using anti‐p21 monoclonal antibodies, was very low in control cells (Fig. 2b1). Two hours after the end of ActD treatment the intensity of the immunostaining reaction was similar to that of controls. An increase of the intensity of the staining reaction was observed after 3 h and significantly 7 h after the end of drug treatment at which time many nuclei were stained (Fig. 2b2). To obtain precise information on the changes in pRB phosphorylation, we used antibodies versus the hyper‐phosphorylated form of pRB. Because the level of pRB expression is constant during the cell cycle phases (Classon & Harlow 2002), variations in the intensity of the staining reaction indicated quantitative changes in pRB phosphorylation. In this study, we considered only the very intensely stained nuclei as those containing pRB in a highly phosphorylated state. In Fig. 2c1, control cells immuno‐stained for the hyper‐phosphorylated form of pRB were shown. A very high percentage of intensely stained nuclei was visible. At 13 h after the ActD treatment, the percentage of stained nuclei was very markedly lower than in control cells (Fig. 2c2). The percentage of stained nuclei appeared to rise again 23 h after ActD treatment (Fig. 2c3). The expression of p53, p21 and the hyper‐phosphorylated form of pRB was also analysed by immunoblotting of the whole protein content of control and ActD‐treated U2OS cells using specific monoclonal antibodies (Fig. 2d). Regarding the expression of p53, no stained band was visible in control cells at the expected molecular weight of 53 kDa. On the other hand, 3 h after ActD treatment a clearly stained band was present; the staining intensity of the band appeared to be increased in samples at 7, 10 and 13 h after ActD treatment, whereas it was reduced again at 23 h after drug treatment. As far as the expression of p21 was concerned, no stained band was present at the expected molecular weight of about 20 kDa in control cells and in cells 3 h after ActD treatment. A lightly stained band was visible at 7 h after ActD treatment; the intensity of the staining progressively increased, reaching its highest value 13 h after ActD treatment. At 23 h after ActD treatment, the staining intensity of the band appeared to be reduced. The immunoblotting with the antibodies versus the phosphorylated form of pRB revealed that the staining intensity of the band at the expected molecular weight of 105 kDa was quite similar in all the lines with the exception of that relative to the sample at 13 h after ActD treatment that appeared to be markedly reduced.
Figure 2.
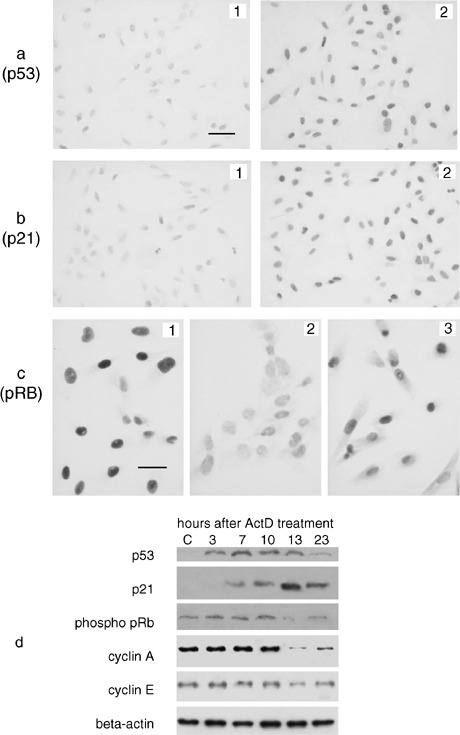
Effect of ActD treatment on the expression of cell cycle related proteins in U2OS cells. (a) Immunocytochemical visualization of p53. In control cells (a1) the nuclei appear to be very weakly stained (bar = 25 µm). Four hour after ActD treatment all U2OS cell nuclei appear to be positive for p53 immunostaining (a2). (b) Immunocytochemical visualization of p21. No or very lightly stained nuclei are detectable in control cells (b1). Many cell nuclei appear to be stained 7 h after the end of ActD treatment (b2). Same magnification as in Fig. 2a. (c) Phosphorylated pRB immunostaining. In control cells (c1) intensely stained nuclei are present (Bar = 12.5 µm). In ActD‐treated cells (c2), at 13 h after the end of drug treatment, all the nuclei appear to be very faintly stained. At 23 h after the end of ActD treatment (c3), the staining intensity of cell nuclei appears to be higher than in Fig. 2c. (d) Western blot analysis of cell cycle related proteins in U2OS control (C) and ActD‐treated cells, evaluated 3, 7, 10, 13 and 23 h after the end of drug treatment. Note the early increase of p53 level, followed by the increase of p21 with the contemporary reduction of the expression of the hyper‐phosphorylated form of pRB, cyclin A and cyclin E, at 13 h after the end of ActD treatment. The level of these changes appears to be reduced at 23 h after the end of drug treatment.
Because the results reported above were consistent with the activation, by ActD treatment, of the p53‐p21 pathway leading to a reduction of the level of pRB phosphorylation, we also investigated whether this reduction might be responsible for changes of the expression of the products of the E2F target genes. Therefore, we carried out a Western blot analysis of the expression of two proteins, cyclin A and cyclin E, which are coded by E2F target genes (Degregori et al. 1997). The band at 60 kDa, relative to cyclin A, showed the same high staining intensity in control cells and in cells at 3, 7 and 10 h after ActD treatment, whereas a marked reduction of the staining intensity of the band was observed at 13 h after ActD treatment. Cyclin A expression appeared to increase again in cells at 23 h after ActD treatment (Fig. 2d). Regarding the expression of cyclin E, immunoblot analysis showed stained bands, at the expected molecular weight of 50 kDa, characterized by the same staining intensity in all the lines with the exception of the line relative to cells at 13 h after ActD treatment, which appeared to be lesser intensely stained (Fig. 2d).
pRB and p53 expression is necessary for the effects of rRNA synthesis inhibition on cell cycle progression of U2OS cells
Flow cytometric analysis indicated that ActD treatment caused cell cycle arrest in G1 and G2 phase only in the pRB‐ and p53‐proficient U2OS cells. In order to ascertain whether this arrest was actually due the expression of pRB and p53 in theses cells, we induced a silencing of RB1 and TP53 gene expression in U2OS cells by specific RNA interference and then we studied the effect of ActD treatment on cell cycle progression. First, the effect of the RNA interference procedure on the expression of pRB and p53 was checked by an immunocytochemical study. This analysis was carried out on cells silenced for the expression of either RB1 or TP53 or both tumour‐suppressor genes. Cells transfected with scrambled sequences were used as controls. In Fig. 3a, asynchronously proliferating U2OS cells silenced for pRB expression by siRNAs were shown that were stained using anti‐RB monoclonal antibodies recognizing both the hyper‐phosphorylated and the un‐(under)phosphorylated pRB. The cell nuclei appeared to be not stained, whereas a very intense immunolabelling characterized U2OS cells transfected with the scrambled RNA sequences (Fig. 3b).
Figure 3.
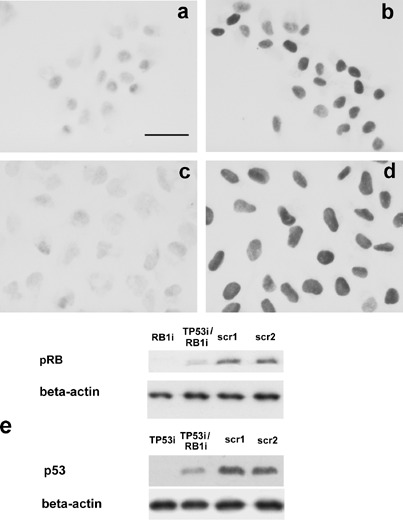
pRB and p53 immunocytochemical staining of U2OS cells either silenced for both tumour suppressors (3a and 3c) or transfected with scrambled sequences (3b and 3d). Monoclonal antibodies versus total RB (3a and 3b) and versus p53 (3c and 3d) were used. Cells silenced for pRB showed very weakly stained nuclei (3a), whereas nuclei of cells transfected with the scrambled sequences appeared to be deeply stained (3b). After ActD treatment, cells silenced for p53 showed a very weak immuno‐staining (3c) whereas the intensity of the staining reaction was very high in cells transfected with the scrambled sequences (3d). Bar = 10 µm. (e) Western blot analysis of pRB and p53 after specific RNA interference. The expression of pRB is strongly reduced in single (RB1i) and double (TP53i/RB1i) silenced samples in comparison to samples transfected with scrambled sequences (scr1, scr2). In cell treated with ActD to stabilize p53, the expression of p53 is very low in single (TP53i) and double (TP53i/RB1i) silenced samples.
To visualize p53, we treated U2OS cells transfected with both TP53 siRNAs and the relative scrambled sequences with ActD for 1 h, and 7 h after the end of drug treatment we carried out the immunostaining reaction using anti‐p53 monoclonal antibodies. The immunostaining reaction appeared to be negative in cells transfected with TP53 siRNA (Fig. 3c). In Fig. 3d, U2OS cells transfected with the scrambled RNA sequences were shown: all cell nuclei were deeply stained. The same results were obtained using cells silenced for both tumour‐suppressor genes and cells treated with siRNA scrambled sequences as control. The immunocytochemical analysis indicated that the expression of pRB and p53 was absent or greatly reduced in more than 90% of the cells after the specific siRNA interferences. The immunocytochemical results were confirmed by the Western blot analysis of pRB and p53 expression carried out in RB1 and TP53 silenced cells and in cells treated with siRNA‐scrambled sequences, using the same experimental conditions as for the immunocytochemical study. In Fig. 3e, the expression of pRB and p53 was shown in cells silenced for either RB1 or TP53 and for both tumour‐suppressor proteins. The bands at the expected molecular weight for pRB appeared to be very faintly stained in samples silenced for RB1 alone and for both RB1 and TP53, whereas those relative to the samples treated with the scrambles sequence were very intensely stained. The same staining pattern characterized the bands relative to the p53 expression. The bands at the expected molecular weight for p53 were hardly detectable in the samples silenced for TP53 alone and for both RB1 and TP53, whereas they were intensely stained in control samples. Then, we evaluated the DNA distribution in cells either silenced for both pRB and p53 expression or treated with scrambled sequences at 13 and 23 h after ActD treatment. In Fig. 4, representative DNA profiles of untreated and ActD‐treated cells were shown at 13 h after the end of drug treatment. In U2OS cells transfected with the scrambled sequences, the inhibition of rRNA synthesis caused a marked reduction of the number of cells in S phase with their accumulation in G0/G1. In U2OS cells silenced for both tumour‐suppressors and untreated and treated with ActD, the DNA distribution in the cycle phases indicated that the ActD treatment does not cause significant change of cell cycle progression in U2OS cells silenced for both pRB and p53 expression. The same results on cell DNA distribution were observed at 23 h after the treatment with ActD (data not shown).
Figure 4.

Representative flow cytometric DNA profiles, of asynchronously growing U2OS cells silenced for RB and p53, and untreated (–ActD) or treated (+ActD) with ActD for 1 h and analysed 13 h after the end of the drug treatment. Comparrison between the profiles of cells transfected with the scrambled sequences show an accumulation of cells in G0/G1 phase and a marked reduction of cells in S phase after ActD treatment. No significant differences are visible between the profiles of untreated and ActD‐treated cells, silenced for both RB and TP53. Comparison between the profiles of cells silenced for RB show a moderate increase of the percentage of cells in G2 + M phase after ActD treatment. The same change appears to occur in cells silenced for TP53 after ActD treatment. The values of the percentage of the cells in the cell cycle phases reported in the upper right were the mean of measurements of at least three samples.
We also carried out a flow cytometric analysis in U2OS cells silenced for either RB1 or TP53 in order to understand which of these tumour suppressors might be responsible for the changes of cell cycle progression after ActD treatment. The profile relative to untreated U2OS cells silenced for RB1 expression showed an accumulation of cells in G0/G1 phase, if compared to that of cells transfected with the scrambled sequences. The ActD treatment caused, at 13 h after the end of drug treatment, a decrease of the number of cells in S phase and an increase of cells in G2 + M phase. In U2OS cells silenced for p53 expression, the ActD treatment caused a moderate reduction of the percentage of S‐phase cells with a comparable increment of G2 + M‐phase cells. Once again, the same results on cell DNA distribution in cell cycle phases were observed at 23 h after the treatment with ActD (data not shown).
Long‐term effects of rRNA synthesis inhibition on cell population growth and ribosome cell content
The data reported above indicated that a transient inhibition of rRNA synthesis was followed by a transitory arrest of cell cycle progression in the pRB‐ and p53‐proficient U2OS cells but not in the pRB‐ and p53‐deficient SAOS‐2 cells. Therefore, it was very likely that the arrest in G1 and G2 phase might allow the U2OS cells to reach, at the end of the cycle, a ribosome content not markedly diminished by transient rRNA synthesis inhibition. On the contrary, in SAOS‐2 cells the unchanged cell cycle progression after rRNA inhibition should induced, at the end of the cycle, a reduction of the ribosome content responsible for a lower amount of ribosomes in daughter cells. This different effect of rRNA synthesis inhibition on cell cycle progression of the two cell lines might have different consequence on their population growth under a long‐term reduction of ribosome biogenesis. To investigate the long‐term effect of a transitory inhibition of rRNA synthesis on the growth of the osteosarcoma cell lines, we treated both cell lines with 0.04 µg/mL ActD for 1 h a day and measured the expansion of cell population for 4 days (U2OS cells) and 5 days (SAOS‐2 cells). Measurements were carried out in triplicate and for each time point they gave rise to quite similar values. In Fig. 5a, a graphic representation of the results obtained is shown. Regarding the U2OS cells, the ActD treatment induced a light reduction of the cell population growth rate, very likely due to the increased doubling time. On the contrary, after the second day of ActD treatment, the daily reduction of rRNA synthesis completely inhibited the cell population growth of SAOS‐2 cells whose number, at the end of the treatment, was lower than that at the beginning of the experiment. To investigate the reason for this progressive reduction of the number of SAOS‐2 cells, we first evaluated the percentage of cells in the cell cycle phases after 2 days of ActD treatment. We found that the cytoflourimetric profile relative to the ActD treated cells showed an accumulation of cells in G0/G1 phase with a reduction of the percentage of cells both in S and G2/M phase (54.9% ± 1.6 SD; 27.1% ± 1.40 SD and 18.5% ± 1.10 SD) if compared to that of control cells (33.0% ± 1.5 SD; 38.5% ± 1.2 SD and 28.5% ± 1.25 SD). However, because these data indicated that the ActD treatment did not cause a block but in fact only a slowing down of cell cycle progression in SAOS‐2, we wondered whether the progressive reduction of the SAOS‐2 cell population might be due to an increased cell death rate. For this reason, we estimated the rate of cell death in SAOS‐2 cells after daily treatment with ActD by trypan blue exclusion test. In control cells, no dead cell was detected, whereas after the first day of ActD treatment a steep increase of the number of dead cells was observed (25.3% ± 10.2 SD). A further increase in the number of dead cells was observed after the second day of ActD treatment (61.7% ± 22.5 SD) (Fig. 5b). These results demonstrated that ActD treatment caused a progressive increase of cell mortality rate in SAOS‐2 cells.
Figure 5.

Effect of a daily ActD treatment (0.04 µg/mL for 1 h) on U2OS and SAOS‐2 cell population growth. (a) Variation of cell number (relative growth) is referred to the number of the cells at time 0. ActD treatment only lightly reduced the expansion of the U2OS cell line. In contrast, since the second day of treatment, the drug completely inhibits the growth of SAOS‐2 cell population. (b) Effect of daily repeated 1‐h ActD treatment on cell mortality of SAOS‐2 cells. Cell viability was assessed by trypan blue exclusion test. Box plots show percentages of dead cells. The median dead cell value is depicted by horizontal bars, the interquartile range by boxes, and the minimum and maximum values by vertical bars. No dead cell is present in control cells (0 h). A steep progressive increase of cell mortality rate can be observed after the first and the second day of drug treatment. (c, d) SAOS‐2 cells stained by DAPI and sulforodamine for the visualization of apoptotic figures. Control cells showing uniformly stained nuclei; no apoptotic figure is visible (5c). In the ActD‐treated cells (5d) several apoptotic figures can be recognized after the second day of 1‐h daily repeated ActD treatment. Fragmented nuclei (1), faintly stained nuclei with partial loss of DNA (2), and cells without stained nuclear material (3) are present. (e) rRNA content in U2OS and SAOS‐2 cells untreated (C) and treated (ActD) with ActD (0.04 µ/mL for 1 h a day) for 4 days. RNA was size separated on 1% agarose gel and stained with ethidium bromide. Two bands corresponding to 28S and 18S rRNA are visible in each lane. The intensity of the staining of both bands is reduced in SAOS‐2 cells treated with ActD.
Morphological analysis of nuclear changes indicated the SAOS‐2 cell death mainly occurred for apoptosis. In Fig. 5c and 5d, control and ActD‐treated SAOS‐2 cells, 2 days after the beginning of drug treatment, were shown after DAPI and sulforodamine staining. In the ActD‐treated cells (Fig. 5d), many nuclear apoptotic typical changes were visible (nuclear fragmentation and loss of nuclear stainability) that were absent in control cells (Fig. 5c).
To try to explain the increased mortality rate of SAOS‐2 cells, we have ascertained whether the effect on SAOS‐2 cell population growth was associated with a quantitative reduction of the ribosome content induced by the long‐term treatment with ActD. Cellular rRNA content, extracted from the same number of control and drug‐treated U2OS and SAOS‐2 cells 4 days after the beginning of ActD treatment, was measured by total RNA electrophoresis and densitometric quantification of bands corresponding to 28S and 18S rRNA (Fig. 5e). The integrated optical density (IOD) relative to 28S rRNA was 326 ± 31 (SD) in untreated and 351 ± 37 (SD) a.u. in treated U2OS cells, and the IOD relative to18S rRNA was 327 ± 29 (SD) and 325 ± 30 (SD) a.u. in untreated and treated U2OS cells, respectively. The rRNA content was markedly reduced in treated SAOS‐2 cells. The IOD value of 28S rRNA was 247 ± 21 (SD) a.u. in untreated and 154 ± 18 (SD) a.u. in treated SAOS‐2 cells, and that 18S rRNA was 260 ± 28 (SD) and 162 ± 20 (SD) a.u. in untreated and treated SAOS‐2 cells, respectively.
DISCUSSION
Our results have shown that low dose (0.04 µg/mL) ActD treatment for 1 h caused a cell cycle arrest both at G1/S and G2 + M transition points in asynchronously growing, pRB‐ and p53‐proficient U2OS cells but not in the pRB‐ and p53‐deficient SAOS‐2 cells and in U2OS cells silenced for RB1 and TP53. A mild perturbation of cell cycle progression was observed in U2OS cells silenced for the expression of either RB1 or TP53. The cell cycle arrest observed in U2OS cells was transient: after the recovery of ribosome biogenesis, which begun 13 h after the end of ActD treatment, the cell cycle started again with the appearance of a significant cell fraction in S phase after 23 h. Long‐term treatment with ActD for 1 h a day slightly reduced cell population growth of U2OS cells, whereas it hindered that of the SAOS‐2 cells.
We have demonstrated that at the concentration of 0.04 µg/mL ActD selectively inhibits the RNA polymerase I‐dependent transcription without affecting the RNA polymerase II transcription, in agreement with previous reported data (Dousset et al. 2000; Derenzini et al. 2005). For this reason, even though the possibility can not be ruled out that the synthesis of some microRNAs might also be affected by ActD treatment, we can reasonably considered that the effects observed in the two osteosarcoma cell lines were the consequence of the selective drug‐induced inhibition of rRNA transcription activity.
As far as the effects of reduced rRNA synthesis on cell cycle progression of U2OS cells were concerned, they may be explained by the available evidence indicating that an altered ribosome biogenesis is responsible for p53 stabilization (Pestov et al. 2001; Lohrum et al. 2003; Rubbi & Milner 2003; Zhang et al. 2003; Bhat et al. 2004; Dai et al. 2004) with the consequent expression of p21Cip1 and reduced pRB phosphorylation. In fact, also in our experimental conditions, we observed that as early as 1 h after ActD treatment, p53 began to accumulate in U2OS cells. p53 accumulation progressively increased, reaching its highest value 10–13 h after ActD treatment. Following p53 accumulation, an increased p21Cip1 expression occurred in ActD‐treated cells together with a reduced level of the phosphorylated form of pRB. Both p53 and p21Cip1 have an inhibitory effect on transition from G1 to S phase and from G2 to M phase (Harper et al. 1993; Sherr 1996; Bunz et al. 1998; Sherr & Roberts 1999; Flatt et al. 2000; Taylor & Stark 2001). The G1‐S arrest is caused by p21Cip1 inhibition of pRB phosphorylation (Harper et al. 1993; Sherr 1996). In fact, by binding a family of transcription regulators termed the E2Fs, pRB and other RB‐like proteins, repress transcription of those genes whose products are necessary for the synthesis of DNA. pRB phosphorylation lets the E2Fs free to activate the target genes and the cell to enter the S phase. pRB phosphorylation is triggered by the cyclin D‐cyclin‐dependent protein kinase (Cdk) 4 and 6 complexes during G1 phase and fulfilled by cyclin E‐Cdk 2 complexes at the end of G1 phase (Sherr 1996). p21Cip1 inhibits the cyclin‐dependent kinases thus hindering pRB phosphorylation (Harper et al. 1993; Sherr 1996). Accordingly, we found that in ActD‐treated U2OS cells the reduction of pRB phosphorylation was associated with a reduced expression of cyclin A and cyclin E that are products of the E2F target genes (DeGregori et al. 1997). Stabilization of p53 may also explain the arrest of the U2OS cells at the transition from G2 to M phase after ribosome biogenesis inhibition. In fact, p53 is required for an effective function of the G2 + M phase checkpoint (Bunz et al. 1998; Flatt et al. 2000).
Unlike the U2OS cells, we found that the inhibition of ribosome biogenesis in the pRB‐ and p53‐deficient SAOS‐2 cells did not induce any change in the cell cycle progression. Therefore, in the case of SAOS‐2 cells the continuous exchange of information among the mechanisms regulating growth and proliferation appeared not to work, very likely due to the lack of the two tumour‐suppressor proteins. In fact, studies carried out on the effects of rRNA synthesis inhibition on cell cycle progression of U2OS cells, in which the expression of both pRB and p53 was silenced by the RNAi procedure, demonstrated that this was actually the case. Flow cytometric analysis indicated that the cell cycle progression was not hindered by ActD treatment in U2OS cells in which both RB1 and TP53 genes were silenced. In contrast, U2OS cells transfected with scrambled sequences behaved, after rRNA synthesis inhibition, in a similar manner as control, non‐transfected cells, showing G1 and G2 arrest. We also demonstrated that in U2OS cells silenced for the expression of either pRB or p53 alone the inhibition of rRNA synthesis induced only a mild perturbation of cell cycle progression. There is evidence that a hindered ribosome biogenesis causes p53 stabilization and a p53‐dependent cell cycle arrest in G1 phase (Pestov et al. 2001). The present results, from one side, are consistent with the relevance of p53 in the crosstalk between ribosome biogenesis and cell cycle progression and, from the other side, stress the role of pRB in the control that an adequate ribosome complement has to be reached for G1/S‐phase progression (Derenzini et al. 2005). In any case, our data indicate that the inhibition of ribosome biogenesis did not induce any change in cell cycle progression only in the cells silenced for both pRB and p53 expression.
The different effect on cell cycle progression during a reduced ribosome biogenesis can explain the different behaviour of the U2OS and SAOS‐2 cell lines when they were subjected to a daily repeated, long‐term ActD treatment. In the case of U2OS cells, the daily dose of ActD induced an arrest of cell cycle progression that hindered the cells to entry to M phase with an incomplete ribosome complement. When rRNA synthesis was resumed, ribosome biogenesis was very likely completed and cell divided with an appropriate ribosome complement, as demonstrated by the absence of quantitative changes of rRNA content in the U2OS cells after the long‐term ActD treatment. In these cells, ActD treatment only caused a lengthening of cell doubling time, while long‐term ActD treatment resulted only in a moderate lengthening of U2OS cell population growth due to the longer cell cycle length. In contrast, in the case of SAOS‐2 cells, ActD did not influence the cell cycle progression thus leading the cells to divide without having reached an appropriate ribosome complement so that, upon repeated treatment, the progressive reduction of ribosome complement may become very rapidly incompatible with cell life. In fact, a progressive increase of the cell death rate occurred after the first day of ActD treatment, which was due to an increased apoptotic activity, without significant changes in the cell cycle progression rate. Thus, the deficiency of pRB and p53, which appeared to confer an immediate advantage to SAOS‐2 cells in maintaining proliferation unchanged after ribosome biogenesis inhibition by ActD, was actually responsible for the later cell population dying out.
Changes of pRB and p53 status are very frequent in human cancers. These cancers, from the clinical point of view, are generally more aggressive than those with normally functioning pRB and p53 pathways (Cordon‐Cardo 1995). It has been suggested that this might be due to genetic chances facilitating tumour progression. RB inactivation has been in fact shown to cause chromosome instability by compromising the accuracy of mitosis (Hernando et al. 2004). Moreover, changes in pRB and p53 status were found to be associated in breast cancer with an up‐regulation of ribosome biogenesis that may enhance cell proliferation rate (Treréet al. 2004). Therefore, these cancers appear to have biological advantages over tumours with normal pRB and p53 status. However, our results suggested that these biological characteristics may represent an Achilles heel that can be exploited by chemotherapy. Tumors with uncoupled growth and proliferation should be in fact much more vulnerable to the action of drugs inhibiting ribosome biogenesis than those with normal pRB and p53 status.
ACKNOWLEDGEMENTS
This work was supported by Pallotti's Legacy for Cancer Research, MIUR (Ministero dell’Istruzione, dell’Università e della Ricerca; finanziamenti per la Ricerca Fondamentale Orientata) and University of Bologna.
REFERENCES
- Bhat KP, Itahana K, Jin A, Zhang Y (2004) Essential role of ribosomal protein L11 in mediating growth inhibition‐induced p53 activation. EMBO J. 23, 2402–2412. [DOI] [PMC free article] [PubMed] [Google Scholar]
- Budde A, Grummt I (1999) p53 represses ribosomal gene transcription. Oncogene 18, 1119–1124. [DOI] [PubMed] [Google Scholar]
- Bunz F, Dutriaux A, Lengauer C, Waldman T, Zhou S, Brown JP, Sedivy JM, Kinzler KW, Vogelstein B (1998) Requirement for p53 and p21 to sustain G2 arrest after DNA damage. Science 282, 1497–1501. [DOI] [PubMed] [Google Scholar]
- Chandar N, Billig B, McMaster J, Novak J (1992) Inactivation of p53 gene in human and murine osteosarcoma cells. Br. J. Cancer 65, 208–214. [DOI] [PMC free article] [PubMed] [Google Scholar]
- Classon M, Harlow E (2002) The retinoblastoma tumour suppressor in development and cancer. Nat. Rev. Cancer 2, 910–917. [DOI] [PubMed] [Google Scholar]
- Cordon‐Cardo C (1995) Mutations of cell cycle regulators. Biological and clinical implications for human neoplasia. Am. J. Pathol. 147, 545–560. [PMC free article] [PubMed] [Google Scholar]
- Dai MS, Zeng SX, Jin Y, Sun XX, David L, Lu H (2004) Ribosomal protein L23 activates p53 by inhibiting MDM2 function in response to ribosomal perturbation but not to translation inhibition. Mol. Cell. Biol. 24, 7654–7668. [DOI] [PMC free article] [PubMed] [Google Scholar]
- Darzynkiewicz Z, Bruno S, Del Bino G, Gorczyca W, Hotz MA, Lassota P, Traganos F (1992) Features of the apoptotic cells measured by flow cytometry. Cytometry 13, 795–808. [DOI] [PubMed] [Google Scholar]
- Degregori J, Leone G, Miron A, Jakoi L, Nevins JR (1997) Distinct roles for E2F proteins in cell growth control and apoptosis. Proc. Natl. Acad. Sci. USA 94, 7245–7250. [DOI] [PMC free article] [PubMed] [Google Scholar]
- Derenzini M, Farabegoli F, Pession A, Novello F (1987) Spatial redistribution of ribosomal chromatin in the fibrillar centres of human circulating lymphocytes after stimulation of transcription. Exp. Cell Res. 170, 31–41. [DOI] [PubMed] [Google Scholar]
- Derenzini M, Montanaro L, Chilla A, Tosti E, Vici M, Barbieri S, Govoni M, Mazzini G, Trere D (2005) Key role of the achievement of an appropriate ribosomal RNA complement for G1‐S phase transition in H4–II‐E‐C3 rat hepatoma cells. J. Cell. Physiol. 202, 483–491. [DOI] [PubMed] [Google Scholar]
- Dousset T, Wang C, Verheggen C, Chen D, Hernandez‐Verdun D, Huang S (2000) Initiation of nucleolar assembly is independent of RNA polymerase I transcription. Mol. Biol. Cell 11, 2705–2717. [DOI] [PMC free article] [PubMed] [Google Scholar]
- Flatt PM, Tang LJ, Scatena CD, Szak ST, Pietenpol JA (2000) p53 regulation of G2 checkpoint is retinoblastoma protein dependent. Mol. Cell. Biol. 20, 4210–4223. [DOI] [PMC free article] [PubMed] [Google Scholar]
- Harper JW, Adami GR, Wei N, Keyomarsi K, Elledge SJ (1993) The p21 Cdk‐interacting protein Cip1 is a potent inhibitor of G1 cyclin‐dependent kinases. Cell 75, 805–816. [DOI] [PubMed] [Google Scholar]
- Hartwell LH, Weinert TA (1989) Checkpoints: controls that ensure the order of cell cycle events. Science 246, 629–634. [DOI] [PubMed] [Google Scholar]
- Hernandez‐Verdun D, Roussel P (2003) Regulators of nucleolar functions. Prog. Cell Cycle Res. 5, 301–308. [PubMed] [Google Scholar]
- Hernando E, Nahle Z, Juan G, Diaz‐Rodriguez E, Alaminos M, Hemann M, Michel L, Mittal V, Gerald W, Benezra R, Lowe SW, Cordon‐Cardo C (2004) Rb inactivation promotes genomic instability by uncoupling cell cycle progression from mitotic control. Nature 430, 797–802. [DOI] [PubMed] [Google Scholar]
- Levine AJ (1997) p53, the cellular gatekeeper for growth and division. Cell 88, 323–331. [DOI] [PubMed] [Google Scholar]
- Ljungman M (2000) Dial 9–1–1 for p53: mechanisms of p53 activation by cellular stress. Neoplasia 2, 208–225. [DOI] [PMC free article] [PubMed] [Google Scholar]
- Lohrum MA, Ludwig RL, Kubbutat MH, Hanlon M, Vousden KH (2003) Regulation of HDM2 activity by the ribosomal protein L11. Cancer Cell 3, 577–587. [DOI] [PubMed] [Google Scholar]
- Otto FJ, Oldiges H, Gohde W, Jain VK (1981) Flow cytometric measurement of nuclear DNA content variations as a potential in vivo mutagenicity test. Cytometry 2, 189–191. [DOI] [PubMed] [Google Scholar]
- Peculis BA (2002) Ribosome biogenesis: ribosomal RNA synthesis as a package deal. Curr. Biol. 12, R623–R624. [DOI] [PubMed] [Google Scholar]
- Pestov DG, Strezoska Z, Lau LF (2001) Evidence of p53‐dependent cross‐talk between ribosome biogenesis and the cell cycle: effects of nucleolar protein Bop1 on G1/S transition. Mol. Cell. Biol. 21, 4246–4255. [DOI] [PMC free article] [PubMed] [Google Scholar]
- Rubbi CP, Milner J (2003) Disruption of the nucleolus mediates stabilization of p53 in response to DNA damage and other stresses. EMBO J. 22, 6068–6077. [DOI] [PMC free article] [PubMed] [Google Scholar]
- Schmidt EV (1999) The role of c‐myc in cellular growth control. Oncogene 18, 2988–2996. [DOI] [PubMed] [Google Scholar]
- Sherr CJ (1996) Cancer cell cycles. Science 274, 1672–1677. [DOI] [PubMed] [Google Scholar]
- Sherr CJ (2000) The Pezcoller lecture: cancer cell cycles revisited. Cancer Res. 60, 3689–3695. [PubMed] [Google Scholar]
- Sherr CJ, Roberts JM (1999) CDK inhibitors: positive and negative regulators of G1‐phase progression. Genes Dev. 13, 1501–1512. [DOI] [PubMed] [Google Scholar]
- Sirri V, Roussel P, Hernandez‐Verdun D (2000) In vivo release of mitotic silencing of ribosomal gene transcription does not give rise to precursor ribosomal RNA processing. J. Cell Biol. 148, 259–270. [DOI] [PMC free article] [PubMed] [Google Scholar]
- Sirri V, Roussel P, Hernandez‐Verdun D (2002) Cyclin‐dependent kinases govern formation and maintenance of the nucleolus. J. Cell Biol. 156, 969–981. [DOI] [PMC free article] [PubMed] [Google Scholar]
- Stewart N, Hicks GG, Paraskevas F, Mowat M (1995) Evidence for a second cell cycle block at G2/M by p53. Oncogene 10, 109–115. [PubMed] [Google Scholar]
- Taylor WR, Stark GR (2001) Regulation of the G2/M transition by p53. Oncogene 20, 1803–1815. [DOI] [PubMed] [Google Scholar]
- Thomas G (2000) An encore for ribosome biogenesis in the control of cell proliferation. Nat. Cell Biol. 2, E71–E72. [DOI] [PubMed] [Google Scholar]
- Treré D, Ceccarelli C, Montanaro L, Tosti E, Derenzini M (2004) Nucleolar size and activity are related to pRb and p53 status in human breast cancer. J. Histochem. Cytochem. 52, 1601–1607. [DOI] [PubMed] [Google Scholar]
- Vogelstein B, Kinzler KW (2004) Cancer genes and the pathways they control. Nat. Med. 10, 789–799. [DOI] [PubMed] [Google Scholar]
- Voit R, Hoffmann M, Grummt I (1999) Phosphorylation by G1‐specific cdk‐cyclin complexes activates the nucleolar transcription factor UBF. EMBO J. 18, 1891–1899. [DOI] [PMC free article] [PubMed] [Google Scholar]
- Voit R, Schafer K, Grummt I (1997) Mechanism of repression of RNA polymerase I transcription by the retinoblastoma protein. Mol. Cell. Biol. 17, 4230–4237. [DOI] [PMC free article] [PubMed] [Google Scholar]
- Volarevic S, Stewart MJ, Ledermann B, Zilberman F, Terracciano L, Montini E, Grompe M, Kozma SC, Thomas G (2000) Proliferation, but not growth, blocked by conditional deletion of 40S ribosomal protein S6. Science 288, 2045–2047. [DOI] [PubMed] [Google Scholar]
- Weinberg RA (1995) The retinoblastoma protein and cell cycle control. Cell 81, 323–330. [DOI] [PubMed] [Google Scholar]
- Zhai W, Comai L (2000) Repression of RNA polymerase I transcription by the tumor suppressor p53. Mol. Cell. Biol. 20, 5930–5938. [DOI] [PMC free article] [PubMed] [Google Scholar]
- Zhang Y, Wolf GW, Bhat K, Jin A, Allio T, Burkhart WA, Xiong Y (2003) Ribosomal protein L11 negatively regulates oncoprotein MDM2 and mediates a p53‐dependent ribosomal‐stress checkpoint pathway. Mol. Cell. Biol. 23, 8902–8912. [DOI] [PMC free article] [PubMed] [Google Scholar]