

Abstract
Abstract. Background: Human T‐cell lymphotropic viruses (HTLV)‐I/II have a special tropism for infecting T cells and inducing spontaneous lymphocyte proliferation. Leukaemia and neurological manifestations are associated with HTLV‐I/II infections, and treatment is usually based on anti‐inflammatory drugs including glucocorticoids. Although steroid resistance has been reported, it is unknown whether this condition is related to the infection itself or to the treatment. Objective: We investigated whether spontaneous cell proliferation is associated with T‐cell sensitivity to glucocorticoids. Materials and Methods: Twenty‐eight HTLV‐I/II patients and 11 healthy age‐matched controls took part in this study. Lymphocytes were isolated and cultured in vitro to measure spontaneous and mitogen‐induced proliferation as well as cellular sensitivity to dexamethasone. Results: Patients with HTLV‐I/II infection showed similar stimulated and unstimulated T‐cell proliferation as well as comparable sensitivity to dexamethasone in vitro. There were no group differences in the frequency of glucocorticoid responders versus non‐responders. However, T cells of patients with spontaneous proliferation were unresponsive to mitogenic stimulation and were remarkably more resistant to dexamethasone than cells of patients with normal proliferation. Conclusion: These data suggest that the poor clinical response to steroids may be associated with spontaneous cell proliferation during HTLV infection.
INTRODUCTION
Human T‐cell lymphotropic virus, type I (HTLV‐I) and type II (HTLV‐II), are retroviruses with a special tropism to infect T cells, inducing spontaneous cell proliferation (Itoyama et al. 1988; Prince et al. 1990; Wiktor et al. 1991; Prince & Swanson 1993; Mann et al. 1994; Prince et al. 1994). First isolated in 1980 (Poiesz et al. 1980), HTLV‐I is the most prevalent type worldwide and is related to several pathological states, characterized by local or systemic chronic inflammation. Within its related diseases, HTLV‐I is known to induce adult T‐cell leukaemia/lymphoma (ATL/L) (Uchiyama et al. 1977; Blattner et al. 1983; Uchiyama 1988) and HTLV‐I–associated myelopathy (HAM), also known as ‘tropical spastic paraparesis’ (TSP) (Gessain et al. 1985; Osame et al. 1987). ATL/L is a pathogenic process caused by T‐cell proliferation and has a neoplastic outcome, regardless of treatment, that often leads to death within a few months (Uchiyama et al. 1977; Franchini 1995). HAM/TSP is a chronic myelopathy that presents as an inflammatory and demyelinating process, mainly located in the thoracic spinal cord (Iwasaki 1990; Bhigjee et al. 1991; Gessain & Gout 1992; Cartier et al. 1997; Umehara et al. 2000), where a high concentration of T cells and monocytes are typically found (Murphy & Blattner 1988; Piccardo et al. 1988; Ijichi et al. 1989). This process leads to spasticity of the lower body, bladder disorders and distinct sensory disturbances (Gessain et al. 1985; Osame et al. 1986).
HTLV‐II is epidemic among intravenous drug users (IDUs) in the United States (Khabbaz et al. 1991), Brazil (Alcantara et al. 2003) and western Europe (Zanetti & Galli 1992) and is also endemic among some native populations from the Americas (Heneine et al. 1991; Maloney et al. 1992; Hjelle et al. 1993) and sub‐Saharan Africa (Goubau et al. 1993). Some case reports have described HTLV‐II–associated neurological manifestations (Menna‐Barreto 2003; Orland et al. 2003).
Because of its property of inappropriately activating T cells and inducing diseases characterized by a chronic inflammatory state (Franchini 1995; Hollsberg 1997), treatment of HTLV infections is usually based on anti‐inflammatory drugs such as synthetic glucocorticoids (GCs). These steroids exert their actions through specific binding to two distinct intracellular receptor subtypes: the mineralocorticoid and GC receptors. After being bound, the receptor‐ligand complex translocates to the nucleus, where it either binds to GC response elements on DNA or interacts with other transcription factors and regulates (positively or negatively) the genes to which they are linked (Juruena et al. 2003). Although the management of HTLV‐I/II–associated diseases often include steroidal drugs, clinical responses to GCs have been reported to be varied, with some patients responding poorly to them (Araujo et al. 1993; Nakagawa et al. 1996; Matsushita et al. 2002). However, it is largely unknown to what extent poor clinical response correlates to spontaneous proliferation and peripheral T‐cell sensitivity to GCs. The understanding of patients’ T‐cell sensitivity to GCs prior to treatment would be of valuable clinical significance as it would enable physicians to discriminate steroid responders from non‐responders. The objectives of this study are (1) to determine patients’ peripheral T‐cell sensitivity to GCs (2) to discriminate steroid responders from non‐responders in vitro and (3) to evaluate whether spontaneous cell proliferation is associated with T‐cell sensitivity to GCs (dexamethasone, DEX) among HTLV‐I/II–infected drug‐free patients. We hypothesized that HTLV patients would be more resistant to both mitogenic and steroid signalling in vitro.
MATERIALS AND METHODS
Subjects
Twenty‐eight, untreated HTLV‐I– and HTLV‐II–infected subjects were recruited for this study from the HTLV Unit (Department of Neurology, Hospital São Lucas, Porto Alegre, Brazil). Eighteen HTLV‐I infected patients (14 women), ages 15 to 62 years (mean ± SD, 44.89 ± 12.9 years) and 10 HTLV‐II–infected patients (5 women), ages 30 to 75 years (49.40 ± 13.94 years) took part in this study. The diagnosis of HTLV infection was confirmed by Western blot analysis. To discriminate steroid responders from non‐responders, 11 healthy subjects (7 women), ages 21 to 73 years (39.81 ± 18.17 years) were also recruited as a control group. Exclusion criteria included presence of infection, acute or chronic inflammatory conditions, heart disease, under‐nourishment, anaemia, leucopaenia, neoplasia and drug use (including GCs). There were no differences in gender distribution (χ2 = 2.30, d.f. = 2, P = 0.32) or age (χ2 = 1.11, d.f. = 2, P = 0.34) between patients and controls. The study protocol was approved by both scientific and ethics committees (Pontifical Catholic University of Rio Grande do Sul, PUCRS, Porto Alegre, Brazil) and written informed consent was obtained from all subjects.
Collection of peripheral blood and isolation of mononuclear cells
Ten millilitres of peripheral blood was collected by venepuncture in the morning (between 9:00 h and 10:00 h) and samples were stored in lithium‐heparin tubes prior to analysis. Peripheral blood mononuclear cells (PBMCs) were isolated by centrifugation over a Ficoll‐Hypaque (Sigma, St. Louis, MO, USA) gradient (900 g, 30 min). After washing, the cells were counted then viewed microscopically (100×) and viability always was found to exceed 95%, as judged from the cells’ ability to exclude trypan blue (Sigma). PBMCs were resuspended in complete culture medium (RPMI‐1640, supplemented with gentamicin 0.5%, glutamine 1%, N‐2‐hydroxyethylpiperazine‐N′‐2‐ethanesulfonic acid 1%, fungizone 0.1% and foetal calf serum 10% all from Sigma) and concentration in fluid was adjusted to 3 × 10⁶ cells/ml.
Lymphocyte proliferation/viability assays
PBMCs were cultured in flat‐bottomed 96‐well microplates at a final concentration of 1.5 × 10⁵ cells/well in complete culture medium for 96 h at 37 °C in an atmosphere with 5% CO2. Stimulation by the selective T‐cell mitogen phytohaemagglutinin (PHA; from Gibco, Grand Island, NY, USA) was performed in triplicates (100 ml/well) to yield an optimal concentration (1%). In non‐stimulated cultures (PHA 0), mitogen was substituted by complete culture medium. To assess in vitro sensitivity to GCs, 10−9−10−4 M of DEX (a synthetic GC receptor agonist) was added in duplicates (50 µl/well; water soluble, Sigma) to mitogen‐stimulated (PHA 1%) cultures. GC concentrations were used in a range so that free endogenous GCs during resting state would reach (10−9 m), stress (10−6 m) and under pharmacological treatment (10−5 m) in vivo.
Proliferative responses were estimated using a modified colourimetric assay that correlates with the number of viable cells (Mosmann 1983; Collaziol et al. 2002). In the last 4 h of culture, 100 µl of supernatant was gently discarded and 40 µl of freshly prepared MTT (3‐[4, 5‐dimethylthiazol‐2‐yl]‐2, 5 diphenyltetrazolium bromide) (Sigma) solution (5 mg/ml in sterile PBS) was added to each well. Cell cultures were incubated for 4 h at 37 °C in 5% CO2 atmosphere. After complete removal of the supernatant, 120 µl of dimethyl sulfoxide (Sigma) was added to each well. Optical density (OD) was determined using a Biorad enzyme‐linked immunosorbent assay plate reader at wavelengths of 492 and 630 nm. Spontaneous cell proliferation was determined by visual identification of several cellular clusters (light microscopy, 40×) in unstimulated cells following 96 h of culture. Proliferation data are presented as OD. Difference between the OD of stimulated and non‐stimulated cultures indicates the non‐specific T‐lymphocyte proliferation induced by PHA. Results of T‐lymphocyte sensitivity to GCs are presented as percentage proliferation, where 100% (basal) represents maximum proliferation, obtained by OD means from cell cultures of PHA 1% without steroids.
Steroid responsiveness
Glucocorticoid responders and non‐responders were identified through analysis of dose–response curves of control subjects. PBMCs of healthy control donors were cultured with PHA and DEX, as described in the previous section. The area under the curve (AUC) for each control subject was then calculated by the trapezoidal rule (prism 4.0, GraphPad Software), and the group median of the sample was determined (366.6 m). The same AUC determination was performed for each HTLV‐I/II patient individually. Patients with AUC higher than the median AUC from the control group (366.6 m) were classified as GC non‐responders, indicating that their dose–response curve to varied DEX concentrations maintained itself closer to basal proliferation (100%). Patients with an AUC lower than this value were considered to be sensitive to DEX in vitro, as their dose–response curve indicated lower proliferation percentages, and were thus classified as responders.
Statistical analysis
All variables were tested for homogeneity of variances and normality of distribution by means of the Levene and Kolmogorov‐Smirnov tests, respectively. Proliferation data were analysed by repeated measures anova that included one between‐subjects variables (groups) and one within‐subjects variables (mitogen or GC levels). One way anova was performed to analyse cell proliferation (non‐stimulated versus stimulated) data. Multiple comparisons among levels (mitogen or GC) were checked with Tukey's post hoc test. Differences between variables were assessed by Student's t‐test. Statistical interactions between group distributions were compared by means of chi‐squared (χ2) test. Data are expressed as mean ± SE in all figures. A statistical software package (spss 11.5, SPSS, Chicago, IL, USA) was used to perform the analyses. The significance level was set at α = 0.05 (two‐tailed).
RESULTS
Lymphocyte proliferation
Mitogen‐induced T‐cell proliferation was evaluated as an index of cell‐mediated immunity. Non‐stimulated cell proliferation was found to be marginally increased in HTLV‐I patients compared to HTLV‐II–infected individuals (t = 1.43, d.f. = 25.98, P = 0.17) and healthy control subjects (t = 1.79, d.f. = 25.42, P = 0.09), although it only approached statistical significance (Fig. 1). Stimulation with PHA yielded significant T‐cell proliferation in all groups. However, mitogen‐induced proliferative responses were found similar in both HTLV groups.
Figure 1.
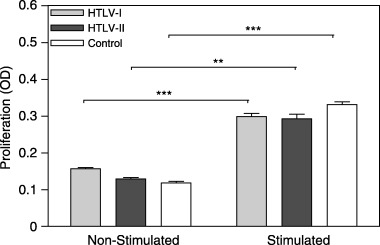
Evaluation of non‐stimulated and mitogen‐stimulated T‐cell proliferation (HTLV‐I: n = 18; HTLV‐II: n = 10; control: n = 11). PBMCs were cultured with and without 1% PHA for 96 h and cell proliferation/viability was estimated by MTT assay. OD was determined at wavelengths of 492 and 630 nm. Statistical significance differences are indicated: **P < 0.01; ***P < 0.001.
Spontaneous cell proliferation
We investigated the frequency of patients with spontaneous T‐lymphocyte proliferation. HTLV‐I/II patients presented similar proportions of subjects with spontaneous proliferation, 33.3% (six patients) with HTLV‐I and 10% (one patient) with HTLV‐II, respectively (χ2 = 1.87, d.f. = 1, P = 0.17). Spontaneous cell proliferation was confirmed by the presence of several cellular clusters in unstimulated cultures of HTLV‐I subjects (Fig. 2). We then assessed the extent cells to which patients who developed spontaneous T‐lymphocyte proliferation responded to mitogenic stimulation. Interestingly, it was observed that T cells with spontaneous proliferation were unresponsive to PHA stimulation (Fig. 3). This was similarly described for patients with HTLV‐I and ‐II infections. However, no statistical analysis could be performed within HTLV‐II subjects as only one patient presented spontaneous proliferation in that group (Fig. 2b).
Figure 2.
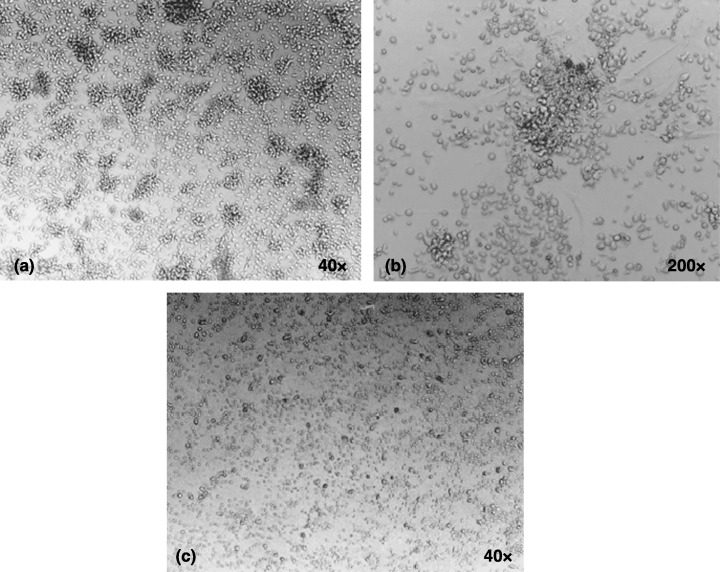
Spontaneous cell proliferation in HTLV‐I infection. Representative photographs of unstimulated cultures of two HTLV‐I patients. (a) Spontaneous cell proliferation as demonstrated by cellular clusters (40×) that can be seen magnified in (b) (200×). (c) Cells with a normal proliferation level.
Figure 3.
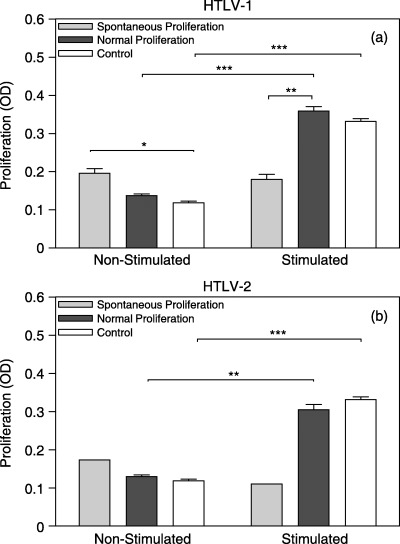
Evaluation of non‐stimulated and mitogen‐stimulated T‐cell proliferation in HTLV‐infected patients with normal and spontaneous proliferation levels. PBMCs were cultured with and without 1% PHA for 96 h and proliferation/viability was estimated by MTT assay. OD was determined at wavelengths of 492 and 630 nm (a) HTLV‐I–infected subjects (normal: n = 12; spontaneous: n = 6; control: n = 11); (b) HTLV‐II–infected subjects (normal: n = 9; spontaneous: n = 1; control: n = 11). Statistical significance differences are indicated: *P < 0.05; **P < 0.01; ***P < 0.001.
Lymphocyte sensitivity to GCs
In view of evidence that some patients with HTLV‐I/II infections respond poorly to GC treatment (Araujo et al. 1993; Nakagawa et al. 1996), we examined the peripheral T‐cell sensitivity to DEX, in vitro prior to treatment. DEX produced dose‐dependent suppression of T‐cell proliferation, (F 5,130 = 38.24, P < 0.001) (Fig. 4). However, T‐cell sensitivity to DEX did not differ between HTLV groups (F 1,26 = 0.60, P = 0.44).
Figure 4.
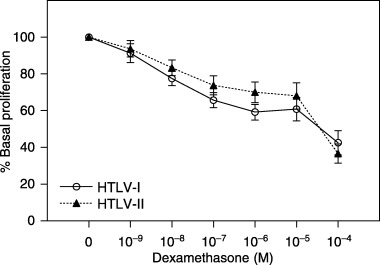
Peripheral T‐cell sensitivity to dexamethasone (HTLV‐I: n = 18; HTLV‐II: n = 10). Glucocorticoid sensitivity was assessed by incubating PBMCs with PHA 1% and increasing concentrations of DEX for 96 h. Cell proliferation was estimated by MTT assay. OD was determined at wavelengths of 492 and 630 nm. Data are shown as percentage of base line cell proliferation (100% = PHA 1% without steroids).
We also investigated the frequency of GC responders within HTLV groups. Eight HTLV‐I (44.4%, 42.38 ± 16.10 years, 5 women) and four HTLV‐II (40%, 43.25 ± 11.23 years, 2 women) patients were classified as GC non‐responders. There were no group differences in the frequency of GC responders/non‐responders (χ2 = 0.05, d.f. = 1, P = 0.82). However, GC non‐responders (in both HTLV groups) were similarly more resistant to DEX in vitro than cells of GC responders (Fig. 5).
Figure 5.
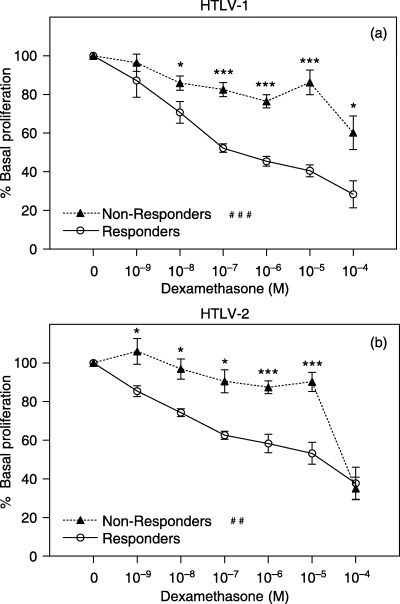
Peripheral T‐cell sensitivity to DEX in responders/non‐responders, HTLV‐infected patients. Glucocorticoid sensitivity was assessed by incubating PBMCs with PHA 1% and increasing concentrations of DEX for 96 h. Cell proliferation was estimated by MTT assay. OD was determined at wavelengths of 492 and 630 nm. Data are shown as percentage of base line cell proliferation (100% = PHA 1% without steroids). (a) HTLV‐I–infected subjects (responders: n = 10; non‐responders: n = 8); (b) HTLV‐II–infected subjects (responders: n = 6; non‐responders: n = 4). Statistical significance differences in T‐cell sensitivity to isolated DEX concentrations are indicated: *P < 0.05, **P < 0.01; ***P < 0.001. Statistical interaction of T‐cell sensitivity to variation of DEX concentrations between groups indicated: ##P < 0.01; ###P < 0.001.
Finally, we assessed whether spontaneous cell proliferation is associated with T‐cell sensitivity to GCs. Interestingly, it was observed that T cells of HTLV‐I patients with spontaneous cell proliferation were significantly more resistant to DEX than cells of patients with normal proliferation levels (Fig. 6a) (F 1,16 = 6.4, P < 0.05). No statistical analysis could be performed within HTLV‐II subjects because only one patient presented spontaneous proliferation in that group (Fig. 6b).
Figure 6.
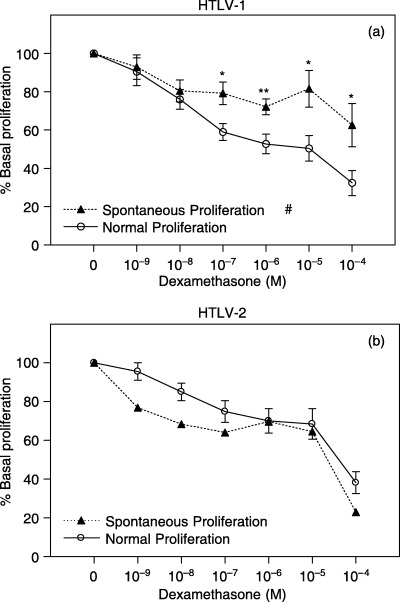
Peripheral T‐cell sensitivity to DEX in HTLV patients with spontaneous/normal cell proliferation. Glucocorticoid sensitivity was assessed by incubating PBMCs with PHA 1% and increasing concentrations of DEX for 96 h. Cell proliferation was estimated by MTT assay. OD was determined at wavelengths of 492 and 630 nm. Data are shown as percentage of base line cell proliferation (100% = PHA 1% without steroids). (a) HTLV‐I–infected subjects (normal: n = 12; spontaneous: n = 6); (b) HTLV‐II–infected subjects (normal: n = 9; spontaneous: n = 1). Statistical significance differences in T‐cell sensitivity to isolated DEX concentrations are indicated: *P < 0.05; **P = 0.01. Statistical inter‐action of T‐cell sensitivity to variation of DEX concentrations between groups indicated: #P < 0.05.
DISCUSSION
Human T‐cell lymphotropic virus infections are known to induce the appearance of inflammatory diseases by activating T lymphocytes and inducing spontaneous cell proliferation (Itoyama et al. 1988; Prince et al. 1990; Wiktor et al. 1991; Prince & Swanson 1993; Mann et al. 1994; Prince et al. 1994). HTLV‐I has more disease associations then HTLV‐II and is known to cause ATL/L (Uchiyama et al. 1977; Blattner et al. 1983; Uchiyama 1988) and HAM/TSP (Gessain et al. 1985; Osame et al. 1987). However, HTLV‐II infections may also lead to neuropathological states (Hjelle et al. 1992; Menna‐Barreto 2003; Orland et al. 2003).
Because of its ability to mediate the appearance of diseases with severe prognosis, such as ATL/L and HAM/TSP, we initially anticipated that HTLV‐I–infected lymphocytes would proliferate more intensively than HTLV‐II–infected cells. However, T‐cell proliferation was found to be similar in both groups of infected patients (Fig. 1). These results suggest that the capacity of HTLV‐I virus to induce a greater number of inflammatory diseases than HTLV‐II may not necessarily be associated with a greater peripheral T‐cell response.
As previously reported (Itoyama et al. 1988; Prince et al. 1990; Wiktor et al. 1991; Prince & Swanson 1993; Mann et al. 1994; Prince et al. 1994), we also have observed a significant proportion of subjects with spontaneous T‐cell proliferation within both HTLV‐I– (33.3%, n = 6) and HTLV‐II–infected (10%, n = 1) patients. Here we have investigated to what extent the cells of patients with spontaneous T‐cell proliferation would respond to mitogenic stimulation. It was observed for the first time that T cells of patients with spontaneous proliferation were completely unresponsive to PHA stimulation. These results suggest that HTLV‐infected T lymphocytes that had become activated and proliferate as a result of the viral infection do not respond to unspecific activation. Indeed, it has been shown previously that spontaneous cell proliferation is associated with increased proviral load (Prince & Swanson 1993); this clinical parameter was not assessed here. Further studies should investigate whether mitogen unresponsiveness would be related to proviral load. It is reasonable to speculate that these patients would be more susceptible to other infectious diseases, which are under control of effective T‐cell responses. The underlying mechanisms of this mitogenic unresponsiveness are still completely obscure.
Treatment of HTLV infections usually involves the administration of anti‐inflammatory drugs such as synthetic GCs. However, some HTLV patients respond poorly to this treatment (Araujo et al. 1993) and concomitant therapy with other immunosuppressive drugs is often required (Nakagawa et al. 1996). In this study, patients with HTLV‐I/II showed comparable T‐cell sensitivity to DEX in vitro and similar frequency of GC responders versus non‐responders. We speculate that clinical resistance to treatment with these steroids may be limited to the peripheral inflamed tissues. Interestingly, we observed for the first time that T lymphocytes from HTLV‐I patients showing spontaneous cell proliferation were significantly more resistant to DEX than cells from patients with normal proliferation. These results differ from a previous study (Yamano et al. 1997) in which PBMCs from HAM/TSP patients with spontaneous proliferation were highly sensitive to prednisolone's modulatory effects (reduced proliferation and altered cytokine production). However, there are methodological differences between our and Yamano's work that may justify this discrepancy. For example, we evaluated the ability of DEX to suppress T‐cell proliferation to assess steroid sensitivity of activated lymphocytes, whereas Yamano and colleagues analysed the steroid sensitivity of non‐stimulated PBMCs. Therefore, it remains difficult to discern precisely the cellular targets that respond to steroids in the former study. The cellular activation state is of paramount importance to steroid sensitivity.
No interaction between cellular spontaneous/normal proliferation and GC sensitivity was observed within HTLV‐II. However, this evaluation was compromised because only one subject from the evaluated group of HTLV‐II–infected patients presented spontaneous proliferation in vitro.
Taken together, these data indicate that poor clinical response to steroid treatment may be related to spontaneous cell proliferation during HTLV infection, especially HTLV‐I. We confirm our main hypothesis and speculate that spontaneous cell proliferation would render lymphocytes resistant to both mitogenic and steroid signalling, as a result of repeated polyclonal T‐cell infections. These chronic infections may lead to clonal exhaustion and further disease vulnerability in HTLV‐infected people. Thus, the identification of HTLV‐infected patients with spontaneous cell proliferation will be of clinical value.
REFERENCES
- Alcantara LC, Shindo N, Van Dooren S, Salemi M, Costa MC, Kashima S, Covas DT, Vandamme AM, Galvao‐Castro B (2003) Brazilian HTLV type 2a strains from intravenous drug users (IDUs) appear to have originated from two sources: Brazilian Amerindians and European/North American IDUs. AIDS Res. Hum. Retroviruses 19, 519–523. [DOI] [PubMed] [Google Scholar]
- Araujo AQ, Afonso CR, Leite AC, Dultra SV (1993) Intravenous methylprednisolone in HTLV‐I associated myelopathy/tropical spastic paraparesis (HAM/TSP). Arq. Neuropsiquiatr. 51, 325–328. [DOI] [PubMed] [Google Scholar]
- Bhigjee AI, Wiley CA, Wachsman W, Amenomori T, Pirie D, Bill PL, Windsor I (1991) HTLV‐I‐associated myelopathy: clinicopathologic correlation with localization of provirus to spinal cord. Neurology 41, 1990–1992. [DOI] [PubMed] [Google Scholar]
- Blattner WA, Blayney DW, Robert‐Guroff M, Sarngadharan MG, Kalyanaraman VS, Sarin PS, Jaffe ES, Gallo RC (1983) Epidemiology of human T‐cell leukemia/lymphoma virus. J. Infect. Dis. 147, 406–416. [DOI] [PubMed] [Google Scholar]
- Cartier LM, Cea JG, Vergara C, Araya F, Born P (1997) Clinical and neuropathological study of six patients with spastic paraparesis associated with HTLV‐I: an axomyelinic degeneration of the central nervous system. J. Neuropathol. Exp. Neurol. 56, 403–413. [DOI] [PubMed] [Google Scholar]
- Collaziol D, Preissler T, Bauer M (2002) Avaliação da proliferação linfocitária e sensibilidade a glicocorticóides por ensaios colorimétricos. Rev. Med. PUC/RS 12, 226–231. [Google Scholar]
- Franchini G (1995) Molecular mechanisms of human T‐cell leukemia/lymphotropic virus type I infection. Blood 86, 3619–3639. [PubMed] [Google Scholar]
- Gessain A, Gout O (1992) Chronic myelopathy associated with human T‐lymphotropic virus type I (HTLV‐I). Ann. Intern. Med. 117, 933–946. [DOI] [PubMed] [Google Scholar]
- Gessain A, Barin F, Vernant JC, Gout O, Maurs L, Calender A, De The G (1985) Antibodies to human T‐lymphotropic virus type‐I in patients with tropical spastic paraparesis. Lancet 2, 407–410. [DOI] [PubMed] [Google Scholar]
- Goubau P, Liu HF, De Lange GG, Vandamme AM, Desmyter J (1993) HTLV‐II seroprevalence in pygmies across Africa since 1970. AIDS Res. Hum. Retroviruses 9, 709–713. [DOI] [PubMed] [Google Scholar]
- Heneine W, Kaplan JE, Gracia F, Lal R, Roberts B, Levine PH, Reeves WC (1991) HTLV‐II endemicity among Guaymi Indians in Panama. N. Engl. J. Med. 324, 565. [DOI] [PubMed] [Google Scholar]
- Hjelle B, Appenzeller O, Mills R, Alexander S, Torrez‐Martinez N, Jahnke R, Ross G (1992) Chronic neurodegenerative disease associated with HTLV‐II infection. Lancet 339, 645–646. [DOI] [PubMed] [Google Scholar]
- Hjelle B, Zhu SW, Takahashi H, Ijichi S, Hall WW (1993) Endemic human T cell leukemia virus type II infection in southwestern US Indians involves two prototype variants of virus. J. Infect. Dis. 168, 737–740. [DOI] [PubMed] [Google Scholar]
- Hollsberg P (1997) Pathogenesis of chronic progressive myelopathy associated with human T‐cell lymphotropic virus type I. Acta Neurol. Scand. Suppl. 169, 86–93. [DOI] [PubMed] [Google Scholar]
- Ijichi S, Eiraku N, Osame M, Izumo S, Kubota R, Maruyama I, Matsumoto M, Niimura T, Sonoda S (1989) Activated T lymphocytes in cerebrospinal fluid of patients with HTLV‐I‐associated myelopathy (HAM/TSP). J. Neuroimmunol. 25, 251–254. [DOI] [PubMed] [Google Scholar]
- Itoyama Y, Minato S, Kira J, Goto I, Sato H, Okochi K, Yamamoto N (1988) Spontaneous proliferation of peripheral blood lymphocytes increased in patients with HTLV‐I‐associated myelopathy. Neurology 38, 1302–1307. [DOI] [PubMed] [Google Scholar]
- Iwasaki Y (1990) Pathology of chronic myelopathy associated with HTLV‐I infection (HAM/TSP). J. Neurol. Sci. 96, 103–123. [DOI] [PubMed] [Google Scholar]
- Juruena MF, Cleare AJ, Bauer ME, Pariante CM (2003) Molecular mechanisms of glucocorticoid receptor sensitivity and relevance to affective disorders. Acta Neuropsychiatr. 15, 354–367. [DOI] [PubMed] [Google Scholar]
- Khabbaz RF, Hartel D, Lairmore M, Horsburgh CR, Schoenbaum EE, Roberts B, Hartley TM, Friedland G (1991) Human T lymphotropic virus type II (HTLV‐II) infection in a cohort of New York intravenous drug users: an old infection? J. Infect. Dis. 163, 252–256. [DOI] [PubMed] [Google Scholar]
- Maloney EM, Biggar RJ, Neel JV, Taylor ME, Hahn BH, Shaw GM, Blattner WA (1992) Endemic human T cell lymphotropic virus type II infection among isolated Brazilian Amerindians. J. Infect. Dis. 166, 100–107. [DOI] [PubMed] [Google Scholar]
- Mann DL, Martin P, Hamlin‐Green G, Nalewaik R, Blattner W (1994) Virus production and spontaneous cell proliferation in HTLV‐I‐infected lymphocytes. Clin. Immunol. Immunopathol. 72, 312–320. [DOI] [PubMed] [Google Scholar]
- Matsushita K, Arima N, Ohtsubo H, Fujiwara H, Arimura K, Kukita T, Ozaki A, Hidaka S, Matsumoto T, Tei C (2002) Poor response to prednisolone of idiopathic thrombocytopenia with human T‐lymphotropic virus type I infection. Am. J. Hematol. 71, 20–23. [DOI] [PubMed] [Google Scholar]
- Menna‐Barreto M (2003) A 96‐month longitudinal study of HTLV‐II‐associated myelopathy. AIDS Res. Hum. Retroviruses 19, S14. [Google Scholar]
- Mosmann T (1983) Rapid colorimetric assay for cellular growth and survival: application to proliferation and cytotoxicity assays. J. Immunol. Meth. 65, 55–63. [DOI] [PubMed] [Google Scholar]
- Murphy EL, Blattner WA (1988) HTLV‐I‐associated leukemia: a model for chronic retroviral diseases. Ann. Neurol. 23 (Suppl.), S174–S180. [DOI] [PubMed] [Google Scholar]
- Nakagawa M, Nakahara K, Maruyama Y, Kawabata M, Higuchi I, Kubota H, Izumo S, Arimura K, Osame M (1996) Therapeutic trials in 200 patients with HTLV‐I‐associated myelopathy/tropical spastic paraparesis. J. Neurovirol. 2, 345–355. [DOI] [PubMed] [Google Scholar]
- Orland JR, Engstrom J, Fridey J, Sacher RA, Smith JW, Nass C, Garratty G, Newman B, Smith D, Wang B, Loughlin K, Murphy EL (2003) Prevalence and clinical features of HTLV neurologic disease in the HTLV Outcomes Study. Neurology 61, 1588–1594. [DOI] [PubMed] [Google Scholar]
- Osame M, Matsumoto M, Usuku K, Izumo S, Ijichi N, Amitani H, Tara M, Igata A (1987) Chronic progressive myelopathy associated with elevated antibodies to human T‐lymphotropic virus type I and adult T‐cell leukemia‐like cells. Ann. Neurol. 21, 117–122. [DOI] [PubMed] [Google Scholar]
- Osame M, Usuku K, Izumo S, Ijichi N, Amitani H, Igata A, Matsumoto M, Tara M (1986) HTLV‐I associated myelopathy, a new clinical entity. Lancet 1, 1031–1032. [DOI] [PubMed] [Google Scholar]
- Piccardo P, Ceroni M, Rodgers‐Johnson P, Mora C, Asher DM, Char G, Gibbs CJ Jr, Gajdusek DC (1988) Pathological and immunological observations on tropical spastic paraparesis in patients from Jamaica. Ann. Neurol. 23 (Suppl.), S156–S160. [DOI] [PubMed] [Google Scholar]
- Poiesz BJ, Ruscetti FW, Gazdar AF, Bunn PA, Minna JD, Gallo RC (1980) Detection and isolation of type C retrovirus particles from fresh and cultured lymphocytes of a patient with cutaneous T‐cell lymphoma. Proc. Natl. Acad. Sci. USA 77, 7415–7419. [DOI] [PMC free article] [PubMed] [Google Scholar]
- Prince HE, Golding J, York J (1994) Lymphocyte subset alterations associated with increased spontaneous lymphocyte proliferation in human T lymphotropic virus (HTLV) infection: distinctive patterns for HTLV‐I versus HTLV‐II infection. J. Infect. Dis. 169, 1409–1410. [DOI] [PubMed] [Google Scholar]
- Prince H, Kleinman S, Doyle M, Lee H, Swanson P (1990) Spontaneous lymphocyte proliferation in vitro characterizes both HTLV‐I and HTLV‐II infection. J. Acquir. Immune. Defic. Syndr. 3, 1199–1200. [PubMed] [Google Scholar]
- Prince HE, Swanson P (1993) Spontaneous lymphocyte proliferation in human T lymphotropic virus type II infection is associated with increased provirus load. J. Infect. Dis. 168, 1599–1600. [DOI] [PubMed] [Google Scholar]
- Uchiyama T (1988) Adult T‐cell leukemia. Blood Rev. 2, 232–238. [DOI] [PubMed] [Google Scholar]
- Uchiyama T, Yodoi J, Sagawa K, Takatsuki K, Uchino H (1977) Adult T‐cell leukemia: clinical and hematologic features of 16 cases. Blood 50, 481–492. [PubMed] [Google Scholar]
- Umehara F, Abe M, Koreeda Y, Izumo S, Osame M (2000) Axonal damage revealed by accumulation of beta‐amyloid precursor protein in HTLV‐I‐associated myelopathy. J. Neurol. Sci. 176, 95–101. [DOI] [PubMed] [Google Scholar]
- Wiktor SZ, Jacobson S, Weiss SH, Shaw GM, Reuben JS, Shorty VJ, McFarlin DE, Blattner WA (1991) Spontaneous lymphocyte proliferation in HTLV‐II infection. Lancet 337, 327–328. [DOI] [PubMed] [Google Scholar]
- Yamano Y, Machigashira K, Ijichi S, Usuku K, Kawabata M, Arimura K, Osame M (1997) Alteration of cytokine levels by fosfomycin and prednisolone in spontaneous proliferation of cultured lymphocytes from patients with HTLV‐I‐associated myelopathy (HAM/TSP). J. Neurol. Sci. 151, 163. [DOI] [PubMed] [Google Scholar]
- Zanetti AR, Galli C (1992) Seroprevalence of HTLV‐I and HTLV‐II. N. Engl. J. Med. 326, 1783–1784. [PubMed] [Google Scholar]