

Abstract
Abstract. Mathematical modelling forms a key component of systems biology, offering insights that complement and stimulate experimental studies. In this review, we illustrate the role of theoretical models in elucidating the mechanisms involved in normal intestinal crypt dynamics and colorectal cancer. We discuss a range of modelling approaches, including models that describe cell proliferation, migration, differentiation, crypt fission, genetic instability, APC inactivation and tumour heterogeneity. We focus on the model assumptions, limitations and applications, rather than on the technical details. We also present a new stochastic model for stem‐cell dynamics, which predicts that, on average, APC inactivation occurs more quickly in the stem‐cell pool in the absence of symmetric cell division. This suggests that natural niche succession may protect stem cells against malignant transformation in the gut. Finally, we explain how we aim to gain further understanding of the crypt system and of colorectal carcinogenesis with the aid of multiscale models that cover all levels of organization from the molecular to the whole organ.
INTRODUCTION
According to the World Health Organization, large‐bowel cancer ranks second in terms of both incidence and mortality in developed countries (Steward & Kleihues 2003). For example, 35 300 new cases of colorectal cancer were diagnosed in 2000 and 16 220 patients died of the disease in 2002 in the UK alone (Statistics from Cancer Research UK: http://www.cancerresearchuk.org/aboutcancer/statistics/factsheets/). Given its impact on the general population, it is not surprising that colorectal cancer (CRC) is one of the most intensively studied types of human neoplasm and the first for which a detailed genetic model has been proposed (Fearon & Vogelstein 1990; Kinzler & Vogelstein 1996).
From an early stage, mathematics has played an important role in enhancing our understanding of CRC. Armitage & Doll (1954) formulated a model to explain the experimental observation that a log‐log plot of the cancer incidence rate against age yielded a straight line. Agreeing with Nordling (1953), they assumed that b successive mutations in a single cell were required for malignant transformation. The Armitage–Doll model predicted b ≈ 6 and b ≈ 7 for the colon and rectum, respectively. It was rightly concluded that CRC is a multistage process. Moreover, this unexpectedly high number of predicted genetic alterations motivated the authors to extend their model to accommodate cell proliferation (Armitage & Doll 1957), which revealed the importance of clonal expansion in tumorigenesis.
The Armitage–Doll model illustrates the type of insight that even simple models can provide for experimentalists. The aim of this article is to present a succinct and critical discussion of recent attempts to model normal and aberrant intestinal mucosa. The overview focuses on the aspects of normal and aberrant crypt dynamics that have been addressed using mathematical modelling; the assumptions that underpin the models; and the extent to which theoretical work has helped to elucidate the mechanisms that underlie crypt dynamics and CRC. For the technical details of the models we review, the reader is referred to the original papers.
A plethora of review articles exist that cover different aspects of CRC, such as epidemiology (Potter 1999; Järvinen et al. 2001), hereditary syndromes (Kinzler & Vogelstein 1996; De la Chapelle 2004), molecular pathways (Bienz & Clevers 2000; Fodde 2001) and CRC treatment (Waters & Cunningham 2001; Kerr 2003; Venook 2005). In addition, a number of reviews deal with mathematical modelling of cancer without focusing on any particular cancer type (Adam & Bellomo 1997; Van Leeuwen & Zonneveld 2001; Araujo & McElwain 2004; Ambrosi et al. 2005). We believe this to be the first article to provide a combined review of the relevant experimental and theoretical literature on CRC. After reviewing the state of the art in modelling crypt dynamics and CRC, we explain why we believe that an integrative approach capable of combining molecular, cellular, histological and clinical data will be crucial in advancing further our understanding of CRC and ensuring that optimal treatments are administered on a patient‐specific basis.
NORMAL MUCOSA
Most bowel cancers originate from the single‐layered columnar epithelium that covers the luminal surface of the intestinal tract (Hodgson & Maher 1999). This epithelium renews itself rapidly [every 5–6 days in humans (Ross et al. 2003) and 2–3 days in mice (Okamoto & Watanabe 2004)] by a coordinated programme of cell proliferation, migration and differentiation events that is initiated in the crypts of Lieberkühn (see Fig. 1) (Bach et al. 2000; Marshman et al. 2002). It is generally believed that tumorigenesis occurs as a consequence of changes that disrupt normal crypt dynamics (Renehan et al. 2002). Identifying the mechanisms that govern crypt dynamics is therefore essential to understanding the origins of CRC.
Figure 1.
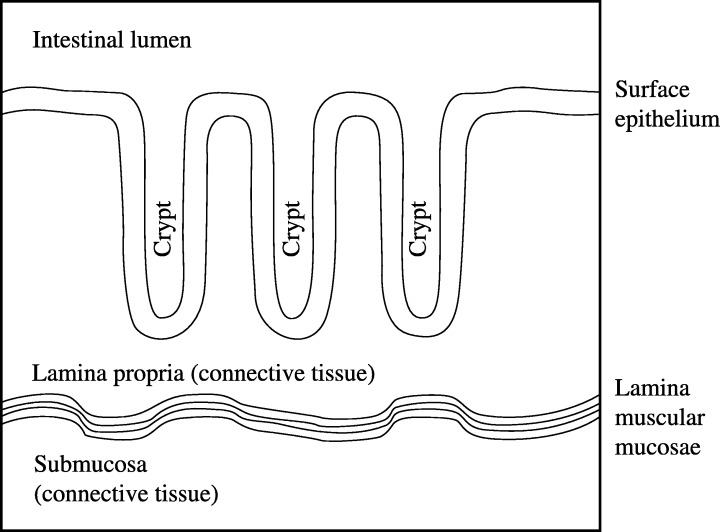
Morphology of the normal murine colonic mucosa. The mucosa presents numerous invaginations (crypts of Lieberkühn). The crypts are usually non‐branching, tightly packed cylindrical tubes which are evenly distributed and parallel. Each crypt contains about 235–250 cells (Potten & Loeffler 1990; Meineke et al. 2001): 20–25 cells per side in a vertical cross section (Loeffler et al. 1988) and 16–18 around the circumference in a horizontal one (Bach et al. 2000; Meineke et al. 2001). The mucosa has three components as follows. (1) Single‐layered epithelium that covers the luminal surface and lines the crypts. Over 95% of colorectal cancers originate here (Hodgson & Maher 1999). This surface epithelium, which resides on a basement membrane (or basal lamina), is composed mainly of absorptive columnar cells and mucous‐producing Goblet cells and, thanks to tight junctions between cells, it constitutes a continuous selective barrier. (2) Lamina muscularis mucosae, a smooth muscle barrier that separates the mucosa from the submucosa underneath. Contraction of this muscle layer affects the mucosa's secretion and absorption functions. (3) Lamina propria, connective tissue that fills the space between the surface epithelium and the lamina muscularis mucosae. It includes lymphatic tissue and blood vessels.
Most data on the tissue renewal cycle come from experimental studies on the murine small intestine. Whereas the mucosa of the small intestine is characterized by the presence of villi, the inner surface of the large intestine is quite smooth, with a moon‐like appearance containing many pits. Moreover, Paneth cells, which inhabit the bottom of the crypts in the small intestine, are absent from most of the large bowel. In spite of these differences, it is believed that many of the mechanisms that underlie the normal renewal process of the surface epithelium are common to both sections of the bowel. Various mathematical models have been developed to test hypotheses concerning the renewal process. To facilitate our discussion of these models, while outlining the essential concepts and notation, we shall first introduce a few basic assumptions shared by most models. A summary of the notation we use is provided in the Appendix.
The basic architecture of a crypt consists of Paneth cells, proliferative cells and fully differentiated cells, organized hierarchically from the bottom of the crypt upwards to the orifice on the luminal surface. Paneth cells and mature cells do not divide. Pluripotential epithelial stem cells are invariably assumed to reside either between the Paneth cells and the proliferative transit cells in the small intestine (e.g. Loeffler et al. 1988; Paulus et al. 1993; Meineke et al. 2001) or at the bottom of the crypt where Paneth cells are absent (Yatabe et al. 2001). Additional support for this assumption comes from studies involving Musashi‐1, an RNA‐binding protein that is thought to be a mammalian neural stem cell marker: expression of Musashi‐1 has been observed only at the expected stem cell positions (Kayahara et al. 2003). Despite the central role of the stem cells in maintaining the integrity of the intestinal epithelium, their precise number and location within the crypt remain unclear.
For the murine small intestine, a number of stem cells ranging from one to about 16 per crypt has been proposed (Winton & Ponder 1990; Roberts et al. 1995; Marshman et al. 2002). Potten et al. (2003) have recently concluded that there are probably 4–6 stem cells and about six generations of transit cells in each murine crypt. Figure 2 shows the average size of the proliferative pool (stem cells and transit cells) and the number of cells shed into the lumen per day (α) predicted for a crypt with N S stem cells and n transit generations by a simple discrete model. We have considered only values of N S less than or equal to 20, because larger values imply that the stem and transit populations occupy an unrealistically large proportion of a 250‐cell crypt. To perform the simulations, we have assumed that all cells undergo mitosis synchronously as follows: stem cells divide asymmetrically, giving one stem cell and one first‐generation transit cell, whereas transit cells divide symmetrically, giving two next generation transit cells. Moreover, we assume that the cycle times for stem and transit cells are t CS = 24 h (Potten et al. 2003) and t CT = 12 h (Meineke et al. 2001), respectively. As can be seen from Fig. 2, various pairs of N S and n values provide outcomes in agreement with the observations that at any time about 150–160 cells are proliferating within the crypt and that about 300 cells leave the orifice per day (Potten & Loeffler 1990). Further information is thus necessary to discriminate amongst such pairs.
Figure 2.
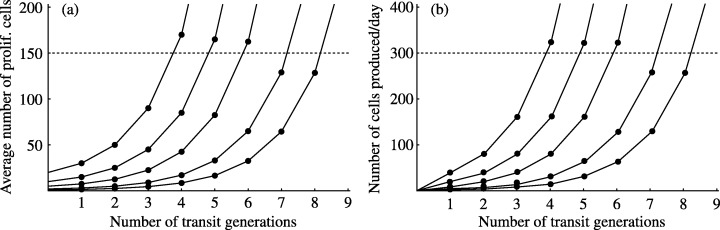
Cell numbers in the murine small intestinal crypt. In both panels, reading from right to left, the five curves correspond to crypts with N S = 1, 2, 5, 10 and 20 stem cells, respectively. The model outcome points (•) have been joined to distinguish the model runs. All cells in the crypt are assumed to divide synchronously. We used a non‐stochastic model: stem cells and transit cells always divide asymmetrically and symmetrically, respectively. We assumed that the cycle times for stem and transit cells are t CS = 24 h (Potten et al. 2003) and t CT = 12 h (Meineke et al. 2001), respectively. (a) Average number of proliferative cells (stem cells plus transit cells) as a function of the number of transit generations (n). For n = 0, the number of proliferative cells is equal to N S . The dashed line corresponds to 150 cells. Division of an nth generation transit cell produces two differentiated cells. (b) Number of fully differentiated cells produced per day (α) as a function of n. The dashed line corresponds to α = 300 cells per day.
Stochasticity is another common feature of models of normal crypt dynamics. Loeffler et al. (1986) added random variation to the cell cycle times, assuming, for example, that the stem‐cell cycle time varies around its average t CS = 16 h with a maximum deviation of 4 h. By contrast, Loeffler et al. (1993) viewed the results of stem‐cell division as a stochastic process, assuming that when one divides it produces 0, 1 or 2 stem cells with probabilities q S, r S and p S = 1 –q S–r S, respectively. As r S represents the probability that a stem cell divides asymmetrically into one stem cell and one first generation transit cell, if r S = 1 the size of the stem cell population remains constant. By contrast, if 0 ≤r S < 1, the number of stem cells fluctuates over time. In particular, if r S < 1 and q S > p S, then the crypt has an increased probability of suffering a net loss of stem cells and, consequently, to eventually die off. To ensure that N S fluctuates, while keeping the average size of the stem cell population approximately constant over time, it is assumed that, under normal conditions, 0 ≤p S = q S << r S≤ 1. Yatabe et al. (2001), alternatively, restrict stochastic stem cell division by assuming that N S remains constant, which implies that stem cells do not divide independently of each other. In reality, natural feedback loops within the crypt system may ensure that, for example, a reduction in N S following exposure to radiation or toxic compounds stimulates an increase in p S.
The selection of models discussed in this section is organized as follows. We concentrate first on models that view the crypt as a rigid two‐dimensional grid and then examine more flexible models, namely lattice‐free approaches, stochastic methylation studies and compartmental models. The 2D‐grid and lattice‐free models differ significantly from the other approaches in that they specify the position of individual cells. We shall therefore refer to them collectively as spatial models.
2D‐grid approaches
As adult murine crypts contain small numbers of cells about 235–250 cells per crypt (Potten & Loeffler 1990; Meineke et al. 2001), several models have focused on the behaviour of individual cells within the crypt. The cylindrical crypt is opened and rolled out and then mapped onto a rectangular grid. Each cell is characterized by its position on the grid and various model‐specific parameters. When new cells are inserted into the grid according to specific rules, this leads to cell displacements. Two‐dimensional grid models of this type have been developed by Potten and colleagues and used to study features that include cell migration (1988, 1986) and goblet‐cell differentiation (Paulus et al. 1993).
With regard to epithelial cell migration, mechanisms that have been proposed by experimentalists include basement membrane flow, mitotic pressure and active movement (see Health 1996). Experimental observations reveal that cells produced at the bottom of the crypt move upwards with increasing velocity (Booth et al. 2002), reaching a rate of 0.7–1 positions per hour at the top of the crypt (Loeffler et al. 1986; Potten & Loeffler 1990; Paulus et al. 1993). It has also been shown that cells produced by a given crypt climb the villus in almost vertical lines, giving rise to a continuous sheet (Schmidt et al. 1985). Some lateral movement may also occur, but this has not yet been quantified.
The basement membrane flow hypothesis is usually rejected because the structure of the basal lamina seems too weak to pull the epithelium and, more importantly, because no movement of the lamina has ever been detected (Trier et al. 1990). Nevertheless, the basement membrane may passively influence cell movement. Its chemical composition varies along the crypt‐villus axis (Turck et al. 2005), which may result in a position‐dependent friction intensity or extracellular signals affecting the adhesion and migration of epithelial cells. Passive migration as a result of mitotic pressure initiated at the bottom of the crypt is the most generally accepted theory, as migration and proliferation clearly take place in perfect harmony. This theory alone, however, cannot explain the continuation of migration after inhibition of mitotic activity (Kaur & Potten 1986; Loeffler et al. 1988). Finally, the presence of expression gradients of both EphB and ephrin‐B along the crypt axis (Fig. 3) points to active migration (Battle et al. 2002). This receptor‐ligand system controls cell shape, migration and adhesion through remodelling of the actin cytoskeleton. These observations suggest that no single mechanism is solely responsible for cell migration in the gastrointestinal tract.
Figure 3.
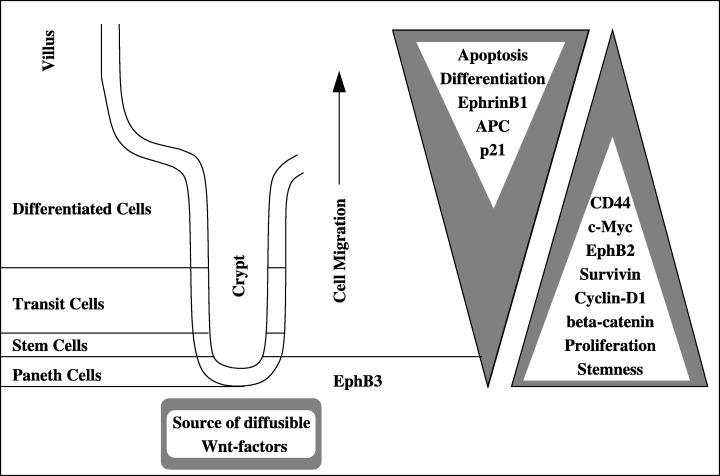
Schematic showing cell differentiation and protein expression gradients along the crypt‐villus axis. Expression of the EphB/ephrin system is controlled by the level of free β‐catenin, which is regulated by the Wnt‐signalling pathway. The presence of extracellular Wnt‐factors, which inhibits the degradation of β‐catenin, leads to changes in expression of numerous genes, including the up‐regulation of c‐myc, EphB2, cyclin‐D1, CD44 and survivin and the down‐regulation of ephrin‐B1 (for a full list of target genes, see http://www.standford.edu/rnusse/pathways/targets.html). The expression of EphB3 is restricted to the bottom of the crypts (Battle et al. 2002). The APC gene, which plays a central role in Wnt‐signalling as part of the complex that degrades β‐catenin, presents an inverse expression gradient along the crypt‐villus axis (Gaspar & Fodde 2004). The origin of this APC‐expression gradient as well as the location of the Wnt source remain unclear. For further details, see also the Aberrant Mucosa section (Subcellular Level).
1988, 1986) have analysed cell movement patterns associated with eight possible insertion rules for newborn cells. They were able to reject five of eight proposed rules by comparing model predictions with dynamic data from tritiated thymidine labelling experiments. Two types of measurement were taken at a series of times after labelling: mitotic labelling indices (LI), consisting of the percentage of labelled cells as a function of crypt row, and vertical‐run numbers (RUN), consisting of the number of labelled cell‐sequences per crypt column. The latter was expressed as a frequency distribution of the number of RUNs. For a particular choice of parameter values, age‐dependent insertion rules, in which a newly formed daughter cell is positioned below the oldest cell within a pre‐defined neighbourhood, fitted both the LI and RUN data well. In contrast, a rule allowing only vertical insertions (a daughter cell is always inserted above the mother cell) failed to predict the change in the RUN distribution over time, indicating that lateral insertions are likely to take place in the crypt. The authors concluded that the extent of lateral insertions is high (42–80%). Random insertion of daughter cells, in which any position within a pre‐defined neighbourhood has an equal probability of accommodating the daughter cell, produced LI tails that were too long as a function of crypt row. However, this model succeeded in predicting both LI and RUN data when it was assumed that cells mature on reaching a certain crypt row. This result illustrates the possible impact of extracellular effects on crypt dynamics.
Although three of the cell movement patterns considered by 1988, 1986) reproduced their LI and RUN data, these models predict that migration will stop in the absence of cell proliferation, which contradicts the experimental observations. To explain continued cell migration after inhibition of mitosis, Loeffler et al. (1988) proposed a novel scenario in which cell movement results from mitotic pressure and elastic external forces that tend to contract the crypt's circumference. In the absence of mitosis, ‘the contracting forces become overwhelming and lead to a merging of columns … This merging process would … be connected to vertical displacement.’ They do not, however, formulate any hypothesis concerning the origin of the external forces nor do they explore their effects theoretically.
The intestinal epithelium is mainly composed of absorptive columnar cells and mucous‐producing goblet cells. The abundance of goblet cells varies significantly along the intestine. For example, over most of the luminal surface of the human colon they are far less common than columnar cells, but the percentages of the two cell types become almost equal in the rectum (Ross et al. 2003). Moreover, in any given section of the small intestine, the concentration of goblet cells varies along the crypt‐villus axis (Paulus et al. 1993). The concentration is highest in the midcrypt region, from where it decreases towards the orifice, only to increase again on the villus surface. The reason for this differential distribution remains a mystery.
Paulus et al. (1993) extended the model developed by Loeffler et al. (1986) to account for goblet cell maturation. Their model consists of a 16 × 24 grid, with four stem cells and up to six transit generations. It also includes the stochastic variation in cell cycle times described above. The goblet cell lineage is incorporated by giving each newly formed fourth‐generation transit cell a 5% chance to acquire goblet properties. That goblet and columnar cells arise from a common ancestor was proven 6 years after the theoretical model was published (Bjerknes & Cheng 1999). This example highlights the way in which hypothesis generation involved in mathematical modelling can stimulate new experiments and enhance understanding of crypt dynamics. According to Paulus et al.'s (1993) model, once goblet cell differentiation has begun, the cell remains able to divide as many times as partially differentiated columnar cells of the same age. The authors confronted their 2D‐grid model with experimental data on goblet cell frequency along the crypt axis, on the clustering of goblet cells and on goblet cell LIs. The model simulations were in good agreement with the goblet cell frequency in the lower half of the crypt and with the LI data at the top of the crypt. The model failed to predict a decline in goblet cell frequency towards the top of the crypt, however. It also predicted too high a frequency of single goblet cells relative to clusters. According to the authors, these discrepancies were due to the choice of goblet cell kinetic parameters.
The models presented above characterize the crypt as a rigid 2D‐grid. As such, they rely upon a number of unrealistic simplifications, such as: (i) the crypt is perfectly cylindrical in shape; (ii) all cells occupy an equal rectangular area on the basal lamina, as they are uniformly arranged in pre‐defined rows and columns; (iii) migration takes place in cell‐sized spatial steps; (iv) the insertion of each newborn cell causes a column of cells to shift upwards, breaking many cell–cell contacts; and (v) cell movement is driven by mitotic pressure only and, consequently, migration ceases immediately if cell proliferation is inhibited. To overcome these deficiencies, several alternative theoretical approaches have been developed.
Lattice‐free models
A two‐dimensional lattice‐free model for the intestinal epithelium has recently been developed by Meineke et al. (2001). While the approach shares many assumptions with the 2D‐grid models described above, importantly cells are not restricted to stepwise motion within a grid. Rather, they move in a continuous, lattice‐free fashion, driven by repulsive and attractive forces. Movement is maintained by the mitotic pressure originating from the bottom of the crypt; this increases the cell density and therefore the intensity of repulsive forces. Moreover, the combined effects of the different forces that operate in Meineke et al.'s (2001) model suggests that, after proliferation has been inhibited, cell movement continues temporarily until a steady‐state cell distribution is reached.
To determine the shape of the cells scattered on the cylindrical surface, Voronoi tessellation is used. The resulting polygonal cell packing closely resembles the morphology of the intestinal epithelium. This brings an additional advantage. Due to polygonal cell packing, experimental cell counts from longitudinal and transverse crypt sections overestimate the real cell numbers (Potten et al. 1988). While correction of the observed cell number is required prior to comparison with predictions from a 2D‐grid model, the lattice‐free model naturally mimics the experimental observations.
It is noteworthy that Meineke et al.'s (2001) model is able to reproduce the same LI and RUN data as Loeffler et al.'s (1986) 2D‐grid model, even though it does not assume an age‐dependent insertion rule for newly formed cells. In the lattice‐free approach, daughter cells are randomly positioned a short distance from their parent cell and the cell boundaries are then recalculated. Consequently, cell proliferation leads to local cell rearrangement only, rather than the displacement of entire columns of cells. As a result, most cell‐cell contacts are preserved.
In addition to the bowel‐specific model developed by Meineke et al. (2001), other more general lattice‐free models for epithelia have been presented. Morel et al. (2001), for example, have used Voronoi tesselation to describe a two‐dimensional longitudinal section of stratified epithelium. The model accounts for an intracellular biochemical network that regulates cell proliferation, as well as for extracellular factors that affect the system. The number of transit cell divisions, for instance, depends on the rate of epidermal growth factor production by basal layer cells. Agent‐based models, which also include intracellular signalling pathways, have been developed by Smallwood and colleagues (Smallwood et al. 2004; Walker et al. 2004). The principal innovation achieved with this three‐dimensional approach is the incorporation of the social behaviour of cells, using methods previously employed to model colonies of bees and ants. Individual cells are viewed as agents, which respond to internal and external signals via pre‐defined rules. Assuming that calcium affects cell–cell bonding, the model has been successfully applied to describe tissue recovery after injury under low and physiological calcium concentrations. Finally, Galle et al. (2005) have recently published a three‐dimensional model in which cells are represented as deformable balls. Cell–cell and cell–substrate adhesion forces are assumed to be proportional to the corresponding contact areas. We note that any of the general models just described could in principle be specialized or modified to describe the intestinal epithelium.
Stochastic methylation studies
The spatial models outlined above have been used to investigate cell migration and differentiation. We now focus on models that have been developed to study stem‐cell behaviour. Two complementary hypotheses have been formulated: either stem cells are immortal and only divide asymmetrically (i.e. r S = 1) or ‘stemness’ is determined by a crypt niche and stem cells may divide symmetrically (i.e. r S < 1). A niche has been defined as ‘a subset of tissue cells and extracellular substrates that can indefinitely house one or more stem cells and control their self‐renewal and progeny production in vivo’ (Spradling et al. 2001). Shibata and coworkers have used non‐spatial stochastic modelling to demonstrate that the latter hypothesis is consistent with experimental data from their methylation studies (Ro & Rannala 2001; Yatabe et al. 2001; Kim & Shibata 2002).
Changes in methylation patterns are known to play a central role in development and tumorigenesis by switching the expression of genes on or off (Zingg & Jones 1997; Holliday & Ho 1998; Veigl et al. 1998). Methylation errors, like replication errors, occur randomly in cells and are then somatically inherited (MacPhee 1998; Jones & Vogt 2000). However, unlike replication errors, they do not change the DNA coding sequence and their frequency is significantly larger: 2 × 10⁻⁵ per CpG per cell division versus 10−9 per base pair per division (Loeb 1991; Yatabe et al. 2001). Yatabe et al. (2001) carried out a methylation analysis of colectomy samples from 10 patients, focusing on three CpG‐rich loci. Comparison of the methylation tags provided an estimate of intracrypt and inter‐crypt cell diversity. The differences in methylation indicated not only that the level of methylation increases with age, but also that stochastic lineage bottlenecks occur during the lifespan of a crypt (Yatabe et al. 2001; Kim & Shibata 2002). That is, the progeny from a single stem cell periodically takes over the whole crypt, a phenomenon that is possible if there is more than one stem cell per crypt and stem cells can divide symmetrically (i.e. N S > 1 and r S < 1).
To obtain further insight, Yatabe and coworkers compared observed methylation frequencies with predictions from their non‐spatial stochastic model (Yatabe et al. 2001). In addition to neglecting spatial effects, the main features that distinguish their modelling approach from those discussed above include the following: (i) it represents a human colonic crypt instead of a murine small intestinal crypt; (ii) stochastic stem‐cell turnover is constrained to keep the total number of stem cells constant during the simulation period; (iii) stem and transit cells divide once a day, that is, t CS = t CT = 24 h; and (iv) each cell carries a methylation tag, represented by a simple binary string, which can experience changes during cell division.
The model simulations were performed as follows. Yatabe et al. (2001) first estimated the number of generations, g, that a patient's stem cells had undergone, basing their estimate on the patient's age and assuming that stem cells divide every 24 h. They then simulated g rounds of cell proliferation, starting with N S stem cells carrying unmethylated tags and monitoring the evolution of the methylation tags. Because non‐stem cells are continuously washed out, it was not necessary to follow their evolution until the (g – n – 1)th run, where n denotes the maximum number of transit generations. Yatabe et al. (2001) compared the behaviour of two versions of their model, an ‘immortal model’ with r S = 1 and a ‘niche model’ with r S < 1. Whereas the former failed to predict the observed variance in the number of different tags, the latter described it satisfactorily for a wide range of values of N S. Although the actual numbers of stem cells could unfortunately not be identified, the model simulations clearly favour the niche hypothesis. As will be seen in the Discussion section below, the hypothesis that cell proliferation and differentiation are determined by local environmental conditions has become generally accepted in recent years (see Spradling et al. 2001; Leedham et al. 2005).
Compartmental models
From a mathematical point of view, perhaps the simplest way to model the crypt system is to ignore the spatial location of cells and to use a compartmental model. Such models decompose the system into distinct compartments, with each compartment characterized by a particular cell type. Rules define how the number of cells in each compartment evolves over time, by allowing cells to enter and leave the various compartments; these models are also able to account for features such as maturation, proliferation and death. The models do not specify the spatial location of the different cells within the crypt and hence are not suitable for investigating the mechanisms that control cell migration or other issues that depend substantially on spatial position. In spite of these deficiencies, compartmental models have provided useful insight into other issues.
Paulus et al. (1992) developed a discrete multicompartment model to investigate whether intestinal tissue recovery after irradiation necessarily implies the presence of a feedback mechanism between the cells on the villus and those in the crypt. In line with the cell hierarchy scheme proposed by Potten & Loeffler (1990), the model includes four transit compartments and has each stem cell and first‐generation transit cell (T1) renewing themselves with probabilities, x
S and x
T1, respectively. The self‐renewal probability x
S can be used to calculate p
S, r
S, and q
S, the probabilities with which the stem cell produces 2, 1 or 0 stem cells, whereby p
S =  , r
S = 2 x
S(1 –x
S) and q
S = 1 –p
S
– r
S. The size of the stem cell pool is stable only if x
S = 0.5. For technical reasons, the transit and stem cell compartments are divided into 1 h‐residence subcompartments that add up to the corresponding maximum cell cycle times. This enabled the authors to include in their model an extra level of stochasticity that is analogous to the variation in cell cycle times used in the 2D‐grid models.
, r
S = 2 x
S(1 –x
S) and q
S = 1 –p
S
– r
S. The size of the stem cell pool is stable only if x
S = 0.5. For technical reasons, the transit and stem cell compartments are divided into 1 h‐residence subcompartments that add up to the corresponding maximum cell cycle times. This enabled the authors to include in their model an extra level of stochasticity that is analogous to the variation in cell cycle times used in the 2D‐grid models.
Under normal conditions, Paulus et al.'s (1992) model comprises only compartments for stem cells, transit cells and terminally differentiated cells, with only stem cells and first‐generation transit cells being subject to regulation. Hence, it is assumed that the stem cell cycle time (t CS) and the self‐renewal probabilities (x S and x T1) depend on the number of stem cells (N S). While ensuring that N S > 0 at any time, Paulus et al. (1992) used their model to investigate three possible responses following exposure to radiation, namely loss of stem cells and reversible and irreversible premature maturation. For this purpose, the authors included an additional compartment of prematurely differentiated cells and assumed that fixed fractions of stem and transit cells are at risk of suffering premature differentiation and thus of moving to this non‐proliferative compartment. As the resulting model satisfactorily predicted the experimental observations from irradiation studies with mice, Paulus et al. (1992) postulated that auto‐regulation of cell numbers at the bottom of the crypt alone can explain the early changes observed following irradiation.
The stochastic compartment model developed by Paulus et al. (1992) is discrete, focusing on a finite number of cells advancing through a sequence of compartments in discrete time steps. Boman et al. (2001) proposed a deterministic compartment model (Fig. 4), which is continuous in time and cell numbers. It consists of eight compartments that correspond to the following cell types: stem cells, cells in the four phases of the cell cycle, partially differentiated cells, fully differentiated cells and apoptotic cells. Except for the transition between M‐phase and G1‐phase, transitions between compartments do not involve cell division. In consequence, their model predicts an unrealistic, continuous decline in the number of stem cells.
Figure 4.
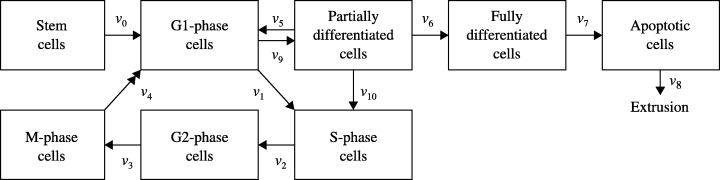
Schematic representation of the multi‐compartment model developed by Boman et al. (2001 ). The initial number of stem cells is N S(0) = 10. The symbol v 8 represents the rate at which apoptotic cells are removed from the epithelium. For j ≠ 8, v j is the transition rate between two consecutive compartments, for example, v 0 represents the number of cells per unit time that leave the stem cell compartment to enter the G1‐phase compartment. Except for the transition between M‐phase and G1‐phase (double arrow), transitions between compartments do not involve cell division. That is, v 4 cells leave M‐phase and 2 × v 4 cells enter G1‐phase per unit time. Partially differentiated cells de‐differentiate into G1‐ and S‐phase cells at rates of v 9 and v 10 cells per unit time, respectively. It is assumed that v 5, v 6 and v 7 are increasing functions of the number of apoptotic cells, whereas v 1 and v 10 decrease with increasing numbers of fully differentiated cells. The model is formulated as a system of eight ordinary differential equations (ODEs) in time.
In a similar way to Paulus et al.'s (1992) discrete compartment model, Boman et al. (2001) take partially differentiated cells to show a certain propensity for self‐renewal (v 10). In addition, v 9 partially differentiated cells return to the G1‐phase compartment per unit time by de‐differentiating (see Fig. 4). Furthermore, two feedback mechanisms are assumed to be active in the crypt: the transition rate between the G1‐ and S‐phases and the rate of transit self‐renewal (v 10) are decreasing functions of the number of fully differentiated cells and the transition rates between compartments of increasing levels of differentiation are increasing functions of the number of apoptotic cells. That is, and unlike Paulus et al. (1992), Boman et al. (2001) propose that regulation of crypt dynamics is controlled from the upper part of the crypt. To fit their time‐dependent model to spatially structured LI data, the authors appear to assume that time and position up the crypt are inter‐changeable.
ABERRANT MUCOSA
Until now we have focused on mathematical models that describe the behaviour of the normal intestinal epithelium and, therefore, the only perturbations considered have been those designed to obtain insight into the functioning of the crypt system under normal, tumour‐free, conditions (for example, exposure to mitotic inhibitors, radiation and/or toxic chemicals). Here, in this section, we concentrate on the occurrence of intestinal neoplasia. Whereas the incidence of tumours in the human small intestine is very low, CRC represented 9.4% of the new cancer cases worldwide in 2000 (Steward & Kleihues 2003). The vast majority of these CRC cases occurred sporadically. Indeed, only 1–5% of CRC cases can be attributed to dominantly inherited disorders, such as familial adenomatous polyposis (FAP) and hereditary non‐polyposis colorectal cancer (HNPCC) (Hodgson & Maher 1999).
Several histopathological stages have been identified in the transition from a normal epithelium to a colorectal carcinoma. Fearon & Vogelstein (1990) proposed that these stages correspond to the accumulation of successive genetic alterations. Moreover, they identified four putative CRC genes: APC, K‐ras, DCC, and p53. Germline APC mutations are responsible for FAP (see Kinzler & Vogelstein 1996; De la Chapelle 2004). Since 1990, cancer of the large bowel has been described elsewhere as the most illustrative example of multistage carcinogenesis. However, the simplicity of the original linear Vogelstein model has since been replaced by a more complex scenario, with no single genetic pathway leading to CRC (Potter 1999). Smith et al. (2002), for instance, have reported that only 6.6% of the CRC patients that they analysed presented with mutations in all three of APC, K‐ras and p53. This suggests that the Vogelstein model may not be as universal as initially believed.
Subcellular level: early events in neoplasia
Despite the current uncertainty about the sequence(s) of genetic and epigenetic events leading to CRC, experimental evidence suggests that, in up to 90% of colorectal cancers, tumour initiation occurs through loss of APC function or alteration of other genes involved in the regulation of the level of β‐catenin (Homfray et al. 1998; Bienz & Clevers 2000; Suzuki et al. 2004). As a result, cells behave as if the Wnt‐signalling pathway is constantly stimulated (Kielman et al. 2002; Giles et al. 2003; Ilyas 2005): β‐catenin degradation is inhibited, allowing β‐catenin to travel to the nucleus where it regulates gene expression through binding to transcription factors of the TCF/LEF‐family. Among the downstream targets of the β‐catenin pathway are: cyclin‐D1 (cell‐cycle control; Shtutman et al. 1999), survivin (apoptosis; Zhang et al. 2001), c‐myc (cell differentiation; He et al. 1998) and EphB/ephrin‐B (cell migration and adhesion; Battle et al. 2002). The expression gradients of these genes along the crypt‐villus axis are shown in Fig. 3. The APC tumour suppressor is part of the complex that phosphorylates β‐catenin, marking it for ubiquitination and subsequent degradation. APC is a multifunctional protein that ‘participates in several cellular processes, including cell adhesion and migration, signal transduction, cytoskeletal organization and chromosome segregation’ (Fodde 2003). The APC gene fits the two‐hit model proposed by 1971, 2001), as an inactivating event in each allele is required to subvert APC's tumour suppressor function.
It is generally believed that tumorigenesis occurs as a result of the accumulation of genetic alterations in a stem cell. This belief is based on two hypotheses: the precursors of malignant lesions have to possess unlimited replicative potential and, given the low mutation rate per cell division, the chance of a migrating cell suffering a hit during its short residence time in the crypt is negligible. Komarova and coworkers (Komarova & Wang 2004; Wodarz & Komarova 2005) used mathematical modelling to investigate whether both APC hits have, indeed, to occur within the stem cell compartment (Table 1).
Table 1.
Three possible tumour initiation scenarios as defined by Komarova & Wang (2004). Based on an immortal model with a single stem cell, the authors concluded that route A is the least likely and that the relative importance of scenarios B and C depends on the model parameter values
| Scenario A | Scenario B | Scenario C | |
|---|---|---|---|
| Target 1st APC hit | APC+/+ stem cell | APC+/+ stem cell | APC+/+ migrating cell |
| Target 2nd APC hit | APC+/– stem cell | APC+/– migrating cell | APC+/– migrating cell |
Komarova & Wang (2004) distinguished three possible events: (A) both hits occur in the stem cell population, (B) the first hit occurs in a stem cell whereas the second hit takes place in a migrating cell and (C) both hits occur in the migrating cell population. Despite the fact that the long‐held view of CRC monoclonality has recently been challenged by new experimental evidence (Novelli et al. 2003), all three scenarios assume that CRC arises from a single cell. To calculate the likelihood of each circumstance, the authors used an immortal model (r S = 1), with a single stem cell (N S = 1) and n transit generations. As a consequence, scenarios A and B have a common intermediate stage in which the crypt is filled monoclonally with cells expressing a single APC allele. Interestingly, the model suggests that the probability of scenario A is negligible and that therefore at least one of the two hits occurs in the migrating population (Komarova & Wang 2004). The relative importance of scenarios B and C depends on the values of the model parameters. Hence, for example, scenario C becomes more likely when the inactivation rate of the second allele increases. Komarova & Wang (2004) conclude that, in the presence of chromosomal instability (CIN), the two APC hits are most likely to occur in the migrating population.
There is no general consensus concerning the role of genetic instability in the onset of neoplasia, as is illustrated by ongoing debates (Boland & Ricciardiello 1999; Tomlinson et al. 2002; Rajagopalan et al. 2003; Sieber et al. 2003) and controversial experimental observations (Homfray et al. 1998; Shih et al. 2001b; Sieber et al. 2002). On the one hand, the mutator phenotype hypothesis claims that the spontaneous mutation rate is too low to explain the occurrence of multistage cancer and that therefore the acquisition of exceptional mutability is a necessary event in tumorigenesis (Loeb 1991; Duesberg et al. 1998; Rajagopalan et al. 2003). On the other hand, the natural selection hypothesis defends the claim that the normal mutation rate, in combination with clonal evolution and natural selection, suffice to obtain a tumour (Nowel 1976; Tomlinson et al. 1996; Hanahan & Weinberg 2000). Vogelstein, Nowak, Komarova and colleagues have carried out several theoretical studies (e.g. 2002, 2003, 2004; Komarova et al. 2003; Komarova & Wodarz 2004) to explore the role of genetic instability in colorectal cancer. Nowak et al. (2002), for example, developed a mathematical framework to investigate whether CIN is likely to precede APC inactivation. In their model, APC alleles can be inactivated by either mutation or loss of heterozygosity (LOH). The acquisition of CIN is incorporated as a stochastic mutational event at a hypothetical ‘CIN gene’ and results in an increased rate of LOH. The authors conclude that ‘if the number of CIN genes in the human genome exceeds a critical value, then there is a high probability that inactivation of APC happens after a CIN mutation’ (Nowak et al. 2002). For different model parameter values, the estimated number of CIN genes varies between 1 and 138.
A third mechanism has recently been proposed to explain tumour initiation despite the low spontaneous mutation rate. It involves the concept of pre‐tumour progression (Kim & Shibata 2002; Calabrese et al. 2004), which is analogous to proper tumour progression, except that the former occurs in the absence of selection and phenotypic change. Consequently, the appearance of the tissue remains normal during pre‐tumour progression. Kim & Shibata (2002) have hypothesized that, in the large bowel, natural niche succession (see the Methylation Studies section above) enhances pre‐tumour progression by providing a passive mechanism for the accumulation of multiple alterations, including those critical to tumorigenesis.
As explained above, Komarova & Wang (2004) sought to identify the most likely targets of the two APC hits, using an immortal model (r S = 1) with a single stem cell (N S = 1). These authors claimed that their model could be extended for N S > 1 simply by superimposing the corresponding number of single‐stem‐cell crypts. However, as stem cells are assumed to divide asymmetrically only, this approach excludes niche succession and, thereby, the possibility that either the stem‐cell pool becomes monoclonal for the first APC mutation or the APC+/– lineage becomes extinct before acquiring the second mutation. This raises the question of how niche succession affects the likelihood of, for instance, scenario A (Table 1). Using stochastic computer simulations, we have investigated whether a crypt with r S < 1 is likely to develop a double APC mutant in the stem cell compartment more quickly than a crypt with r S = 1.
We monitored a stem‐cell pool of constant size N S = 64 for a certain number of generations. The stem cells are assumed to divide synchronously. To ensure that the number of stem cells does not change in time, for any given generation, two sets of m S≤N S/2 randomly selected stem cells are assumed to divide symmetrically and to die/differentiate, respectively. For simplicity, m S is kept constant during the simulation procedure. Moreover, every newborn cell has a chance µAPC to have acquired an inactivating mutation in one APC allele. This chance is reduced by a factor of two for the second APC hit, because then there is only one target allele left. The simulation ends when a stem cell suffers a second APC hit. The results of 104 independent simulations are summarized in Fig. 5. The left panel shows that the average niche succession time is a decreasing function of the number of symmetric divisions per generation. The model also predicts that the niche succession time is an increasing linear function of the number of stem cells, with the steepest slope corresponding to the lowest m S value (simulations not shown). The right panel illustrates that the time to onset of neoplasia also depends on the m S value. Notably, it reveals that the lower the level of symmetric divisions, the shorter the average waiting time until a stem cell suffers a second APC hit. In particular, APC inactivation on average occurs sooner in the stem‐cell pool in the absence of symmetric division (m S = 0, p S = q S = 0, and r S = 1) than in a crypt with a certain level of symmetric division (m S > 0, p S = q S = m S/N S > 0, and r S < 1). Our results thus suggest that, for the chosen parameter values, niche succession protects stem cells against malignant transformation rather than enhancing pre‐tumour progression within the stem‐cell pool. This is in agreement with the theoretical analysis performed by Calabrese et al. (2004): ‘for any given time, the probability one stem cell has accumulated h mutations is greater for the case r S = 1 than for r S < 1.’ This can be explained as follows: in the 2‐hit example, the stem‐cell lineage bearing a single APC mutation has more chance of becoming extinct during the next niche succession cycle than of benefiting from the advantages of fixation in the crypt.
Figure 5.
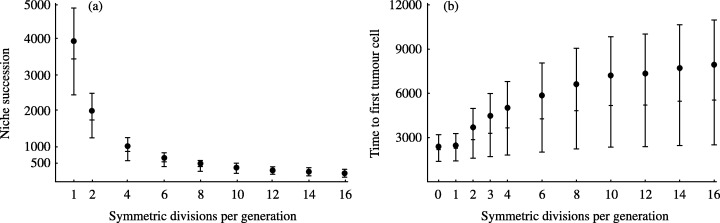
Impact of the level of symmetric stem‐cell divisions on crypt dynamics and CRC. N S = 64 stem cells (cf. Tsao et al. 2000). (a) Niche succession time (i.e. the waiting time between two successive lineage bottlenecks) as a function of the number of symmetric divisions per generation (m S). (b) Time to first double APC mutant as a function of m S. The simulations are based on a mutator phenotype, with 10−4 and 5 × 10⁻⁵ hits per daughter cell for the first and second APC inactivating mutations, respectively (cf. Loeb & Loeb 2000). The probability that both alleles in a cell are inactivated simultaneously is assumed to be negligibly small. In both panels, time is expressed as a number of generations. Data points (•) represent the mean of 104 model simulations and the whiskers indicate the corresponding first and third quartiles. The median of each distribution appears as a horizontal bar. All cells in the crypt are assumed to divide synchronously.
Cellular level: effect of changes in gene expression
In theory, early genetic events such as the inactivation of the APC gene can cause disruption of normal crypt dynamics through several mechanisms, including: (I) insensitivity to differentiation signals and, in consequence, continuation of cell proliferation during migration; (II) increased cell division rate; (III) stem‐cell overproduction, for example, as a consequence of an increase in the probability of symmetric division, p S; and (IV) evasion of cell death. In practice, the cellular event(s) responsible for the onset of neoplasia remain(s) unknown. Boman et al. (2001) developed their compartment model (Fig. 4) to gain further insight in the particular case of CRC onset in FAP patients.
Tomlinson & Bodmer (1995) developed a stochastic mathematical model to investigate the relative importance in tumorigenesis of impairment of cell proliferation and differentiation. The model distinguishes between stem cells, one generation of transit cells (T1), differentiated cells and apoptotic cells. Cells divide synchronously and therefore, time can be expressed in terms of generation number, g. After stem‐cell division, each daughter cell remains a stem cell, becomes a T1‐cell, or dies, with probabilities x S, y S and z S, respectively. The behaviour of T1‐cells is defined similarly (Tomlinson & Bodmer 1995). Differentiated cells do not divide, but have a certain probability of undergoing apoptosis during each generation. The model yields simple expressions for the number of cells in each pool as a function of generation number, g. Hence, for instance, N S(g+ 1) = 2x S N S(g) = (2x S)g N S(0), where N S(0) denotes the initial number of stem cells. Consequently, the size of the stem‐cell population is stable only if x S = 0.5.
Tomlinson & Bodmer (1995) used their model to investigate the impact on crypt dynamics that genetic alterations may cause, each possible alteration being implemented by changing the values of the appropriate model parameters. For example, in the context of their model, failure of stem cells to undergo differentiation is accounted for by decreasing y S by an amount δ. If additionally these aberrant cells do not die, then they are added to the stem cell pool, so that N S(g+ 1) = 2(x S + δ)N S(g), leading inevitably to an exponential increase in cell numbers. Failure of stem cells to undergo apoptosis (z S reduced by an amount δ) can be shown to have the same effect. By contrast, if transit cells fail to differentiate or die, then, depending on the model parameter values, either exponential growth occurs or the cell population simply evolves to a new, higher, equilibrium size. In summary, as the model is able to predict exponential growth when cells continue to divide at the same rate throughout the simulation period, it is concluded that increased cell division (hypothesis II above) is not essential for realizing an exponential pattern of tumour growth. This result is consistent with observations that report altered rates of apoptosis at different stages in CRC progression (Lifshitz et al. 2001; Brodie et al. 2004).
Tissue level: top‐down or bottom‐up morphogenesis?
We now focus on early observable morphological changes in CRC. Microscopic examination has shown that early adenomas contain well‐defined crypt‐like structures. Shih et al. (2001a) detected the presence of a dysplastic epithelium lining the luminal surface and the upper part of these crypts and noted that cells in this region often lack APC function. Even so, the lower part of the same crypts appeared morphologically normal. The transition from dysplastic to normal epithelium was invariably abrupt. These observations gave rise to the top‐down hypothesis, according to which tumour initiation occurs in the inter‐cryptal region on the luminal surface. The mutant clone then invades adjacent crypts by expanding laterally and downwards (Shih et al. 2001a).
Shih et al. (2001a) proposed two possible mechanisms consistent with their top‐down hypothesis: either the precursors of the dysplastic cells reside on the luminal surface or the initial mutant originates at the bottom of a crypt and migrates upwards prior to clonal expansion. A third explanation, proposed by Lamprecht & Lipkin (2002), suggests that tumour initiation occurs in the migrating cell population; this hypothesis is consistent which with scenarios B and C (Table 1) that were favoured by Komarova & Wang (2004).
Based on their examination of very early adenomas, Preston et al. (2003) proposed an alternative morphogenesis model. Unlike Shih et al. (2001a), they reported that the presence of dysplastic epithelium was not restricted to the upper part of the crypts. Because the earliest detected lesions were monocryptal adenomas, they concluded that morphogenesis occurs in a bottom‐up fashion, that is, tumour initiation occurs near the base of the crypt from where the mutant clone takes over the whole gland (Preston et al. 2003). The bottom‐up morphogenesis corresponds to scenario A (Table 1) in Komarova & Wang (2004). The dysplastic monocryptal lesion increases in size by crypt fission or budding (Wright 2000). At a later stage, further growth may occur in a top‐down fashion, which offers a connection with the observations of Shih et al. (2001a).
Several mathematical models have been developed to account for the process of crypt fission. Bjerknes (1996), for instance, developed a compartment model to compare the expansion rates of normal and aberrant crypts (Fig. 6). The model, which is continuous in both time and crypt number, distinguishes between normal crypts, monocryptal lesions and clusters of aberrant crypts, and is not based on any specific biological mechanism underlying crypt fission. Analysis of the model leads to an expression for the proportion of lesions consisting of a single crypt: σ≈ (1 + k 2/k 1)−1, with k 1 and k 2 the expansion rates of normal and aberrant crypts. From an experimental study, Bjerknes (1996) estimated σ = 1/42 and predicted k 2/k 1≈ 41, so that crypt fission is a rare event in the normal mucosa and aberrant crypts expand about 40 times faster than normal crypts, in humans. The difference is attributed to a relative increase in the number of stem cells per crypt. No information, however, on crypt size or crypt dynamics is included in Bjerknes’ model.
Figure 6.
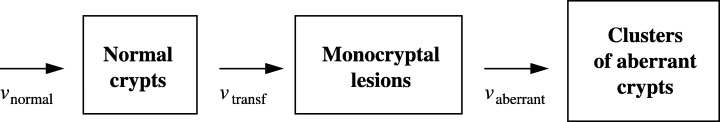
Schematic representation of the compartment model developed by Bjerknes (1996 ) and formulated as a system of linear ODEs. The transition rates are given by: v normal = k 1 × (number of normal crypts), v aberrant = k 2 × (number of monocryptal lesions), and v transf = λ × (number of normal crypts), where the positive constants k 1, k 2 and λ are the expansion rates of normal and aberrant crypts and the crypt transformation rate, respectively. The chance that malignant transformation of adjacent crypts leads directly to the formation of a cluster is assumed to be negligible. The model necessarily predicts a net increase in the total crypt number, as crypts are added to but not removed from the system.
Loeffler and coworkers (Loeffler & Grossmann 1991; 1993, 1997) adopted a different approach, modelling crypt fission by extending a stochastic model for normal crypt dynamics. On division, stem cells are assumed to produce 0, 1 or 2 stem cells with probabilities q S, r S and p S. But, unlike in other models, the resulting variation in the number of stem cells (N S) leads to a change in crypt size. It is further assumed that crypt fission takes place when N S exceeds a certain threshold. After crypt fission, the stem cell population is allocated to two daughter crypts. The authors tested their model against experimental data concerning the monoclonal conversion of crypts after exposure to the mutagenic substance ethylnitrosurea (ENU) (Loeffler et al. 1993). The experiments, carried out by Winton and coworkers (Winton et al. 1988; Winton & Ponder 1990) with mice whose normal epithelial cells express DBA‐Px, showed that shortly after ENU‐treatment the animals start developing crypts with different fractions of mutant cells that do not stain with anti‐DBA‐Px antibody. Moreover, in the long term, all these mixed crypts become monoclonal, some with positive DBA‐Px staining, some negative. The predictions of the model by Loeffler and coworkers were consistent with the observed time courses of the ratio of the number of monoclonally negative crypts to total crypts as well as their ratio to crypts containing one or more negative cells.
Finally, Drasdo & Loeffler (2001) have recently presented a lattice‐free model for crypt fission. Instead of a 2D‐surface, they considered a one‐dimensional chain of cells corresponding to a longitudinal section of a crypt. A small number of stem cells proliferate at the bottom of the crypt producing transit cells, which are assumed to leave the cell cycle when they move into the upper third of the crypt. Individual cells are described in detail in the model, which accounts for changes in cell size and shape during the cell cycle (Drasdo & Loeffler 2001). Cell movement, which is driven by mitotic pressure, is influenced by elastic forces between cells. The lattice‐free model suggests that folding of single‐layer tissues can be induced by either a reduction in the mechanical instability of the crypt structure or an increase in cell proliferation. As the authors point out, these two possible mechanisms may explain crypt deformation observed as a consequence of defects in cell–cell adhesion and as the result of radiation‐mediated acceleration in cell division, respectively.
Organ level: tumour heterogenity
All of the models reviewed above assume that CRC arises from the accumulation of genetic alterations in a single cell and, consequently, they imply that tumours are monoclonal in origin. It has been observed that, as they increase in size, even monoclonal tumours may become heterogeneous due to the acquisition of additional mutations and heterogeneity in environmental conditions (Fidler & Hart 1983; Sutherland 1988; Kunz & Ibrahim 2003). According to Tsao et al. (2000), ‘The final tumour eventually arises from a single cell that represents the last bottleneck … The rest of the lineages are dead ends. Therefore, mutations common to all tumour cells accumulate along the single lineage preceding this final founder cell whereas heterogeneous mutations may arise with clonal expansion.’ Quantitative analysis of the mutation spectrum of CRC tissue samples has provided estimates of the number of cell divisions along the progression pathway (1999, 2000).
Tsao et al. (2000) have applied quantitative principles of evolution theory to reconstruct tumour histories from the variation in microsatellite (MS) repeat lengths. The ‘history’ of a tumour is characterized by the time between tumour initiation and clinical removal (t A) and the duration of final tumour expansion (t X). To ensure that a significant number of mutations take place, the model focuses on tumours with a deficiency in mismatch repair (MMR). The parameter t A is thus defined as the time between loss of MMR and tumour removal. The mathematical model accounts for cell division and mutation. For simplicity, cells are assumed to proliferate at a constant rate (e.g. one division per day) and mutations are incorporated as the random addition or deletion of a single MS repeat (Tsao et al. 2000). The simulation starts with a single normal cell that acquires a mutator phenotype. As the tumour grows, the occurrence of mutations in 20–30 MS loci is monitored. The simulation ends when the tumour reaches a size of about 1 billion cells.
As a result of tumour progression, the final tumour is heterogeneous with respect to the repeat length of each MS loci. Statistical analysis of the length distributions within the tumour, and comparison of the tumour repeat lengths with the normals, enabled Tsao et al. (2000) to re‐estimate t X and t A within a 95% confidence interval. The authors applied the same technique to reconstruct the history of 13 MMR‐deficient colorectal adenomas taken from nine male patients. By analysing data for 10–30 alleles from 21 to 30 non‐coding MS loci, they asserted that the average tumour age and final clonal expansion period were t A≈ 6.2 and t X≈ 0.76 years, respectively (Tsao et al. 2000). It was therefore concluded that most of the cell divisions in a tumour's lifespan occur prior to final clonal expansion.
DISCUSSION
In this article we have reviewed a range of mathematical models concerned with intestinal crypt dynamics and colorectal cancer (Table 2). In the Normal Mucosa section, we focused on models that describe cell proliferation, migration and differentiation in normal crypts. In the Aberrant Mucosa section, we presented theoretical approaches that have been used to describe different stages of tumour development in the large bowel, ranging from tumour initiation to the evolution of tumour heterogeneity. Despite the wide range of processes covered, some important aspects of CRC have not yet been addressed using mathematical modelling. Some examples are provided below, where we also discuss the deficiencies of the models we have reviewed. Finally, to conclude, we shall explain how we hope to overcome such limitations in the near future.
Table 2.
Overview of existing mathematical models
| Spatial models | |
|---|---|
| 2D‐grid crypt‐dynamics | 1988, 1986; Paulus et al. (1993) |
| 1D‐grid crypt‐dynamics | Gerike et al. (1998) |
| 3D lattice‐free epithelium | Smallwood et al. (2004); Walker et al. (2004); Galle et al. (2005) |
| 2D lattice‐free crypt‐dynamics | Meineke et al. (2001) |
| 2D lattice‐free epithelium | Morel et al. (2001) |
| 1D lattice‐free crypt‐fission | Drasdo & Loeffler (2001) |
| Compartmental models | |
|---|---|
| Discrete crypt‐dynamics | Paulus et al. (1992) |
| Continuous crypt‐dynamics | Boman et al. (2001) |
| Continuous crypt‐fission | Bjerknes (1996) |
| Stochastic models | |
|---|---|
| Niche succession studies | Ro & Rannala (2001); Yatabe et al. (2001); Kim & Shibata (2002) |
| APC hits | Komarova & Wang (2004); Wodarz & Komarova (2005) |
| Genetic instability | 2002, 2003; Komarova et al. (2003); Komarova & Wodarz (2004) |
| Pre‐tumour progression | Calabrese et al. (2004) |
| Epidemiology | Armitage & Doll (1954, 1957); Luebeck & Moolgavkar (2002) |
| Impairment of cell differentiation | Tomlinson & Bodmer (1995) |
| Crypt fission | Loeffler & Grossmann (1991); 1993, 1997 |
| Reconstruction of tumour histories | 1999, 2000 |
The models for normal crypt dynamics presented in this overview are from a mathematical viewpoint very simple; therefore, they inevitably rely upon a number of assumptions concerning crypt architecture, cell migration, differentiation and death. For example, crypt size is generally kept constant (e.g. Loeffler et al. 1986; Meineke et al. 2001). The stochastic model by Loeffler et al. (1993) constitutes an exception, as it allows crypt size to vary with the number of stem cells. Moreover, spatial models invariably assume that all crypts in the intestine are cylindrical and are identical. Although these assumptions may deviate from reality, they are justifiable from a modelling point of view, as substitution by more realistic assumptions would only affect slightly the behaviour of the models while complicating substantially the model formulations. This is not the case, however, for assumptions concerning the mechanisms underlying cell migration.
The results of 1988, 1986) show clearly that the choice of cell movement pattern has strong implications on the behaviour of the resulting model. Furthermore, all models of crypt dynamics assume that cell movement is driven primarily by mitotic activity. Consequently, the 2D‐grid models predict that migration stops immediately after mitosis is inhibited, which does not agree with experimental observations (Kaur & Potten 1986; Loeffler et al. 1988). According to the more realistic lattice‐free model developed by Meineke et al. (2001), which accounts for additional forces influencing cell migration, cells temporarily continue to leave the crypt in the absence of mitotic activity. Movement ceases when the remaining cells are scattered evenly on the cylindrical surface and the attractive and repulsive forces between cells are in equilibrium. In reality, however, movement does not cease until the last cell leaves the orifice.
Experimental evidence suggests that Paneth cells, like goblet cells, originate from partially differentiated transit cells. The Paneth precursors thus first migrate upwards before moving downwards towards their final position at the base of the crypt (Bry et al. 1994; Battle et al. 2002). No current model accounts for such bidirectional migration. According to Meineke et al.'s (2001) lattice‐free model, for example, the position and number of the Paneth cells is fixed. Thus, the models for crypt dynamics cannot explain how the precursors of the Paneth cells move against the main migration stream.
It is known that differentiated cells undergo apoptosis before they are removed from the luminal surface (Lifshitz et al. 2001; Grossmann et al. 2002). Most models for crypt dynamics do not treat cell death explicitly. Spatial models, for instance, simply stop monitoring cells when they ‘move off’ the grid. The cell removal rate is thus determined by the migration rate, which depends on the division rate of transit and stem cells. As a consequence, extrusion ceases if proliferation stops, which does not seem realistic. Alternatively, in Boman et al.'s (2001) compartment model, a fixed fraction of mature cells enters the apoptotic compartment per unit time. Because of the non‐spatial and continuous nature of the model, the chance of a differentiated cell undergoing apoptosis depends neither on its position nor its age. New evidence suggests, however, that the initiation of apoptosis is induced through a position‐dependent signalling network, involving expression gradients of Bcl‐2, integrins, TGF‐β and caspase‐3 (Grossmann et al. 2002).
As explained in the Methylation Studies section, the investigation by Yatabe et al. (2001) supports the existence of intestinal stem cell niches. It has been proposed that these niches are regulated by a source of Wnt‐factors located somewhere near to the bottom of the crypt (Van de Wetering et al. 2002). Moreover, as illustrated in Fig. 3, experimental evidence suggests that not only stemness and cell proliferation but also cell adhesion, migration and differentiation depend on Wnt‐mediated biochemical gradients along the crypt‐villus axis (Gaspar & Fodde 2004). Most of the models we have reviewed (Paulus et al. 1993; Meineke et al. 2001), however, assume that cells move along a pre‐defined differentiation hierarchy according to their age (expressed as the number of generations since leaving the stem cell pool), so that differentiation depends on an ‘internal molecular clock’ only. Loeffler et al. (1986) and Drasdo & Loeffler (2001), instead, incorporated the action of extracellular factors in a weak way, as they assumed a differentiation cut‐off at a certain crypt row. Consequently, unlike in Fig. 2, the number of transit generations until final maturation is variable. Finally, Gerike et al. (1998) have developed an approach that incorporates cell–cell communication. They considered a discrete 1D‐chain of cells and modelled the production and decay of a hypothetical growth factor that diffuses from cell to cell via gap junctions. These simple modelling attempts, however, understandably do not do full justice to the importance of biochemical pathways, such as cell cycle control and Wnt and Delta‐Notch signalling, in crypt dynamics and CRC.
In addition to neglecting the biochemical pathways underlying crypt dynamics, spatial models do not account for the concept of a potential stem‐cell or clonogenic cell. Based on the results from irradiation studies, Potten & Loeffler (1990) have reported the ability of some transit cells, the so‐called clonogenic cells, to de‐differentiate and regain stem‐cell properties as one of the mechanisms by which the number of stem cells is regulated. The compartment model by Paulus et al. (1992), which was specifically designed to study crypt recovery after exposure to radiation, incorporates mechanisms for controlling the number of stem cells other than de‐differentiation of transit cells. Consequently, according to their model, crypt recovery requires the survival of at least one stem cell.
DNA labelling with tritiated thymidine has provided further insight into the role of clonogenic cells. It has revealed that, during asymmetric stem‐cell division, the cell selectively segregates the DNA strands in such a way that the stem cell retains both ‘immortal’ DNA templates, whereas the newborn transit cell receives the newly synthesized strands (Cairn 2002; Merok et al. 2002; Potten et al. 2002). This mechanism protects stem cells from replication‐mediated DNA errors. In addition, to guard against repair‐mediated errors, stem cells do not express the error‐prone repair pathways responsible for the re‐synthesis of damaged strands. If they suffer this kind of damage, stem cells choose to commit suicide, which explains their extreme sensitivity to radiation and mutagenic compounds. These observations have a number of serious implications for stem‐cell dynamics and malignant transformation, the most important of which we now state. First, after stem‐cell division, the daughter cells do not have any control over their subsequent fate and, therefore, it is not realistic to assign to each of them an independent renewal probability x S. Second, stem cells only divide asymmetrically (r S = 1). Third, inhibition of mismatch repair (MMR) in a stem cell initially affects only the corresponding transit lineage, which will become more susceptible to the acquisition of mutations. The stem‐cell pool can be affected later, however, if one of these mutated transit cells regains stemness. Furthermore, even though r S = 1, niche succession is possible if, for example, all stem‐cell positions are taken over by clonogenic cells from the same lineage. Because these clonogenic cells may have accumulated mutations during several transit divisions, this form of niche succession is, unlike in Fig. 5, likely to enhance pre‐tumour progression and thereby the chance of malignant transformation. It is of great importance to investigate whether this purely asymmetric stem‐cell dynamics substantially alters the conclusions obtained from mathematical models based on stochastic stem‐cell dynamics.
Finally, we would like to make some remarks concerning the mathematical properties of the models. As Fig. 5 illustrates, discrete stochastic models, including 2D‐grid and lattice‐free models, often require repeated simulations to extract emergent properties or trends. Deterministic continuum ODE and PDE models, particularly when formulated in two or three spatial dimensions, must also be solved numerically. Of course in both cases, simple or caricature submodels may be derived as limiting cases of the full models in order to investigate the type of behaviour that may arise when a small number of physical mechanisms operate. Being amenable to analytical techniques, such specialized models predict more readily the likely outcome of interactions between different phenomena. Many deterministic models for tumour growth exist but have not yet been specialized to a particular type of cancer (see Preziosi 2003; Araujo & McElwain 2004; Mantzaris et al. 2004). Furthermore, although the processes involved in crypt dynamics and CRC occur over a wide range of time and length scales (for example, enzymatic reactions versus crypt fission), the vast majority of existing models deal with only one scale. Consequently, they cannot be used to test hypotheses regarding interactions between phenomena happening at different levels of organization. Therefore, multiscale models that can integrate the hierarchy of processes, ranging from genetic events to tissue and whole organ, are being developed (cf. Alarcón et al. 2004). As demonstrated by the advances in developing a whole‐organ model of the heart (Noble 2002), multiscale models have the additional advantage of allowing investigators to combine disparate experimental data and to predict the effects of new therapies on the system as a whole.
Over the past 50 years an overwhelming volume of molecular, cellular, histological and clinical knowledge on the origin and progression of CRC has become available. In a new era in which computing requirements are no longer a serious limitation, we believe that an integrative modelling approach to CRC is key to further progress.
ACKNOWLEDGEMENTS
The authors thank Felicity Rose and Natalia Komarova for their constructive comments on an earlier draft of this article and gratefully acknowledge the support provided by the funders of the Integrative Biology project: the EPSRC (GR/S72023/01) and IBM.
| APC | Adenomatosis polyposis coli tumour suppressor gene |
| CIN | Chromosomal instability |
| CRC | Colorectal cancer |
| DBA‐Px | Peroxidase conjugate of Dolichos biflorus agglutinin |
| DCC | Deleted in colorectal cancer gene |
| ENU | Ethylnitrosurea |
| FAP | Familial adenomatous polyposis |
| HNPCC | Hereditary non‐polyposis colorectal cancer |
| LI | Position‐dependent labelling index (i.e. % of labelled cells in a given crypt row) |
| LOH | Loss of heterozygosity |
| MMR | Mismatch repair |
| MS | Microsatellite |
| ODE | Ordinary differential equation |
| PDE | Partial differential equation |
| RUN | Vertical‐run number (i.e. number of labelled sequences in a given crypt column) |
| S | Stem cell |
| T | Transit cell |
| T i | ith‐generation transit cell (i = 1 …n) |
| TGF‐β | Transforming growth factor β |
| b | Number of mutations in the Armitage–Doll model |
| g | Number of stem cell generations within a given time period |
| k 1, k 2 | Expansion rates of normal and aberrant crypts |
| m S | Number of symmetric divisions per generation |
| n | Number of transit generations |
| N * | Number of cells type * in a crypt, with * = S or T i |
| p* | Probability of symmetric division (* = S or T i) |
| q* | Probability of division into two next generation cells (* = S or T i) |
| r * | Probability of asymmetric division (* = S or T i) |
| t C * | Cell cycle time (* = S or T i) |
| t A | Tumour age (time between loss of MMR and tumour removal) |
| t X | Duration of final clonal expansion |
| v | Transition rate between two compartments |
| x* | Newborn cell self‐renewal probability (* = S or T i) |
| y * | Newborn cell differentiation probability (* = S or T i) |
| z * | Newborn cell apoptosis probability (* = S or T i) |
| α | Number of cells leaving a crypt per day |
| δ | Small amount |
| λ | Crypt malignant transformation rate |
| µAPC | Probability that a newborn cell acquired an APC mutation |
| σ | Proportion of monocryptal lesions |
REFERENCES
- Adam JA, Bellomo N, eds (1997) A Survey of Models for Tumor‐Immune System Dynamics Modeling and Simulation in Science, Engineering and Technology. Boston: Birkhäuser. [Google Scholar]
- Alarcón T, Byrne HM, Maini PK (2004) Towards whole organ modelling of tumour growth. Prog. Biophys. Mol. Biol. 85, 451. [DOI] [PubMed] [Google Scholar]
- Ambrosi D, Bussolino F, Preziosi L (2005) A review of vasculogenesis models. J. Theor. Med. 6, 1. [Google Scholar]
- Araujo RP, McElwain LS (2004) A history of the study of solid tumour growth: the contribution of mathematical modelling. Bull. Math. Biol. 66, 1039. [DOI] [PubMed] [Google Scholar]
- Armitage P, Doll R (1954) The age distribution of cancer and a multistage theory of carcinogenesis. Br. J. Cancer 8, 1. [DOI] [PMC free article] [PubMed] [Google Scholar]
- Armitage P, Doll R (1957) A two‐stage theory of carcinogenesis in relation to the age distribution of human cancer. Br. J. Cancer 9, 161. [DOI] [PMC free article] [PubMed] [Google Scholar]
- Bach SP, Renehan AG, Potten CS (2000) Stem cells: the intestinal stem cell as a paradigm. Carcinogenesis 21, 469. [DOI] [PubMed] [Google Scholar]
- Battle E, Henderson JT, Beghtel H, Van den Born MMW, Sancho E, Huls G, Meeldijk J, Robertson J, Van de Wetering M, Pawson T, Clevers H (2002) β‐catenin and TCF mediate cell positioning in the intestinal epithelium by controlling the expression of EphB/EphrinB. Cell 111, 251. [DOI] [PubMed] [Google Scholar]
- Bienz M, Clevers H (2000) Linking colorectal cancer to Wnt signaling. Cell 103, 311. [DOI] [PubMed] [Google Scholar]
- Bjerknes M (1996) Expansion of mutant stem cell populations in the human colon. J. Theor. Biol. 178, 381. [DOI] [PubMed] [Google Scholar]
- Bjerknes M, Cheng H (1999) Clonal analysis of mouse intestinal epithelial progenitors. Gastroenterology 116, 7. [DOI] [PubMed] [Google Scholar]
- Boland CR, Ricciardiello L (1999) How many mutations does it take to make a tumor? Proc. Natl Acad. Sci. USA 96, 14675. [DOI] [PMC free article] [PubMed] [Google Scholar]
- Boman BM, Fields JZ, Bonham‐Carter O, Runquist OA (2001) Computer modeling implicates stem cell overproduction in colon cancer initiation. Cancer Res. 61, 8408. [PubMed] [Google Scholar]
- Booth C, Brady G, Potten CS (2002) Crowd control in the crypt. Nat. Med. 18, 1360. [DOI] [PubMed] [Google Scholar]
- Brodie CM, Crotty PL, Gaffney EF (2004) Morphologically distinct patterns of apoptosis correlate with size and high‐grade dysplasia in colonic adenomas. Histopathology 44, 240. [DOI] [PubMed] [Google Scholar]
- Bry L, Falk P, Huttner K, Ouellette A, Midtvedt T, Gordon JI (1994) Paneth cell differentiation in the developing intestine of normal and transgenic mice. Proc. Natl Acad. Sci. USA 91, 10335. [DOI] [PMC free article] [PubMed] [Google Scholar]
- Cairn J (2002) Somatic stem cells and the kinetics of mutagenesis and carcinogenesis. Proc. Natl Acad. Sci. USA 99, 10567. [DOI] [PMC free article] [PubMed] [Google Scholar]
- Calabrese P, Tavaré S, Shibata D (2004) Pretumor progression. Clonal evolution of human stem cell populations. Am. J. Pathol. 164, 1337. [DOI] [PMC free article] [PubMed] [Google Scholar]
- De la Chapelle A (2004) Genetic predisposition to colorectal cancer. Nat. Rev. Cancer 4, 769. [DOI] [PubMed] [Google Scholar]
- Drasdo D, Loeffler M (2001) Individual‐based models to growth and folding in one‐layered tissues: intestinal crypts and early development. Nonlinear Analysis 47, 245. [Google Scholar]
- Duesberg P, Rausch C, Rasnick D, Hehlmann R (1998) Genetic instability of cancer cells is proportional to their degree of aneuploidy. Proc. Natl Acad. Sci. USA 95, 13692. [DOI] [PMC free article] [PubMed] [Google Scholar]
- Fearon ER, Vogelstein B (1990) A genetic model for colorectal tumorigenesis. Cell 61, 759. [DOI] [PubMed] [Google Scholar]
- Fidler IJ, Hart IR (1983) Biological diversity in metastatic neoplasms: origins and implications. Sci. 217, 998. [DOI] [PubMed] [Google Scholar]
- Fodde R (2001) APC, signal transduction and genetic instability in colorectal cancer. Nat. Rev. Cancer 1, 55. [DOI] [PubMed] [Google Scholar]
- Fodde R (2003) The multiple functions of tumour suppressors: it's all in APC. Nat. Cell Biol. 5, 190. [DOI] [PubMed] [Google Scholar]
- Galle J, Loeffler M, Drasdo D (2005) Modeling the effect of deregulated proliferation and apoptosis on the growth dynamics of epithelial cell populations in vitro. Biophys. J. 88, 62. [DOI] [PMC free article] [PubMed] [Google Scholar]
- Gaspar C, Fodde R (2004) APC dosage effects in tumorigenesis and stem cell differentiation. Int. J. Dev. Biol. 48, 377. [DOI] [PubMed] [Google Scholar]
- Gerike TG, Paulus U, Potten CS, Loeffler M (1998) A dynamic model of proliferation and differentiation in the intestinal crypt based on a hypothetical intraepithelial growth factor. Cell Prolif. 31, 93. [DOI] [PMC free article] [PubMed] [Google Scholar]
- Giles RH, Van Es JH, Clevers H (2003) Caught up in a Wnt storm: Wnt signaling in cancer. Biochim. Biophys. Acta 1653, 1. [DOI] [PubMed] [Google Scholar]
- Grossmann J, Walther K, Artinger M, Rümmele P, Woenckhaus M, Schölmerich J (2002) Induction of apoptosis before shedding of human intestinal epithelial cells. Am. J. Gastroenterol. 97, 1421. [DOI] [PubMed] [Google Scholar]
- Hanahan D, Weinberg RA (2000) The hallmarks of cancer. Cell 100, 57. [DOI] [PubMed] [Google Scholar]
- He TC, Sparks AB, Rago C, Hermeking H, Zawel L, Da Costa LT, Morin PJ, Vogelstein B, Kinzler KW (1998) Identification of c‐Myc as a target of the APC pathway. Science 281, 1509. [DOI] [PubMed] [Google Scholar]
- Health JP (1996) Epithelial cell migration in the intestine. Cell Biol. Int. 20, 139. [DOI] [PubMed] [Google Scholar]
- Hodgson SV, Maher ER (1999) A Practical Guide to Human Cancer Genetics, 2nd edn Cambridge: Cambridge University Press. [Google Scholar]
- Holliday R, Ho T (1998) Evidence for gene silencing by endogenous DNA methylation. Proc. Natl Acad. Sci. USA 95, 8727. [DOI] [PMC free article] [PubMed] [Google Scholar]
- Homfray TFR, Cottrell SE, Ilyas M, Rowan A, Talbot IC, Bodmer WF, Tomlinson IPM (1998) Defects in mismatch repair occur after APC mutations in the pathogenesis of sporadic colorectal tumours. Human Mutat. 11, 114. [DOI] [PubMed] [Google Scholar]
- Ilyas M (2005) Wnt signalling and the mechanistic basis of tumour development. J. Pathol. 205, 130. [DOI] [PubMed] [Google Scholar]
- Järvinen R, Knekt P, Hakulinen T, Rissanen H, Heliövaara M (2001) Dietary fat, cholesterol and colorectal cancer in a prospective study. Br. J. Cancer 85, 357. [DOI] [PMC free article] [PubMed] [Google Scholar]
- Jones PA, Vogt PK, eds (2000) DNA Methylation and Cancer. Berlin: Springer. [Google Scholar]
- Kaur P, Potten CS (1986) Cell migration velocities in the crypts of the small intestine after cytotoxic insult are not dependent on mitotic activity. Cell Tissue Kinet. 19, 601. [DOI] [PubMed] [Google Scholar]
- Kayahara T, Sawada M, Takaishi S, Fukui H, Seno H, Fukuzawa H, Suzuki K, Hiai H, Kageyama R, Okano H, Chiba T (2003) Candidate markers for stem and early progenitor cells, Musashi‐1 and Hes1, are expressed in crypt base columnar cells of mouse small intestine. FEBS Lett. 535, 131. [DOI] [PubMed] [Google Scholar]
- Kerr D (2003) Clinical development of gene therapy for colorectal cancer. Nat. Rev. Cancer 3, 615. [DOI] [PubMed] [Google Scholar]
- Kielman MF, Rindapää M, Gaspar C, Van Poppel N, Breukel C, Van Leeuwen S, Taketo MM, Roberts S, Smits R, Fodde R (2002) APC modulates embryonic stem‐cell differentiation by controlling the dosage of β‐catenin signaling. Nat. Genet. 32, 594. [DOI] [PubMed] [Google Scholar]
- Kim KM, Shibata D (2002) Methylation reveals a niche: stem cell succession in human colon crypts. Oncogene 21, 5441. [DOI] [PubMed] [Google Scholar]
- Kinzler K, Vogelstein B (1996) Lessons from hereditary colorectal cancer. Cell 87, 159. [DOI] [PubMed] [Google Scholar]
- Knudson AG (1971) Mutation and cancer: statistical study of retinoblastoma. Proc. Natl Acad. Sci. USA 68, 820. [DOI] [PMC free article] [PubMed] [Google Scholar]
- Knudson AG (2001) Two genetic hits (more or less) to cancer. Nat. Genet. 1, 157. [DOI] [PubMed] [Google Scholar]
- Komarova NL, Sengupta A, Nowak MA (2003) Mutation‐selection networks of cancer initiation: tumor suppressor genes and chromosomal instability. J. Theor. Biol. 223, 433. [DOI] [PubMed] [Google Scholar]
- Komarova NL, Wang L (2004) Initiation of colorectal cancer: where do the two hits hit? Cell Cycle 3, 1558. [DOI] [PubMed] [Google Scholar]
- Komarova NL, Wodarz D (2004) The optimal rate of chromosome loss for the inactivation of tumor suppressor genes in cancer. Proc. Natl Acad. Sci. USA 101, 7017. [DOI] [PMC free article] [PubMed] [Google Scholar]
- Kunz M, Ibrahim SM (2003) Molecular responses to hypoxia in tumor cells. Mol. Cancer 2, 23. [DOI] [PMC free article] [PubMed] [Google Scholar]
- Lamprecht SA, Lipkin M (2002) Migrating colonic crypt epithelial cells: primary targets for transformation. Carcinogenesis 23, 1777. [DOI] [PubMed] [Google Scholar]
- Leedham SJ, Brittain M, McDonald SAC, Wright NA (2005) Intestinal stem cells. J. Cell Mol. Med. 9, 11. [DOI] [PMC free article] [PubMed] [Google Scholar]
- Lifshitz S, Lamprecht SA, Benharroch D, Prinsloo I, Polak‐Charcon S, Schwartz B (2001) Apoptosis (programmed cell death) in colonic cells: from normal to transformed stage. Cancer Lett. 163, 229. [DOI] [PubMed] [Google Scholar]
- Loeb LA (1991) Mutator phenotype may be required for multiple stage carcinogenesis. Cancer Res. 51, 3075. [PubMed] [Google Scholar]
- Loeb KR, Loeb LA (2000) Significance of multiple mutations in cancer. Carcinogenesis 21, 379. [DOI] [PubMed] [Google Scholar]
- Loeffler M, Birke A, Winton D, Potten CS (1993) Somatic mutation, monoclonality and stochastic models of stem cell organization in the intestinal crypt. J. Theor. Biol. 160, 471. [DOI] [PubMed] [Google Scholar]
- Loeffler M, Bratke T, Paulus U, Li YQ, Potten CS (1997) Clonality and life cycles of intestinal crypts explained by a state dependent stochastic model of epithelial stem cell organization. J. Theor. Biol. 186, 41. [DOI] [PubMed] [Google Scholar]
- Loeffler M, Grossmann B (1991) A stochastic branching model with formation of subunits applied to the growth of intestinal crypts. J. Theor. Biol. 150, 175. [DOI] [PubMed] [Google Scholar]
- Loeffler M, Potten CS, Paulus U, Glatzer J, Chwalinski S (1988) Intestinal crypt proliferation. II. Computer modelling of mitotic index data provides further evidence for lateral and vertical cell migration in the absence of mitotic activity. Cell Tissue Kinet. 21, 247. [DOI] [PubMed] [Google Scholar]
- Loeffler M, Stein R, Wichmann HE, Potten CS, Kaur P, Chwalinski S (1986) Intestinal crypt proliferation. I. A comprehensive model of steady‐state proliferation in the crypt. Cell Tissue Kinet. 19, 627. [DOI] [PubMed] [Google Scholar]
- Luebeck EG, Moolgavkar SH (2002) Multistage carcinogenesis and the incidence of colorectal cancer. Proc. Natl Acad. Sci. USA 99, 15095. [DOI] [PMC free article] [PubMed] [Google Scholar]
- MacPhee DG (1998) Epigenetics and epimutagens: some new perspectives on cancer, germ line effects and endocrine disrupters. Mutat. Res. 400, 369. [DOI] [PubMed] [Google Scholar]
- Mantzaris NV, Webb S, Othmer HG (2004) Mathematical modeling of tumor‐induced angiogenesis. J. Math. Biol. 49, 111. [DOI] [PubMed] [Google Scholar]
- Marshman E, Booth C, Potten CS (2002) The intestinal epithelial stem cell. Bioessays 24, 91. [DOI] [PubMed] [Google Scholar]
- Meineke FA, Potten CS, Loeffler M (2001) Cell migration and organization in the intestinal crypt using a lattice‐free model. Cell Prolif. 34, 253. [DOI] [PMC free article] [PubMed] [Google Scholar]
- Merok JR, Lansita JA, Tunstead JR, Sherley JL (2002) Cosegregation of chromosomes containing immortal DNA strands in cells that cycle with asymmetric stem cell kinetics. Cancer Res. 62, 6791. [PubMed] [Google Scholar]
- Morel D, Marcelpoil R, Brugal G (2001) A proliferation control network model: the simulation of two‐dimensional epithelial homeostasis. Acta Biotheor 49, 219. [DOI] [PubMed] [Google Scholar]
- Noble D (2002) Modeling the heart – from genes to cell to the whole organ. Science 295, 1678. [DOI] [PubMed] [Google Scholar]
- Nordling CO (1953) A new theory on the cancer‐inducing mechanism. Br. J. Cancer 7, 68. [DOI] [PMC free article] [PubMed] [Google Scholar]
- Novelli M, Cossu A, Oukrif D, Quaglia A, Lakhani S, Poulsom R, Sasieni P, Carta P, Contini M, Pasca A, Palmieri G, Bodmer W, Tanda F, Wright N (2003) X‐inactivation patch size in human female tissue confounds the assessment of tumor clonality. Proc. Natl Acad. Sci. USA 100, 3311. [DOI] [PMC free article] [PubMed] [Google Scholar]
- Nowak MA, Komarova NL, Sengupta A, Jallepalli PV, Shih IM, Vogelstein B, Lengauer C (2002) The role of chromosomal instability in tumor initiation. Proc. Natl Acad. Sci. USA 99, 16226. [DOI] [PMC free article] [PubMed] [Google Scholar]
- Nowak MA, Michor F, Iwasa Y (2003) The linear process of somatic evolution. Proc. Natl Acad. Sci. USA 100, 14966. [DOI] [PMC free article] [PubMed] [Google Scholar]
- Nowak MA, Michor F, Iwasa Y (2004) Evolutionary dynamics of tumor suppressor gene inactivation. Proc. Natl Acad. Sci. USA 101, 10635. [DOI] [PMC free article] [PubMed] [Google Scholar]
- Nowel PC (1976) The clonal evolution of tumor cell populations. Science 194, 23. [DOI] [PubMed] [Google Scholar]
- Okamoto R, Watanabe M (2004) Molecular and clinical basis for the regeneration of human gastrointestinal epithelia. J. Gastroenterol. 39, 1. [DOI] [PubMed] [Google Scholar]
- Paulus U, Loeffler M, Zeidler J, Owen G, Potten CS (1993) The differentiation and lineage development of goblet cells in the murine small intestinal crypt: experimental and modelling studies. J. Cell Sci. 106, 473. [DOI] [PubMed] [Google Scholar]
- Paulus U, Potten CS, Loeffler M (1992) A model of the control of cellular regeneration in the intestinal crypt after perturbation based solely on local stem cell regulation. Cell Prolif. 25, 559. [DOI] [PubMed] [Google Scholar]
- Potten CS, Booth C, Hargreaves D (2003) The small intestine as a model for evaluating adult tissue stem cell drug targets. Cell Prolif. 36, 115. [DOI] [PMC free article] [PubMed] [Google Scholar]
- Potten CS, Loeffler M (1990) Stem cells: attributes, cycles, spirals, pitfalls and uncertainties. Lessons from the crypt. Development 110, 1001. [DOI] [PubMed] [Google Scholar]
- Potten CS, Owen G, Booth C (2002) Intestinal stem cells protect their genome by selective segregation of template DNA strands. J. Cell Sci. 115, 2381. [DOI] [PubMed] [Google Scholar]
- Potten CS, Roberts SA, Chwalinski S, Paulus U (1988) Scoring mitotic activity in longitudinal sections of crypts of the small intestine. Cell Tissue Kinet. 21, 231. [DOI] [PubMed] [Google Scholar]
- Potter JD (1999) Colorectal cancer: molecules and populations. J. Natl Cancer Inst. 91, 916. [DOI] [PubMed] [Google Scholar]
- Preston SL, Wong WM, Chan AOO, Poulson R, Jeffery R, Goodlad RA, Mandir N, Elia G, Novelli M, Bodmer WF, Tomlinson IP, Wright NA (2003) Bottom‐up histogenesis of colorectal adenomas: origin in the monocryptal adenoma and initial expansion by crypt fission. Cancer Res. 63, 3819. [PubMed] [Google Scholar]
- Preziosi L, ed. (2003) Cancer Modelling and Simulation. Boca Raton, FL: CRC Press. [Google Scholar]
- Rajagopalan H, Nowak MA, Vogelstein B, Lengauer C (2003) The significance of unstable chromosomes in colorectal cancer. Nat. Rev. Cancer 3, 695. [DOI] [PubMed] [Google Scholar]
- Renehan AG, O'Dwyer ST, Haboubi NJ, Potten CS (2002) Early cellular events in colorectal carcinogenesis. Colorectal Dis. 4, 76. [DOI] [PubMed] [Google Scholar]
- Ro S, Rannala B (2001) Methylation patterns and mathematical models reveal dynamics of stem cell turnover in the human colon. Proc. Natl Acad. Sci. USA 98, 10519. [DOI] [PMC free article] [PubMed] [Google Scholar]
- Roberts SA, Hendry JH, Potten CS (1995) Deduction of the clonogen content of intestinal crypts: a direct comparison of two‐dose and multi‐dose methodologies. Radiat. Res. 141, 303. [PubMed] [Google Scholar]
- Ross MH, Kaye GI, Pawlina W (2003) Histology: A Text & Atlas. Philadelphia: Lippincott Williams & Wilkins. [Google Scholar]
- Schmidt GH, Wilkinson MM, Ponder BA (1985) Cell migration pathway in the intestinal epithelium: an in situ marker system using mouse aggregation chimeras. Cell 40, 425. [DOI] [PubMed] [Google Scholar]
- Shih IM, Wang TL, Traverson G, Romans K, Hamilton SR, Ben‐Sasson S, Kinzler KW, Vogelstein B (2001a) Top‐down morphogenesis of colorectal tumors. Proc. Natl Acad. Sci. USA 98, 2640. [DOI] [PMC free article] [PubMed] [Google Scholar]
- Shih IM, Zhou W, Goodman SN, Lengauer C, Kinzler KW, Vogelstein B (2001b) Evidence that genetic instability occurs at an early stage of colorectal tumorigenesis. Cancer Res. 61, 818. [PubMed] [Google Scholar]
- Shtutman M, Zhurinsky J, Simcha I, Albanese C, D’Amico M, Pestell R, Ben‐Ze’ev A (1999) The cycling D1 gene is a target of the β‐catenin/LEF‐1 pathway. Proc. Natl Acad. Sci. USA 96, 5522. [DOI] [PMC free article] [PubMed] [Google Scholar]
- Sieber OM, Heinimann K, Gorman P, Lamlum H, Crabtree M, Simpson CA, Davies D, Neale K, Hodgson SV, Roylance RR, Phillips RKS, Bodmer WF, Tomlinson IPM (2002) Analysis of chromosomal instability in human colorectal adenomas with two mutational hits at APC. Proc. Natl Acad. Sci. USA 99, 16910. [DOI] [PMC free article] [PubMed] [Google Scholar]
- Sieber OM, Heinimann K, Tomlinson IPM (2003) Genomic instability – the engine of tumourigenesis? Nat. Rev. Cancer 3, 701. [DOI] [PubMed] [Google Scholar]
- Smallwood RH, Holcombe WML, Walker DC (2004) Development and validation of computational models of cellular interaction. J. Mol. Histol. 35, 659. [DOI] [PubMed] [Google Scholar]
- Smith G, Carey FA, Beattie J, Wilkie MJV, Lightfoot TJ, Coxhead J, Garner RC, Steele RJC, Wolf CR (2002) Mutations in APC, Kirsten‐ras, and p53 – alternative genetic pathways to colorectal cancer. Proc. Natl Acad. Sci. USA 99, 9433. [DOI] [PMC free article] [PubMed] [Google Scholar]
- Spradling A, Drummond‐Barboa D, Kai T (2001) Stem cells find their niche. Nature 414, 98. [DOI] [PubMed] [Google Scholar]
- Steward BW, Kleihues P, eds (2003) World Cancer Report. Lyon, France: IARC Press. [Google Scholar]
- Sutherland RM (1988) Cell and environment interactions in tumor microregions: the multicell spheroid model. Science 240, 177. [DOI] [PubMed] [Google Scholar]
- Suzuki H, Watkins DN, Jair KW, Schuebel KE, Markowitz SD, Chen WD, Pretlow TP, Yang B, Akiyama Y, Van Engeland M, Toyota M, Tokino T, Hinoda Y, Imai K, Herman JG, Baylin SB (2004) Epigenetic inactivation of SFRP genes allows constitutive WNT signaling in colorectal cancer. Nat. Genet. 36, 417. [DOI] [PubMed] [Google Scholar]
- Tomlinson IPM, Bodmer WF (1995) Failure of programmed cell death and differentiation as causes of tumors: some simple mathematical models. Proc. Natl Acad. Sci. USA 92, 11130. [DOI] [PMC free article] [PubMed] [Google Scholar]
- Tomlinson IPM, Novelli MR, Bodmer WF (1996) The mutation rate and cancer. Proc. Natl Acad. Sci. USA 93, 14800. [DOI] [PMC free article] [PubMed] [Google Scholar]
- Tomlinson IPM, Sasieni P, Bodmer WF (2002) How many mutations in a cancer? Am. J. Pathol. 160, 755. [DOI] [PMC free article] [PubMed] [Google Scholar]
- Trier JS, Allan CH, Abrahamson DR, Hagen SJ (1990) Epithelial basement membrane of mouse jejunum. Evidence for laminin turnover along the entire crypt‐villus axis. J. Clin. Invest. 86, 87. [DOI] [PMC free article] [PubMed] [Google Scholar]
- Tsao JL, Tavaré S, Salovaara R, Jass JR, Aaltonen LA, Shibata D (1999) Colorectal adenoma and cancer divergence. Evidence of multilineage progression. Am. J. Pathol. 154, 1815. [DOI] [PMC free article] [PubMed] [Google Scholar]
- Tsao JL, Yatabe Y, Salovaara R, Järvinen HJ, Mecklin JP, Aaltonen LA, Tavaré S, Shibata D (2000) Genetic reconstruction of individual colorectal tumor histories. Proc. Natl Acad. Sci. USA 97, 1236. [DOI] [PMC free article] [PubMed] [Google Scholar]
- Turck N, Gross I, Gendry P, Stutzmann J, Freund JN, Kedinger M, Simon‐Assmann P, Launay JF (2005) Laminin isoforms: biological roles and effects on the intracellular distribution of nuclear proteins in intestinal epithelial cells. Exp. Cell Res. 303, 494. [DOI] [PubMed] [Google Scholar]
- Van de Wetering M, Sancho E, Verweij C, De Lau W, Oving I, Hurlstone A, Van der Horn K, Batlle E, Coudreuse D, Haramis AP, Tjon‐Pon‐Fong M, Moerer P, Van den Born M, Soete G, Pals S, Eilers M, Medema R, Clevers H (2002) The β‐catenin/TCF‐4 complex imposes a crypt progenitor phenotype on colorectal cancer cells. Cell 111, 241. [DOI] [PubMed] [Google Scholar]
- Van Leeuwen IMM, Zonneveld C (2001) From exposure to effect: a comparison of modeling approaches to chemical carcinogenesis. Mutat. Res. 489, 17. [DOI] [PubMed] [Google Scholar]
- Veigl ML, Kasturi L, Olechnowicz J, Ma A, Lutterbaugh JD, Periyasamy S, Li GM, Drummond J, Mondrich PL, Sedwick WD, Markowitz SD (1998) Biallelic inactivation of hMLH1 by epigenetic gene silencing, a novel mechanism causing human MSI cancers. Proc. Natl Acad. Sci. USA 95, 8698. [DOI] [PMC free article] [PubMed] [Google Scholar]
- Venook A (2005) Critical evaluation of current treatment in metastatic colorectal cancer. Oncologist 10, 250. [DOI] [PubMed] [Google Scholar]
- Walker DC, Southgate J, Hill G, Holcombe M, Hose DR, Wood SM, MacNeil S, Smallwood RH (2004) The epitheliome: agent‐based modelling of the social behaviour of cells. Biosystems 76, 89. [DOI] [PubMed] [Google Scholar]
- Waters J, Cunningham D (2001) The changing face of chemotherapy in colorectal cancer. Br. J. Cancer 84, 1. [DOI] [PMC free article] [PubMed] [Google Scholar]
- Winton DJ, Blount MA, Ponder BA (1988) A clonal marker induced by mutation in mouse intestinal epithelium. Nature 333, 463. [DOI] [PubMed] [Google Scholar]
- Winton DJ, Ponder BA (1990) Stem‐cell organization in mouse small intestine. Proc. Biol. Sci. 241, 13. [DOI] [PubMed] [Google Scholar]
- Wodarz D, Komarova NL (2005) Computational Biology of Cancer: Lecture Notes and Mathematical Modeling. Hackensack, NJ: World Scientific Publishing. [Google Scholar]
- Wright NA (2000) Epithelial stem cell repertoire in the gut: clues to the origin of cell lineages, proliferative units and cancer. Int. J. Exp. Pathol. 81, 117. [DOI] [PMC free article] [PubMed] [Google Scholar]
- Yatabe Y, Tavaré S, Shibata D (2001) Investigating stem cells in human colon by using methylation patterns. Proc. Natl Acad. Sci. USA 98, 10839. [DOI] [PMC free article] [PubMed] [Google Scholar]
- Zhang T, Otevrel T, Gao Z, Gao Z, Ehrlich SM, Fields JZ, Boman BM (2001) Evidence that APC regulates survivin expression: a possible mechanism contributing to the stem cell origin of colorectal cancer. Cancer Res. 61, 8664. [PubMed] [Google Scholar]
- Zingg JM, Jones PA (1997) Genetic and epigenetic aspects of DNA methylation on genome expression, evolution, mutation and carcinogenesis. Carcinogenesis 18, 869. [DOI] [PubMed] [Google Scholar]