Abstract
Objectives: To compare different biological characteristics of human embryonic stem cells (HESCs) between those with normal and those with abnormal karyotype.
Materials and methods: Culture‐adapted HESCs (chHES‐3) with abnormal karyotype were compared with karyotypically normal cells, with regard to pluripotency and differentiation capacity, ultrastructure, growth characteristics, gene expression profiles and signalling pathways.
Results: We found a new abnormal karyotype of HESCs. We observed that chHES‐3 cells with normal and abnormal karyotypes shared similarities in expression markers of pluripotency; however, karyotypically abnormal chHES‐3 cells had a tendency for differentiation towards ectoderm lineages and were easily maintained in suboptimal culturing conditions. Abnormal chHES‐3 cells displayed relatively mature cell organelles compared to normal cells, and karyotypically abnormal chHES‐3 cells had increased survival and population growth. Genes related to cell proliferation and apoptosis were up‐regulated, but genes associated with genetic instability (p53, Rb, BRCA1) were down‐regulated in the karyotypically abnormal cells.
Conclusion: Karyotypically abnormal chHES‐3 cells had a more developed capacity for proliferation, resistance to apoptosis and less genetic stability compared to normal chHES‐3 cells and may be an excellent model for studying and characterizing initial stages that determine transition of embryonic stem cells into cancer stem cells.
Introduction
Human embryonic stem cells (HESCs) are well known to have the ability to proliferate indefinitely and to differentiate into all cell types. They are considered to be the most important ‘seed’ cells in cell and tissue engineering and regenerative medicine (1). One possible concern regarding use of HESCs as therapeutic tools in vivo is the possible risk of chromosomal variation and/or even tumour formation during long‐term culture. Several studies have reported abnormal features appearing in culture‐adapted HESCs including karyotypic changes (2, 3, 4), differential gene expression profiles of karyotypically abnormal HESCs (5), and that genetic changes of culture‐adapted HESCs can increase their capacity for cell proliferation (6). Specific molecular markers such as CD30 confer HESCs with more pronounced resistance to apoptosis (7), whereas Enver et al. described the hierarchy in cell differentiation in culture‐adapted HESCs and found alterations in balance between self‐renewal and differentiation in culture‐adapted cells (8). As the balance between self‐renewal and differentiation is an essential feature of cancer cells, the mechanisms of culture adaptation may mirror those of oncogenesis and tumour progression. However, these studies only showed that HESCs might follow stages of adaptation, which could lead to tumourigenesis. To date, there have been no studies to demonstrate that karyotypic changes of culture‐adapted HESCs parallel potential tumourigenic events. Thus, it is essential that the initial stages in karyotypic change in HESCs are observed and documented to determine any tumourigenic characteristics.
To explore initiation of tumourigenic characteristics underlying karyotype change, karyotypically normal and karyotypically abnormal chHES‐3 cells were compared. Similarities and differences between the two cell types were assessed when cells were grown under similar controlled conditions. In addition to some characteristic similarities, differences existed as expected in their differentiation capacity in vitro, ultrastructure, growth characteristics, cell cycle distribution, apoptosis, self‐renewal capacity and gene expression. These differences were consistent across other normal HESCs (chHES‐20) suggesting that fundamental differences between normal and adapted HESCs exist and that these changes may represent initiation of tumourigenic characteristics of culture‐adapted HESCs.
Materials and methods
Culturing of human embryonic stem cell line chHES‐3
chHES‐3 cells were isolated by immunosurgery and cultured in serum‐free K‐SR medium, containing Knock‐out DMEM (Gibco‐BRL, Rockville, MD, USA) supplemented with 15% serum replacement (Gibco‐BRL, Gaithersburg, MD, USA), 0.1 mmβ‐mercaptoethanol (Sigma, St Louis, Mo, USA), 1% non‐essential amino acids (Gibco‐BRL, Rockville, MD, USA), 2 mm l‐glutamine (Gibco‐BRL, Carlsbad, CA, USA), 50 U/ml penicillin (Sigma), 50 μg/ml streptomycin (Sigma) and 4 ng/ml human recombinant basic fibroblast growth factor (Gibco‐BRL, Bethesda, MD, USA). chHES‐3 cells were initially propagated on mitomycin‐C‐inactivated mouse embryonic fibroblasts (mEFs) derived from inbred Kunming White mice at 12.5 days gestation, at high density of 6–7 × 10⁴ cells/cm2. Every 6–7 days, the cells were passaged using mechanical dissection or a combination of 200 U/ml collagenase IV digestion (Gibco‐BRL, Rockville, MD, USA) followed by mechanical slicing.
chHES‐3 cell specific marker detection
Cells were fixed in ethanol for detection of surface markers. Monoclonal primary antibodies against SSEA‐1, SSEA‐4, TRA‐1‐81 and TRA‐1‐60 were used and localized using rabbit anti‐mouse immunoglobulins conjugated to fluorescein isothiocyanate and stained using the ES Marker Sample kit (Chemicon, Temecula, CA, USA). Oct‐4 staining was performed according to the manufacturer protocol (Santa Cruz Biotechnology, Santa Cruz, CA, USA). Alkaline phosphatase (AKP) activity was detected as described previously (9).
Karyotype analysis
Culture‐adapted ES cells were cultured overnight in HES medium containing 0.06 μg/ml Colcemid (Sigma). After washing three times in PBS, the cells were incubated in HES medium containing 0.05% trypsin and 0.53 mm EDTA (Gibco‐BRL) at 37 °C for 10 min and harvested using standard procedures, followed by standard G‐banding for karyotyping.
Electron microscopy
The normal and abnormal karyotype embryonic stem cells were grown on an MEF feeder cell layer. Once they had formed sizable colonies, they were fixed in 5% glutaraldehyde for 3 h and processed for electron microscopy. They were post‐fixed in osmium tetroxide and embedded in plastic resin; then they were formed into semi‐thin section of 1 μm and stained with toluidine blue. In addition, thin sections were prepared for electron microscopy according to a standard protocol.
Colony formation experiment
The karyotypically normal and abnormal cells were cultured in ES medium for 4 days then digested to single cells. After counting, the single cells (2000/well) were seeded into six‐well plates containing inactivated mouse embryonic feeder cells. After 2 weeks, colonies were fixed and stained with AKP; positive AKP populations were considered to be single colonies.
Cell proliferation
The cells from both karyotypically normal and abnormal chHES‐3 cells were detached using trypsin and counted using a haemocytometer. Then single cells were seeded at 2 × 10⁵/25 cm2 on feeder layers. After culturing for 4 and 6 days in ES medium, cells were harvested and counted.
Basic fibroblast growth factor dependence
Karyotypically normal and abnormal chHES‐3 cells were seeded into six‐well plates in ES medium [4 ng/ml basic fibroblast growth factor (bFGF)]. Undifferentiated cells were then selected for experiments after attachment for 1 day. They were washed twice in PBS before the undifferentiated cells were cultured in bFGF‐free ES medium. After 4 days, numbers of undifferentiated clones and ratios of undifferentiation in each cell were calculated, harvesting wells in triplicate.
Microarray data analysis
Total RNA was extracted from cells using RNasy Mini Kit (Qiagen, Valencia, CA, USA). One microgram of total RNA was primed with 100 ng of Oligo dT‐T7 primer and reverse transcribed with Superscript II (Invitrogen, Carlsbad, CA, USA). Second strand was synthesized and double strand cDNA purified using the DNA Clean and Concentrator kit (Zymo Research, Orange, CA, USA). The in vitro transcription reaction was incubated for 9 h with T7 RNA polymerase. First round aRNA was purified using RNeasy Mini Kit (Qiagen, Valencia, CA, USA) and second round amplification was performed in a similar way to first round, but with 100 ng of aRNA and 500 ng random hexamers. Following second round dscDNA, the ENZO BioArray HighYield RNA Transcript Labelling Kit (Affymetrix, Santa Clara, CA, USA) was used to incorporate biotin‐labelled nucleotides, and then RNA was purified using RNeasy kit. Fragmentation was completed according to the standard protocol (Affymetrix). Prior to hybridization on the GeneChip array, a test array of housekeeping controls was analysed to determine sample suitability for GeneChip arrays. Hybridized arrays were subsequently scanned for data analysis (detailed RNA amplification protocol available upon request). Rehybridization was completed and removed from pre‐hybridization buffer; gene chips were filled with 200 ml of hybridization mixture and incubated for 16 h at 45 °C at 60 rpm. The hybridization mixture was removed and stored at −70 °C. Each chip was filled with 250 ml of non‐stringent wash buffer (6X SSPE, 0.01% Tween‐20) and the signal was amplified by additional treatment with goat‐IgG antibody (0.1 mg/ml) and biotinylated antibody (3 mg/ml) for second staining with SAPE. Chips were scanned using an Affymetrix Scanner 3000 (Affymetrix) and gene expression signal was collected using Affymetrix GCOS V1.1.1 software.
Polymerase chain reaction and real‐time PCR analysis
A total of 1 × 10⁶ chHES‐3 cells was collected and total RNA extracted using Trizol and RNAeasy RNA Cleanup kit. RNA was treated with RNase‐free DNase for 20 min (Roche, Basel, Switzerland) at room temperature. A 4 μl aliquot of total RNA was reverse‐transcribed in a thermocycler using virus reverse transcriptase with random primers according to the manufacturer’s protocol (Sigma). Gene‐specific primer (see Tables S1 and S2) sets were designed and optimized. Real‐time polymerase chain reaction (PCR) was performed using Lightcycler Faststart DNA Sybr Green I kit according to the protocol provided. To determine specificity of amplified products, a melting curve analysis was performed. No amplification of non‐specific products was observed. Cycle threshold (Ct) values were obtained for the tested genes and relative change was calculated in normal cell versus abnormal samples using the 2−ΔΔCt method as described (10), and 95% confidence intervals. Experiments were repeated three times.
Analysis of apoptosis
Apoptotic cells were examined using the Annexin V‐FITC kit (Bender MedSystems, Vienna, Austria) according to manufacturer’s instructions.
Western blot analysis
Protein extracts from 5 × 10⁶ chHES‐3 cells were separated by classical methods and transferred on to nitrocellulose membranes. Membranes were blocked with 5% dry milk and probed using monoclonal antibody to p53 (pAb1801; Santa Cruz Biotechnology). The filter was then incubated in horseradish peroxidase‐conjugated secondary antibody and developed with enhanced chemiluminescence PLUS reagent from Amersham (Piscataway, NJ, USA). To ensure that the amount of protein in each lane was comparable, the filter was stripped and probed with rabbit polyclonal antibody to β‐actin (Santa Cruz Biotechnology).
Results
Karyotype changes and characteristics of chHES‐3 cells
Our established chHES‐3 cell line, was cultured in serum‐free medium on embryonic fibroblast cells isolated from Chinese Kun‐Min White mouse at a density of 6–7 × 10⁴ cells/cm2. At this density, chHES‐3 colonies exhibited compact appearance and showed spontaneous progressive differentiation at their periphery from day 3 to day 7 after passaging. During long‐term culture, several growth crises occurred due to intensive differentiation. Cells rescued from undifferentiated regions of the dish could be split again and exhibited adaptive growth advantage. During routine follow‐up examination of karyotype once in every five passages, the cells exhibited normal karyotype at passage 19 (Fig. 1a). By passage 29, among all analysed 50 metaphases, there were 23 metaphases with karyotype of 46, XX dup (1p32–1p36). At passage 34, the karyotype [46, XX dup (1p32–1p36)] was observed in all 50 analysed metaphases (Fig. 1b). Karyotypically abnormal cells expressed the predicted HESC pluripotency markers SSEA‐4, SSEA‐3, TRA‐1‐81, TRA‐1‐60 and Oct3/4 (Fig. 1c) (part of these results had been published in Gene, Chromosome and Cancer). RT‐PCR was performed to identify genes associated with differentiation and pluripotency, such as NANOG, TERT, THY1, PECAM1, CD34, T (brachyury), AFP, CDH5, FLT1, NES (nestin), TF and TNFRSF8. Their expression profiles (Table 1) suggested that karyotypically abnormal chHES‐3 cells were sufficiently pluripotent to differentiate into all three germ cells.
Figure 1.
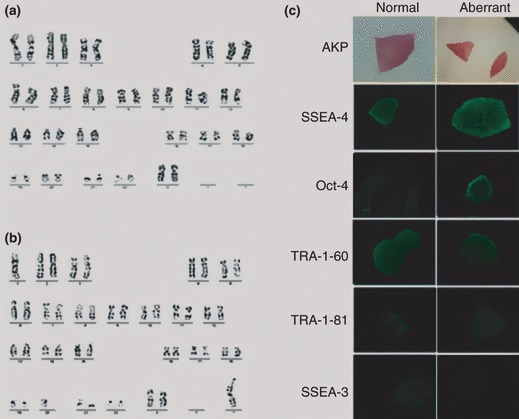
Characteristics of karyotypically abnormal chHES‐3 cells. (a) Normal karyotype of 46, XX at passage 19. (b) Abnormal karyotype of 46, XX, dup (1) (p32p36) at passage 34. (c) Karyotypically abnormal and normal chHES‐3 cell colonies stained positive for AKP, SSEA‐4, OCT‐4, TRA‐1‐60 and TRA‐1‐81 expression and negative for SSEA‐1.
Table 1.
Analysis of markers
| Marker | Normal | Abnormal | Normal EB | Abnormal EB |
|---|---|---|---|---|
| Oct‐4 | + | + | Nt | Nt |
| Tra 1‐60 | + | + | Nt | Nt |
| Tra 1‐81 | + | + | Nt | Nt |
| SSEA‐4 | + | + | Nt | Nt |
| SSEA1 | − | + | Nt | Nt |
| CD9 | + | + | Nt | Nt |
| Vimentin | − | + | Nt | Nt |
| CD133 | − | + | + | + |
| Using RT‐PCR | ||||
| Oct‐4 | + | + | + | + |
| hTERT | + | + | + | + |
| Nanog | + | + | + | + |
| CD90 | + | + | + | + |
| CD31 | − | − | + | + |
| CD34 | − | + | + | + |
| Brachyury | − | + | + | − |
| VE‐cadherin | − | + | + | − |
| AFP | − | − | + | − |
| Flt‐1 | − | + | + | + |
| Nestin | + | + | + | + |
| Transferrin | − | + | + | + |
| Beta‐actin | + | + | + | + |
Tested by immunohistochemistry (IHC) or RT‐PCR.
Nt, not tested; Normal, karyotypically normal chHES‐3 cells at P27; Aberrant, karyotypically abnormal chHES‐3 cells at P38; Normal EB, EB from karyotypically normal chHES‐3 cells at P27; Aberrant EB, EB from karyotypically abnormal chHES‐3 cells at P38.
In vitro differentiation of chHES‐3 cells with normal and abnormal karyotypes
The chHES‐3 cells with normal (P27) and abnormal (P38) karyotype developed into embryonic bodies (EB) in suspension culture after 7 days (Fig. 2a). Seven‐day‐old EBs were replated on dishes and cultured in the same medium; various cell types appeared in the outgrowth after 15 days. Immunocytochemical analysis using antibodies against β‐tubulin (ectoderm), smooth muscle antigen (mesoderm) and alpha‐fetoprotein (endoderm) showed differentiation into all three embryonic germ layers by both normal and abnormal‐karyotype cells (Fig. 2b–d). Samples were removed from the cultures at 0, 1, 3 and 7 days of differentiation, and markers indicative of pluripotency (NANOG) and differentiation to endoderm (AFP), mesoderm (KDR) and ectoderm (PAX6) were assayed using real‐time PCR. Expression of NANOG decreased dramatically in 1 day, specially in the normal cells (Fig. 3a). AFP expression increased significantly after 3 days differentiation of the normal cells, but not in aberrant‐karyotype cells (Fig. 3b). Expression of the mesoderm marker, KDR, increased for 3 days, then decreased after 7 days, specially in karyotypically abnormal cells (Fig. 3c). Finally, PAX6 (ectoderm marker) expression increased significantly in 3 days differentiation in both types of HES cells, but increased more rapidly in the abnormal ones than in normal ones (Fig. 3d). Interestingly, this tendency for ectodermal lineage expression was also observed during suboptimal culturing in bFGF‐free culture medium on high‐density feeders. Karyotypically abnormal cells were easily maintained in an undifferentiation state compared to normal cells (Fig. 4a,b). However, the karyotypically abnormal cells exhibited a tendency for spontaneous differentiation into primary nerve cells, an ectodermal lineage. In contrast, cells near the border of the karyotypically normal colonies became linear and radiate, showing fibroblast‐like cell morphology (Fig. 4c,d). Expression data and culture observations suggest that although both normal and abnormal‐karyotype chHES‐3 cells were capable of differentiating into cells of all three embryonic germ‐layers after embryoid body formation, abnormal‐karyotype cells tended to commit to ectoderm.
Figure 2.
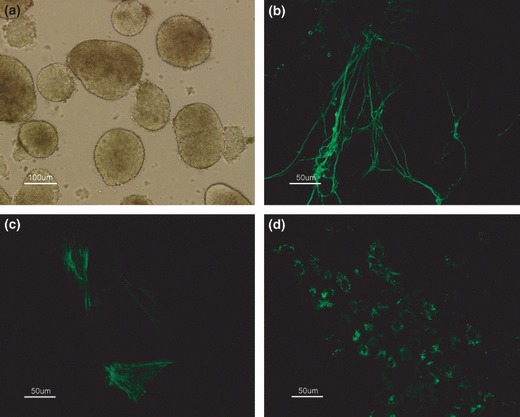
Differentiation of karyotypically abnormal chHES‐3 cells in vitro. (a) Embryoid body derived from karyotypically abnormal chHES‐3 cells. Results of immunocytochemical analysis, positive for ß‐tubulin (b), SMA (c) and AFP (d).
Figure 3.
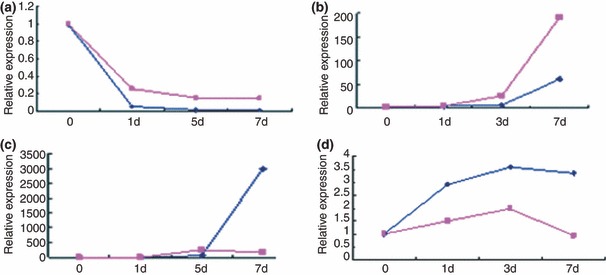
In vitro differentiation of chHES‐3 cells with normal and abnormal karyotypes. (a) Nanog, a marker of undifferentiated ES cells, (b) AFP, endoderm marker, (c) Pax6, ectoderm marker, and (d) KDR, mesoderm marker were assayed at each time point over a period of 7 days. Expression levels of the markers are shown relative to normal chHES‐3 cells on day 0 (Blue: The normal chHES‐3, red: The karyotypically abnormal chHES‐3).
Figure 4.
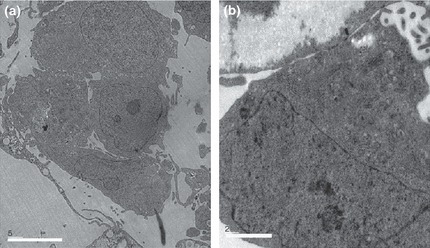
Ultrastructure of chHES‐3 cells with normal and abnormal karyotype. (a) Ultrastructure of karyotypically abnormal chHES‐3 cells shows them having high nucleus‐to‐cytoplasm ratio, while few cell organelles in the cytoplasm. (b) Electron‐dense lysosomal structures, mitochondria and Golgi bodies well developed in the cytoplasm.
Ultrastructure of karyotypically abnormal chHES‐3 cells
Compared to karyotypically normal chHES‐3 cells, karyotypically abnormal ones had fewer apoptotic cells, specially those close to the edge of colonies (not shown). In addition, fewer autophagosomes (found in almost a quarter of all of karyotypically normal chHES‐3 cells), were visible (not shown). However, electron‐dense lysosomal structures, mitochondria, Golgi bodies and endoplasmic reticular apparatus in cytoplasm of all appeared more developed in karyotypically abnormal cells (Fig. 5a,b).
Figure 5.
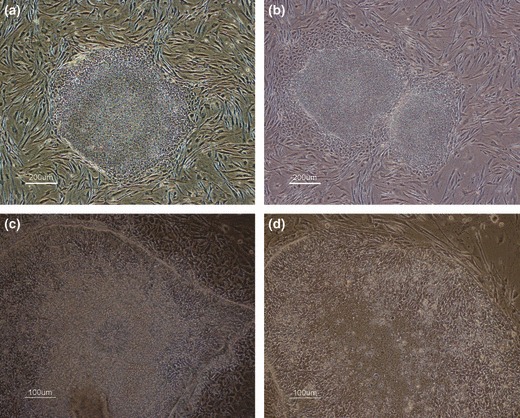
Growth morphology of chHES‐3 cells with normal and abnormal karyotype. (a) No differentiation at the periphery of colony in karyotypically abnormal chHES‐3 cells. (b) Obvious differentiation in normal chHES‐3 cells. (c) karyotypically abnormal chHES‐3 cells exhibiting capacity for extensive differentiation into primary nerve cells. (d) In karyotypically normal chHES‐3 cells, some at borders of colonies become linear and radiate, showing fibroblast‐like cell morphology.
Population growth characteristics of karyotypically normal and abnormal chHES‐3 cells in culture
Under abnormal ES culturing conditions (high density feeders, no bFGF), karyotypically abnormal chHES‐3 cells had substantially greater population growth rates and single colony formation efficiencies than normal chHES‐3 cells (Fig. 6a,b). In addition as predicted, karyotypically normal cells were more susceptible to differentiation and death under these conditions; after 5 days in culture, percentage of undifferentiated colonies was only 32 ± 1.60% (most were floating dead cells). In contrast, the percentage of undifferentiated colonies formed by karyotypically abnormal cells 5 days after passaging was 87 ± 2.4%, indicating that karyotypically abnormal cells resisted not only differentiation, but also death (most cells were viable, data not shown) (Fig. 6c).
Figure 6.
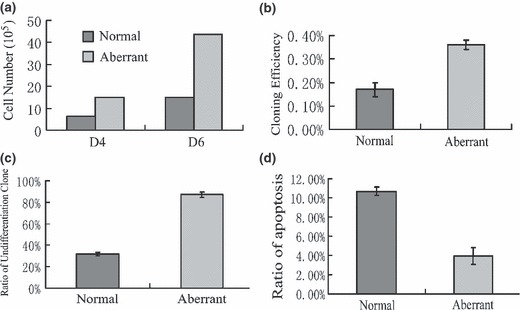
Growth characteristics of chHES‐3 cells with normal and abnormal karyotype. (a) Karyotypically aberrant chHES‐3 cells had substantially greater population growth rates than normal chHES‐3 cells. (b) Karyotypically aberrant chHES‐3 cells had higher single colony efficiencies. (c) In bFGF‐free medium, karyotypically aberrant chHES‐3 cells were susceptible to maintainance. (d) Apoptotic ratio in karyotypically normal (10.7 ± 0.45%) and abnormal chHES‐3 cells (3.96 ± 0.87%).
Indeed, comparison of spontaneous apoptosis between karyotypically normal and abnormal cells revealed that in normal chHES‐3 cells, the percentage of spontaneous apoptotosis was 10.7 ± 0.45% (mean values of three experiments), while karyotypically abnormal cells at passages 38, 39 and 40 showed apoptotic rates of 4.7%, 4.2% and 3.0% respectively (mean value 3.96 ± 0.87%) (Fig. 6d). Together, increase in population growth rate and decrease in rate of spontaneous differentiation and apoptosis suggest that the karyotypically abnormal cells, which arose after long‐term culturing, share properties with pre‐malignant tumourigenic cells.
Up‐regulation oncogenes in duplication regions
The 1p32–1p36 duplication spontaneously arising in karyotypically abnormal chHES‐3 cells suggests that dosage variation of the genome might confer these abnormal cells with higher potential for cell proliferation (2, 11) and could be an important event in malignant cell transition and genomic instability. Accordingly, we analysed expression of known oncogenes in the region, including HKR3, LCK, MPL, MYCL1, BLF, TAL1 and JUN, using semi‐quantitative PCR. Of these, expression levels of HKR3, LCK, JUN and TAL1 were up‐regulated in karyotypically abnormal chHES‐3 cells (Fig. S1).
Chromosomal distribution of differentially expressed genes between karyotypically abnormal and normal chHES‐3 cells
In order to determine whether expression of genes in karyotypically abnormal chHES‐3 cells may be associated with non‐random genomic amplification in certain hot‐spot areas, we performed gene chip (GSM172579 and GSM172580) analysis on karyotypically normal and abnormal cells (Fig. S2) and mapped chromosomal locations of differentially expressed genes. In comparison to normal chHES‐3 cells, down‐regulated genes in karyotypically abnormal ones were distributed randomly across all chromosomes (data not shown), while most up‐regulated genes were clustered in the duplication region of 1p32‐36 (Fig. 7a). Interestingly, after normalizing for the length of each chromosome, highly expressed genes in karyotypically abnormal chHES‐3 cells revealed that there was over‐representation of up‐regulated genes on chromosomes 1 and 17 (Fig. 7b and Table 2). However, adjusting for gene number of each chromosome, using UniGene clusters (Build 34, version 3) showed that there was over‐representation on chromosome 1 (Fig. 7c).
Figure 7.
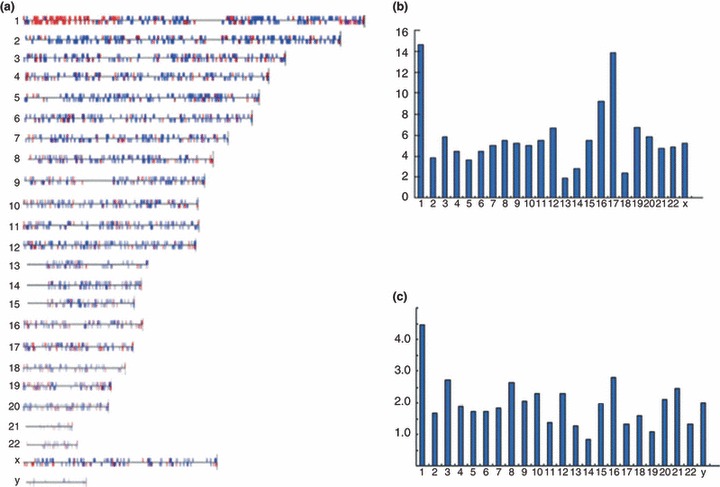
Chromosomal distribution of up‐regulated genes normalized by gene number and chromosome size. (a) Up‐regulated genes relatively clustered on duplication region of chromosome 1. (b) Distribution of up‐regulated genes per chromosome, normalized by size of chromosomes on each chromosome. Chromosome size acquired from Ensemble 7. (c) Distribution per chromosome normalized by number of UniGene clusters per chromosome. Number of UniGene clusters (Build 34, version 3) from NCBI.8.
Table 2.
Chromosomal distribution of the over‐expression genes in karyotypically abnormal chHES‐3 cells by normalizing with the length and numbers (UniGene clusters) of each chromosome
| chr | The number of up‐regulated genes | The relative length of the chromosome | The normalized number of gene expression by chromosome size | The number of genes per chromosome | The normalized ratios of gene expression by number of Unigene clusters per chromosome |
|---|---|---|---|---|---|
| 1 | 124 | 8.44 | 14.69 | 2776 | 0.0447 |
| 2 | 31 | 8.02 | 3.87 | 1866 | 0.0166 |
| 3 | 40 | 6.83 | 5.86 | 1473 | 0.0272 |
| 4 | 28 | 6.30 | 4.44 | 1164 | 0.0190 |
| 5 | 22 | 6.08 | 3.62 | 1281 | 0.0172 |
| 6 | 26 | 5.90 | 4.41 | 1528 | 0.0170 |
| 7 | 27 | 5.36 | 5.04 | 1474 | 0.0183 |
| 8 | 27 | 4.93 | 5.48 | 1025 | 0.0263 |
| 9 | 25 | 4.80 | 5.21 | 1207 | 0.0207 |
| 10 | 25 | 4.95 | 5.05 | 1094 | 0.0229 |
| 11 | 25 | 4.61 | 5.42 | 1841 | 0.0136 |
| 12 | 31 | 4.66 | 6.65 | 1355 | 0.0229 |
| 13 | 7 | 3.74 | 1.87 | 556 | 0.0126 |
| 14 | 10 | 3.56 | 2.81 | 1220 | 0.0082 |
| 15 | 19 | 3.46 | 5.49 | 961 | 0.0198 |
| 16 | 31 | 3.36 | 9.22 | 1108 | 0.0280 |
| 17 | 45 | 3.25 | 13.84 | 1442 | 0.0132 |
| 18 | 7 | 2.93 | 2.39 | 438 | 0.0160 |
| 19 | 18 | 2.67 | 6.74 | 1624 | 0.0110 |
| 20 | 15 | 2.56 | 5.86 | 717 | 0.0209 |
| 21 | 9 | 1.90 | 4.74 | 367 | 0.0245 |
| 22 | 10 | 2.04 | 4.90 | 756 | 0.0132 |
| X | 27 | 5.12 | 5.27 | 1344 | 0.0200 |
Expression of genes related to apoptosis in karyotypically normal and karyotypically abnormal chHES‐3 cells
Comparing gene profiles between karyotypically normal and karyotypically abnormal chHES‐3 cells, 35 genes related to apoptosis were found to be significantly differentially expressed. Among 11 genes which were up‐regulated, BNIP3, BIRC5, IER3, NME5, MIF and BNIP3L were anti‐apoptotic, hence negatively regulated apoptosis. Among 24 genes which were down‐regulated, TNFRSF19, CFLAR, F2R, BCLAF1, CASP7, PLAGL1, TIA1, CUL2, PAWR and BAX expression induces apoptosis and positively regulating it. However, the functions of eight further genes related to apoptosis remain unclear (Table 3). To verify results of microarray analysis, CASP3, CUL2, EP300 and TP53 were confirmed using real‐time PCR (Fig. 8a).
Table 3.
The expression of differentiation genes related to the apoptosis
| Gene | Change | Chromosomal location | Accession | Function |
|---|---|---|---|---|
| TNFRSF19 | D | chr13q12.11‐q12.3 | BF432648 | Positive |
| FKSG2 | D | chr8p11.2 | NM_021631 | Negative |
| UBE1C | D | chr3p24.3‐p13 | BM353142 | Regulation of apoptosis |
| CFLAR | D | chr2q33‐q34 | AF015451 | Positive |
| F2R | D | chr5q13 | NM_001992 | Positive |
| IGFBP3 | D | chr7p13‐p12 | M31159 | Apoptosis |
| BCLAF1 | D | chr6q22‐q23 | AA740754 | Positive |
| TRAF4 | D | chr17q11‐q12 | BF000155 | Regulation of apoptosis |
| CASP7 | D | chr10q25 | NM_001227 | Positive |
| MCL1 | D | chr1q21 | NM_021960 | Negative |
| PLAGL1 | D | chr6q24‐q25 | NM_002656 | Positive |
| TNFRSF18 | D | chr1p36.3 | AF117297 | Negative |
| TP53INP1 | D | chr8q22 | AW341649 | Apoptosis |
| TIA1 | D | chr2p13 | NM_022037 | Positive |
| SOCS2 | D | chr12q | NM_003877 | Negative |
| CUL2 | D | chr10p11.21 | U83410 | Positive |
| BNIP2 | D | chr15q22.2 | BC002461 | Negative |
| MAGI3 | D | chr1p12‐p11.2 | AI692181 | Apoptosis |
| CBX4 | D | chr17q25.3 | AI570531 | Apoptosis |
| CD40 | D | chr20q12‐q13.2 | X60592 | Negative |
| EP300 | D | chr22q13.2 | AV727101 | Regulation of apoptosis |
| PAWR | D | chr12q21 | NM_002583 | Positive |
| CASP3 | D | chr4q34 | NM_004346 | Apoptosis |
| BAX | D | chr19q13.3‐q13.4 | U19599 | Positive |
| BNIP3 | I | chr10q26.3 | U15174 | Negative/positive |
| BIRC5 | I | chr17q25 | BQ021146 | Negative |
| LGALS1 | I | chr22q13.1 | M14087 | Regulation of apoptosis |
| SEPT4 | I | chr17q22‐q23 | U88870 | Regulation of apoptosis |
| EGLN3 | I | chr14q13.1 | AI378406 | Apoptosis |
| BNIP3L | I | chr8p21 | AF060922 | Negative/positive |
| IER3 | I | chr6p21.3 | NM_003897 | Negative |
| NALP2 | I | chr19q13.42 | AF298547 | Apoptosis |
| ITGB3BP | I | chr1p31.3 | NM_014288 | Positive |
| NME5 | I | chr5q31 | NM_003551 | Negative |
| MIF | I | chr22q11.23 | NM_002415 | Negative |
Positive, positive regulation of apoptosis; Negative, negative regulation of apoptosis.
Figure 8.
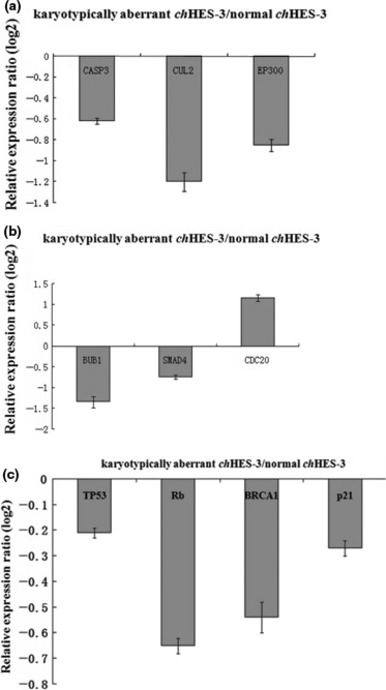
Relative expression level of genes between karyotypically normal and abnormal chHES‐3 cells. Relative expression ratio of genes related to apoptosis (a), cell proliferation (b) and genetic stability (c) in karyotypically abnormal chHES‐3 cells.
Expression of genes related to cell proliferation
Given the differences observed by cell population growth characteristics, it was reasoned that karyotypically normal and abnormal chHES‐3 cells would display additional differences in gene expression related to cell proliferation. Indeed, gene chip analysis revealed that among the differentially expressed genes, almost all including CDC25A, SMC1A, SMAD4, SKP2, RB1, PRKDC, PLK1, MCM4, MCM2, HDAC6, ESPL1, E2F5, DTX4, CHEK1, CDH1, CDC7, CDC14A, CCNE2, CCND2, BUB3, BUB1, ATM and ABL1 were down‐regulated; only HDAC1, CDC20, MAD2L2, PTTG1, CCNA1 and HDAC7A were up‐regulated. Interestingly, HDAC1, CDC20 and MAD2L2 all mapped to the region of 1p32–36. Results are summarized in Table S3. Differential expression of some genes (BUB1, SMAD4, RB1 and CDC20) was confirmed using real‐time PCR (Fig. 8b).
Analysis of cell cycle checkpoint signalling pathways
To further address the molecular mechanism of abnormal chHES‐3 cells, we looked more closely at cell cycle signalling pathways. G1 to S cell cycle transformation‐related genes including CDC2, TGFB1, MAD2L2, TRAF4 and NACA, were up‐regulated in karyotypically abnormal chHES‐3 cells, while cell cycle arrest‐related genes including GAS1, SESN3, PLAGL1 and CUL2 were down‐regulated except for MACF1, which was up‐regulated. In addition, four cyclin‐dependent kinase inhibitor genes (CDKN1A, CDKN1B, CDKN2A and CDKN2B) were down‐regulated. Within cell cycle checkpoint gene pathways, RB1, ATM, CHEK1, CDC25A, WEE1, BRCA1 and TP53 were all down‐regulated, while CDKN2A was equally expressed in karyotypically normal and abnormal cells. Decreased expression of TP53, RB1 and BRCA1 in the karyotypically abnormal chHES‐3 cells was confirmed using real‐time PCR (Fig. 8c). In addition, down‐regulation of TP53 protein in karyotypically abnormal cells was shown by Western blot analysis (Fig. S3).
Discussion
Several previous reports have indicated that the karyotype of HESCs may change during long‐term culture, usually acquiring an additional copy of chromosomes 1, 12, 17, or X (12, 13, 14, 15). These changes are similar to those found in germ cell tumours such as malignant embryonal carcinoma (16, 17). Karyotype, 46, XX dup (1p32–1p36) found in this study was different from those previously reported in HESCs. Interestingly, 1p32 and 1p36 are common sites of fragility, which has been shown often to be involved in chromosomal rearrangements arising in HESC (18).
Karyotype changes are known to affect the function of ES cells (19) and likewise, our results have shown that karyotypically abnormal chHES‐3 cells can be maintained easily in suboptimal conditions, had a higher ratio of single clone formation and lower‐bFGF dependence in vitro, compared to karyotypically normal ones, indicating that the karyotypically abnormal chHES‐3 cells had more self‐renewal capacity. There were some disparities in differentiation between karyotypically normal and abnormal chHES‐3 cells in vitro as abnormal ones easily differentiated into ectoderm, but normal chHES‐3 cells tended to differentiate into mesoderm and endoderm.
Identifying amplified genes in duplication regions of karyotypically abnormal chHES‐3 cells responsible for biological characteristics remains a challenge. Because some oncogenes, such as MYC, play an important role in maintaining the ES state (20), we examined expression of oncogenes located in the duplication region and found that, among genes up‐regulated in karyotypically abnormal chHES‐3 cells, HKR3, LCK, JUN and TAL1 are new promising candidates for ES state maintenance and induced pluripotent stem cell formation.
Characteristics of some visible structures in living human ES cell colonies are reported here. Compared to karyotypically normal chHES‐3 cells, karyotypically abnormal ones had higher nucleus/cytoplasm ratio and cytoplasmic components tended to be larger and more complex. In karyotypically abnormal chHES‐3 cells, organelles related to energy metabolism in the cytoplasm, such as lysosomal structures, mitochondria and Golgi apparatus were more developed. It seems that a switch in energy metabolism occurs from one based principally on aerobic respiration to the other based on both oxidative phosphorylation and aerobic glycolysis, as reported previously (21, 22), indicating that karyotypically aberrant chHES‐3 cells had higher energy metabolism, required for cell proliferation. These findings might hold the key to an explanation that karyotypically abnormal chHES‐3 cells had high proliferation aligned with energy metabolism level.
Another conceptually important question we asked is concerned with the mechanism of differential expression of so many genes in karyotypically aberrant chHES‐3 cells. Over‐representation of transcripts may not only be a result of true functional up‐regulation but also reflect gene–dosage effect caused by structural amplification (for example, duplication of parts of chromosome regions), specially when over‐represented genes appeared in clusters. Chromosomal distribution of genes up‐regulated in our samples revealed that this was not random. Two chromosomal regions of over‐expression were 1p and 17, which have often been reported in testicular germ cell tumours (23). However, in our study, only 1p duplications were detected, thus, we conclude that expression pattern observed in karyotypically abnormal chHES‐3 cells is likely to be the combined result of genomic amplification and increased transcriptional activation.
In somatic cells, P53 and RB signalling pathways play an important role in maintaining cell genetic stability (24). In cancer cells, these two pathways tend to be disregulated and lead to genetic instability (25, 26). In previous reports, ES cells were deficient in cell cycle checkpoints (27), but here P53 and RB were down‐regulated in karyotypically abnormal chHES‐3 cells, which may affect function of the G1 to S phase checkpoint and could result in increasing numbers of cells with aberrant genetic material entering the cell cycle. Thus, in the proliferating cell population, karyotypically abnormal chHES‐3 cells became dominant. Other studies have reported that P53 inhibited self‐renewal of ES cells and promoted ES cell differentiation and apoptosis (28, 29). In contrast, our studies suggest that in karyotypically aberrant chHES‐3 cells, down‐regulation of P53 enhances self‐renewal, anti‐differentiation and anti‐apoptosis. We hypothesize that, due to down‐regulation of P53, balance of self‐renewal, differentiation and genetic stability was deregulated; karyotypically abnormal chHES‐3 cells had more self‐renewal power, lower differentiation and weaker genetic stability.
Earlier studies of embryonal carcinoma and culture‐adapted HESCs has shown that adapted HESCs have a tendency to progress towards being cancer stem cells during long‐term culture (30). The mechanisms driving adaptation and selection of these variants in vitro might provide insight into the mechanisms underlying cancer stem cell progression (31). In the design presented in this study, deregulation of P53 leads to progression of genetic instability, and thus tumourigenic characteristics emerged in karyotypically abnormal chHES‐3 cells; these with tumourigenic characteristics may represent an excellent model for exploring early events leading from embryonic stem cells to cancer stem cells.
Supporting information
Fig. S1 Expression of oncogenes in duplication region of chHES‐3 cells
Fig. S2 Microarray data of chHES‐3 cells with normal and abnormal karyotype. (a) The Affymetrix Scan Image of karyotypically normal chHES‐3 cells. (b) Affymetrix Scan Image of karyotypically abnormal chHES‐3 cells. (c) Scatter graph of differentiated genes between karyotypicaly abnormal and normal chHES‐3 cells.
Fig. S3 Expression of P53 protein and beta‐actin in human embryonic fibroblasts, karyotypically normal and abnormal chHES‐3 cells.
Table S1 Primers of RT‐PCR
Table S2 Primers for Real‐time RT‐PCR
Table S3 The expression changes of cell proliferation‐related genes
Please note: Wiley‐Blackwell are not responsible for the content or functionality of any supporting materials supplied by the authors. Any queries (other than missing material) should be directed to the corresponding author for the article.
Supporting info item
Supporting info item
Supporting info item
Supporting info item
Acknowledgements
The authors thank Associate Prof. Jozef Lazar and Assistant Prof. Aron Geurts for revising and editing the manuscript. This study was supported by the National Natural Science Foundation Major Program of China (No. 30030070), the Hi‐Tech Research and Development of China (863 program No. 2003AA205181 and 2006AA02A102) and the National Basic Research Program of China (973 program No. 00CB 51010).
References
- 1. Thomson JA, Itskovitz‐Eldor J, Shapiro SS, Waknitz MA, Swiergiel JJ, Marshall VS et al. (1998) Embryonic stem cell lines derived from human blastocysts. Science 282, 1145–1147. [DOI] [PubMed] [Google Scholar]
- 2. Draper JS, Smith K, Gokhale P, Moore HD, Maltby E, Johnson J et al. (2004) Recurrent gain of chromosomes 17q and 12 in cultured human embryonic stem cell. Nat. Biotechnol. 22, 53–54. [DOI] [PubMed] [Google Scholar]
- 3. Lefort N, Feyeux M, Bas C, Féraud O, Bennaceur‐Griscelli A, Tachdjian G et al. (2008) Human embryonic stem cells reveal recurrent genomic instability at 20q11.21. Nat. Biotechnol. 26, 1364–1366. [DOI] [PubMed] [Google Scholar]
- 4. Spits C, Mateizel I, Geens M, Mertzanidou A, Staessen C, Vandeskelde Y et al. (2008) Recurrent chromosomal abnormalities in human embryonic stem cells. Nat. Biotechnol. 26, 1361–1363. [DOI] [PubMed] [Google Scholar]
- 5. Mitalipova MM, Rao RR, Hoyer DM, Johnson JA, Meisner LF, Jones KL et al. (2005) Preserving the genetic integrity of human embryonic stem cells. Nat. Biotechnol. 23, 19–20. [DOI] [PubMed] [Google Scholar]
- 6. Baker DE, Harrison NJ, Maltby E, Smith K, Moore HD, Shaw PJ et al. (2006) Adaptation to culture of human embryonic stem cells and oncogenesis in vivo. Nat. Biotechnol. 25, 207–215. [DOI] [PubMed] [Google Scholar]
- 7. Herszfeld D, Wolvetang E, Langton‐Bunker E, Chung TL, Filipczyk AA, Houssami S et al. (2006) CD30 is a survival factor and a biomarker for transformed human pluripotent stem cells. Nat. Biotechnol. 24, 351–357. [DOI] [PubMed] [Google Scholar]
- 8. Enver T, Soneji S, Joshi C, Brown J, Iborra F, Orntoft T et al. (2005) Cellular differentiation hierarchies in normal and culture‐adapted human embryonic stem cells. Hum. Mol. Genet. 14, 3129–3140. [DOI] [PubMed] [Google Scholar]
- 9. Xie CQ, Lin G, Luo KL, Luo SW, Lu GX (2004) Newly expressed proteins of mouse embryonic fibroblast irradiated to be inactive. Biochem. Biophys. Res. Commun. 315, 581–588. [DOI] [PubMed] [Google Scholar]
- 10. Livak KJ, Schmittgen TD (2001) Analysis of relative gene expression data using real‐time quantitative PCR and the 2‐ΔΔct methods. Methods 25, 402. [DOI] [PubMed] [Google Scholar]
- 11. Yang S, Lin G, Tan YQ, Zhou D, Deng LY, Cheng DH et al. (2008) Tumor progression of culture‐adapted human embryonic stem cells during long‐term culture. Genes Chromosomes Cancer, 47, 665–679. [DOI] [PubMed] [Google Scholar]
- 12. Buzzard JJ, Gough NM, Crook JM, Colman A (2004) Karyotype of human ES cells during extended culture. Nat. Biotechnol. 22, 381–382, author reply 382. [DOI] [PubMed] [Google Scholar]
- 13. Imreh MP, Gertow K, Cedervall J, Unger C, Holmberg K, Szöke K et al. (2006) In vitro culture conditions favoring selection of chromosomal abnormalities in human ES cells. J. Cell. Biochem. 99, 508–516. [DOI] [PubMed] [Google Scholar]
- 14. Inzunza J, Sahlén S, Holmberg K, Strömberg AM, Teerijoki H, Blennow E et al. (2004) Comparative genomic hybridization and karyotyping of human embryonic stem cells reveals the occurrence of an isodicentric X chromosome after long‐term cultivation. Mol. Hum. Reprod. 10, 461–466. [DOI] [PubMed] [Google Scholar]
- 15. Hoffman LM, Carpenter MK (2005) Characterization and culture of human embryonic stem cells. Nat. Biotechnol. 23, 699–708. [DOI] [PubMed] [Google Scholar]
- 16. Andrews PW (2002) From teratocarcinomas to embryonic stem cells. Philos. Trans. R. Soc. Lond. 357, 405–417. [DOI] [PMC free article] [PubMed] [Google Scholar]
- 17. Sandberg AA, Meloni AM, Suijkerbuijk RF (1999) Reviews of chromosome studies in urological tumors III. Cytogenetics and genes in testicular tumors. J. Urol. 155, 1531–1556. [PubMed] [Google Scholar]
- 18. Maitra A, Arking DE, Shivapurkar N, Ikeda M, Stastny V, Kassauei K et al. (2005) Genomic alterations in cultured human embryonic stem cells. Nat. Genet. 37, 1099–1103. [DOI] [PubMed] [Google Scholar]
- 19. Longo L, Bygrave A, Grosveld FG, Pandolfi PP (1997) The chromosome make‐up of mouse embryonic stem cells is predictive of somatic and germ cell chimaerism. Transgenic Res. 6, 321–328. [DOI] [PubMed] [Google Scholar]
- 20. Wernig M, Meissner A, Foreman R, Brambrink T, Ku M, Hochedlinger K et al. (2007) In vitro reprogramming of fibroblasts into a pluripotent ES‐cell‐like state. Nature 448, 318–324. [DOI] [PubMed] [Google Scholar]
- 21. Houghton FD, Thompson JG, Kennedy CJ, Leese HJ (1996) Oxygen consumption and energy metabolism of the early mouse embryo. Mol. Reprod. Dev. 44, 476–485. [DOI] [PubMed] [Google Scholar]
- 22. Martin KL (2000) Nutritional and metabolic requirements of early cleavage stage embryos and blastocysts. Hum. Fertil. 3, 247–254. [DOI] [PubMed] [Google Scholar]
- 23. Skotheim RI, Lothe RA (2003) The testicular germ cell tumour genome. APMIS 111, 136–150, discussion 150–151. [DOI] [PubMed] [Google Scholar]
- 24. Peter M, Herskowitz I (1994) Joining the complex: cyclin‐dependent kinase inhibitory proteins and the cell cycle. Cell 21, 181–184. [DOI] [PubMed] [Google Scholar]
- 25. Gorgoulis VG, Vassiliou LV, Karakaidos P, Zacharatos P, Kotsinas A, Liloglou T et al. (2005) Activation of the DNA damage checkpoint and genomic instability in human precancerous lesions Nature. Nature 434, 907–913. [DOI] [PubMed] [Google Scholar]
- 26. Nevins JR (2001) The Rb/E2F pathway and cancer. Hum. Mol. Genet. 10, 699–703. [DOI] [PubMed] [Google Scholar]
- 27. Mahendra R (2004) Conserved and divergent paths that regulate self‐renewal in mouse and human embryonic stem cells. Dev. Biol. 275, 269–286. [DOI] [PubMed] [Google Scholar]
- 28. Qin H, Yu T, Qing T, Liu Y, Zhao Y, Cai J et al. (2007) Regulation of apoptosis and differentiation by p53 in human embryonic stem cells. J. Biol. Chem. 282, 5842–5852. [DOI] [PubMed] [Google Scholar]
- 29. Lin T, Chao C, Saito S, Mazur SJ, Murphy ME, Appella E et al. (2005) P53 induces differentiation of mouse embryonic stem cells by suppressing Nanog expression. Nat. Cell Biol. 7, 165–171. [DOI] [PubMed] [Google Scholar]
- 30. Andrews PW (2006) The selfish stem cell. Nat. Biotechnol. 24, 325–326. [DOI] [PubMed] [Google Scholar]
- 31. Keith WN (2004) From stem cells to cancer: balancing immortality and neoplasia. Oncogene 23, 5092–5094. [DOI] [PubMed] [Google Scholar]
Associated Data
This section collects any data citations, data availability statements, or supplementary materials included in this article.
Supplementary Materials
Fig. S1 Expression of oncogenes in duplication region of chHES‐3 cells
Fig. S2 Microarray data of chHES‐3 cells with normal and abnormal karyotype. (a) The Affymetrix Scan Image of karyotypically normal chHES‐3 cells. (b) Affymetrix Scan Image of karyotypically abnormal chHES‐3 cells. (c) Scatter graph of differentiated genes between karyotypicaly abnormal and normal chHES‐3 cells.
Fig. S3 Expression of P53 protein and beta‐actin in human embryonic fibroblasts, karyotypically normal and abnormal chHES‐3 cells.
Table S1 Primers of RT‐PCR
Table S2 Primers for Real‐time RT‐PCR
Table S3 The expression changes of cell proliferation‐related genes
Please note: Wiley‐Blackwell are not responsible for the content or functionality of any supporting materials supplied by the authors. Any queries (other than missing material) should be directed to the corresponding author for the article.
Supporting info item
Supporting info item
Supporting info item
Supporting info item


