Abstract
Abstract. Generally, fibroblast‐like cells and other types of human cells have been used to demonstrate the principles of replicative senescence in vitro and in vivo. These cells go through three stages of proliferation, including vigorous proliferation, declining proliferation and quiescence or no proliferation. Any variation of this process occurring in osteoprogenitor cells may offer insight into the mechanism of age‐related osteopaenia that predisposes individuals to osteoporosis and bone fractures. We selected MC3T3‐E1 cells derived from mouse calvaria to study the mechanism of replicative senescence of pre‐osteogenic cells because: (i) these cells constitute a well‐known model for studying osteogenesis in vitro; (ii) they undergo a developmental sequence of proliferation and differentiation similar to primary cells in culture; and (iii) they show signs of replicative senescence. These cells were aged by multiple passaging before their use for studying growth kinetics and the effects of population density, effect of extracellular matrix (ECM), size and phases of the cell cycle. Our results show that (i) MC3T3‐E1 cells go through the first two stages of proliferation in a manner similar to human cells, but escape the quiescent phase; (ii) the rate of proliferation is similar for low passage (LP) and high passage (HP) cells, but is decreased in very high passage cells (VHP); (iii) growth inhibition is observed using HP cells seeded at high density; (iv) HP ECM stimulates proliferation of both LP and HP cells; (v) a small increase in cell size is observed in HP cells, but no change is seen in the distribution analysis of their cell cycle; (vi) distribution analysis of the cell cycle of VHP cells reveals a decreased and an increased frequency of cells in S and G2 + M phases of their cell cycle, respectively. These results suggest that the mouse MC3T3‐E1 cell line exhibits many of the cellular and molecular markers associated with replicative senescence in culture as defined by human cells, such as fibroblast‐like cells. Alteration in the sensitivity of MC3T3‐E1 cells to intercellular contact and increase in cell size are the primary factors contributing to decreased proliferation of HP cells.
INTRODUCTION
Evidence supporting replicative senescence has been derived from in vitro cultures using mainly human fibroblast‐like cells. On this basis, replicative senescence was hypothesized to exist in vivo. Thus, many tissues with accumulated senescent cells may be susceptible to age‐related deteriorative changes leading to pathologies (Campisi et al. 1996). If so, bone structures may be vulnerable to degenerative alteration because bone formation is a necessary process in remodelling.
Bone formation comprises the developmental progression of many cell types including stem cells, stromal mesenchymal cells, osteoprogenitor cells, committed preosteoblasts, osteoblasts and osteocytes (Aubin & Triffitt 2002). Bone homeostasis is maintained by the effects of physical forces, cytokines, growth factors and hormones, which mediate commitment and regulation of proliferation and differentiation of osteoprogenitor cells. During the process, various transcription factors sequentially activate and suppress genes required for bone development with peak bone mass occurring in young adult animals. Factors affecting this state of development include genetic background, lifestyle, nutrition, medical disorders and drugs (Wasnich 1999).
As individuals age, they lose bone (Rosen & Kiel 1999). This condition leads to osteopaenia and predisposes individuals to osteoporosis and bone fractures. The underlying mechanism of osteoporosis is an abnormality in bone remodelling (Mundy 1999), which is a process of replacing old bone with new. The sequence of events includes old bone resorption, osteoblast recruitment, matrix deposition and mineralization. Each cycle of this process is accompanied by an imperceptible deficit in bone formation. The deficit between resorption and formation becomes exaggerated with increasing age because of signalling impairment among bone cells. Thus, the fidelity of bone formation is compromised because of inadequate osteoblastogenesis.
The MC3T3‐E1 cell line is an immortalized (not transformed) cell line that shares phenotypic characteristics of fractions 3–5 of calvarial osteoblasts in primary culture (Towler & St. Arnaud 2002). The status of many of its genes including tumour suppressor genes and oncogenes has been described (Beck et al. 2001). This cell line is a well‐known model for studying osteogenesis in vitro (Sudo et al. 1983). It undergoes a developmental sequence of proliferation and differentiation resulting in bone formation (Quarles et al. 1992). This means that these cells synthesize DNA and collagen, deposit ECM on their growth surface, become a confluent monolayer, produce alkaline phosphatase and osteocalcin and undergo mineralization. Many differentiated functions of this cell line decrease with increasing cell passage number, suggesting that proliferation may be a target of ageing in vitro (Chung et al. 1999). As senescence in vitro may be reflective of senescence in vivo (Campisi et al. 1996), it is possible that MC3T3‐E1 cells may be used as a model to assess the effect of replicative senescence on proliferation during bone formation. Here, we present evidence that MC3T3‐E1 cells undergo replicative senescence in vitro.
MATERIALS AND METHODS
Cell cultures
MC3T3‐E1 cells (Dr G. Rodan Merck, Sharp and Dohme, West Point. PA, USA) were cultured under standard conditions. Stock cultures were initiated at a seeding density of 5 × 10³/cm2 in T flasks with a 25–75 cm2 growth area. Cells were passaged every 3–4 days in fresh medium [minimum essential medium, alpha modification (Sigma; St Louis, MO, USA) (Peterson & Yamaguchi 1996), 2 mm l‐glutamine (Sigma), 50 µg/ml gentamicin sulphate (Sigma), and 10% foetal bovine serum (FBS, Hyclone Laboratories, Logan, UT, USA)] after release with 1 × trypsin‐EDTA solution (Sigma). Cultures were maintained in a humidified incubator in a mixture of 95% air and 5% CO2 at 37 °C. Experimental cultures were established in 12‐well plates (3.88 cm2 growth area) or T flasks (25–75 cm2 growth area) in the presence or absence of ECM. Plates and flasks used for tissue culture (Costar, Cambridge, MA, USA) were made of polystyrene and supplied by the vendor as tissue culture treated plastic‐ware.
Cell number and viability
Standard procedure was used to enumerate cells and assess their viability. Medium from plate wells or flasks was removed, adherent cells were washed twice with phosphate‐buffered saline (PBS) and released with trypsin‐EDTA solution. Cell number and viability were determined by haemocytometer counting and trypan blue exclusion, respectively. A minimum of quadruplicate cultures was assessed for each treatment group.
Freezing and thawing cells
Cells were cultured for as many as 95 passages and frozen at various passage levels. Low passage (LP) cells ranging from passage 20 to passage 40 were frozen at passage 20. High passage (HP) cells ranging from passage 40 to passage 60 were frozen at passage 40. Very high passage (VHP) cells ranging from passage 60 to passage 95 were frozen at passage 60.
Freezing cells involved harvesting them as described above, suspending them at a concentration of 106/ml in freezing medium containing 10% dimethylsulphoxide (Sigma) and 20% FBS, aliquoting 1 ml of cell suspension into cryotubes (Nunc, Roskilde, Denmark), storing the cryotubes overnight at −80 °C, and transferring them to a liquid nitrogen container the next day. To thaw frozen cells, vials were removed from liquid nitrogen storage and immediately placed in a 37 °C water bath. The cell suspension was transferred to a 15‐ml tube and 5 ml of warm medium was added slowly to the tube while votexing at low speed. Aliquots of cell suspension were transferred to flasks containing additional medium and cultured under standard condition. Complete medium changes were performed after 2 and 24 h of culture.
Analysis of population doubling
Once cultures were initiated in T‐25 flasks at a seeding density of 1.25 × 10³/cm2, the cells were subcultured every 4 days at the same seeding density. The population doubling (Gibson et al. 1998) at each passage was calculated using the total number of cells seeded and the total number of cells harvested according to the following equation:
Preparation of ECM
Cultures were established in certain wells of 12‐well plates at a seeding density of 5 × 10³/cm2. The remaining wells were used as medium control wells. After 10 days of incubation at 37 °C, medium was removed from all wells, the wells were washed twice with PBS and 1 ml of ammonium hydroxide (0.05 m) was used to lyse cells in wells containing monolayers (Guenther & Fleisch 1990). Following a 30‐min incubation period at 37 °C, the ECM was washed twice with PBS and twice with medium before fresh cells were added to all wells for study.
Flow cytometry
Flow cytometry was performed employing a fluorescence activated cell sorter from Becton Dickinson Immunocytometry Systems (BDIS; San Jose, CA, USA), model FACSVantage™ SE. The instrument is equipped with an INNOVA™ Enterprise™ argon ion laser (Coherent, Santa Clara, CA, USA) with ultraviolet and 488 nm excitation light source. For the studies reported, the 488 nm laser output was employed as the light source. Fluidics for the system were purchased from BDIS. Operation of the flow cytometer was controlled with an Apple Macintosh computer with CELLQuest software.
Cells for DNA analysis were fixed with methanol and the DNA stained with propidium iodide as previously described by (Anne Hurley, BDIS). Briefly, cells (approximately 1 million per ml) in a 1‐ml volume were mixed by drop‐wise addition of 2 ml of cold methanol, while mixing the cells on a vortex mixer. Cells in methanol were stored in a refrigerator at 4 °C overnight (note, 30 min is minimum fixation time). On the day of analysis, the cell suspension was centrifuged, the methanol layer removed and 0.5 ml of stain solution containing propidium iodide (100 µg/ml), Triton X‐100™ (0.1%, v/v) and EDTA (37 µg/ml) in PBS was followed by 0.5 ml of a ribonuclease solution (2 mg/ml in PBS). The samples were incubated in the dark at room temperature (23 °C) for 30 min and then placed in an ice bath and analysed by flow cytometry within 1 h, employing a FACSVantage‘ SE instrument and CELLQuest sofware. DNA analysis was performed employing the version 2.0 ModFit LT software (Verity Software House, Inc., Topsham, ME, USA) with doublet correction through windowing.
Statistical analysis
Cell count data were expressed as the mean ± the standard error of the mean (SEM). The per cent of cells in phases of the cell cycle was expressed as the mean ± the range. The statistical significance was determined by applying a two‐tailed Student's t‐test or anova.
RESULTS
Proliferation of LP, HP and VHP MC3T3‐E1 cells
This study was initiated to determine whether cell passage number altered the kinetics of proliferation of MC3T3‐E1 cells. No difference was observed in the growth kinetics of passage 25 and passage 42 cells during the first 6 days of culture (population doubling time, 15 h). However, beyond this time, differences were observed with increasing time of culture resulting in a 2.0‐fold decrease in cell number in cultures of passage 42 cells on day 11 (Fig. 1). It is possible that higher passage cells would show greater alteration in growth kinetics, even during the first 6 days of culture. Therefore, a study was performed to compare the growth kinetics of passage 30 (p30) and passage 65 (p65) cells during the first 5 days of culture. Decreased growth rate was observed as early as 2 days using passage 65 cells (Fig. 2, population doubling times for p30 and p65 were 15 and 20 h, respectively). These observations suggest that cell passage number contributes to decreased proliferation of MC3T3‐E1 cells.
Figure 1.
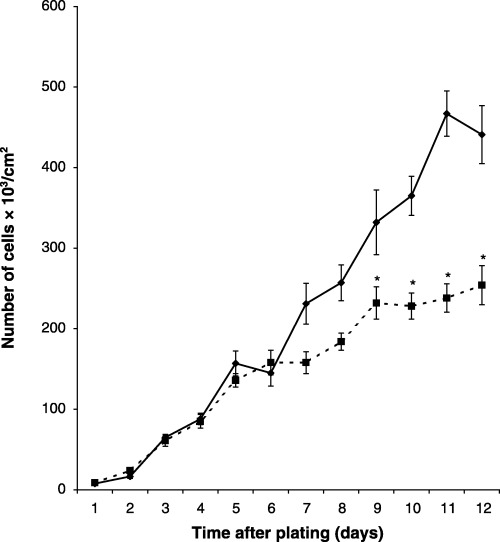
Comparative growth kinetics of LP and HP MC3T3‐E1 cells. Wells in 12‐well plates were seeded with 5 × 10³/cm2 and cell counts were assessed daily for 12 days (◆, passage 25 cells; ▪, passage 42 cells). The population doubling time for both curves was 15 h. The data represent the mean of sextuplicate samples ± the standard error of the mean. *Significance (P < 0.04).
Figure 2.
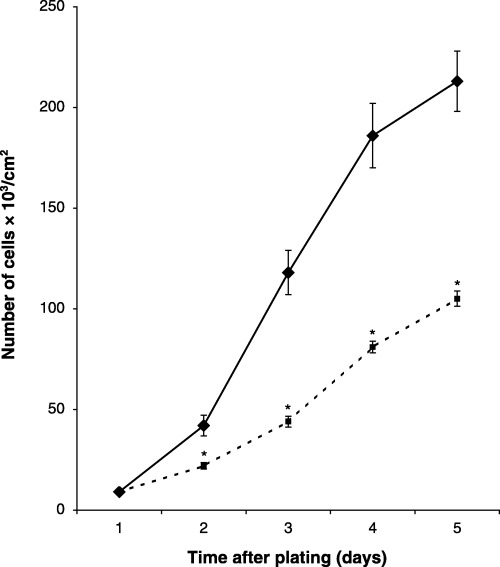
Comparative growth of LP and VHP MC3T3‐E1 cells. Wells of 12‐well plates were seeded with 5 × 10³/cm2 and cell counts were assessed daily for 5 days (◆, passage 30 cells; ▪, passage 65 cells). The population doubling time for p30 and p65 cells was 15 and 20 h, respectively. The data represent the mean of sextuplicate samples ± the standard error of the mean. *Significance (P < 0.01).
Relationship of cell passage number and population doubling
Because population doubling is considered a more stringent method of assessing cell proliferation, the next study relates the number of cell population doubling to cell passage number (Fig. 3). Decreased population doubling was observed in cell cultures beyond passage 36. These results confirm decreased proliferation of MC3T3‐E1 cells with increasing cell passage number.
Figure 3.
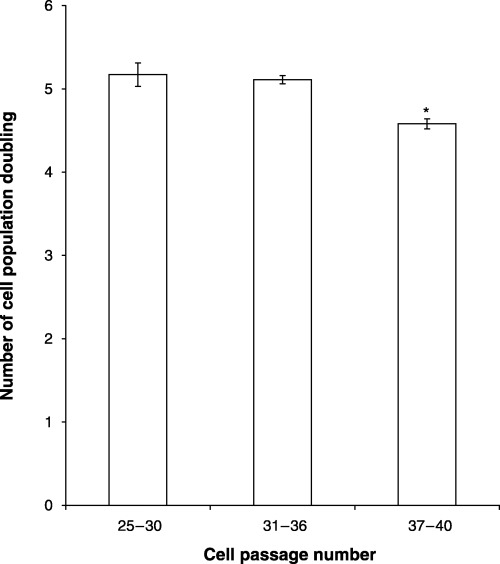
Effect of cell passage number on the population doubling of MC3T3‐E1 cells. Passage 25 cells were initially seeded into T‐25 flasks. Every 4 days the cells in each flask were counted, subcultured (1.25 × 10³/cm2) and the number of population doubling calculated. The data represent the mean of four to six samples ± the standard error of the mean. *Significance (P < 0.05).
Effect of population density on proliferation of LP and HP cells
The results in Fig. 1 show that when LP and HP cells are seeded at the same density, it takes 7 days before decrease in the rate of proliferation of HP cells is observed. Day 7 is the beginning of a critical period during the normal developmental sequence of LP cells undergoing osteogenesis in vitro. This is a time of decreased proliferation, increased density of cells, increased proportion of cells in the G0/G1 phase of the cell cycle, decreased proportion of cells in the S and G2 + M phases of the cell cycle, increased deposition of ECM and increased differentiation. Alteration in these processes may contribute to the diminished proliferative capacity of HP cells. First, we examined the possibility that increasing population density may decrease the proliferation rate of HP cells. Passage 25 and passage 42 cells were initially seeded at confluent‐culture density and the number of cells was assessed in each type of culture 1 and 4 days later. No difference was observed in the number of cells in these cultures 1 day after seeding. However, by 4 days after seeding, the number of cells in passage 42 cultures was only 65% of the number of cells in passage 28 cultures (passage 28 cells 509 ± 42; passage 42 cells 333 ± 31) (Fig. 4). This observation suggests that cell culture density contributes to the time‐dependent decrease proliferative capacity of HP cells.
Figure 4.
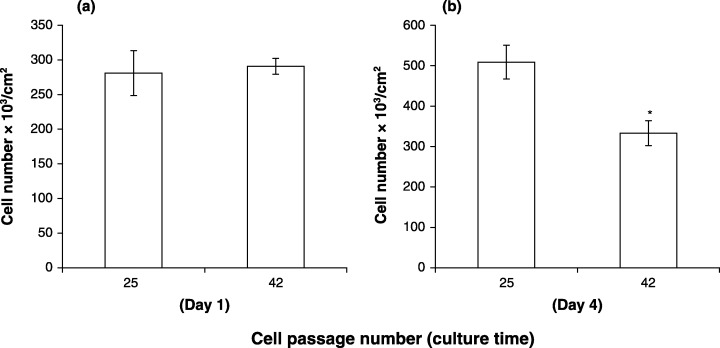
Effect of cell passage number on proliferation of cells seeded at confluent culture density. Wells in 24‐well plates were seeded at 3.4 × 10⁵/cm2. Cell counts were determined 1 and 4 days after plating. (a) One‐day cultures, (b) 4‐day cultures. The data represent the mean of sextuplicate samples ± the standard error of the mean. *Significance (P < 0.01).
Effect of ECM on proliferation of LP and HP cells
The ECM contains many components capable of regulating proliferation of MC3T3‐E1 cells. It is conceivable that passage‐related alteration of the ECM may cause decreased proliferation of HP cells. LP or HP cells were cultured on LP or HP ECM and the number of cells counted. There was no effect of LP ECM on proliferation of LP or HP cells (Fig. 5). In contrast, HP ECM stimulated proliferation of both LP and HP cells (Fig. 6). These observations suggest that ECM is not responsible for decreased proliferation of HP cells.
Figure 5.
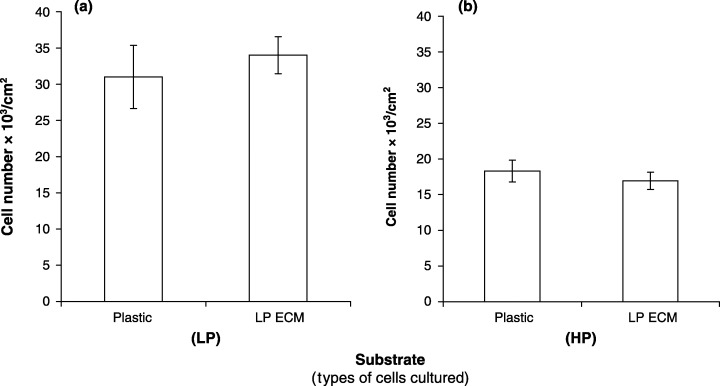
Effect of LP ECM on proliferation of LP and HP MC3T3‐E1 cells. Cultures for ECM were established using passage 27 cells. ECM was prepared 10 days later, re‐equilibrated with medium and re‐seeded with either LP or HP cells (5 × 10³/cm2). Untreated plastic wells serve as control wells. (a) LP cells, (b) HP cells. The data represent the mean of 18 samples ± the standard error of the mean.
Figure 6.
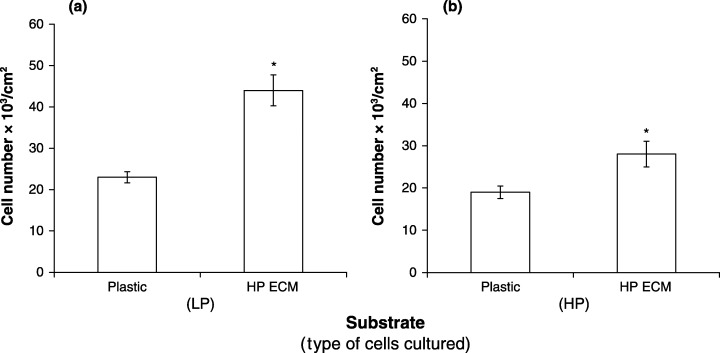
Effect of HP ECM on proliferation of LP and HP MC3T3‐E1 cells. Cultures for ECM were established using passage 48 cells. (a) LP cells, (b) HP cells. ECM was prepared, processed and assessed as described in Figure 5. *Significance (P < 0.05).
Effect of culture time on the size of LP and HP cells
Because the growth area of culture wells can only accommodate a limited cell mass, it is expected that alteration in cell size would be inversely related to the cell number unless cells are able to ‘pile up’ and form multiple layers. Thus, a 2‐fold increase in cell size could result in a 2‐fold decrease in cell number. We next determined whether an inverse relationship of cell size and cell number might contribute to the decrease in cell number in post‐6‐day cultures of HP cells. Cultures of passage 28 and passage 44 cells were assessed for change in cell size at intervals over a 13‐day culture period. Fig. 7 is a representative forward scatter flow cytometer assessment of size distribution profile observed in the experiments. An increase in cell size was observed on day 13. The peak size for passage 28 cells was 640 FSC units, whereas the peak size for passage 44 cells was 700 FSC units. These results suggest that the cells in cultures of passage 44 cells show a greater increase in size than cells in cultures of passage 28 cells. This difference in cell size may contribute to the decreased number of cells in post‐6‐day cultures of passage 44 cells.
Figure 7.
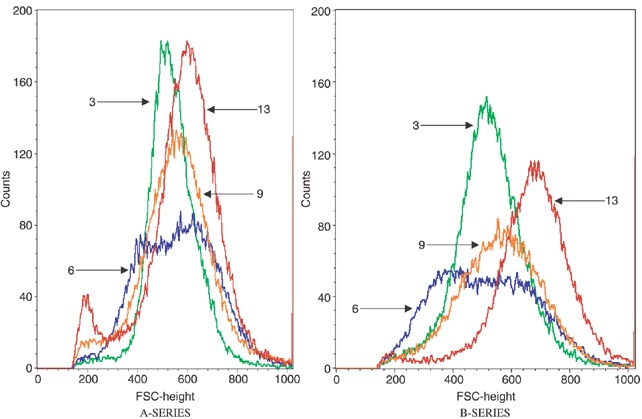
Effect of culture time and cell passage number on forward light scatter (FLS). Cultures were established in 12‐well plates. Progeny from each passage group were harvested and FLS, an indicator of cell size, was determined on days 3, 6, 9 and 13 as indicated by respective arrows in the figure. (A series), passage 28 cells; (B series), passage 44 cells.
Effect of culture time on the cell cycle distribution of LP, HP and VHP cells
Cell cycle analysis was performed because alteration in the dynamics of the cell cycling process may contribute to the decreased number of cells observed in 6‐day cultures of HP cells. Samples for this study were taken from the same cultures used for determination of change in cell size. Thus, cell cycle analysis was performed at intervals over a 13‐day culture period. The results are shown in1, 2. No difference was seen in the cell cycle distribution in cultures of passage 28 and passage 44 (Table 1) cells. One interesting observation common to both types of cultures is the change in frequency of cells in S phase over the 13‐day culture period.
Table 1.
Cell cycle analysis of passage 28 and 44 cells
| Day of assay | G0/G1 (%) | G2 + M (%) | S (%) | |||
|---|---|---|---|---|---|---|
| Passage 28 cells | Passage 44 cells | Passage 28 cells | Passage 44 cells | Passage 28 cells | Passage 44 cells | |
| 3 | 69 ± 12 | 71 ± 3 | 9 ± 4 | 10 ± 1 | 22 ± 7 | 18 ± 2 |
| 6 | 88 ± 3 | 90 ± 2 | 3 ± 2 | 3 ± 0.5 | 10 ± 1 | 7 ± 2 |
| 9 | 81 ± 9 | 92 ± 1 | 9 ± 9 | 4 ± 1 | 9 ± 1 | 5 ± 0.2 |
| 13 | 70 ± 7 | 79 ± 2 | 3 ± 1 | 2 ± 1 | 27 ± 7 | 19 ± 2 |
Table 2.
Cell cycle analysis of LP and VHP cells 4 days after culture
| Cell passage number | G0/G1 (%) | S (%) | G2 + M (%) |
|---|---|---|---|
| 32 | 49 ± 1 | 35 ± 2 | 16 ± 2 |
| 67 | 49 ± 5 | 25 ± 3 | 26 ± 3 |
We continued to search for changes in cell cycle distribution by comparing LP and VHP cells. In this study, cell cycle analysis was performed on day 4 of culture. The results are shown in Table 2. It can be seen that in both types of culture a similar frequency of cells exists in G0/G1 (49 ± 1 and 49 ± 5 for cultures of passage 32 and passage 67 cells, respectively). However, a decreased frequency of cells was observed in S phase (35 ± 2 and 25 ± 3 for cultures of passage 32 cells and passage 67 cells, respectively). In contrast, an increased frequency of cells was observed in G2 + M phase (16 ± 2 and 26 ± 3 for cultures of passage 32 and passage 67 cells, respectively). These results suggest that alteration of the cell cycle distribution affects proliferation of VHP cells only.
DISCUSSION
Replicative senescence has been studied mostly in various types of human cells, including glial cells, keratinocytes, vascular smooth muscle cells, lens cells, endothelial cells, lymphocytes and osteoblasts (Cristofalo & Pignolo 1993). Once these cells are established in culture, they undergo 40–60 population doublings and they pass through three distinct stages of proliferation. Stages 1, 2 and 3 are characterized by vigorous proliferation, declining proliferation and no proliferation, respectively. Even so, non‐proliferating cells in stage 3 are metabolically active and survive for indefinite periods of time.
MC3T3‐E1 cells are derived from mouse calvaria (Sudo et al. 1983). Although they are considered an immortalized (not transformed) cell line that is expected to reside in proliferation stage 1 indefinitely, our data show that they pass through both proliferation stages 1 and 2 when they are cultured. Thus, these cells undergo a truncated form of replicative senescence, making them a valuable tool for studying the effect of senescence on bone formation in vitro.
To better understand the mechanism of decreased proliferation of MC3T3‐E1 cells, we analysed growth kinetics, population density, ECM effects, cell passage number and various phases of the cell cycle. Our results show both similarities and differences when compared with results reported for studies using human cells such as fibroblasts. We first studied the log phase of growth because this is the most reproducible stage. This is a time when the growth fraction is at its highest and cells grow exponentially according to well‐known variables including seeding density, growth rate and density limitation (Freshney 1994). We retained constant seeding density in our kinetic experiments. Under this condition, there was no difference in the magnitude of proliferative activity and the doubling time of the curves for LP and HP cells. This result may explain why other investigators using MC3T3‐E1 have failed to show any difference in [3H]thymidine incorporation of LP and HP cells (Chung et al. 1999). However, we did find a decrease in proliferative activity and an increase in doubling time using VHP cells, suggesting diminution of their growth rate.
The stationary phase of growth begins at the end of the log phase when cells become confluent and exist in a steady state (Freshney 1994). ECM produced by MC3T3‐E1 cells during this phase stimulates proliferation of both LP and HP cells. In contrast, ECM produced by late passage fibroblasts has shown no effect on early passage (Cristofalo & Pignolo 1993) fibroblasts, suggesting that qualitative change in the ECM caused by in vitro ageing may be cell‐type specific, but does not obliterate growth. Here, growth inhibition was observed using HP cells seeded at high density in cultures containing normal levels of trypan blue positive cells. These results suggest that alteration in the nature of intercellular contact rather than increased frequency of cell death may contribute to reduction of cell number at saturation density. This interpretation is consistent with previous results showing decreased ability of HP cells to undergo gap junctional intercellular communication (Chung et al. 1999), thus indicating possible membrane abnormalities.
It is known that high passage number is associated with increased cell size and alteration of the cell cycle distribution (Cristofalo & Pignolo 1993; Campisi et al. 1996). An increase in the size of HP cells was observed in 13‐day cultures. This may be related to an increase in nuclear size, nucleolar size or multinucleation. Our data do not allow us to determine the involvement of one or all of these factors. However, it is expected that larger cells would contribute to a decreased number of cells in the culture vessel.
Only VHP cells showed alteration in cell cycle distribution analysis. A decreased frequency of cells was observed in the S phase, while an increased frequency was observed in the G2 + M phase. In contrast, late passage fibroblasts were blocked in late G1 phase near the G1/S border (Cristofalo & Pignolo 1993; Campisi et al. 1996), suggesting that the effect of in vitro ageing on the cell cycle distribution was cell‐type specific. This suggests that different molecular mediators responsible for cell cycle progression may be targets of in vitro ageing in late passage fibroblasts and MC3T3‐E1 cells. Growth arrest for fibroblasts in late G1 is facilitated by repression of G1/S genes, certain cyclins and cyclin‐dependent protein kinases (Cristofalo & Pignolo 1993; Campisi et al. 1996). Over‐expression of growth inhibitors is also a contributing factor for growth arrest of fibroblasts (Cristofalo & Pignolo 1993; Campisi et al. 1996). Alternatively, accumulation of MC3T3‐E1 cells in the G2 + M phase may be related to functional deficiencies and disregulation of cyclins A and B, cyclin‐dependent protein kinase (cdc2), and phosphoprotein phosphatase (cdc25), which are known to be important for progression of cells through G2 (Campisi et al. 1996; McDonald & El‐Deiry 2000; Obaya & Sedivy 2002).
In conclusion, MC3T3‐E1 cells exhibit many of the cellular and molecular markers associated with replicative senescence in culture as are defined in human fibroblasts. Their major limitation is the lack of a finite lifespan. However, as these cells are an accepted model for studying osteogenesis, their use in proliferation stages 1 and 2 may provide insight into the mechanism(s) of in vitro ageing, which may be reflective of ageing osteoblasts in vivo.
ACKNOWLEDGEMENT
This work was supported by The Department Of Veterans Affairs Medical Research Funds.
REFERENCES
- Aubin JE, Triffitt JT (2002) Mesenchymal stem cells and osteoblast differentiation In: Bilezikian JP, Raisz LG, Rodan GA, eds. Principles of Bone Biology, 2nd edn, 1, p. 59 San Diego: Academic Press. [Google Scholar]
- Beck GR Jr, Zerler B, Moran E (2001) Gene array analysis of osteoblast differentiation. Cell Growth Differ. 12, 61. [PubMed] [Google Scholar]
- Campisi J, Dimri G, Hara E (1996) Control of replicative senescence In: Schneider EL, Rowe JW, eds. Handbook of the Biology of Aging, 4th edn, p. 121 San Diego: Academic Press. [Google Scholar]
- Chung CY, Iida‐Klien A, Wyatt LE, Rudkin GH, Ishida K, Yamaguchi DT, Miller TA (1999) Serial passage of MC3T3‐E1 cells alters osteoblastic function and responsiveness to transforming growth factor‐β1 and bone morphogenetic protein‐2. Biochem. Biophys. Res. Commun. 265, 246. [DOI] [PubMed] [Google Scholar]
- Cristofalo VJ, Pignolo RJ (1993) Replicative senescence of human fibroblast‐like cells in culture. Physiol. Rev. 73, 617. [DOI] [PubMed] [Google Scholar]
- Freshney RI (1994) Culture of Animal Cells, 3rd edn, p. 281 New York: Wiley‐Liss. [Google Scholar]
- Gibson GE, Tofel‐Grehl B, Scheffold K, Cristofalo VJ, Blass JP (1998) A reproducible procedure for primary culture and subsequent maintenance of multiple lines of human skin fibroblasts. Age 21, 7. [DOI] [PMC free article] [PubMed] [Google Scholar]
- Guenther HL, Fleisch H (1990) Modulation of the osteoblastic phenotype by the extracellular matrix synthesized by clonal calvarial bone cells In: Cohn DV, Glorieux FH, Martin TJ, eds. Calcium Regulation and Bone Metabolism p. 400 Amsterdam: Elsevier Science Publishers. [Google Scholar]
- McDonald RE III, El‐Deiry WS (2000) Cell cycle control as a basis for cancer drug development. Int. J. Oncol. 16, 871. [PubMed] [Google Scholar]
- Mundy GR (1999) Bone remodeling In: Favus MJ, ed. Primer on the Metabolic Bone Diseases and Disorders of Mineral Metabolism, 4th edn, p. 30 Philadelphia: Lippincott Williams & Wilkins. [Google Scholar]
- Obaya AJ, Sedivy JM (2002) Regulation of cyclin‐Cdk activity in mammalian cells. Cell. Mol. Life Sci. 59, 126. [DOI] [PMC free article] [PubMed] [Google Scholar]
- Peterson WJ, Yamaguchi DT (1996) Cell density downregulates DNA synthesis and proliferation during osteogenesis in vitro . Cell Prolif. 29, 665. [DOI] [PubMed] [Google Scholar]
- Quarles LD, Yohay DA, Lever LW, Caton R, Wenstrup RJ (1992) Distinct proliferation and differentiation stages of mouse MC3T3‐E1 cells in culture: an in vitro model of osteoblast development. J. Bone Miner. Res. 7, 683. [DOI] [PubMed] [Google Scholar]
- Rosen CJ, Kiel DP (1999) The aging skeleton In: Favus MJ, ed. Primer on the Metabolic Bone Diseases and Disorders of Mineral Metabolism, 4th edn, p. 57 Philadelphia: Lippincott Williams & Wilkins. [Google Scholar]
- Sudo H, Kodama H, Amagai Y, Yamamoto S, Kasai S (1983) In vitro differentiation and calcification in a new clonal osteogenic cell line derived from new born mouse calvaria. J. Cell Biol. 96, 191. [DOI] [PMC free article] [PubMed] [Google Scholar]
- Towler DA, St. Arnaud R (2002) Use of cultured osteoblastic cells to identify and characterize transcriptional regulatory complexes In: Bilezikian JP, Raisz LG, Rodan GA, eds. Principles of Bone Biology 2, 2nd edn, p. 1503 San Diego: Academic Press. [Google Scholar]
- Wasnich RD (1999) Epidemiology of osteoporosis In: Favus MJ, ed. Primer on the Metabolic Bone Diseases and Disorders of Mineral Metabolism, 4th edn, p. 257 Philadelphia: Lippincott Williams & Wilkins. [Google Scholar]


