

Abstract
Abstract. Salicylates are novel biologically active compounds that exhibit multiple therapeutic activities. The anti‐cancer effectiveness of calcium salicylate has been investigated on human HT‐1080 fibrosarcoma cell lines at relatively low concentrations (predominantly 0.4 mm) compared to those previously reported. Although low calcium salicylate concentrations did not retard tumour growth progression significantly, as measured by 3‐(4,5‐dimethylthiazol‐2‐yl)‐2,5‐diphenyltetrazolium bromide (MTT) and time‐lapse assays, its cytotoxic characteristics were proven to be prominent by various morphological and immunocytological techniques. The results here demonstrate evidence for approximately 25% apoptosis after treatment with calcium salicylate, which up‐regulatd the expression of p53, p21 and Bax, and down‐regulated Bcl‐2 in HT‐1080 cells.
INTRODUCTION
Cell viability and proliferation
Various physiological and environmental factors may alter the way in which healthy or alternatively abnormal cells divide. It is advantageous that the cell cycle of abnormal cells, for example cancer cells, can be changed to slow or stop cell proliferation. This process forms part of the physiological response to chemotherapeutic drugs. Various biologically active molecules, like salicylates are capable of modulating cell proliferation and are potentially important determinants for chemotherapy. Experimental data suggest that acetylsalicylic acid – aspirin – treatment retards the growth of various cancer cell lines in vitro (Shiff et al. 1996; Marra et al. 2000; Perugini et al. 2000; Brooks et al. 2003) and in vivo (Raz 2002). These results and many others, have encouraged the revival of interest in the clinical and pharmacological effects of salicylates (Funkhouser & Sharp 1995; Wong et al. 1999; Smith et al. 2000; Hector et al. 2001; Claudia 2003; Mahdi et al. 2006). This is particularly true in the treatment of colorectal cancer, with the potential for the use of acetylsalicylic acid and other non‐steroidal anti‐inflammatory drugs as chemopreventive molecules.
Experimental in vitro assessment of the utility of acetylsalicylic acid as an anti‐cancer agent have been largely performed using relatively high concentrations (5–10 mm) of the drug (Santini et al. 1999; Marra & Liao 2001). However, high concentrations of acetylsalicylic acid, particularly in the cancer‐preventative setting, would be contra‐indicated because of the reported complication of impaired cardiac function (Patrono et al. 2004). In this context, the in vivo relevance and significance of reports on the effects of high in vitro concentrations of acetylsalicylic acid have been questioned (Frantz & O’Neill 1995; Yin et al. 1998; Raz 2002; Mahdi et al. 2005). Pharmacologically, the therapeutic concentration of acetylsalicylic acid required to achieve selective inhibition of cyclo‐oxygenase‐2 (cox‐2) transcription in fibroblasts and endothelial cells, is 0.04–0.05 mm (Xu et al. 1999). Thus, this study has been undertaken to investigate the anti‐cancer effects of (mostly) 0.4 mm calcium salicylate (CaSa) on cell growth progression of HT‐1080 human fibrosarcoma cell lines.
MATERIALS AND METHODS
The human fibrosarcoma cell line HT‐1080 was used as a model of human malignancy in this study. These cells are characterized as adherent fibroblast sarcoma cells that grow in a monolayer. All experiments were carried out in optimal Dulbecco's Minimum Essential Medium (DMEM; Gibco, Paisley, UK) supplemented with 10% (v/v) foetal calf serum (FCS), gentamycin solution 1 ml/100 ml, 1% (v/v) l‐glutamine, 0.1% (v/v) HEPES buffer (1 m), 0.1% (v/v) sodium pyruvate (100 mm) (Gibco) and 0.1% (w/v) ascorbic acid.
Cells and in vitro culture conditions
Cultured cells were incubated in a 5% CO2 humidified atmosphere at 37 °C for 3 days in order to reach approximately 70% confluency. Growth of these HT‐1080 cells was continued for a further 24 h but with serum‐free DMEM before they were treated with salicylate analogues for 24 h at concentrations between 0.05 and 0.4 mm.
Measuring cell viability by 3‐(4,5‐dimethylthiazol‐2‐yl)‐2,5‐diphenyltetrazolium bromide (MTT) assay
Ninety‐six‐well plates (Coster, Cambridge, MA, USA) were seeded with HT‐1080 cells at a density of 2 × 10⁵ cells/ml equating to 20 000 cells/well in optimal DMEM. The cells were allowed to settle for 24 h and then were allowed to grow for further 48 h (about 70% confluent) before treatment at final concentration of 0.025–8 mm with CaSa for time points between 3 and 72 h unless otherwise indicated in the figures. Cells in wells were then treated for 1 h with 110 µl of pre‐warmed 10% MTT reagent (5 mg/mL stock solution in phosphate buffer saline (PBS) (Sigma‐Aldrich, Poole, UK), filter sterilized through a 0.22 µm filter) in FCS‐free DMEM. Finally, for each sample, the absorbance of the reduced intracellular formazan product was read at a wavelength of 575 nm in a Labsystems multiskan MS Version 3.0 (Helsinki, Finland).
Time‐lapse microscopy
Twelve‐well plates (Coster) were seeded with HT‐1080 cells at density of 1 × 10³ cells per well and cultured in optimal DMEM initially in regular plastic. Plates were incubated with standard culture conditions for 3 days in optimal DMEM prior to treatments. HT‐1080 cell populations were treated with CaSa in a range of different concentrations as earlier indicated. The plates were then incubated for 22 h on the stage of a Zeiss Axiovert 100 microscope (Zeiss, Welwyn Garden City, UK) fitted with a temperature‐regulating incubator system and CO2 supply (Solent Scientific, Portsmouth, UK). The camera, stage (XY) and focus (Z) were computer controlled via aqm 200 software (Kinetic Imaging, Wirral. UK). Tiff‐format images (512 × 512 pixels) were played back for analysis as movies using aqm 2000. The motorized XY microscope stage was from Prior Scientific (UK) and the phase transmission images (× 10 objective lens) were captured every 5 min over 22 h (264 frames per field) using an Orca I ER charge‐coupled device camera (Hammamatsu, Welwyn Garden City, UK). The image sequences taken by the time‐lapse microscope camera were viewed and analysed manually by counting the start and the end numbers of cells every 1 h, using lucida analyse‐6 software (Kinetic Imaging, Wirral. UK). lucida was also used to analyse the cell‐cycle parameters, then the first and second mitotic cycles for each treatment.
Flow cytometric analysis of HT‐1080 cell cycle
HT‐1080 cells were seeded in T‐25 flasks (Coster) at an initial density of 1 × 10³ cells per flask. Cells were cultured as described in previous discussions before being treated with CaSa for 2, 6, 12 or 24 h. In addition, control experiments were performed in which no CaSa was incorporated in the cultures.
At the end of each treatment, the cells were harvested by trypsinization, were centrifuged and re‐suspended in 200 µl of PBS. Aliquots (2 ml) of ice‐cold 70% ethanol were then added and the cells were vortexed prior to being cooled to −20 °C for 30 min. Subsequently, 100 µl of RNase (Sigma, UK) at a concentration of 1 mg/ml and 100 µl of propidium iodide (Biovision Incorporate, CA, USA) at a concentration of 0.4 mg/ml was added prior to incubation at 37 °C for 30 min. The cells were analysed using a FACSCalibur flow cytometer (Becton Dickinson, UK) and the percentages of cells in the different phases of the cell cycle were quantified using cylchred version 1.0.2 software (Terry Hoy, University Hospital of Wales, UK).
Morphology studies
HT‐1080 cells were grown on coverslips, in six‐well plates (Coster), at a density of between 1.25 × 10³ and 2 × 10³, always under the same conditions as described previously. After treatment, cells in each well were washed with 2 ml PBS and incubated for 10 min at room temperature before fixing with 2 ml of 4% formaldehyde in PBS for 10 min at room temperature, while the cells are attached to the coveslips. After fixation, the cells were washed again with PBS before being stained with one of the following dyes: diamidoino‐2‐phenylindole (DAPI), haematoxylin and eosin or methyl‐green/pyronin Y (Sigma‐Aldrich).
Immunoassay: annexin‐V apoptosis detection assay
The cells were seeded into six‐well plates (Coster) at an initial density of 1.25 × 10⁵ cells per well and were cultured as described previously. After treatment with 0.4 mm CaSa, the media containing non‐adherent cells were aspirated into centrifuge tubes and the cells were dissociated with 1 ml per well of warm (37 °C) cell dissociation buffer (previously diluted with 2 ml of warm DMEM) and incubated for 5–10 min. Adherent cells were gently scraped and pooled with the non‐adherent cells. They were all then pelleted by centrifugation at 200 g for 5 min, after which the supernatant was removed and the cells homogenized with 0.5 ml of 1× binding buffer (Clontech Laboratories Inc., Palo Alto, CA, USA). Cell suspensions were transferred into Eppendorf tubes and were centrifuged at 200 g for 5 min, the supernatant was removed and homogenized cells were re‐suspended in 50 µl of 1× binding buffer. Subsequently, 2 µl of fluorescein isothiocyanate‐labelled annexin‐V (Coster) was added to each tube and these were incubated for 15 min at room temperature in the dark. Immediately after incubation, 2.5 µl of propidium iodide (50 µg/ml of 1× binding buffer) (Sigma‐Aldrich) was added and incubated for a further 5 min at room temperature in the dark and samples were mounted in Vectashield (Vector Laboratories, Inc., Burlingame, CA, USA). The slides were examined using a fluorescence microscope (Leitz Laborlux 12; Leica, Milton Keynes, UK). Five random fields, each of 100 cells, were counted per slide and the percentage of apoptotic cells was assessed based on nuclear morphology (Rogers et al. 1996). Representative photographic images were taken using a photometrics FS camera and coolsnap image analysis software V1.2 (Rofer Scientific, Marlow, UK).
Western blot analysis
The cells in six‐well plates at 3 × 10⁴ initial cell density were cultured in DMEM and under standard conditions as described previously. After treatment for 24 h, the medium was removed and the cells were then washed with PBS to remove any remaining medium. Following this, 200 µL of 2× sample buffer (250 mm Tris‐HCl pH 6.8, 4% SDS, 0.006% bromophenol blue, 2%β‐mercaptoethanol; Pharmacia, Uppsala, Sweden) was added to each well and the cells were then harvested using a cell scraper. The CaSa was used to treat the cells in lysate buffer after which they were transferred to a 1.5 ml Eppendorph tube, heated at 100 °C for 10 min, cooled to room temperature, and centrifuged at 120 g for 5 min. The supernatant was further centrifuged at 4 °C and 16 000 g for 5 min to obtain a clear solution of protein mixture, which was used to measure the expression of p21, p53, Bcl‐2, Bax and tumour necrosis α by Western blotting. Total cell lysate protein concentrations were determined according to the method of Karlsson et al. (1994).
Statistical analyses
Statistical analyses were performed on the normally distributed data, using one‐way analysis of variance (anova) tests. Data values indicated as residual outliers by anova were appropriately removed and probability values (P < 0.05) were considered statistically significant for each test.
RESULTS
Cytotoxic effect of CaSas
The difference between the chemical structure of aspirin and salicylic acid (Fig. 1) is the presence of an acetate group in the aspirin structure. The viability of these HT‐1080 cells was studied using both the MTT assay and time‐lapse photographic microscopic analysis to investigate the effects of different concentrations of CaSa (0.025–8 mm) on cell cycle progression (2, 3). CaSa did not exhibit cytotoxic effects at low concentrations (0.025–1.2 mm) and the results show mitogenic activity with cell proliferation exceeding (by a maximum of 23%) those under control conditions. However, the rate of cell population change decreased by a maximum of 70% when the cells where exposed to 8 mm CaSa for 72 h. The overall cytotoxic effect of CaSa at 2–8 mm on HT‐1080 cell population growth increased in an concentration‐ and incubation period‐dependent manner (Fig. 2b). The question remained, whether relatively low concentrations (up to 0.4 mm) of CaSa are merely able to affect mitotic and cell cycle duration or are actively able to induce morphological and/or molecular evidence of apoptotic cell death.
Figure 1.
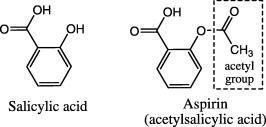
Chemical structures of salicylic acid and aspirin (acetylsalicylic acid).
Figure 2.
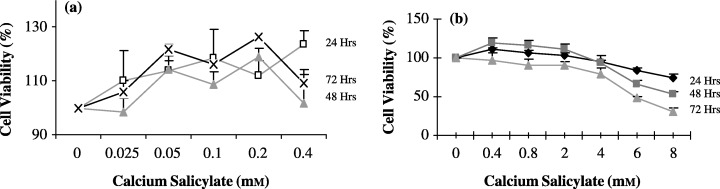
Concentration‐ and time‐dependent effects of CaSa on the viability of HT‐1080 cells. (a) 0–0.4 mm CaSa (b) 0.4–8 mm CaSa. Cells were grown in a 96‐well plate for different periods and drug concentrations (cell seeding density in = 2 × 10⁴ cells/well, 100 µl of optimal DMEM, growth under standard growth conditions). The data represent the mean ± SEM of three replicates. Cell viability was measured by MTT assay.
Figure 3.
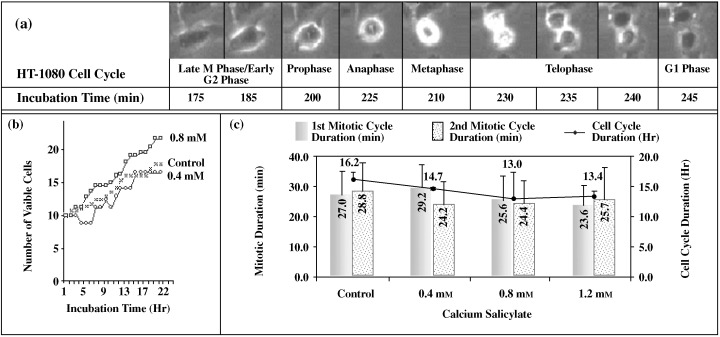
Human HT‐1080 fibrosarcoma cell tracking image for first*, second** mitotic cycle and cell cycle*** durations when cells were cultured for 22 h in the presence of different salicylates. (a) The series of images illustrates a sample of the mitotic process during the designated time events for different stages. (b) Concentration‐ and time‐dependent effects of CaSa on the growth rate of HT‐1080 cells. (c) A representation for the effect of CaSa (0.4, 0.8, 1.2 mm) on the duration of first, second mitotic cycles and cell cycle duration. *First mitotic duration refers to the observed HT‐1080 cells that underwent mitosis for the first time during the 22 h. The number of observed cells that completed the first mitotic cycle was: 44, 18, 44, 29, for the treatments in the graph, respectively, from left to right. **Second mitosis duration refers to the observed HT‐1080 cells that completed mitosis after the first mitosis during the 22 h of culturing. The number of observed cells was: 8, 6, 9, 7 for the treatment in this graph, respectively, from left to right. ***Cell cycle duration refers to the time from the end of first mitosis to the beginning of the second mitosis. The number of observed cells was: 16, 5, 12, respectively, from left to right. Comparison of different treatments using one way anova for: 1 – The first mitotic cycle duration (P value); CaSa 0.4 CaSa 1.2 (0.014). 2 – The cell cycle duration (P value): control/CaSa 1.2 (0.002); CaSa 0.4/CaSa 1.2 (0.014).
Cell cycle analysis and cell death
To evaluate the effects of CaSa on the cell cycle of these HT‐1080 fibrosarcoma cells, tracking of the captured images of cell population growth progress was used to analyse the duration of both the whole cell cycle and of mitosis. Population growth of the treated cells was monitored every 5 min, over a period of 22 h. Figure 3a demonstrates the mitotic sequence events typically observed. The series of micrographs illustrates the continuous process of the main stages of mitosis: prophase, metaphase, anaphase and telophase. Although the mitotic apparatus (spindle, microtubules) was not visible by low‐magnification light microscopy, the stages are easy to discern from sequential frames captured (Fig. 3a). The stages of the cell cycle were also prominent in the other categories, however, they indicated different values of phase duration (Fig. 3b). Treatment with CaSa did not seem to have any effect on the duration of the first mitosis, other than with concentrations from 0.4 mm and 1.2 mm (P < 0.014), which decreased the first mitotic duration by 12.6% (Fig. 3c). It also significantly decreased the cell cycle duration at 1.2 mm by 7.5% (P < 0.002) compared to the control experiment (Fig. 3c).
Furthermore, time‐lapse image capturing showed that cell cycle duration of untreated HT‐1080 cells was approximately 16 h (Fig. 3c). This result is consistent with the results of cell cycle analysis at the 24‐h time point where the percentage of cells in G0/G1 phase increased and those in S phase dropped over a 24‐h time course (Fig. 4). The graph clearly indicates that the DNA content during the G0/G1 phase was highest (36.5%) at 2‐h incubation, whereas the maximal percentage of cells in the S phase was after 12 h. After 12 h, the percentage of cells in both of these phases indicated the start of another cell cycle.
Figure 4.

FACS results of the cell cycle for untreated HT‐1080 cells (control). Cells were cultured under standard conditions, and arrested with serum‐free DMEM. Cells were then harvested at the indicated time points and were labelled with propidium iodide. Results are an average of two independent experiments.
Figure 5 shows that CaSa was found to affect HT‐1080 cell cycle in a concentration‐dependent manner at both G0/G1 and S phases, particularly between 6 and 12 h of treatment. The DNA content of G0/G1 phase, at 6 h of culturing, for example, increased by approximately 10% and 24% (control = 27.5%, 0.4 mm treatment = 30.3%; 0.8 mm treatment = 34.1%) when the treatment concentrations increased, respectively, from 0.4 to 0.8 mm compared to control. The increase in G0/G1 was continued when the cells were exposed to CaSa for 12 h compared to controls (Fig. 5). Alternatively, the percentage of cells in the S phase for the same period of exposure decreased, by between 5% and 16% compared to control, and by approximately 16% from 6 to 12 h exposure of 0.4 mm treatment; whereas the percentage increased by 6% for the same period with 0.8 mm concentration. Generally, these results did not show any specific changes in cell cycle phases.
Figure 5.
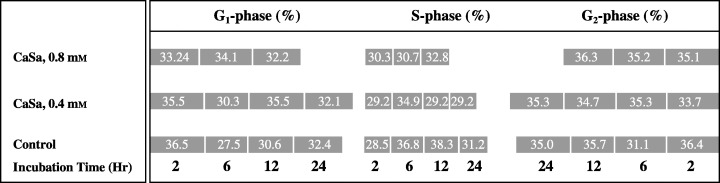
FACS results of the cell cycle for HT‐1080 cells treated with CaSa for 2, 6, 12 and 24 h. Cells were cultured under standard conditions, arrested with serum‐free DMEM treated with CaSa at the indicated time points and labelled with propidium iodide.
Morphological and immunocytochemical investigation of apoptosis
Figure 6 shows the morphological characteristics of treated HT‐1080 cells following exposure to mostly 0.4 mm of CaSa for 24 h. The DAPI, haematoxylin‐eosin and methyl green pyronin staining all clearly revealed morphological changes in the cells at mostly 0.4 mm or more CaSa (Fig. 6a,b). Typically, untreated cells retained their pseudopodial attachments with healthy confluent features. In contrast, CaSa‐treated cells showed various levels of cell death during the 24 h of incubation with the loss of pseudopodial attachments in a concentration‐dependent relationship (Fig. 6a,b). Results clearly showed morphological evidence for apoptosis based on the presence of the apoptotic bodies, cell blebbing, cell rounding and shrinkage.
Figure 6.
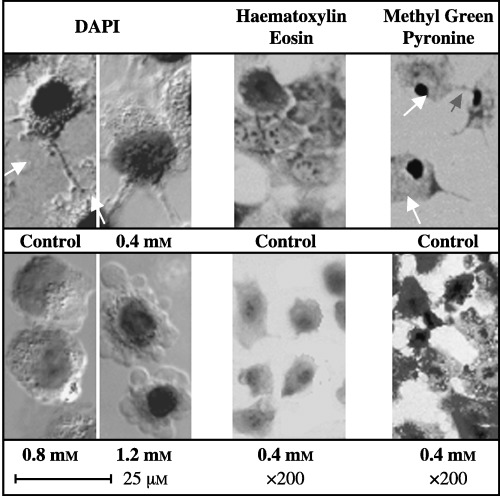
Differential staining of CaSa‐treated HT‐1080 cells. White arrows refer to filopodial attachment. The cells were grown at standard conditions and were treated for 24 h with the CaSa compound.
In order to verify the effect of CaSa on the induction of apoptosis in our cells, annexin‐V was used as an immunostain to identify early‐stage apoptosis. Figure 7 shows 0.4 mm CaSa‐treated HT‐1080 cells for 24 h. The number of apoptotic cells increased from 2.6% in the control sample to around 25.3% in the treated cells.
Figure 7.
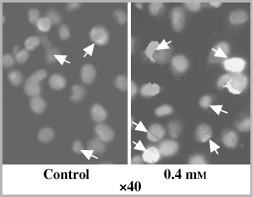
Immunohistochemical illustration for treated HT‐1080 cells labelled with annexin‐V and treated with 0.4 mm CaSa. White arrows refer to apoptotic cells.
To investigate the effect of CaSa on the molecular biology that governs cell cycle progression in HT‐1080 cells, the expression of four main proteins was analysed by Western blotting. Figure 8 shows the effect 0.05 mm and 0.4 mm of CaSa on the expression of p21, p53, Bax and Bcl‐2. These results indicated that CaSa increased the expression of p21, p53 and Bax by values ranging between 17% to 231% above the control at both 0.05 mm and 0.4 mm concentration. However, at the same concentrations, CaSa down‐regulated the expression of Bcl‐2 by 21%. A number of results were concentration‐dependent and showed significant differences (see Fig. 8).
Figure 8.

The effect 0.05 mm and 0.4 mm concentration of CaSa on the expression of p21, p53, Bax and Bcl‐2 in HT‐1080 cancer cells. Cells were cultured under standard conditions, arrested with 10% serum‐free DMEM and treated for 24 h. The data represent the mean ± SD of two independent gels for CaSa treatments and four control gels. One‐way anova (P value): p21‐control versus CaSa 0.4 mm (0.017); p53‐control versus CaSa 0.05 mm (0.004); Bax‐ 0.05 versus 0.4 mm CaSa (0.029), control versus 0.05 mm CaSa. (0.028), control versus 0.4 mm CaSa (0.005); BCl‐2‐control versus 0.05 mm CaSa (006), control versus 0.4 mm CaSa (0.07).
DISCUSSION
Acetylsalicylic acid, aspirin, has been extensively studied in the last three decades as a cancer chemopreventative agent and therapeutic drug (Funkhouser & Sharp 1995; Wong et al. 1999; Smith et al. 2000; Hector et al. 2001; Claudia 2003). However, CaSa, to our knowledge, has not been investigated as an apoptotic agent. It is advantageous to convert salicylic acid into its calcium salt, CaSa, to enhance its physical properties, mainly solubility in water and perhaps increase its uptake by cells. Furthermore, both calcium and salicylic acid may provide extra biological functions by inducing apoptosis. Preliminary experiments to detect CaSa uptake by atomic absorption and HPLC in HT‐1080 cells were not successful, perhaps because of the low sensitivity of both techniques.
Apoptosis is an integral biological process necessary for the development and homeostasis of multicellular organisms (Zou et al. 1997). Various apoptogenic agents, such as acetylsalicylic acid and salicylic acid itself, have been reported and found to exert apoptotic potential at commonly more than 1 mm concentration in different cell lines (Hial et al. 1977; Giardina et al. 1999; Eguchi‐Ishimae et al. 2001; Mahdi et al. 2006). Results here clearly show that CaSa induced apoptosis at low‐concentration levels when HT‐1080 cells were treated with mostly 0.4 mm for 24 h, which can be attributed to the combined effect of both calcium and salicylic acid. The level of apoptosis is likely to increase at higher concentrations. Evidence for apoptosis, triggered by CaSa was based on various techniques including morphology and molecular biological measurements. However, the mechanism by which apoptosis is induced remains unclear. DAPI, methyl green/pyronin, haematoxylin and eosin and Annexin‐V techniques were used to detect apoptosis. Results obtained from these experiments substantiate each other and confirm the apoptotic signs such as blebbing, cell rounding and shrinking as well as the increased presence of RNA in the cytoplasm, as shown by pyronin‐Y staining. These are classical signs of apoptosis, well illustrated in the literature (Wyllie et al. 1981; Smith et al. 1990; Ruschoff et al. 1998; Wong et al. 1999; Stark et al. 2001).
Generally, calcium ions serve as one of the intracellular signals that eventually lead to apoptosis (Vaux et al. 1992; Azmi et al. 1996). The accumulation of calcium inside the cell leads to activation of the calcium‐dependent endonuclease, which is responsible for the induction of the DNA fragmentation (Wyllie 1980; Walker & Sikorska 1997). Generally, cationic metal ions, such as Ca2+, and Mg2+ are capable of forming various ionic bonds with a range of cellular molecules (with anionic counter ions) under a strict stereochemical and conformational set up. Ionic bonding can occur, for example, with nucleic acids, which possess negative charges on the phosphate groups incorporated in both RNA and DNA molecular structures. Proteins also posses negative charges capable of bonding with cations. Both aspartate and glutamate, for example, are negatively charged, and hence, cations brought into the cell may create ionic bonds with proteins containing negatively charged amino acid moieties. However, it is not clear whether the chelated calcium remains bonded to salicylic acid or whether it complexes to another chemical species that has greater bonding or coordination affinity.
The difference between the chemical structure of aspirin and salicylic acid, as shown in Fig. 1, is the presence of an acetate group in the aspirin structure. This acetate group is vital for the irreversible inhibition of prostaglandin synthesis by cross‐acetylation of the serine moiety of cyclooxygenases or COX‐1 and COX‐2 (Shimokawa & Smith 1992; Vane & Botting 2003; Wu 2003). Over‐expression of COX‐2 leads to increased levels of prostaglandins, and hence promotes cellular proliferation, resistance to apoptosis and angiogenesis – processes that contribute to the emergence of the neoplastic phenotype (Husain et al. 2001; Munkarah et al. 2002; Masmoudi et al. 2004). The mechanism by which aspirin exerts its therapeutic effects against cancer was first established based on the inhibition of prostaglandin synthesis. However, the apoptotic potential of CaSa in this work cannot be related to the dependent‐prostaglandin classical inhibition mechanism that involves cross‐acetylation of the serine of cyclooxygenase moiety. However, the pathway by which CaSa induces apoptosis may not involve the dependent‐inhibition of prostaglandin synthesis. Indeed, there are various pathways for the apoptotic potential of aspirin. But the apoptosis induced by CaSa may occur through the p53‐intrinsic pathway, which involves pro‐ and anti‐apoptotic BCl‐2 proteins.
In this respect, the expression of various key proteins responsible for the regulation of physiological cell death by apoptosis was conducted here using Western blotting. These included both pro‐apoptotic proteins, such as p53, p21 and Bax, and the anti‐apoptotic protein, Bcl‐2. Although results of Western blotting analysis clearly indicated that CaSa up‐regulated p21, p53 and Bax, but not Bcl‐2; statistical analysis showed that not all treatments were significantly different (see Fig. 8). The expression of p53, Bcl‐2 family proteins and p21 has been demonstrated to occur in the process of apoptosis (Huang & Strasser 2000; Mayer et al. 2003). p21 Is a downstream gene regulated by the p53 gene, and both p21‐dependent and independent apoptosis have been identified (Tsao et al. 1998; Yoneda et al. 1998; Kuo et al. 2002). Induction of p21 altered the progression of the cell cycle and arrested cells at the G1 phase through blocking CDK4 activity, and the promotion of apoptosis (El‐Deiry et al. 1993). Additionally, activation of pro‐apoptotic Bcl‐2 family proteins, such as Bax and Bad or inactivation of anti‐apoptotic Bcl‐2 family proteins such as Bcl‐2 and Mcl‐1 have been shown to regulate the intrinsic apoptosis pathway (Green 2000; Reed 2000). Their expression is variable in normal and neoplastic human tissues, and their biological significance depends on the site of and type of tissue (Soini et al. 1999).
According to Jaattela (1999) and others (Oltvai et al. 1993; Sedlak et al. 1995; Reed 2000), the Bcl‐2/Bax ratio reflects cell sensitivity to apoptotic stimuli. A high Bcl‐2/Bax ratio is linked to poor prognosis and a high histological tumour grade (Brambilla et al. 1996; Gazzaniga et al. 1996), whereas a low Bcl‐2/Bax ratio is associated with a favourable histological grade and a better patient outcome in combination with a lack of relapse and sensitivity to chemotherapy (Aguilar‐Santelizes et al. 1996; Chresta et al. 1996; Gazzaniga et al. 1996). In this respect, the results here showed that the ratio of Bcl‐2 to Bax decreased upon exposing HT‐1080 cells to CaSa (0.05 mm 1 : 2.5, 0.4 mm 1 : 4.1) at 0.05 mm and 0.4 mm when cells were incubated for 24 h. Furthermore, the results in this study indicated that the ratio increased in a concentration‐dependent manner at 0.05 mm and 0.4 mm, indicating that apoptosis may be preceded via the Bax‐promoting effect. A study by Zhou et al. (2001) confirmed that the induction of apoptosis was mediated through Bax over expression without changes in Bcl‐2 expression.
In conclusion, although morphological and immunocytochemical investigation showed evidence for CaSa apoptotic potential, the effects on the expression of p21, p53, Bax and Bcl‐2 in the apoptotic pathway are still not clear, and further investigations are required in this respect.
ACKNOWLEDGEMENTS
We thank Dr Chris Pepper, Department of Haematology Wales School of Medicine for the flow cytometric analysis. We also thank Dr Andrew Waggett, and Dr Steve Luckman, School of Biosciences, Cardiff University for sharing his Western blot equipment and for the gift sample of HT‐1080 cell lines, respectively.
REFERENCES
- Aguilar‐Santelises M, Rottenberg ME, Lewin N, Mellstedt H, Jondal M (1996) Bcl‐2 Bax and p53 expression in B‐CLL in relation to in vitro survival and clinical progression. Int. J. Cancer 69, 114–119. [DOI] [PubMed] [Google Scholar]
- Azmi S, Dhawan D, Singh N (1996) Calcium ionophore A 23187 induces apoptotic cell death in rat thymocytes. Cancer Lett. 107, 97–103. [DOI] [PubMed] [Google Scholar]
- Brambilla E, Negoescu A, Gazzeri S, Lantuejoul S, Moro D, Brambilla C, Coll JL (1996) Apoptosis‐related factors p53, Bcl2 and Bax in neuroendocrine lung tumors. Am. J. Pathol. 149, 1941–1952. [PMC free article] [PubMed] [Google Scholar]
- Brooks G, Yu XM, Wang Y, Crabbe MJ, Shattock MJ, Harper JV (2003) Non‐steroidal anti‐inflammatory drugs (NSAIDs) inhibit vascular smooth muscle cell proliferation via differential effects on the cell cycle. J. Pharm. Pharmacol. 55, 519–526. [DOI] [PubMed] [Google Scholar]
- Chresta CM, Masters JRW, Hickman JA (1996) Hypersensitivity of testicular tumors to etoposide‐induced apoptosis is associated with functional p53 and high Bax/bcl‐2 ratio. Cancer Res. 56, 1834–1841. [PubMed] [Google Scholar]
- Claudia O (2003) Aspirin protects against cancer of the upper aerodigestive tract. Lancet Oncol. 4, 200. [Google Scholar]
- Eguchi‐Ishimae M, Eguchi M, Ishii E, Miyazaki S, Ueda K, Kamada N, Mizutani S (2001) Breakage and fusion of the TEL (ETV6) gene in immature B lymphocytes induced by apoptogenic signals. Blood 97, 737–743. [DOI] [PubMed] [Google Scholar]
- El‐Deiry WS, Tokino T, Velculescu VE, Levy DB, Parsons R, Trent JM, Lin D, Mercer WE, Kinzler KW, Vogelstein B (1993) WAF1, a potential mediator of p53 tumor suppression. Cell 75, 817–825. [DOI] [PubMed] [Google Scholar]
- Frantz B, O’Neill EA (1995) The effect of sodium salicylate and aspirin on NF‐B. Science 270, 2017–2018. [DOI] [PubMed] [Google Scholar]
- Funkhouser EM, Sharp GB (1995) Aspirin and reduced risk of esophageal carcinoma. Cancer 76, 1116–1119. [DOI] [PubMed] [Google Scholar]
- Gazzaniga P, Gradilone A, Vercillo R, Gandini P, Silvestri I, Napolitano M, Vincenzoni A, Gallucci M, Agliano AM (1996) Bcl‐2/Bax mRNA expression ratio as prognostic factor in low‐grade urinary bladder cancer. Int. J. Cancer 69, 100–104. [DOI] [PubMed] [Google Scholar]
- Giardina C, Boulares H, Inan MS (1999) NSAIDs and butyrate sensitize a human colorectal cancer cell line to TNF‐alpha and Fas ligation: the role of reactive oxygen species. Biochim. Biophys. Acta. 1448, 425–438. [DOI] [PubMed] [Google Scholar]
- Green DR (2000) Apoptotic pathways: paper wraps stone blunts scissors. Cell 102, 1–4. [DOI] [PubMed] [Google Scholar]
- Hector AA, Suzane I, Williams SR, Denis C, Jeanne LB (2001) Aspirin effects on endometrial cancer cell growth. Obstet. Gynecol. 97, 423–427. [DOI] [PubMed] [Google Scholar]
- Hial V, De Mello MC, Horakova Z, Beaven MA (1977) Antiproliferative activity of anti‐inflammatory drugs in two mammalian cell culture lines. J. Pharmacol. Exp. Ther. 202, 446–454. [PubMed] [Google Scholar]
- Huang DC, Strasser A (2000) BH3‐only proteins – essential initiators of apoptotic cell death. Cell 103, 839–842. [DOI] [PubMed] [Google Scholar]
- Husain SS, Szabo IL, Pai R, Soreghan B, Jones MK, Tarnawski AS (2001) MAPK (ERK2) kinase‐ a key target for NSAIDs‐induced inhibition of gastric cancer cell proliferation and growth. Life Sci. 69, 3045–3054. [DOI] [PubMed] [Google Scholar]
- Jaattela M (1999) Escaping cell death: survival proteins in cancer. Exp. Cell Res. 248, 30–43. [DOI] [PubMed] [Google Scholar]
- Karlsson JO, Ostwald K, Kabjorn C, Andersson M (1994) A method for protein assay in Laemmli buffer. Anal. Biochem. 219, 144–146. [DOI] [PubMed] [Google Scholar]
- Kuo P‐L, Lin T‐C, Lin C‐C (2002) The antiproliferative activity of aloe‐emodin is through p53‐dependent and p21‐dependent apoptotic pathway in human hepatoma cell lines. Life Sci. 71, 1879–1892. [DOI] [PubMed] [Google Scholar]
- Mahdi JG, Al Karaawi M, Pepper CJ, Bowen ID (2005) Sub‐milimolar concentrations of the novel phenolic compound JMC‐18 induces apoptosis in the human HT‐1080 fibrosarcoma cell line. European Cell Proliferation Society 27th meeting, Queen Mary, University of London 7th−10th September 2005.
- Mahdi JG, Mahdi AJ, Mahdi AJ, Bowen ID (2006) The historical analysis of aspirin discovery, its relation to the willow tree and antiproliferative and anticancer potential. Cell Prolif. 39, 147–155. [DOI] [PMC free article] [PubMed] [Google Scholar]
- Marra DE, Liao JK (2001) Salicylates and vascular smooth muscle cells proliferation: molecular mechanism for cell cycle arrest. Trends Cardiovasc. Med. 11, 339–344. [DOI] [PubMed] [Google Scholar]
- Marra DE, Simoncini T, Liao JK (2000) Inhibition of vascular smooth muscle cell proliferation by sodium salicylate mediated by up‐regulation of p21 Waf1 and p27 KiP1 . Circulation 102, 2124–2130. [DOI] [PubMed] [Google Scholar]
- Masmoudi Chevalier TL, Sabatier L, Soria JC (2004) Cyclooxygenase 2 inhibitors and cancer chemoprevention. Bull. Cancer Suppl. 91 (2): S77–S84. [PubMed] [Google Scholar]
- Mayer F, Stoop H, Scheffer GL, Scheper R, Oosterhuis JW, Looijenga LH, Bokemeyer C (2003) Molecular determinants of treatment response in human germ cell tumors. Clin. Cancer Res. 9, 767–773. [PubMed] [Google Scholar]
- Munkarah AR, Morris R, Baumann P, Deppe G, Malone J, Diamond MP, Saed GM (2002) Effects of prostaglandin E2 on proliferation and apoptosis of epithelial ovarian cancer cells. J. Soc. Gynecol. Invest. 9, 168–173. [PubMed] [Google Scholar]
- Oltvai ZN, Milliman CL, Korsmeyer SJ (1993) Bcl‐2 heterodimerizes in vivo with a conserved homolog, Bax, that accelerates cell apoptosis. Cell 74, 609–619. [DOI] [PubMed] [Google Scholar]
- Patrono C, Coller B, Fitzgerald GA, Hirsh J, Roth G (2004) Platelet‐active drugs: the relationships among dose, effectiveness, and side effects: the Seventh ACCP Conference on Antithrombotic and Thrombolytic. Ther. Chest. 126, 234S–264S. [DOI] [PubMed] [Google Scholar]
- Perugini RA, McDade TB, Vittimberga FJ, Duffy AJ, Callery MP (2000) Sodium salicylate inhibits proliferation and induces G1 cell cycle arrest in human pancreatic cancer cell lines. J. Gastrointest. Surg. 4, 24–33. [DOI] [PubMed] [Google Scholar]
- Raz A (2002) Is inhibition of cyclooxygenase required for the anti‐tumorigenic effects of nonsterolidal: anti‐inflammatory drugs (NSAIDs)? In vitro versus in vivo results and the relevance for the prevention and treatment of cancer. Biochem. Pharmacol. 63, 343–347. [DOI] [PubMed] [Google Scholar]
- Reed JC (2000) Mechanisms of apoptosis. Am. J. Pathol. 157, 1415–1430. [DOI] [PMC free article] [PubMed] [Google Scholar]
- Rogers HW, Callery MP, Deck B, Unanue ER (1996) Listeria monocytogenes induces apoptosis of infected hepatocytes. J. Immunol. 156, 679–684. [PubMed] [Google Scholar]
- Ruschoff J, Wallinger S, Dietmaie W, Bocker T, Brockhoff G, Hofstadte RF, Fishel R (1998) Aspirin suppresses the mutator phenotype associated with hereditary nonpolyposis colorectal cancer by genetic selection. Proc. Natl. Acad. Sci. USA 95, 11301–11306. [DOI] [PMC free article] [PubMed] [Google Scholar]
- Santini G, Sciulli MG, Marinacci R, Fusco O, Spoletini L, Pace A, Ricciardulli A, Natoli C, Procopio A, Maclouf J, Patrignani P (1999) Cyclooxygenase‐independent induction of p21WAF‐1/cip1, apoptosis and differentiation by L‐745,337, a selective PGH synthase‐2 inhibitor, and salicylate in HT‐29 cells. Apoptosis 4, 151–162. [DOI] [PubMed] [Google Scholar]
- Sedlak TW, Oltvai ZN, Yang E, Wang K, Boise LH, Thompson CB, Korsmeyer SJ (1995) Multiple Bcl‐2 family members demonstrate selective dimerizations with Bax. Proc. Natl. Acad. Sci. USA 92, 7834–7838. [DOI] [PMC free article] [PubMed] [Google Scholar]
- Shiff SJ, Koutsos MI, Qiao L, Rigas B (1996) Nonsteroidal antiinflammatory drugs inhibit the proliferation of colon adeno carcinoma cells: effects on cell cycle and apoptosis. Exp. Cell Res. 222, 179–188. [DOI] [PubMed] [Google Scholar]
- Shimokawa T, Smith WL (1992) Prostaglandin endoperoxide synthase. The aspirin acetylation region. J. Biol. Chem. 267, 12387–12392. [PubMed] [Google Scholar]
- Smith WL, Dewitt DL, Shimokawa T, Kraemer SA, Meade EA (1990) Molecular basis for the inhibition of prostanoid biosynthesis by nonsteroidal anti‐inflammatory agents. Stroke 21, IV24–IV28. [PubMed] [Google Scholar]
- Smith ML, Hawcroft G, Hull MA (2000) The effect of non‐steroidal anti‐inflammatory drugs on human colorectal cancer cells: evidence of different mechanisms of action. Eur. J. Cancer 36, 664–674. [DOI] [PubMed] [Google Scholar]
- Soini Y, Kinnula V, Kaarteenaho‐Wiik R, Kurttila E, Linnainmaa K, Paakko P (1999) Apoptosis and expression of apoptosis regulating proteins bcl‐2, mcl‐1, bcl‐X, and Bax in malignant mesothelioma. Clin. Cancer Res. 5, 3508–3515. [PubMed] [Google Scholar]
- Stark LA, Din FVN, Zwacka RM, Dunlop MG (2001) Aspirin induced activation of the NF‐êB signalling pathway: a novel mechanism for aspirin mediated apoptosis in colon cancer cells. FASEB J. 15, 1273–1275. [PubMed] [Google Scholar]
- Tsao Y‐P, Li S‐F, Liu J‐C, Chen S‐L (1998) Apoptosis is induced in aging SV40 T antigen‐transformed human fibroblasts through p53‐ and p21CIP1/WAF1‐independent pathways. Cancer Lett. 133, 77–82. [DOI] [PubMed] [Google Scholar]
- Vane JR, Botting RM (2003) The mechanism of action of aspirin. Thromb. Res. 110, 255–258. [DOI] [PubMed] [Google Scholar]
- Vaux DL, Aguila HL, Weissman IL (1992) Bcl‐2 prevents death of factor‐deprived cells but fails to prevent apoptosis in targets of cell‐mediated killing. Int. Immunol. 4, 821–824. [DOI] [PubMed] [Google Scholar]
- Walker PR, Sikorska M (1997) New aspects of the mechanism of DNA fragmentation in apoptosis. Biochem. Cell Biol. 75, 287–299. [PubMed] [Google Scholar]
- Wong BCY, Zhu GH, Lam SK (1999) Aspirin induced apoptosis in gastric cancer cells. Biomed. Pharmacother. 53, 315–318. [DOI] [PubMed] [Google Scholar]
- Wu KK (2003) Aspirin and other cyclooxygenase inhibitors: new therapeutic insights. Semin. Vasc. Med. 3, 107–1012. [DOI] [PubMed] [Google Scholar]
- Wyllie AH (1980) Glucocorticoid‐induced thymocyte apoptosis is associated with endogenous endonuclease activation. Nature 284, 555–556. [DOI] [PubMed] [Google Scholar]
- Wyllie AH, Beattie GJ, Hargreaves AD (1981) Chromatin changes in apoptosis. Histochem. J. 13, 681–692. [DOI] [PubMed] [Google Scholar]
- Xu X‐M, Sansores‐Garcia L, Chen X‐M, Matijevic‐Aleksic NM, Wu KK (1999) Suppression of inducible cyclooxygenase‐2 gene transcription by aspirin and salicylate. Proc. Natl. Acad. Sci. USA 96, 5292–5297. [DOI] [PMC free article] [PubMed] [Google Scholar]
- Yin MJ, Yamamoto Y, Gaynor RB (1998) The antiinflammatory agents aspirin and salicylate inhibit the activity of I (kappa) B kinase‐beta. Nature 396, 77–80. [DOI] [PubMed] [Google Scholar]
- Yoneda K, Yamamoto T, Osaki T (1998) p53‐ and p21‐independent apoptosis of squamous cell carcinoma cells induced by 5‐fluorouracil and radiation. Oral Oncol. 34, 529–537. [DOI] [PubMed] [Google Scholar]
- Zhou XM, Chun B, Wong Y, Fan XM, Zhang HB, Kung MCM, Fan DM, Lam SK (2001) Non‐steroidal anti‐inflammatory drugs induce apoptosis in gastric cancer cells through up‐regulation of Bax and Bak. Carcinogenesis 22, 1393–1397. [DOI] [PubMed] [Google Scholar]
- Zou H, Henzel WJ, Liu XA, Lutschg A, Wang X (1997) Apaf‐1, a human protein homologous to C. elegans CED‐4, participates in cytochrome c‐dependent activation of caspase‐3. Cell 90, 405–413. [DOI] [PubMed] [Google Scholar]