

Abstract
Fibrosis is characterized by loss of normal structure and function of a tissue or organ resulting from excessive fibroblast proliferation and extracellular matrix production. Currently, there is no efficient treatment for fibrosis. Herein, we test effects of the drug mithramycin, which targets the Sp1 family of transcription factors, on mRNA expression by human gingival fibroblasts. Mithramycin reduced expression of connective tissue growth factor and type I collagen mRNAs. Microarray profiling revealed that mithramycin selectively blocked expression of cell proliferation and transforming growth factor‐beta (TGF‐β) signalling clusters. These microarray data were validated using real‐time polymerase chain reaction and western blot analyses. Mithramycin suppressed expression of key profibrotic TGF‐β signalling mediators, Smad3 and p300, as well as cell proliferation. Taken together, these data suggest that the Sp1 family of transcription factors may contribute to expression of fibrogenic genes in human gingival fibroblasts; drugs targeting the Sp1 family may be beneficial in treatment of fibro‐proliferative diseases.
Introduction
Fibroblasts, dynamic cells responsible for secreting extracellular matrix (ECM) proteins, play essential roles in connective tissue remodelling and wound healing (1). These processes require de novo formation and contraction of connective tissue, which is composed of fibroblasts and ECM. When the tissue repair process is complete, there is a decrease in number of cells present. Complications associated with excessive fibroblast proliferation can result in fibrosis (2), and the term ‘fibro‐proliferative’ is thus often used to describe these conditions. Fibrosis can occur in skin, as well as in a number of internal organs and it results in loss of normal tissue or organ structure and function. One of the hallmarks of fibrosis is altered regulation of processes involved in degradation and biosynthesis of the ECM, which results in its accumulation and contraction (3). There are several types of fibro‐proliferative conditions and diseases, the most common ones including systemic sclerosis (scleroderma), lung fibrosis (idiopathic pulmonary fibrosis), renal fibrosis, liver fibrosis and gingival hyperplasia (hypertrophic gingivitis) (2). There are no effective medical treatments for fibro‐proliferative conditions and it is thus considered an unmet medical need (3).
Sp1 is a ubiquitous transcription factor that comes from a family of DNA‐binding proteins with a highly conserved C‐terminal zinc‐finger domain and it is known to bind GC boxes located at promoters of target genes (4). This protein has been implicated in basal expression of certain pro‐fibrotic genes such as CTGF (also known as CCN2), and ECM genes such as COL1A1 (5, 6, 7, 8, 9). In addition, a study by Hitraya et al. (10) demonstrated that fibroblasts from patients suffering from scleroderma had approximately three times more DNA‐binding activity by Sp1 at the COL1A1 promoter than do normal fibroblasts. This finding suggested an important role for Sp1 in tissue fibrosis. Mithramycin is a natural molecule that was first identified in the soil bacterium Streptomyces argillaceus and it has been used for treatment of tumour‐associated hypercalcaemia and testicular tumours (11). It is well established that mithramycin binds to the minor groove of DNA in GC‐rich regions and has been shown to interfere with binding and thus activity of the Sp1 transcription factor. Sp1 and mithramycin compete for binding to GC‐rich Sp1‐binding elements (12).
Mithramycin is capable of inhibiting CTGF; COL1A1 and COL1A2 gene expression in scleroderma fibroblasts (5, 13), however, overall effects of mithramycin on mRNA expression in normal fibroblasts are unknown. Moreover, a comprehensive study has never been previously conducted to determine which functional pathways or networks are impaired in normal fibroblasts in the presence of mithramycin. To address this issue, we tested effects of mithramycin on normal, human gingival fibroblasts.
Materials and methods
Cell culture and RNA isolation
Human gingival fibroblasts (HGF) were a kind gift of Douglas Hamilton (University of Western Ontario) and were cultured at 37 °C in high‐glucose Dulbecco’s modified Eagle’s medium (DMEM) supplemented with 10% foetal bovine serum and 1% antibiotic/antimycotic (Invitrogen, Burlington, ON, Canada). Mithramycin A (Sigma, St. Louis, MO, USA) was diluted in methanol to 1 mm concentration as specified by the manufacturer and used at 100 nm, a concentration previously shown to be maximally effective in reducing collagen expression in fibroblasts, without obvious side‐effects (13). After culturing HGFs overnight with an inhibitor (or vehicle control), media were removed, plates washed twice with Dulbecco’s phosphate‐buffered saline and RNA was harvested using Trizol (Invitrogen), as described by the manufacturer.
Real‐time PCR
Total mRNA was extracted from cells treated with mithramycin and from control cells, and expression levels of different pro‐fibrotic genes were determined using real‐time PCR (RT‐PCR) method described previously by Shi‐wen et al. (14). Briefly, 25 ng of RNA was reverse transcribed and amplified using One‐step Master Mix and detected using ABI prism 7900 HT (Applied Biosystems, Foster City, CA, USA). Inventoried assays‐on‐demand primers were used (Applied Biosystems) to detect Sp1, COL1A1, COL1A2, CTGF, Smad2, Smad3, p300, CENPF and CDK6 mRNAs. Human GAPDH expression was used in every experiment as internal control for data analysis. Four replicates were carried out for each primer reaction for a given sample (that is, for each primer set, four replicates being performed for each treated and control sample, for a total of eight reactions per primer set) and the average was used for data analysis. Three independent experiments were performed. Average values and standard deviations of these data are presented. Statistical analysis was performed using Student’s t‐test.
Expression profiling
Expression profiling was carried out at the London Regional Genomics Centre as described by Shi‐wen et al. (14). Total RNA was extracted using Trizol from 50% to 60% HGFs and quantified by spectrophotometry (Beckman, Mississauga, ON, Canada). One‐step real‐time PCR mix (Applied Biosystems) was used to prepare biotin‐labelled complementary RNA (cRNA) from synthesized double‐stranded cDNA derived from the original RNA samples. cRNA samples were hybridized, as described in the Affymetrix technical analysis manual, to GeneChip® human gene 1.0 ST array (Affymetrix), which represents 28 869 well annotated divisions and contains 764 885 distinct probes. Liquid handling, scanning and signal amplification were performed using GeneChip Fluidics Station 450, GeneChip scanner 3000 and GCOS1.2 respectively. Experiments were performed twice; four chips in total were used. Data were averaged and fold changes were identified using the GeneSpring filter.
Functional clustering
Genes whose expression was significantly decreased (P < 0.001) by at least 2‐fold were analysed using the functional annotation‐clustering tool from Database for Annotation, Visualization and Integrated Discovery (DAVID) Bioinformatics Resources 2008 (http://david.abcc.ncifcrf.gov/). This tool organized the genes into biologically meaningful modules or clusters. Functional clusters were selected if they had an enrichment score of at least 2.0. Enrichment scores are Fisher Exact P‐values expressed in inverse log scale (15).
Western blot analysis
Western blotting was carried out as described previously (14, 16). Two hundred microlitres of lysis buffer (20 mm Tris–HCl (pH 7.5), 150 mm NaCl, 1 mm Na2EDTA, 1 mm EGTA, 1% Triton X‐100) was added to 10 cm plates containing 30–40% confluent cells. Cells were then scraped of the plate. Subsequently, lysis buffer containing cell contents was sonicated and centrifuged at 3000 g for 3–5 min. The pellet was then discarded and protein concentration in the supernatant was determined using the Pierce (bicinchoninic acid) protein assay kit, as described by the manufacturer (Pierce, Thermo Fisher, Rockford, IL, USA). Protein sample buffer (Bio‐Rad) was then added, and equal protein amounts were electrophoresed on a 4–12% SDS–polyacrylamide gradient gel and blotted on nitrocellulose (Invitrogen). Proteins of interest were detected when bound to their respective antibodies using a luminescence kit (Pierce) and X‐ray film (Kodak, Toronto, ON, Canada). Antibodies used were as follows: anti‐β‐actin (Sigma), anti‐Smad2, anti‐Smad3 (Cell Signaling, Danvers, MA, USA), anti‐CTGF (Abcam), anti‐p300 (Santa Cruz, CA, USA) and anti‐cdk6 (Thermo Scientific, Cambridge, MA, USA).
Cell viability (proliferation) assays
Cell viability assays, used as an indirect measurement of proliferation, were carried out using the MTT (3‐(4,5‐dimethylthiazol‐yl) 2,5‐diphenyltetrazolium bromide) chromometry assay, as described by the manufacturer (Sigma). MTT is taken up by living cells and is reduced to formazan, a chromogenic product, by oxidoreductases within mitochondria of these cells. Thus, the assay provides a measure of cell number. Cell density was adjusted to 2.0 × 10⁴ cells/ml and seeded in 96‐well plates and cultured at 37 °C. Culture medium alone was used as negative control. At 0, 24, 48 and 72 h, 10 μl of MTT reagent was added to each well in use. After 4 h incubation at 37 °C, formazan reaction products in each well were dissolved in 100 μl of dimethyl sulphoxide. Optical density of the formazan solution was determined using an ELISA plate reader (Bio‐Rad) at 570 nm. For both cell proliferation and cytotoxicity assessment, three independent experiments were performed. Statistical analysis was carried out using Student’s t‐test. When indicated, human foreskin fibroblasts (ATCC) were used in an identical fashion to HGF.
Results
Effects of mithramycin on pro‐fibrotic gene expression
To investigate mRNAs whose expression in human gingival fibroblasts is suppressed by mithramycin, we treated cells overnight in presence or absence of 100 nm mithramycin. RNAs were harvested, and subjected to real‐time PCR to detect expression of alpha‐1 chain of type I collagen (COL1A1) and alpha‐2 chain of type I collagen (COL1A2), as expression of type I collagen mRNA and protein in dermal fibroblasts has previously been shown to be mithramycin‐sensitive [Fig. 1; (6, 13)]. mRNA expression levels of both COL1A1 and COL1A2 showed significant decrease on mithramycin treatment (Fig. 2b). Similarly, expression of CTGF, a profibrotic gene overexpressed in fibrotic lesions and reduced by mithramycin in dermal fibroblasts (5, 17), was also significantly decreased on overnight exposure to mithramycin (100 nm) (Fig. 1, respectively). Collectively, these results confirmed previously generated data which used dermal fibroblasts and indicated that mithramycin could reduce expression of fibrogenic mRNAs in HGFs.
Figure 1.
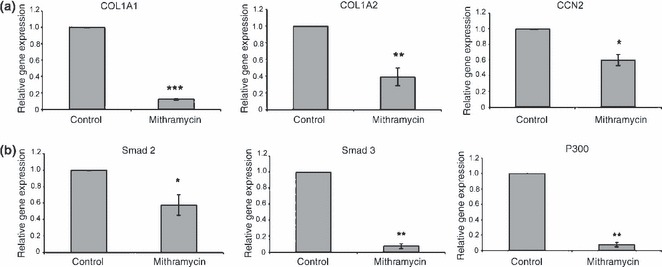
Mithramycin suppresses expression of fibrogenic mRNAs in human gingival fibroblasts. Trizol‐extracted RNA from 40% to 60% confluent HGF treated overnight with or without 100 nm of mithramycin was used for RT‐PCR analysis. Shown are mean ± SD (n = 3) fold decrease in the expression of the genes indicated elative to their respective controls. *P < 0.05; **P < 0.01; ***P < 0.01. Shown are CTGF, Smad2, Smad3, p300, COL1A1 and COL1A2.
Figure 2.
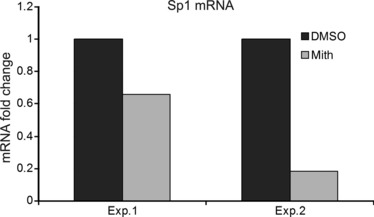
Mithramycin suppresses Sp1 mRNA expression in human gingival fibroblasts. Trizol‐extracted RNA from 40% to 60% confluent HGF treated overnight with or without 100 nm of mithramycin (control, mith) was used for RT‐PCR analysis. Experiments were conducted on two independent occasions. Data shown are mean values obtained from four replicate samples of each experiment (Exp 1 and Exp 2). Fold decrease in Sp1 mRNA expression relative to GAPDH control is shown.
Microarray analysis
To explore further the effects of mithramycin on gene expression, microarray experiments were performed on RNA extracted from mithramycin‐treated and control HGFs. A cut‐off value of at least 2‐fold decrease in expression was employed, to identified genes that were differentially expressed after mithramycin treatment. Using this criterion, 1635 genes whose expression was significantly reduced (P < 0.0001) by mithramycin were determined.
After microarray experiments, the data were analysed by functional clustering to detect groups of genes with significant enrichment scores (ESs) of at least 2.0. Two identified gene clusters include a transforming growth factor‐beta (TGF‐β) cluster (ES: 2.5) (Table 1) and a large proliferation cluster composed of distinct sub‐clusters such as cell division/mitosis (ES: 9.73), microtubule assembly (ES: 7.85), DNA replication (ES: 6.39) and cell cycle regulation (ES: 3.23) (Table 2). Surprisingly, no ECM cluster was identified; however, inspection of the list of genes revealed by microarray analysis to be mithramycin‐sensitive revealed that Sp1 mRNA was reduced by mithramycin (Table 1). Reduction in Sp1 mRNA levels was confirmed using real‐time PCR (Fig. 2). The only two ECM genes detected as being targets of mitramycin were type I collagen (Col1a1) and matrix metalloproteinase 16 (MMP16) (Table 3). These data suggested that any global effects of mithramycin on ECM gene expression are not likely to be direct, but are likely to be indirect acting through antagonism of the TGF‐β pathway. For further studies using HGF, we focused on genes not previously shown to be sensitive to mithramycin in fibroblasts.
Table 1.
Genes involved in the TGF‐β response whose expression was significantly suppressed (P < 0.01) by mithramycin treatment. All mRNAs in the cluster are shown [enrichment score (ES): 2.5]
| Affymetrix_id | Gene name |
|---|---|
| CREBBP | CREB‐binding protein |
| EP300 | E1A‐binding protein p300 |
| ROCK2 | Rho‐associated, coiled‐coil containing protein kinase 2 |
| smad2 | SMAD family member 2 |
| SMAD3 | SMAD family member 3 |
| SMAD6 | SMAD family member 6 |
| Smurf1 | SMAD specific E3 ubiquitin protein ligase 1 |
| SMURF2 | SMAD specific E3 ubiquitin protein ligase 2 |
| sp1 | Sp1 transcription factor |
| Bmpr1a | bone morphogenetic protein receptor, type IA; similar to ALK‐3 |
| Bmpr2 | bone morphogenetic protein receptor, type II (serine/threonine kinase) |
| Cul1 | cullin 1 |
| gdf5 | growth differentiation factor 5 |
| Rbl1 | retinoblastoma‐like 1 (p107) |
| Rock1 | similar to Rho‐associated, coiled‐coil containing protein kinase 1; Rho‐associated, coiled‐coil containing protein kinase 1 |
| Zfyve9 | zinc finger, FYVE domain containing 9 |
Table 2.
Genes involved in cell proliferation whose expression was significantly (P < 0.01) suppressed by mithramycin treatment. Shown are representative genes from each proliferation subcluster
| Affymetrix_id | Gene name |
|---|---|
| Mitosis | (ES: 9.73) |
| CD2AP | CD2‐associated protein |
| lats1 | LATS, large tumour suppressor, homologue 1 (Drosophila) |
| Nek6 | NIMA (never in mitosis gene a)‐related kinase 6 |
| ANAPC1 | anaphase‐promoting complex subunit 1; similar to anaphase‐promoting complex subunit 1 |
| ANAPC5 | anaphase‐promoting complex subunit 5 |
| CDC2L5 | cell division cycle 2‐like 5 (cholinesterase‐related cell division controller) |
| Cdc25b | cell division cycle 25 homologue B (S. pombe) |
| cdc6 | cell division cycle 6 homologue (S. cerevisiae) |
| FZR1 | fizzy/cell division cycle 20 related 1 (Drosophila) |
| Kif20b | kinesin family member 20B |
| NUMA1 | nuclear mitotic apparatus protein 1 |
| DNA replication | (ES: 6.39) |
| RAD51 | RAD51 homologue (RecA homologue, E. coli) (S. cerevisiae) |
| BRCA2 | breast cancer 2, early onset |
| CCDC111 | coiled‐coil domain containing 111 |
| rev3l | REV3‐like, catalytic subunit of DNA polymerase zeta (yeast) |
| MCM3 | minichromosome maintenance complex component 3 |
| MCM4 | minichromosome maintenance complex component 4 |
| Orc2l | origin recognition complex, subunit 2‐like (yeast) |
| polA1 | polymerase (DNA directed), alpha 1, catalytic subunit |
| Pold1 | polymerase (DNA directed), delta 1, catalytic subunit 125kDa |
| POLE2 | polymerase (DNA directed), epsilon 2 (p59 subunit) |
| Pold3 | polymerase (DNA‐directed), delta 3, accessory subunit |
| Spindle | (ES: 7.85) |
| NUMA1 | nuclear mitotic apparatus protein 1 |
| Tpx2 | TPX2, microtubule‐associated, homologue (Xenopus laevis) |
| cenpf | centromere protein F, 350/400ka (mitosin) |
| Cep170, Cep170 | centrosomal protein 170 kDa |
| CSPP1 | centrosome and spindle pole‐associated protein 1 |
| Clasp1 | cytoplasmic linker‐associated protein 1 |
| KNTC1 | kinetochore‐associated 1 |
| nusap1 | nucleolar and spindle‐associated protein 1 |
| tubgcp3 | tubulin, gamma complex‐associated protein 3 |
| smc3 | structural maintenance of chromosomes 3 |
| Cell cycle | (ES: 3.23) |
| Cdc45l | CDC45 cell division cycle 45‐like (S. cerevisiae) |
| Fbxo31 | F‐box protein 31 |
| Apc | adenomatous polyposis coli |
| BRCA1 | breast cancer 1, early onset |
| cdc6 | cell division cycle 6 homologue (S. cerevisiae) |
| Ccne2 | cyclin E2 |
| Foxn3 | forkhead box N3 |
| Mapk14 | mitogen‐activated protein kinase 14 |
| Msh2 | mutS homologue 2, colon cancer, non‐polyposis type 1 (E. coli) |
| Rb1 | retinoblastoma 1 |
| CDC14B | cell division cycle 14 h homologue B (S. cerevisiae) |
| CDC27 | cell division cycle 27 homologue B (S. cerevisiae) |
| CDC2L5 | cell division cycle 2‐like 5 |
| CDCA7L | cell division cycle‐associated 7‐like |
| HIRA | HIR histone cell cycle regulation defective homologue A |
| CDC2L6 | cell division cycle 2‐like 6 |
| CDCA7 | cell division cycle‐associated 7 |
| FZR1 | Fizzy/cell division cycle 20 related 1 (Drosophila) |
Table 3.
Genes involved in extracellular matrix production whose expression was significantly (P < 0.01) suppressed by mithramycin treatment
| Col1a1 | Type I collagen alpha 1 |
| MMP16 | Matrix metalloproteinase 16 |
Validation of the TGF‐β cluster
Functional clustering of the array data showed that 16 of the genes affected by mithramycin participate in fibrogenic TGF‐β pathways (Table 1). To support results from the array analysis, RT‐PCR and western blotting were performed on important members of the TGF‐β pathway. Smad proteins are transcriptional factors that mediate the TGF‐β signal; Smad3, for example, is necessary for fibrogenesis and TGF‐β‐induced CTGF expression (18). Other transcription co‐activators such as EP300 have been shown to interact with Smad proteins and mediate specific responses such as ECM remodelling (19). In agreement with the array analysis, RT‐PCR experiments revealed that mRNA levels of Smad2, Smad3 and EP300 were significantly lower in mithramycin‐treated cells (Fig. 2).
To determine whether alterations in gene expression at the mRNA level ultimately resulted in changes of protein level, western blot analysis was conducted on HGFs treated with or without mithramycin for 24 h. Because of their importance in transducing profibrotic effects of TGF‐β (20), we focused on Smad3 and p300; β‐actin was used as loading control. Extending and confirming our mRNA data, Smad3 and p300 protein levels were lower in mithramycin‐treated cells when compared to vehicle‐treated controls (Fig. 3a). Confirming that mithramycin could affect TGF‐β signalling, we showed that mithramycin blocked ability of TGF‐β to induce protein expression of CTGF, a known target of TGF‐β in fibroblasts (Fig. 3b) [note that CTGF is not normally basally expressed at protein level in fibroblasts (18, 21)]. These latter data also served to indicate that TGF‐β cannot rescue effects of mithramycin and also to provide a functional context for our studies, indicating that mithramycin could block ability of TGF‐β to signal.
Figure 3.
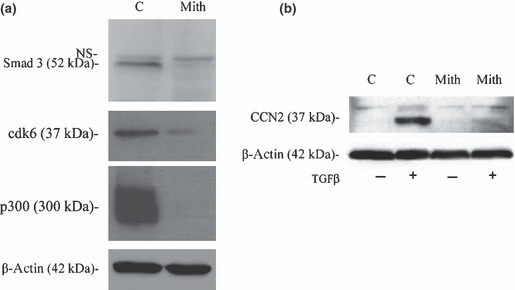
Mithramycin decreases protein levels in huma gingival fibroblasts. (a) After culturing the cells to 30–40% confluence, HGF were either treated with mithramycin (100 nm) or DMSO (mith or C) for 24 h. Cells were lysed and equal concentrations (25 μg) protein were subjected to SDS/PAGE and western blot analysis with anti‐Smad3, anti‐cdk6 and anti‐p300 antibodies. Blots were also probed with anti‐β‐actin antibodies show that lanes were loaded equally. (b) After culturing the cells to 30–40% confluence, HGF were cultured in DMEM containing 0.5% serum overnight, treated with mithramycin (100 nm) or DMSO for 1 h and TGFβ1 (4 ng/ml) for 24 h. Cells were lysed and equal concentrations (25 μg) of protein were subjected to SDS/PAGE and western blot analysis with anti‐CTGF and anti‐β‐actin antibodies.
Validation of the proliferation cluster
To support data obtained from microarray experiments, which suggested significant reduction in expression of proliferative genes (Table 2), RT‐PCR analysis was performed. Here, effects of mithramycin on expression of two genes pulled from the proliferation cluster, were assessed; they encode centromere protein F (CENPF) and cyclin‐dependent kinase 6 (CDK6). Both CENPF and CDK6 play essential roles in cell proliferation, and were selected because of their quite different functions: one being a physical component of the centromere and the other a kinase responsive to proliferative signals (22, 23). In accordance with the array data, RT‐PCR experiments showed a significant reduction in the expression of both CENPF and CDK6 genes in mithramycin‐treated HGF cells (Fig. 4a).
Figure 4.
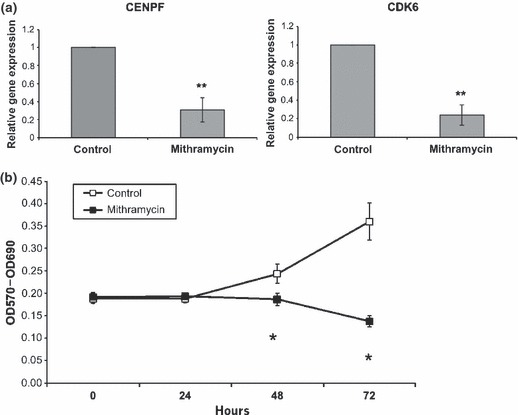
Mitramycin supressed proliferation of HGF (a) mRNA expression. RNA extracted using the Trizol kit from either mithramycin‐ (100 nm) or DMSO‐treated HGF was used in RT‐PCR analysis. Shown are the relative mRNA expression of CENPF and CDK6. Values are expressed as mean ± SD (n = 3). **P < 0.01 (b) proliferation assay. The effects of mithramycin (100 nm) on cell proliferation were assessed using the MTT assay. Cell number was determined using an ELISA plate reader at a wavelength of 570 nm. At 0 and 24 h, after treatment with mithramycin (100 nm), cell number is not significantly different (P > 0.05). There is a significant decrease in proliferation at 48 and 72 h after mithramycin treatment (P < 0.05). Similar results were obtained with human derma (foreskin) fibroblasts (not shown).
To further validate inhibition of proliferation‐concerning genes by mithramycin, a cell proliferation assay was carried out. The MTT assay, which presents a measure of cell number/metabolism, can be indirectly used to assess cell proliferation. MTT staining and absorbance readings were performed at 0, 24, 48 and 72 h after treatment with mithramycin. Results from MTT reaction demonstrated that in mithramycin‐treated cells, cell number did not change considerably over the course of 72 h, whereas control cells proliferated (Fig. 4b). This indicated that mithramycin suppressed proliferation of HGFs. Similar results were seen using human dermal (foreskin) fibroblasts (not shown).
Discussion
Excessive ECM deposition is an important characteristic of the fibrotic phenotype. Previous reports have provided evidence suggesting that in dermal fibroblasts, mithramycin suppresses expression of pro‐fibrotic genes, including type I collagen genes COL1A1 and COL1A2, and CTGF (5, 13). In this study, we have investigated ability of mithramycin to modulate gene expression in HGF. In an effort to determine whether mithramycin specifically suppresses pro‐fibrotic genes, global transcriptional profiling was performed on HGF treated in presence or absence of mithramycin. Analysis of data showed that mithramycin reduced expression of two functional clusters, specifically a TGF‐β cluster and a proliferation cluster. To our surprise, no ECM cluster was detected (in fact, only two ECM genes were revealed to be mithramycin‐sensitive using microarray analysis). That mithramycin suppresses important members of the TGF‐β pathway has not been previously reported. TGF‐β is a potent stimulator of fibrogenesis (20); thus, these data suggest that, in HGF, mithramycin may suppress expression of profibrotic genes indirectly through inhibiting TGF‐β signalling. In this regard, mithramycin reduced mRNA and protein expression of Smad3, a protein essential for TGF‐β to induce fibrogenic mRNA expression, and p300, an essential cofactor for Smad3 (19, 20, 24).
Fibrosis is a proliferative disorder (2); our array analysis also demonstrated that mithramycin reduced expression of genes involved in cell proliferation. The notion that mithramycin suppresses expression of these genes was confirmed by RT‐PCR analysis in CENPF (mitosin) and CDK6 and by MTT cell proliferation assay. Both CENPF and CDK6 play central roles in cell proliferation. CENPF, a constituent of the mature kinetochore during cell division, ensures proper segregation of chromosomes and controls the mitotic/spindle assembly checkpoints (22). CDK6 oncoprotein is a cell cycle kinase that controls activity of pRb protein and thus mediates transition from G1 phase to S phase (23).
Effects of mithramycin on cell proliferation have been established previously. For instance, mithramycin has been used as a chemotherapeutic agent for treatment of bone metastases in patients with hypercalcaemia, and for various testicular tumours (11). In vitro studies have shown that mithramycin, for example, suppresses proliferation of malignant epithelial cells (25).
Mithramycin has been used to treat diseases such as cancer, in particular to reduce hypercalcaemia, but has toxic side‐effects at doses that have anti‐tumorogenic activity (11, 26). Thus, in recent years, mithramycin has fallen out of favour clinically. However, drugs other than mithramycin that target Sp1 are available; these also show toxicity at effective doses in vivo (26). However, these drugs apparently have different mechanisms of action to mithramycin. Low doses of mithramycin can be combined with low doses of other anti‐Sp1 compounds to reduce tumours in vivo without apparent toxicity (26). Thus, therapies in which different anti‐Sp1 compounds are used to block fibrosis might be considered viable anti‐fibrotic approaches. Moreover, in the future, novel agents targeting Sp1, that have fewer side‐effects, might be developed.
In this study, evidence is provided to suggest that in HGF, mithramycin reduces expression of not only profibrotic genes such as type I collagen and CTGF, but also genes involved in the pro‐fibrotic TGF‐β pathway as well as cell proliferation. Mithramycin blocked the ability of TGF‐β to induce CTGF protein and proliferation of HGFs. Collectively, these results are consistent with the notion that drugs targeting the Sp1 family of transcription factors can potentially qualify as candidate drugs for treatment of fibro‐proliferative diseases such as gingival hyperplasia.
Acknowledgements
AL is financially supported by the Canadian Institutes of Health Research, and SP and AF by the Canadian Scleroderma Research Group.
References
- 1. Laurent GJ, Chambers RC, Hill MR, McAnulty RJ (2007) Regulation of matrix turnover: fibroblasts, forces, factors and fibrosis. Biochem. Soc. Trans. 35, 647–651. [DOI] [PubMed] [Google Scholar]
- 2. Wynn TA (2007) Common and unique mechanisms regulate fibrosis in various fibroproliferative diseases. J. Clin. Invest. 117, 524–529. [DOI] [PMC free article] [PubMed] [Google Scholar]
- 3. Leask A (2009) Signaling in fibrosis: targeting the TGF beta, endothelin‐1 and CCN2 axis in scleroderma. Front. Biosci. (Elite Ed.) 1, 115–122. [DOI] [PubMed] [Google Scholar]
- 4. Verrecchia F, Rossert J, Mauviel A (2001) Blocking sp1 transcription factor broadly inhibits extracellular matrix gene expression in vitro and in vivo: implications for the treatment of tissue fibrosis. J. Invest. Dermatol. 116, 755–763. [DOI] [PubMed] [Google Scholar]
- 5. Holmes A, Abraham DJ, Chen Y, Shi‐wen X, Denton C, Black CM et al. (2003) Sp1 is required for elevated CTGF expression in scleroderma fibroblasts. J. Biol. Chem. 278, 41728–41733. [DOI] [PubMed] [Google Scholar]
- 6. Ihn H, Ihn Y, Trojanowska M (2001) Sp1 phosphorylation induced by serum stimulates the human alpha2(I) collagen gene expression. J. Invest. Dermatol. 117, 301–308. [DOI] [PubMed] [Google Scholar]
- 7. Jimenez SA, Varga J, Olsen A, Li L, Diaz A, Herhal J et al. (1994) Functional analysis of human alpha 1(I) procollagen gene promoter. Differential activity in collagen‐producing and ‐nonproducing cells and response to transforming growth factor beta 1. J. Biol. Chem. 269, 12684–12691. [PubMed] [Google Scholar]
- 8. Kum YS, Kim KH, Park TI, Suh IS, Oh HK, Cho CH et al. (2007) Antifibrotic effect via the regulation of transcription factor Sp1 in lung fibrosis. Biochem. Biophys. Res. Commun. 363, 368–374. [DOI] [PubMed] [Google Scholar]
- 9. Ramirez F, Tanaka S, Bou‐Gharios G (2006) Transcriptional regulation of the human alpha2(I) collagen gene (COL1A2), an informative model system to study fibrotic diseases. Matrix Biol. 25, 365–372. [DOI] [PubMed] [Google Scholar]
- 10. Hitraya EG, Varga J, Artlett CM, Jimenez SA (1998) Identification of elements in the promoter region of the alpha1(I) procollagen gene involved in its up‐regulated expression in systemic sclerosis. Arthritis Rheum. 41, 2048–2058. [DOI] [PubMed] [Google Scholar]
- 11. Lumachi F, Brunello A, Roma A, Basso U (2009) Cancer‐induced hypercalcemia. Anticancer Res. 29, 1551–1555. [PubMed] [Google Scholar]
- 12. Blume SW, Snyder RC, Ray R, Thomas S, Koller CA, Miller DM (1991) Mithramycin inhibits SP1 binding and selectively inhibits transcriptional activity of the dihydrofolate reductase gene in vitro and in vivo. J. Clin. Invest. 88, 1613–1621. [DOI] [PMC free article] [PubMed] [Google Scholar]
- 13. Sandorfi N, Louneva N, Hitraya E, Hajnoczky G, Saitta B, Jimenez SA (2005) Inhibition of collagen gene expression in systemic sclerosis dermal fibroblasts by mithramycin. Ann. Rheum. Dis. 64, 1685–1691. [DOI] [PMC free article] [PubMed] [Google Scholar]
- 14. Shi‐wen X, Kennedy L, Renzoni EA, Bou‐Gharios G, du Bois RM, Black CM et al. (2007) Endothelin is a downstream mediator of profibrotic responses to transforming growth factor beta in human lung fibroblasts. Arthritis Rheum. 56, 4189–4194. [DOI] [PubMed] [Google Scholar]
- 15. Huang da W, Sherman BT, Tan Q, Collins JR, Alvord WG, Roayaei J et al. (2007) The DAVID gene functional classification tool: a novel biological module‐centric algorithm to functionally analyze large gene lists. Genome Biol. 8, R183. [DOI] [PMC free article] [PubMed] [Google Scholar]
- 16. Liu S, Kapoor M, Leask A (2009) Rac1 expression by fibroblasts is required for tissue repair in vivo. Am. J. Pathol. 174, 1847–1856. [DOI] [PMC free article] [PubMed] [Google Scholar]
- 17. Leask A, Parapuram SK, Shi‐Wen X, Abraham DJ (2009) Connective tissue growth factor (CTGF, CCN2) gene regulation: a potent clinical bio‐marker of fibroproliferative disease? J. Cell Commun. Signal. 3, 89–94. [DOI] [PMC free article] [PubMed] [Google Scholar]
- 18. Holmes A, Abraham DJ, Sa S, Shiwen X, Black CM, Leask A (2001) CTGF and SMADs, maintenance of scleroderma phenotype is independent of SMAD signaling. J. Biol. Chem. 276, 10594–10601. [DOI] [PubMed] [Google Scholar]
- 19. Bhattacharyya S, Ghosh AK, Pannu J, Mori Y, Takagawa S, Chen G et al. (2005) Fibroblast expression of the coactivator p300 governs the intensity of profibrotic response to transforming growth factor beta. Arthritis Rheum. 52, 1248–1258. [DOI] [PubMed] [Google Scholar]
- 20. Leask A, Abraham DJ (2004) TGF‐beta signaling and the fibrotic response. FASEB J. 18, 816–827. [DOI] [PubMed] [Google Scholar]
- 21. Van Beek JP, Kennedy L, Rockel JS, Bernier SM, Leask A (2006) The induction of CCN2 by TGFbeta1 involves Ets‐1. Arthritis Res. Ther. 8, R36. [DOI] [PMC free article] [PubMed] [Google Scholar]
- 22. Bomont P, Maddox P, Shah JV, Desai AB, Cleveland DW (2005) Unstable microtubule capture at kinetochores depleted of the centromere‐associated protein CENP‐F. EMBO J. 24, 3927–3939. [DOI] [PMC free article] [PubMed] [Google Scholar]
- 23. Noh SJ, Li Y, Xiong Y, Guan KL (1999) Identification of functional elements of p18INK4C essential for binding and inhibition of cyclin‐dependent kinase (CDK) 4 and CDK6. Cancer Res., 59, 558–564. [PubMed] [Google Scholar]
- 24. Ihn H, Yamane K, Asano Y, Jinnin M, Tamaki K (2006) Constitutively phosphorylated Smad3 interacts with Sp1 and p300 in scleroderma fibroblasts. Rheumatology 45, 157–165. [DOI] [PubMed] [Google Scholar]
- 25. Yang TP, Chiou HL, Maa MC, Wang CJ (2010) Mithramycin inhibits human epithelial carcinoma cell proliferation and migration involving downregulation of Eps8 expression. Chem. Biol. Interact. 183, 181–186. [DOI] [PubMed] [Google Scholar]
- 26. Jia Z, Gao Y, Wang L, Li Q, Zhang J, Le X et al. (2010) Combined treatment of pancreatic cancer with mithramycin A and tolfenamic acid promotes Sp1 degradation and synergistic antitumor activity. Cancer Res. 70, 1111–1119. [DOI] [PMC free article] [PubMed] [Google Scholar]