Abstract
Abstract. The expression of Ki‐67 in tumour cells induced to apoptosis by tumour‐necrosis‐factor α (TNFα) and interferon γ (IFNγ) was studied. Ki‐67 is known as a proliferation marker which is expressed in cycling cells, but not in resting quiescent or Go cells. In numerous studies, the proportion of tumours expressing Ki‐67 was determined and related to tumour grade or prognosis. A high percentage of Ki‐67 expressing cells and a low apoptotic index were regarded as an indication of a progressive tumour. This implied that Ki‐67 expression and apoptosis were contrary traits. In this study, the level of Ki‐67 expression in human tumour cells in culture was measured after induction of apoptosis. The Ki‐67 level was determined by flow cytometry and apoptosis was measured by various methods including PARP degradation (western blot) in detached and floating cells. While the floating cells were all apoptotic, more than 80% of the attached cells showed no apoptotic signs. The Ki‐67 level of apoptotic cells was elevated about 3‐fold compared to viable attached control cells. However, the cytokine‐treated attached cells also expressed Ki‐67 at similar high levels to the apoptotic floating cells, depending on sensitivity. The plot of Ki‐67 level vs. remaining cells after treatment revealed a strong correlation between the level of Ki‐67 expression and the sensitivity to cytokine‐induced apoptosis. This implies that proliferation pathways and apoptotic signal transduction are connected.
INTRODUCTION
Ki‐67 is an established proliferation marker and has been extensively used to estimate the growth fraction of tumours. The Ki‐67 protein is located in the cell nucleus and is expressed in all cell cycle phases but not in quiescent cells (Q‐cells or Go‐cells) (Gerdes et al. 1984). The gene of Ki‐67 has been cloned (Duchrow et al. 1994), however, the function of the Ki‐67 protein has not yet been discovered (Scholzen & Gerdes 2000). As a proliferation marker it has been used in numerous clinical studies. The Ki‐67‐index or proliferation‐index, determined by Ki‐67 immunochemistry, is often correlated to prognosis (Scholzen & Gerdes 2000), and it is used to decide the type of therapy (Wilson et al. 1996).
The growth of tumours is generally regarded as dependent on increased proliferation rate, and on an apoptosis rate too low to balance cell growth. In most clinical studies where high Ki‐67 indices were measured, the apoptotic indices were low. In particular, after therapy the proliferation index decreased while the apoptotic index increased (Matsushima et al. 1999). However, there are also reports of tumours with high Ki‐67 index and a high apoptosis index (McMenamin et al. 1997; Tannapfel et al. 1997; Rödel et al. 2000; Stoll et al. 2000).
The correlation between proliferation and apoptosis‐index occurred in various different tumour types (e.g. bladder ca, squamous cell ca, ovarian ca, renal cell ca). These findings give rise to the question of whether or not Ki‐67 expression and apoptosis are related. One example of a close relationship between proliferation and apoptosis is the p53 protein. Upon expression of p53, the cells may be arrested in the G1‐phase or triggered to apoptosis, depending on the metabolic condition of the cells or other relevant signals (Bennett 1999).
Cytokines, like tumour necrosis factor α (TNFα) or interferon (IFN), exert a pleiotrophy of different effects on cells including growth and apoptotic signals (Balkwill & Pithat 1997). It depends on the cell type and special situations whether or not proliferation or apoptosis is induced. The hypothesis of contradicting signals assumes that, in the case of growth stimulating and inhibitory signals, the cell decides to commit suicide (van der Bosch et al. 1992). More recent results suggest a highly complex network of signal transduction which integrates signals to arrive at one or other end point. In the present study, we have treated human tumour cells with TNFα and IFNγ. Two cell lines were sensitive to TNFα, one was resistant. The Ki‐67 expression level was higher in the sensitive than in the resistant line. Moreover, all cells which were detached from the culture flask bottom had high Ki‐67 levels and were shown to be apoptotic by various methods. The level of Ki‐67 expression strongly correlated with the apoptotic reduction of survival after cytokine treatment.
MATERIALS AND METHODS
Cells and cytokines
Three human tumour lines from ATCC were used. Two were sensitive (Me‐180, MCF‐7) and one was resistant (TCC‐Sup) to TNFα. Me‐180, derived from a human cervix carcinoma was cultured in McCoy's 5a medium with 10% fetal bovine serum (FBS), MCF‐7, a human breast carcinoma was cultured in RPMI 1640 medium with 10% FBS, and TCC‐Sup, a human bladder‐transitional carcinoma was cultured in minimum essential medium (Eagle) with nonessential amino acids, sodium pyruvate 1 mm, and Earle's BSS with 10% FBS. Human recombinant TNFα and Interferon γ (IFNγ) were purchased from Böhringer‐Mannheim, Mannheim, Germany.
Apoptosis assays
The following methods were used to identify apoptotic cells; the methods were previously described (Baisch et al. 1999) or were used according to the manufacturers instructions:
-
1
Annexin‐V‐FITC (Clontech, Palo Alto, CA) stains phosphatidylserine translocated to the outside of the cell membrane in apoptotic cells, it is measured by FACScan.
-
2
Mito Tracker Green FM and Red CMX Ros (Molecular Probes, Eugene, OR) detects the membrane potential of mitochondria, which is reduced in apoptotic cells.
-
3
Apo 2.7 (Immunotech, Marseilles, France) reacts with a mitochondrial membrane protein which is exposed in apoptotic cells. Trypsinized cells were centrifuged, re‐suspended in ice cold Triton X‐100 (0.25%) in PBS containing 2.5% FCS and 0.01% Na N3, incubated for 20 min, centrifuged and incubated in 100 µl Apo 2.7 (40 µg/ml) for 30 min at room temperature, centrifuged, incubated for 30 min in 100 µl Anti Mouse‐FITC (DAKO, Glostrup, Denmark), stained with propidium iodide (PI) (2 µg/ml), and measured in a FACScan (Becton‐Dickinson, Heidelberg, Germany).
-
4
The chromatin condensation of cells was measured by assessing the sensitivity of DNA in situ to denaturation according to Darzynkiewicz et al . (1999) by staining with acridine orange (Polyscience Europe, Eppelheim, Germany).
-
5
Apoptosis induced degradation of DNA at the nucleosomal level was measured by the sub G 1 peak method of staining cells with PI in 30 m m phosphate buffer. In apoptotic cells, small DNA pieces diffuse out of the cells and reduce the DNA content of apoptotic cells, which appear in the sub G 1 peak of the DNA histogram measured in the FACScan.
-
6
PARP‐westernblot: a method of Dr Dornreiter, Heinrich‐Pette‐Institut, Hamburg was adapted. Briefly, the cells were scraped from the flask and frozen at −80 °C and stored. For protein isolation, the cells were thawed in an ice‐bath and lysed in a Tris‐buffer containing 5 µg/ml aprotinin, pepstatin, leupeptin, 125 µg/ml Pefabloc (Serva, Heidelberg, Germany). After centrifugation, the protein concentration was measured in the supernatant using the Bradford‐method (BIORAD‐assay). The proteins were separated by electrophoresis on a 10% SDS‐PAGE (Bis‐Tris‐Gel NOVEX, San Diego, CA), and blotted in a Mini Trans Blot (BIO‐RAD) on PVDF‐membranes (Imobilon‐P Millipose, Bedford. MA). The anti‐parp (116 and 85 kDa fragment) antibody from upstate Lake Placid, NY, and the anti PARP‐85 kDa fragment from Promega, Madison, WI were used. Bands were visualized by chemoluminiscence detection on a hybond film (ECL, Amersham Pharmacia Biotech, Freiburg, Germany). For quantitative analysis, the Optimas System (Media Cybernetics, Silver Spring, MD) was used.
Ki‐67 staining
Staining of cells with Ki‐67 was performed as previously described (Baisch & Gerdes 1990). Briefly, the cells were fixed in acetone, re‐suspended in PBS, incubated in MIB1 antibody (a gift from Johannes Gerdes, Laboratory Molecular Immunology, Borstel, Germany) for 30 min, washed and incubated in a FITC‐conjugated antimouse IgG antibody (DAKO, Hamburg, Germany) for 30 min, and stained in a 2‐µl/ml PI solution, containing 0.1 mg/ml RNase. The cells were measured in a FACScan. As an isotype control, a IgG1 negative control (DAKO) was used. The fractions of cells in the cell cycle phases were calculated using the Multicycle programme (Phoenix, San Diego, CA).
RESULTS
Treatment with TFN and TNF + IFN simultaneously induces detachment of cells from the culture flask bottom and it will be shown below that these floating cells are apoptotic. Two human tumour cell lines in this study were sensitive to the cytokine treatment, one was resistant. In Fig. 1a the growth curves of the sensitive line MCF‐7 are shown. Treatment with TNF alone needs 48 h to reduce the number of viable cells; IFN has no effect. After combined treatment, the number of viable cells already decreases after 24 h and declines to a much lower level later on. The sensitive cell line Me‐180 behaves similarly, however, it is also sensitive to IFN alone. In Fig. 1b the remaining viable cells of the three cell lines are compared after 2 days of treatment. In TCC‐Sup, the resistant line, more than 60% of the cells survive the combined treatment, whereas only 10–15% of the sensitive Me‐180 and MCF‐7 survive TNF + IFN.
Figure 1.
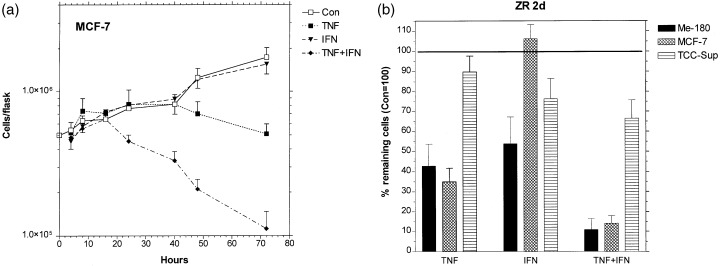
Effect of 1000 U/ml TNF, 100 U/ml IFN and simultaneous treatment with both cytokines on tumour cell lines Me180, MCF‐7, and TCC‐Sup. The growth curves (a) show MCF‐7 cells attached to the culture flask bottom, which are viable, as demonstrated below. The percentage of viable cells after 2 days of treatment of all three cell lines tested are compared in (b). In all cases, the mean values were obtained from at least three separate experiments, error bars are standard deviations.
Reduction of cell number could be caused by perturbation of the cells in the cell cycle, e.g. blockage in one of the phases. Figure 2a shows that the fractions of attached cells in S‐phase remain nearly the same after 2 days of treatment of Me‐180 and MCF‐7. Only in TCC‐Sup, the resistant line, was an increase of percentage S cells observed after TNF + IFN. The G2M phase fraction was reduced in MCF‐7 cells after TNF or TNF + IFN treatment, while the other two lines were unaffected, Fig. 2b. Accordingly, the fractions of G1‐phase cells are only slightly affected by the cytokine treatment. These results show that no dominating blockade in either cell cycle phase is induced by the cytokine treatment.
Figure 2.
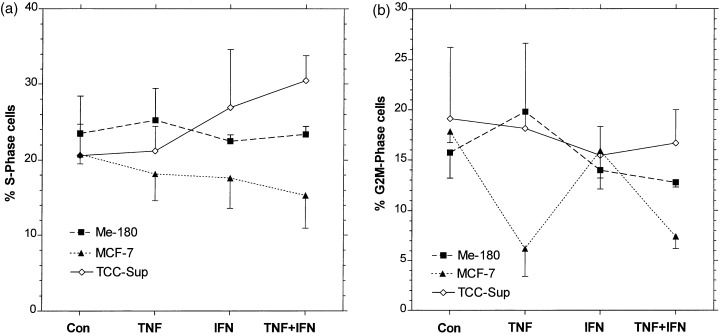
Influence of TNF, IFN, and TNF + IFN, same concentrations as in Fig. 1 , on the fractions of cells in S‐phase (a) and G 2 ‐M‐phase (b). Flow cytometry measurements after PI staining, see Materials and methods . Mean values and error bars as in Fig. 1 .
To assess if the cells were differentially sensitive in the cell cycle phases, the fractions of cells in the phases of floating cells with those of alive attached cells were compared. Figure 3a shows that more S‐phase cells were found in the floating than in the attached population, however, this trend was not systematic in one of the cell lines. The points appearing to the left of the diagonal represent samples where more S‐phase cells were measured in the floating than in the attached comportment. In these cases S‐phase cells were more susceptible to become apoptotic than G1 or G2M cells. However, the largest deviations were found in control and IFN‐treated cells, which had the lowest numbers of floating cells. In G2M‐phase, Me‐180 seems to be more sensitive and TCC‐Sup more resistant, Fig. 3b. In G1, the deviations are negligible as they are related to the small deviations in the S‐ and G2M‐phases, and hence do not change the high percentages of G1 considerably. Overall, cells in all phases of the cell cycle were sensitive to cytokine‐induced apoptosis; the S‐phase cells may be slightly more susceptible.
Figure 3.
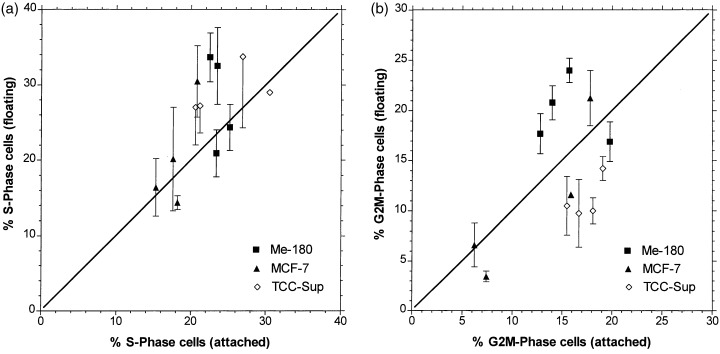
Correlation of percentage S‐phase cells (a) and percentage G 2 M‐phase cells (b) in the viable population (attached to culture flask bottom) and in the apoptotic population (floating cells). Symbols on the straight line represent equal values in both populations. Mean values and error bars as in Fig. 1 .
Floating cells in monolayer cultures are usually dying cells. To assess if the increased numbers of floating cells after TNF and TNF + IFN treatment were dying by apoptosis, various apoptosis assays were used. Figure 4 shows that most TNF‐treated cells, which were detached from the culture flask bottom, have depolarized mitochondrial membranes, which is regarded as a marker of apoptosis. PARP‐cleavage was measured in all three cell lines in floating cells, indicating that caspase 3 or 7, the execution caspases were activated (Fig. 5). In Me‐180 cells treated with TNF and TNF + IFN, the apoptotic programme was already active in the attached cells, where 20–50% of the cells displayed cleaved PARP. It should be noted that the majority of MCF‐7 floating cells have also degraded PARP after TNF or TNF + IFN, despite the fact that they are deficient in caspase 3 (Bushell et al. 1999). Probably caspase 7 has replaced caspase 3, however, in control and IFN‐treated cells nearly no PARP cleavage was observed, underlining the caspase 3 deficiency in certain circumstances.
Figure 4.
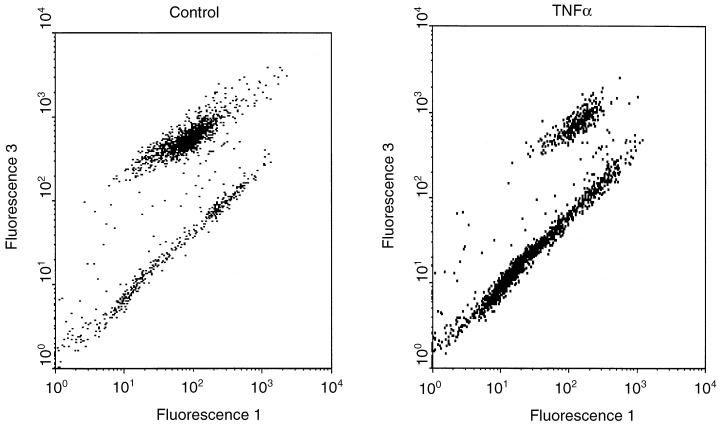
Analysis of mitochondrial membrane potential as an apoptotic marker. Me‐180 cells treated for 24 h with 1000 U/ml TNF were measured after staining with Mito Tracker green and red in a FACScan. Mito Tracker green (Fluorescence 1) represents the total mass of mitochondria per cell, Mito Tracker red (Fluorescence 3) fluorescence is strongly decreased when the membrane of mitochondria is depolarized, which is one trait of apoptotic cells. In the dot plot, the lower cluster represents apoptotic cells, of which the shrunken cells in late apoptosis appear at small fluorescence 1‐values near the origin.
Figure 5.
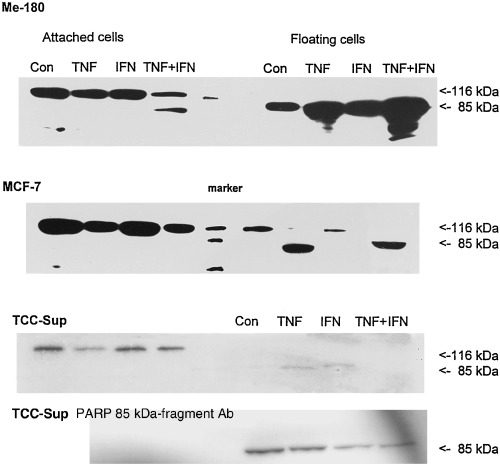
PARP‐cleavage in cells treated for 1 day with TNF, IFN, and TNF + IFN simultaneously. In apoptotic cells, the functional 116 kDa PARP molecule is degraded into a 85‐ and a 21‐kDa component. The antibody used in western blots of the three upper rows recognized the 116 and the 85 kDa proteins. Protein preparations of cells treated with the indicated cytokines were loaded into the respective lanes. The bottom row shows data obtained with an antibody against the 85 kDa cleaved fragment of PARP in TCC‐Sup cells. It is detected only in the floating cells.
A compilation of all the different apoptosis assays is shown in Fig. 6 for MCF‐7 cells. The floating cells proved to be apoptotic with all the tests, except for PARP cleavage in control and IFN‐treated cells as explained above. The attached cells are predominately viable, only TNF and TNF + IFN treated cells show a slightly elevated percentage of cells for some of the apoptotic assays. The Me‐180 and TCC‐Sup cells (data not shown) yielded the same results: floating cells are apoptotic, whereas attached cells are alive.
Figure 6.
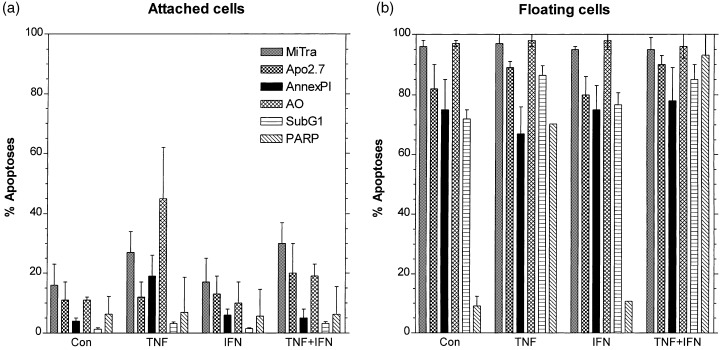
Percentages of apoptotic MCF‐7 cells as measured by various methods: Mito Tracker green/red (MiTra), antibody Apo 2.7 binds to an apoptosis‐related protein (Apo 2.7), annexin V‐FITC and propidium iodide (Annex PI); acridin orange (AO), DNA‐degradation (Sub‐G 1 ), and PARP‐cleavage (PARP). At least three experiments were performed for every method using attached (a) and floating cells (b) after 1 day of treatment with TNF, IFN, and TNF + IFN simultaneously. Mean values and standard deviations from at least three separate experiments.
The Ki‐67 level was considerably elevated in the attached cells of the sensitive cell lines Me‐180 and MCF‐7, whereas it was only slightly increased in the resistant cell line TCC‐Sup, as shown in Fig. 7, after 2 days of treatment with TNF and IFN. Only in MCF‐7, the Ki‐67 was not increased after IFN treatment, however, this treatment did not induce apoptosis. All the floating cells had high Ki‐67 levels, similar to those of the attached cells. These results pointed to a possible correlation between Ki‐67 level and the levels of apoptosis. To demonstrate the correlation, the Ki‐67 level versus the percentage of remaining viable attached cells after treatment was plotted, Fig. 8. Obviously there exist two linear correlations of the two parameters in two regions. In particular, the linear relationship is the same for all cell lines: when the Ki‐67 level is high, the percentage of remaining viable attached cells is low after treatment with TNF + IFN.
Figure 7.
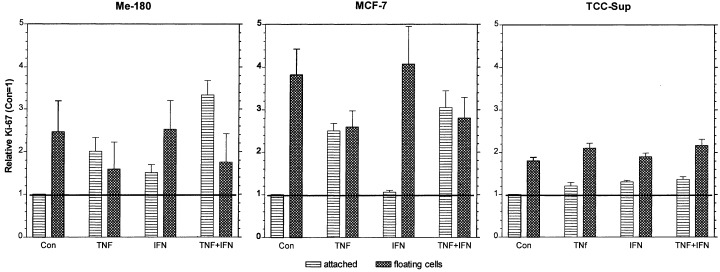
Ki‐67 expression in Me‐180, MCF‐7, and TCC‐Sup cells after 2 days of treatment with 1000 U/ml TNF, 100 U/ml IFN, and both cytokines simultaneously. The means of FACScan measured Ki‐67 fluorescence were normalized to the control. Plotted are the means and standard errors of at least three repetitive experiments.
Figure 8.
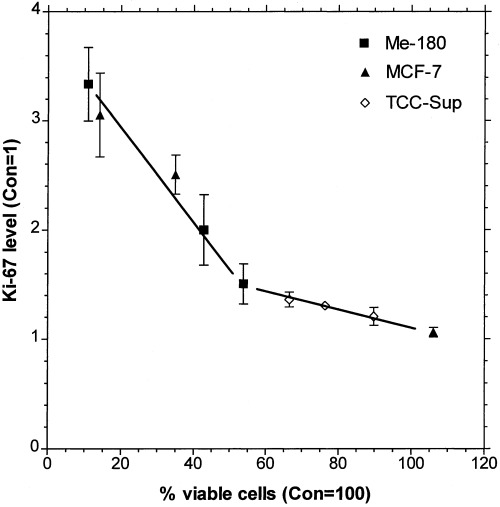
Correlation of percentage viable cells (attached to the culture flask bottom, see Fig. 1 ) to the level of Ki‐67 expression ( Fig. 7 ). Ki‐67 fluorescence intensity of TNF, IFN, and TNF + IFN treated cells (2d) was normalized to the control at day 2. A level of two represents a 2‐fold Ki‐67 expression compared to the untreated control.
DISCUSSION
The question addressed in this study was how apoptosis and proliferation were related in tumour cells treated with TNFα and IFNγ. The amount of apoptosis varied considerably in the TNF‐sensitive and TNF‐resistant cell lines and therefore I analysed if the proliferation marker Ki‐67 correlated with apoptosis. The state of proliferation can be described by cell‐cycle phase distributions or by proliferation markers like cyclins and Ki‐67. It has been shown that Ki‐67 is associated with cycling cells and absent in quiescent cells. In this study I observed reduced growth (Fig. 1), nearly unaffected phase distributions (Fig. 2), and a considerable increase of Ki‐67 expression level (Fig. 7) concomitantly. Increased level of Ki‐67 expression and reduced growth is a contradiction for the traditional understanding of proliferation. The hypothesis that conflicting proliferation signals would lead to apoptosis, however, could apply. Indeed, as shown in Fig. 8, the level of Ki‐67 expression strongly correlates with the amount of remaining cells after cytokine treatment. The higher the Ki‐67 level is, the more cells are detached and apoptotic, and the less remain attached to the culture flask and viable. This correlation between Ki‐67 levels and apoptosis is the central finding of this study. Surprisingly, I did not find a single publication where Ki‐67 levels were measured. In all the numerous papers, only the percentage of Ki‐67 positive cells in tumours was determined and related to prognosis. The standard hypothesis is, that tumours progress in growth because of elevated proliferation and reduced apoptosis. However, in several of these studies an increased rate of Ki‐67 proliferation index was accompanied by an increased rate of apoptosis (McMenamin et al. 1997; Tannapfel et al. 1997; Rödel et al. 2000; Stoll et al. 2000). This result was obtained in various different tumour types. These findings could be supported by the correlation of the present study.
The various assays for apoptosis were used to clearly prove that the cytokines indeed induced apoptosis. Despite controversial disputes about some of the methods, which are not exclusively found in apoptosis, taking the results of all assays, it was clearly shown that these cells were apoptotic. Moreover it has been observed by many researchers that the members of the TNF‐family are able to induce apoptosis (Balkwill & Pithat 1997; Wallach et al. 1997), and some of the signalling pathways are almost completely elaborated (Wallach et al. 1997; Grell et al. 1999). It should be noted that the few detached (floating) cells of the resistant line TCC‐Sup also showed all the apoptosis traits that the detached cells of the sensitive lines showed.
A high level of Ki‐67 after cytokine treatment should imply accelerated proliferation, however, we found the contrary: growth has ceased (Fig. 1), while the cell cycle phase distributions remained the same as for control cells (2, 3). Obviously, TNFα and IFNγ transmit conflicting signals into the cells, on one hand proliferation supporting signals like Ki‐67 increase, and on the other hand signals which down regulate cell growth. Cross‐talk between pathways supporting proliferation with pathways supporting apoptosis could explain the strong correlation between Ki‐67 level and apoptosis we found in this study (Fig. 8). Unfortunately, at present it is impossible to set up a hypothesis about pathways which may be involved, because the function of Ki‐67 is still unknown (Scholzen & Gerdes 2000). The fact that TNF‐sensitive, as well as resistant, cells follow this correlation points to a fundamental connection of proliferative (which includes Ki‐67) pathways with apoptotic pathways induced by cytokines.
From the clinical point of view it should be considered whether or not the percentage of Ki‐67 positive cells, as well as the intensity of Ki‐67 in the cells, could be used as a prognostic factor. According to our results, high Ki‐67 levels correlate with high levels of apoptosis, and it would be interesting if this correlation also holds for tumours in vivo. One may further speculate if tumours with high Ki‐67 levels could be more susceptible to drugs which induce apoptosis.
ACKNOWLEDGEMENTS
I thank Sylvia Bornkessel, Hannelore Bollmann for excellent technical assistance, and Renate Erb for professional help with the manuscript.
REFERENCES
- Baisch H, Bollmann H, Bornkessel S (1999) Degradation of apoptotic cells and fragments in HL‐60 suspension cultures after induction of apoptosis by camptothecin and ethanol. Cell Prolif. 32, 303. [DOI] [PMC free article] [PubMed] [Google Scholar]
- Baisch H, Gerdes J (1990) Identification of proliferating cells by Ki‐67 antibody In: Crissman A, Darzynkiewicz Z, eds. Methods in Cell Biology, Vol. 33/22: Methods in Cell Biology. San Diego, CA: Academic Press, p. 217. [PubMed] [Google Scholar]
- Balkwill F, Pithat PM (1997) Interferons and cytokines on a grand scale. Cytokine Growth Factor Rev. 8, 91. [DOI] [PubMed] [Google Scholar]
- Bennett MR (1999) Mechanisms of p53‐induced apoptosis. Biochem. Pharmacol. 58, 1155. [DOI] [PubMed] [Google Scholar]
- Van Der B osch J et al. (1992) Modulation of tumor cell susceptibility to cytokine‐induced cell death by hormones, growth factors, and cell density. J. Cellular Physiol. 151, 395. [DOI] [PubMed] [Google Scholar]
- Bushell M et al. (1999) Caspase‐3 is necessary and sufficient for cleavage of protein synthesis eukaryotic initiation factor 4G during apoptosis. FEBS Lett. 451, 332. [DOI] [PubMed] [Google Scholar]
- Darzynkiewicz Z et al. (1992) Features of apoptotic cells measured by flow cytometry. Cytometry 13, 795. [DOI] [PubMed] [Google Scholar]
- Duchrow M, Gerdes J, Schlüter C (1994) The proliferation‐associated Ki‐67 protein: definition in molecular terms. Cell Prolif. 27, 235. [DOI] [PubMed] [Google Scholar]
- Gerdes J et al. (1984) Cell cycle analysis of a cell proliferation‐associated human nuclear antigen defined by the monoclonal antibody Ki‐67. J. Immunol. 133, 1710. [PubMed] [Google Scholar]
- Grell M et al. (1999) Induction of cell death by tumour necrosis factor (TNF) receptor 2, CD40 and CD30: a role for TNF‐R1 activation by endogenous membrane‐anchored TNF. EMBO J. 18, 3034. [DOI] [PMC free article] [PubMed] [Google Scholar]
- Matsushima H et al. (1999) Correlation between proliferation, apoptosis, and angiogenesis in prostate carcinoma and their relation to androgen ablation. Cancer 85, 1822. [DOI] [PubMed] [Google Scholar]
- McMenamin ME, O'neill AJ, Gaffney EF (1997) Extent of apoptosis in ovarian serous carcinoma: relation to mitotic and proliferative indices, p53 expression, and survival. Mol. Pathol. 50, 242. [DOI] [PMC free article] [PubMed] [Google Scholar]
- Rödel C et al. (2000) Apoptosis, p53, bcl‐2, and Ki‐67 in invasive bladder carcinoma: possible predictors for response to radiochemotherapy and successful bladder preservation. Int. J. Radiat. Oncol. Biol. Phys. 46, 1213. [DOI] [PubMed] [Google Scholar]
- Scholzen T, Gerdes J (2000) The Ki‐67 protein: from the known and the unknown. J. Cell Physiol. 182, 311. [DOI] [PubMed] [Google Scholar]
- Stoll C et al. (2000) Prognostic significance of apoptosis and associated factors in oral squamous cell carcinoma. Virchows Arch. 436, 102. [DOI] [PubMed] [Google Scholar]
- Tannapfel A et al. (1997) Incidence of apoptosis, cell proliferation nad p53 expression in renal cell carcinoma. Anticancer Res. 17, 1155. [PubMed] [Google Scholar]
- Wallach D et al. (1997) Cell death induction by receptors of the TNF family: towards a molecular understanding. FEBS 410, 96. [DOI] [PubMed] [Google Scholar]
- Wilson GD et al. (1996) Direct comparison of bromodeoxyuridine and Ki‐67 labelling indices in human tumours. Cell Prolif. 29, 141. [PubMed] [Google Scholar]


