

Abstract
Objectives
Both excessive and insufficient angiogenesis are associated with progression of diabetic complications, of which poor angiogenesis is an important feature. Currently, adipose‐derived stem cells (ADSCs) are considered to be a promising source to aid therapeutic neovascularization. However, functionality of these cells is impaired by diabetes which can result from a defect in hypoxia‐inducible factor‐1 (HIF‐1), a key mediator involved in neovascularization. In the current study, we sought to explore effectiveness of pharmacological priming with deferoxamine (DFO) as a hypoxia mimetic agent, to restore the compromised angiogenic pathway, with the aid of ADSCs derived from streptozotocin ( STZ)‐induced type 1 diabetic rats (‘diabetic ADSCs’).
Materials and methods
Diabetic ADSCs were treated with DFO and compared to normal and non‐treated diabetic ADSCs for expression of HIF‐1α, VEGF, FGF‐2 and SDF‐1, at mRNA and protein levels, using qRT‐PCR, western blotting and ELISA assay. Activity of matrix metalloproteinases ‐2 and ‐9 were measured using a gelatin zymography assay. Angiogenic potential of conditioned media derived from normal, DFO‐treated and non‐treated diabetic ADSCs were determined by in vitro (in HUVECs) and in vivo experiments including scratch assay, three‐dimensional tube formation testing and surgical wound healing models.
Results
DFO remarkably enhanced expression of noted genes by mRNA and protein levels and restored activity of matrix metalloproteinases ‐2 and ‐9. Compromised angiogenic potential of conditioned medium derived from diabetic ADSCs was restored by DFO both in vitro and in vivo experiments.
Conclusion
DFO preconditioning restored neovascularization potential of ADSCs derived from diabetic rats by affecting the HIF‐1α pathway.
Introduction
Impaired angiogenesis plays a pivotal role in the pathogenesis of a variety of disorders such as diabetes mellitus (DM) 1, 2. Inadequate neovascularization of the skin, nerves and myocardium clinically translates into the major manifestations of diabetes, including impaired wound healing, neuropathy and poor prognosis after myocardial infarction 3, 4. In this setting, therapeutic angiogenesis is an ideal option towards restoring normal circulation in many human diseases, particularly DM.
Recently, adult stem cell‐based medicine has been shown to be a promising therapeutic strategy, facilitating repair of diabetic ischaemic tissues 5. Some criteria among others, make ADSCs attractive candidates for use in cell therapies. ADSCs are multipotent mesenchymal stromal cells (MSCs), which are easily accessible, easy to culture to high numbers and able to self‐renew and differentiate into various cell types, in particular endothelial cells and vascular myocytes 6, 7. Moreover, autologous ADSCs, due to their secretion of many potent angiogenic factors and not being subject to immune rejection, have been considered to be excellent choice for curative neovascularization treatment 8, 9, 10. However, previous reports have indicated that ADSCs fron a diabetic source, compared to normal ADSCs, exhibit poor and insufficient angiogenic induction 11, 12. Clinically, such an obstacle may prevent application of autologous diabetic ADSCs. There is, thus, a need to identify and revive intrinsic impaired mechanisms before cell implantation.
It has also been demonstrated that hypoxia‐inducible factor‐1 (HIF‐1) transcriptional complex regulates a wide range of hypoxia‐induced cell processes including angiogenic factor production in ADSCs 13, 14. The HIF‐1 transcriptional complex plays a central role in cell responses when oxygen availability changes; it is composed of a hypoxia‐regulated alpha subunit and a stable beta subunit 15. Under normoxic conditions, the HIF‐1α subunit rapidly becomes hydroxylated by HIF prolyl‐hydroxylases (PHDs), followed by ubiquitination and proteasomal degradation. PHDs enzymes belong to the oxygenase superfamily, which needs iron and 2‐oxoglutarate as cofactors 16, 17, 18. In normoxia, use of an iron‐chelating agent causes enzyme inhibition, leading to HIF‐1α stabilization. HIF‐1, through binding to hypoxia response elements (HREs), can up‐regulate expression of several angiogenic genes such as vascular endothelial growth factor (VEGF), stromal cell‐derived factor 1 (SDF‐1), fibroblast growth factor‐2 (FGF‐2) and matrix metalloproteinases (MMPs)‐2 and ‐9 19, 20. MMPs are extracellular endoproteinases secreted by MSCs, and play important roles during angiogenesis. They facilitate migration of endothelial cells by disrupting extracellular matrix (ECM), and can also release angiogenic factors including VEGF and FGF‐2 from the ECM. Several MMPs particularly, MMP‐2 and ‐9, have been recognized as being more involved in proceeding to angiogenesis 21, 22.
To date, different strategies have been proposed to promote functional capacity of impaired stem cells by affecting the HIF‐1α pathway, including preconditioning of stem cells with hypoxic shock 23 and pharmacological agents that mimic hypoxia 24, 25. DFO is an iron‐chelating agent used clinically in cases of iron overload, such as thalassaemia 26. It inhibits the HIF prolyl‐hydroxylases and can stabilize HIF‐1α through its iron‐chelating activity. Thus, DFO acts as a hypoxia mimetic agent in normoxia 27. In this respect, accumulating evidence has shown that DFO can increase VEGF secretion from ADSCs from non‐diabetic sources and bone marrow mesenchymal stem cells (BMSCs) from non‐diabetic sources, via the HIF‐1α pathway 13, 28. We, thus, sought to evaluate effects of DFO preconditioning on restoring angiogenic potential of ADSCs derived from STZ‐induced diabetic rats to enhance efficacy of cell therapy in DM, both in vitro and in vivo.
Material and methods
Antibodies and reagents
Polyclonal antibodies against FGF‐2 and SDF‐1 were from Abcam (Cambridge, UK). Fluorescein isothiocyanate (FITC)‐conjugated anti‐rat antibodies against CD45, CD90, FITC‐conjugated mouse IgG isotype control, purified mouse IgG isotype control and purified anti‐rat antibody to CD73 were purchased from BD Bioscience and eBioscience (San Diego, CA, USA). FITC‐conjugated CD11b antibody was obtained from GeneTex, Inc. (United States) and FITC‐conjugated anti‐rat CD44 and CD31 were purchased from Serotec (Oxford, UK). HIF inhibitor was from Santa Cruz Biotechnology (San Jose, CA, USA) and rat VEGF Quantikine enzyme‐linked immunosorbent assay (ELISA) kit was from R&D Systems. Monoclonal antibodies against HIF‐1α, DFO, gelatin A and B, streptozotocin, protease and phosphatase inhibitor cocktails, collagenase type I and MTT were purchased from Sigma (Sigma Aldrich, St Louis, MO, USA). Minimal essential medium α (αMEM), foetal bovine serum (FBS) and penicillin‐streptomycin were from Gibco (Invitrogen, Carlsbad, CA, USA) and Trizol reagent was from Invitrogen (Merelbeke, Belgium). Oligo (dT) primer, moloney murine leukaemia virus reverse transcriptase (M‐MLV RT) and Maxima® SYBR Green/ROX qPCR Master Mix (2X) were purchased through Fermentas (UK). Horseradish peroxidase‐linked anti‐rabbit secondary antibody and anti‐glyceraldehyde‐3‐phosphate dehydrogenase antibody (GAPDH) were obtained from Cell Signaling (Danvers, MA, USA). Cytodex 3 microcarrier bead was from Amersham Pharmacia Biotech (UK) and Amicon Ultra‐15 Centrifugal Filter Unit with Ultracel‐3 membrane was from Millipore.
Experimental animals
Male Wistar rats aged 8–10 weeks, weighing 200–250 g were purchased from the animal facility of the Pasture Institute of Iran. They were maintained in standard conditions (individual plastic cages, temperature 20–26 °C and humidity of 40–70%, with regular light cycles of 12/12 h light/dark). The study was accepted by the Ethical Committee of Tehran University of Medical Sciences and was performed in accordance with its guideline base on the National Institutes of Health Principles of Laboratory Animal Care (NIH publication no. 85‐23, revised 1985).
Induction of diabetes
Twenty rats were classified randomly into two groups: normal group (n = 10) and diabetic group (n = 10). Diabetes was induced in rats of the diabetic group by a single intraperitoneal injection of streptozotocin (STZ) (55 mg/kg). One week after injection, blood glucose levels were measured. Only animals with blood glucose levels >300 mg/dl were included in the study. Over the next 4 months, blood glucose was measured twice every month to ensure that its level was over 300 mg/dl.
ADSC isolation
All procedures were performed under sterile conditions. First, rats were euthanized using ketamine/xylazine overdose. After shaving abdominal hair, skin was cleansed using povidone‐iodine solution. Epididymal fat‐pads were excised from diabetic and non‐diabetic (normal) animals and were soaked in phosphate‐buffered saline (PBS) containing 5% penicillin/streptomycin and antimycotic agent. Debris was removed, fat tissues were minced, and washed extensively in PBS to remove haematopoietic cells. For isolation of ADSCs, adipose tissues were exposed to 0.075% collagenase type I prepared in αMEM containing 2% penicillin/streptomycin under gentle agitation for 30 min at 37 °C. Collagenase was neutralized with growth medium (αMEM containing 15% FBS and 1% penicillin/streptomycin) and the mixture was centrifuged at 2000 rpm for 6 min. After discarding supernatants, pellets were suspended in 1 ml ice‐cold lysis buffer for 10 min and subsequently washed in PBS. Growth medium was added to pellets and filtered using a 100 μm nylon mesh. Filtered fractions were incubated in a humidified chamber with 5% CO2 atmosphere at 37 °C. Adherent cells at third passages were used as ADSCs in the next steps 7.
Characterization of ADSCs
ADSC surface marker expressions were evaluated using fluorescence‐activated cell sorting (FACS) analysis with a FACS Calibur cytometer (Becton Dickinson, San Diego, CA, USA). Briefly, cultured ADSCs from three to four passages were pelleted and washed three times in PBS. Afterwards 2 × 10⁵ cells were incubated in saturated concentration of FITC‐conjugated anti‐rat antibodies against CD11b, CD31, CD44, CD45, CD90 and purified CD73 for 40 min at 4 °C in the dark. FITC‐unconjugated antibody was incubated with secondary conjugated antibody for 15 min. Mouse IgG isotype served as negative control. Cells were centrifuged for 6 min and resuspended in PBS. Finally, results were analysed using Cell Quest software and compared to isotype control.
Colony‐forming unit (CFU) assay
CFU assay was used to compare size and number of colonies derived from normal and diabetic ADSCs. Appropriate numbers of cells at early passages were seeded in six‐well plates. Growth medium was changed every 3–4 days and after 2 weeks, dishes were washed in 10–15 ml PBS. Then, colonies were fixed and stained with 5 ml 0.5% crystal violet solution in methanol for 30 min. After rinsing in PBS, numbers and sizes of colonies were determined using NIH ImageJ software (http://rsbweb.nih.gov/ij). Colonies with a minimum of 50 cells were included.
Quantification of intracellular iron by atomic absorption spectroscopy
Cultured ADSCs (passage 3) were pelleted and washed three times in cold PBS. Next, 1 × 10⁶ cells were lysed with 500 μl of 50 mm NaOH for 2 h on a shaker. Cell lysates were used for quantification of total amount of iron, using atomic absorption spectroscopy (Varian SpectrAA‐600 Atomic Absorption Spectrometer with GTA 100). Intracellular iron concentration was reported as iron (pg) per cell.
Preparation of different concentrations of DFO
DFO was dissolved in distilled water and kept at 4 °C. Required concentrations of DFO (75, 150, 300 μm) were prepared from the stock solution. HIF‐1 inhibitor was used according to the manufacturer's instructions. Briefly, 30 μm HIF‐1 inhibitor was used 1 h before pre‐treatment of ADSCs with 300 μm DFO.
MTT assay
The MTT assay is one of the most frequently used colorimetric assays for determining cell viability. Activity of mitochondrial dehydrogenases in viable cells leads to reduction of tetrazolium salts to dark blue formazan. Briefly, normal ADSCs (nADSCs) and diabetic ADSCs (dADSCs) were seeded into 96‐well microplates at 10,000 cells per well. Final reaction products of nADSCs and dADSCs were measured after 24, 48 and 72 h. For evaluation of cytotoxic effects of DFO on dADSCs, cells were seeded into 96‐well microplates; after 24 h, they were exposed to different concentrations of DFO (0, 75, 150, 300 μm). After 24, 48 and 72 h, MTT solution was added into each well and plates were incubated for 4 h at 37 °C in the dark. Medium was removed and dimethylsulphoxide (DMSO) (100 μl) was added to each well. Absorbance of the solution was measured at 570 nm using a microplate reader (Bio‐Tek ELX800, Winooski, VT, USA).
Real‐time PCR
Normal, non‐treated and treated diabetic ADSCs after exposure to DFO, were used for total RNA extraction, by utilization of Trizol reagent according to the manufacturer's protocols. Then, RNA quality and concentration were evaluated spectrophotometerically. Complementary DNA was synthesized by 1 μl M‐MLV RT, 1 μl deoxyribonucleotide triphosphates (dNTPs), 0.5 μl RNase Inhibitor, 2 μl oligo (dT) primer and 3 μg RNA in final volume of 20 μl. The mixture was incubated for 1 h at 42 °C, followed by incubation at 72 °C for 10 min. Quantitative reverse transcription‐polymerase chain reaction (qRT‐PCR) was performed using the Rotor‐Gene 6000 System (Corbett Research). Reaction mixture contained cDNA template, 15 μl the Maxima SYBR Green/ROX qPCR Master Mix and specific primers (Table 1). GAPDH was used as endogenous control gene. Thermal cycling profile was as follows: Initial denaturation at 95 °C for 10 min, and 40 cycles of denaturing at 95 °C for 15 s, annealing at 60 °C for 30 s and extension for 30 s at 72 °C. Threshold cycle (Ct) was determined for GAPDH and target genes of each sample. ΔCt was calculated for each sample and relative gene expressions were calculated.
Table 1.
Rat primers for qRT‐PCR
| Gene | Sense strand | Antisense strand | Size of product |
|---|---|---|---|
| VEGF | GTGTGTGTGTGTATGAAATCTGTG | GCAGAGCTGAGTGTTAGCAA | 107 bp |
| FGF‐2 | TCCAAGCAGAAGAGAGAGGAG | GGCGTTCAAAGAAGAAACAC | 129 bp |
| SDF‐1 | AAACTGTGCCCTTCAGATTG | GGCTTTGTCCAGGTACTCTTG | 100 bp |
| GAPDH | ACA GTC CAT GCC ATC ACT | GCC TGC TTC ACC ACC TTC | 266 bp |
Western blot analysis
Non‐treated and treated cells were trypsinized, and washed centrifugally twice, in cold PBS. Cells were lysed using ice‐cold lysis buffer containing a protease and phosphatase inhibitor cocktail and centrifuged for 30 min, 12,000 g at 4°C. Total protein concentration was determined using the Bradford method 29. Equal concentration of samples (150 μg) was loaded and separated on SDS‐PAGE gel. Next, proteins were transferred to nitrocellulose membranes followed by incubation with primary antibodies overnight at 4 °C. Antibodies included mouse monoclonal anti‐HIF‐1α (1:500), rabbit polyclonal anti‐FGF‐2 (5:1000), rabbit anti‐SDF‐1 (2.5:1000) and rabbit anti‐GAPDH (1:5000). After this step, membranes were incubated with secondary antibody (anti‐mouse or anti‐rabbit conjugated to horseradish peroxidase) for 1 h at 4 °C. An enhanced chemiluminescence kit was used to visualize protein bands which were then quantified by densitometry, using Total Lab software (UK).
Preparation of conditioned media
After reaching 80% confluence, cultured ADSCs (in six‐well plates) were rinsed in PBS and fed with 3 ml serum‐free medium. After 24 h, supernatants were collected and frozen at −80 °C until the following step. For in vivo experiments, conditioned medium (CM) was concentrated (50‐fold) by ultra‐filtration centrifugal filter units, with 3 kD cut‐off, according to the manufacturer's instructions. For collecting CM from pre‐treated ADSCs, cells were treated with DFO (150 and 300 μm) and/or HIF‐1 inhibitor, for 24 h then washed in PBS several times. Then they were incubated with serum‐free medium and supernatant was collected after 24 h.
ELISA assay for release of VEGF
VEGF concentration was measured in 50 μl different culture media (CM) from standards in 0 to 2000 pg/ml range, using an ELISA kit, according to the manufacturer's instructions. VEGF expression was normalized to protein concentration.
Gelatin zymography
A zymography assay was used to analyse effects of DFO on activities of matrix metalloproteinases (MMPs)‐2 and ‐9, in nADSCs and dADSCs. CM were prepared as described above and subjected to zymographic assay. Briefly, supernatants were mixed with 3X loading buffer (125 mM Tris‐HCl, 20% glycerol, 2% SDS and 0.002% bromophenol blue, pH 6.8). Mixtures were separated electrophoretically using 10% polyacrylamide gel, in the presence of 0.1% SDS containing 0.1% gelatin A (MMP‐2) or B (MMP‐9). Then, gels were soaked in Triton X‐100 for 60 min and incubated in developing buffer (50 mm Tris‐HCl, 200 mm NaCl, 5 mm CaCl2 and 0.01% NaN3, pH 7.5) overnight at 37 °C. Subsequently gels were stained with Coomassie Blue solution (0.1% Coomassie Brilliant Blue G‐250, 40% methanol, 10% acetic acid and deionized water) and then destained with 40% methanol, 10% acetic acid and deionized water. When enzyme‐digested regions were visualized as white bands against a blue background, gels were photographed and bands were quantified using densitometric analysis from Total Lab software.
In vitro scratch assay
The scratch assay is a straightforward method to evaluate cell migration in vitro. HUVECs were obtained from the Pasteur Institute (Tehran, Iran). They were loaded into six‐well plates, all at the same density, and then 5 ml growth medium was added to each well. After reaching 90% confluence, scratch wounds were created in the cell monolayers by scraping them with a sterile 1000 μl pipette tip. After removal of detached cells by washing in PBS, cells were fed CM derived from treated and non‐treated cells. The HUVECs were then incubated to allow cells to migrate into the scratch area. The next step was capturing photographic images during cell migration (from five random, separate, microscopic fields) and analysing them using NIH Image J software 30.
HUVEC capillary tube formation in three‐dimensional collagen gel
The HUVECs were mixed with Cytodex 3 microcarrier beads and placed in an incubator at 37 °C and the mixed suspension was flicked every 20 min to allow for uniform distribution of cells on the microcarrier beads. Beads were seeded in 12‐well plates and then incubated overnight at 37 °C. On the following day, cell‐coated beads were embedded in ice‐cold collagen matrix and serum‐free medium and the mixture was loaded into 96‐well plates and allowed to solidify for 45 min at 37 °C. Next, serum‐free medium, and CM derived from normal, DFO‐treated and non‐treated diabetic ADSCs were added to wells. Cells were photographed after 48 h. Sprout formation was analysed using NIH Image J software according to the standard method, and are presented as percentages of control 31.
Wound healing model
Forty‐eight male Wistar rats were randomly divided into four groups as follows: treated with serum‐free media, those treated with CM derived from diabetic rats, normal, and 300 μm DFO‐treated ADSCs. Excisional wounds were created in the splinting model, as described previously 8. In brief, following administration of anaesthesia (intramuscular injection of xylazine and ketamine), dorsal areas of rats were shaved and one 8 mm full‐thickness excisional skin wound, per animal, was created in the midline of the neck. Wounds were injected with 100 μl concentrated medium and concentrated CM derived from normal, 300 μm DFO‐treated and non‐treated diabetic ADSCs (60 μl around the wound and 40 μl into the wound bed). The animals were housed individually for 2 weeks.
Wound area analysis
Digital photographs of wounds were captured after creating during healing. Wound areas were blindly measured in mm2 squares, using NIH Image J software. Then, wound closure rates were calculated using the following formula 32:
Histological examination
Rats were sacrificed on days 3, 7, 10 and 14 and skin samples, including wounds plus 10 mm of surrounding skin, were collected for histological examination. Skin specimens were fixed in 10% formalin solution and embedded in paraffin wax blocks. Afterwards, 3 μm sections were stained with Masson's trichrome for collagen fibre staining and haematoxylin and eosin (H&E). Angiogenesis, epithelialization, collagen levels and macrophage counts were evaluated by examining three fields per section of the wounds at 100x and 400x magnification. Each sample was given a histological score using Abramov's histological scoring system 33 as summarized in Table 2.
Table 2.
Histological score based on Abramov's histological scoring system 33
| Scores | Collagen level | Epithelialization | Angiogenesis | Macrophages |
|---|---|---|---|---|
| 0 | None | None | None | – |
| 1 | Scant | Partial | 1–5 | 0–25 |
| 2 | Moderate | Complete, but immature or thin | 6–10 | 26–50 |
| 3 | Abundant | Complete and mature | ≥10 | >51 |
Statistical analysis
Statistical significance of mean differences between groups was analysed by one‐way or repeated ANOVA with Tukey's post‐test, and two‐way ANOVA with Duncan and Bonferroni post‐test, as appropriate. Unpaired Student's t‐testing was performed for comparisons between two groups (diabetic and normal ADSCs). Statistically, differences were assumed significant at P < 0.05. Results are presented as mean ± standard error of the mean (SEM).
Results
ADSC characterization and morphology of diabetic and normal ADSCs
Flow cytometry indicated that ADSCs (passage 3–4) were positive for CD90, CD73 and CD44 and were negative for haematopoietic and endothelial lineage markers CD11b, CD31 and CD45 (Fig. 1a). The cells had fibroblast‐like morphology at this passage level. Morphologically, dADSCs had more flattened appearances compared to nADSCs of the same passage (Fig. 1b).
Figure 1.
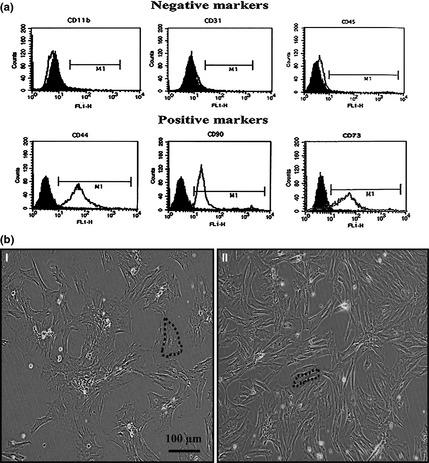
Characterization and morphological assessment of ADSC s. (a) Flow cytometry showed that the ADSCs were negative for CD45, CD11b and CD31 but positive for CD44, CD73 and CD90. Data are shown as a histogram plot, with black representing isotype control and white demonstrating experiments. (b) Assessment of morphology of ADSCs demonstrated that (I) diabetic ADSCs had more flattened and rounder morphology than (II) normal ADSCs. Dashed lines indicate cells.
CFU assay and iron content of diabetic and normal ADSCs
CFU assays revealed that dADSCs formed significantly lower numbers of colonies (6.9 ± 0.4%) than nADSCs (11.66 ± 0.7%) (P < 0.01). Also, colonies derived from dADSCs significantly were smaller (P < 0.001) than those derived from normal cells (Fig. 2a,b). Basal total iron content was found to be 0.041 ± 0.002 and 0.046 ± 0.001 pg iron per cell for nADSCs and dADSCs respectively (n = 3). There were no significant differences between means of iron content of diabetic ADSCs and normal ADSCs (Fig. 2c).
Figure 2.
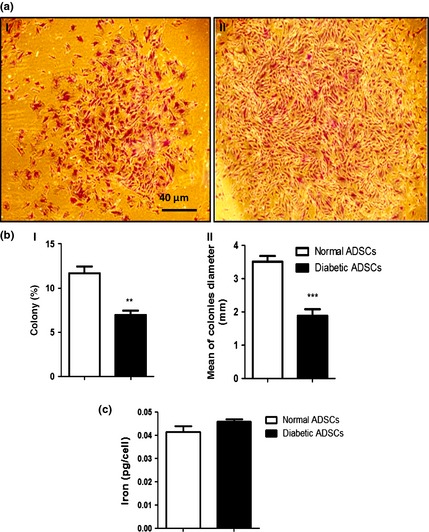
Colony formation and iron assessment of ADSC s. (a) Representative images of colonies of diabetic ADSCs (I) and normal ADSCs (II) by light microscopy. (b) Assessment of size (I) and number (II) of colonies derived from diabetic and normal ADSCs, by NIH imageing. (c) Assessment of iron content of normal and diabetic ADSCs. Data are represented as mean ± SEM (n = 3, **P < 0.01, ***P < 0.001 versus normal cells). Statistical significance was measured by unpaired Student's t‐test.
DFO, by MTT assay, showed no cytotoxic effect after 24 h
Cell viability was evaluated by MTT assay; nADSCs seemed to be more proliferative than dADSCs after 72 h (P < 0.01; Fig. 3a). Pre‐treatment of dADSCs with DFO (75, 150 and 300 μm) revealed no cytotoxic effect after 24 h (Fig. 3). The results demonstrate that DFO (150 μm) seemed to increase proliferation of ADSCs compared to non‐treated dADSCs after 24 h (P < 0.01; Fig. 3c). On the other hand, DFO significantly caused cytotoxic effects after 48 and 72 h (P < 0.05; Fig. 3). Hence, DFO was applied at concentrations of 150 and 300 μm for 24 h in all other experiments of this study.
Figure 3.
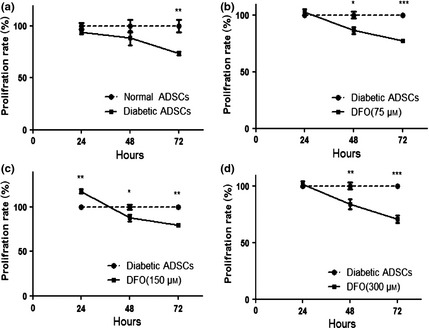
Effect of DFO on proliferation of ADSC s. (a) Viability of diabetic cells significantly was lower than viability of normal ADSCs after 72 h measured by MTT assay. Diabetic ADSCs were treated with 75 μm (b), 150 μm (c) and 300 μm (d) of DFO for 24, 48 and 72 h and their viability was measured by MTT assay. Data are represented as mean ± SEM (n = 5; *P < 0.05, **P < 0.01, ***P < 0.001 versus normal cells). Statistical significance was measured by repeated measures ANOVA.
DFO preconditioning enhanced HIF‐1α protein expression in diabetic ADSCs
Western blotting assay was used to compare HIF‐1α protein expression in nADSCs, DFO‐treated and non‐treated dADSCs. The results indicated that non‐treated dADSCs had significantly lower HIF‐1α protein expression levels compared to nADSCs (P < 0.001). HIF‐1 expression was enhanced in dADSCs at 150 (P < 0.01) and 300 μm (P < 0.001) concentration of DFO in a concentration manner, so that non‐significant changes were detected between normal group and treated groups. This effect was remarkably reversed by pre‐treatment with 30 μm of HIF‐1 inhibitor 1 hour before exposure to 300 μm DFO (P < 0.001) (Fig. 4a). HIF‐1α expression was also assessed in dADSCs pre‐treated with 150 μm DFO over the appropriate time period (0, 6, 12, 24 h). DFO significantly increased HIF‐1α expression after 12 h (P < 0.05) and to a highest level after 24 h (P < 0.001), before showing cytotoxic effects (Fig. 4b). Therefore, DFO was applied for 24 h in all other experiments of this study.
Figure 4.
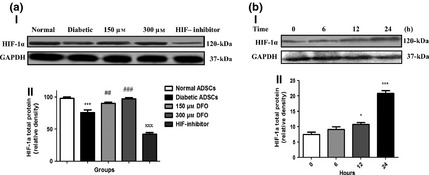
Effect of DFO on HIF ‐1α expression at protein level. (a) Representative blot (I) and semi‐quantitative data (II) of HIF‐1α expression at protein level in normal and diabetic ADSCs and treated dADSCs at different concentrations of DFO after 24 h. (b) Representative blot (I) and semi‐quantitative data (II) of HIF‐1α expression at protein levels in treated dADSCs with DFO (150 μm) after different times. Data are represented as mean ± SEM (n = 3; *P < 0.05, ***P < 0.001 versus normal cells and ## P < 0.01, ### P < 0.001 versus diabetic cells and xxx P < 0.001 versus 300 μm DFO‐treated dADSCs). Statistical significance measured by one‐way ANOVA.
DFO enhanced VEGF, FGF‐2 and SDF‐1 mRNA expression levels
Quantitative real‐time PCR was performed on nADSCs, DFO‐treated and non‐treated dADSCs and results indicated that for all genes, dADSCs had significant reduction in related mRNA levels, compared to nADSCs, so that VEGF, SDF‐1 and FGF‐2 expression levels were 0.13 ± 0.01 (P < 0.001), 0.07 ± 0.001 (P < 0.001) and 0.01 ± 0.008 (P < 0.01) times lower in dADSCs respectively. In treated subgroups with 150 and 300 μm concentrations DFO, expression levels of VEGF were estimated to be in the order of 0.42 ± 0.01 times (P < 0.001) and 1.36 ± 0.1 times (P < 0.05) respectively, versus nADSCs. Furthermore, in treated cells with 150 and 300 μm concentrations DFO, expression levels of SDF‐1 were estimated to be in the order of 0.32 ± 0.01 times (P < 0.01) and 0.68 ± 0.9 times (P > 0.05) respectively versus nADSCs. FGF‐2 expression was estimated in both 150 and 300 μm concentrations of DFO‐treated diabetic ADSCs to be in the order of 0.47 ± 0.08 times (P < 0.05) versus nADSCs. Notably, VEGF expression was higher at 300 μm concentration of DFO‐treated dADSCs compared to normal cells. SDF‐1 expression was enhanced at 300 μm concentration of DFO so that non‐significant change was detected between normal ADSCs and 300 μm DFO‐treated ADSCs. On the other hand, treatment with DFO did not promote expression of FGF‐2 to reach the normal level (Fig. 5a).
Figure 5.
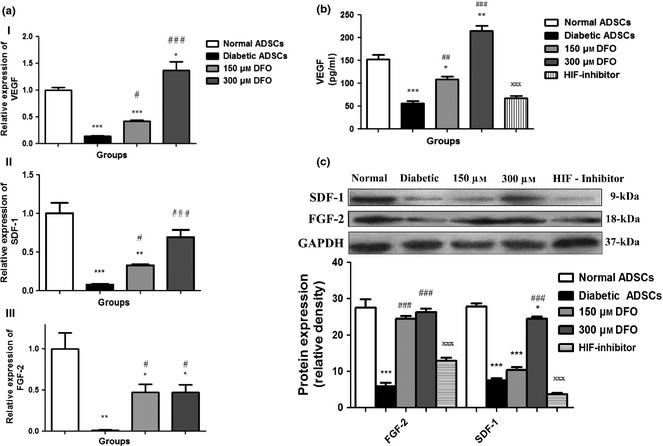
Effect of DFO on angiogenic gene expression. (a) Diabetic ADSCs were exposed to DFO (150 and 300 μm) for 24 h and mRNA expression levels of VEGF (a), SDF‐1(b) and FGF‐2 (c) genes determined by qRT‐PCR. (b) Secretion measurement of VEGF in CM of ADSCs after treatment with DFO by ELISA assay. (c) Representative blots and semi‐quantitative data of SDF‐1 and FGF‐2 expression at protein levels in non‐treated and treated ADSCs with different concentrations of DFO after 24 h. Data are represented as mean ± SEM (n = 3; *P < 0.05, **P < 0.01, ***P < 0.001 versus normal cells and # P < 0.05, ## P < 0.01, ### P < 0.001 versus diabetic cells and xxx P < 0.001 versus 300 μm DFO‐treated dADSCs). Statistical significance measured by one‐way ANOVA.
Promotion of VEGF protein secretion by DFO
To investigate effects of DFO on VEGF protein release, ELISA was performed on CM derived from ADSCs. Secretion of VEGF in CM of dADSCs was significantly lower than that obtained from nADSCs (P < 0.001), and secretion of VEGF in CM was significantly enhanced by 150 (P < 0.01) and 300 μm (P < 0.001) DFO compared to non‐treated dADSCs, cells in a concentration‐dependent manner. VEGF secretion was restored at 300 μm concentration of DFO (P < 0.01). This effect was reversed by the use of HIF‐1 inhibitor (P < 0.001; Fig. 5b).
DFO promoted FGF‐2 and SDF‐1 protein expression levels
Translation of FGF‐2 and SDF‐1 genes to protein was determined by western blot assay. In nADSCs, expression of FGF‐2 (P < 0.001) and SDF‐1 (P < 0.001) genes was higher than dADSCs and level of SDF‐1 protein was enhanced at 300 μm concentration of DFO (P < 0.001) compared to dADSCs. Treatment with DFO (150 and 300 μm) promoted expression of FGF‐2 so that non‐significant change was detected between nADSCs and treated dADSCs. The elevating effect of DFO on FGF‐2 (P < 0.001) and SDF‐1 (P < 0.001) protein expression was significantly reversed by use of HIF‐1 inhibitor (Fig. 5c).
DFO promoted MMP‐2 and ‐9 activity in diabetic ADSCs
MMP‐2 and MMP‐9 enzyme activities were assessed by gelatin zymography. CM collected from cultured nADSCs had significantly higher levels of zymographic activity than of dADSCs, for MMP‐2 and for MMP‐9 (P < 0.001). DFO significantly increased enzyme activity of MMP‐2 and MMP‐9 compared to dADSCs (150 μm; P < 0.001 and 300 μm; P < 0.001). Notably, enzyme activity of MMP‐2 and ‐9 of CM derived from 300 μm concentration of DFO‐treated dADSCs was similar to those derived from normal cells (Fig. 6).
Figure 6.
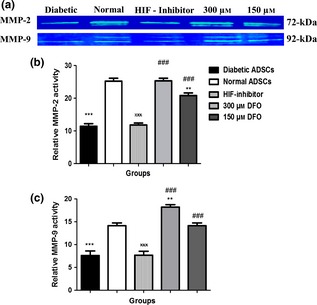
Assessment of gelatinases by gelatin zymography in ADSC s. Representative zymogram (a) and semi‐quantitative data of MMP‐2 (b) and MMP‐9 (c) activity in conditioned media derived from nADSCs, DFO‐treated and non‐treated dADSCs. The areas of protease activity appeared as white bands. Data are represented as mean ± SEM. Data are represented as mean ± SEM (n = 3; **P < 0.01, ***P < 0.001 versus normal cells and ### P < 0.001 versus diabetic cells and xxx P < 0.001 versus 300 μm DFO‐treated dADSCs). Statistical significant differences by one‐way ANOVA.
Migration increased with conditioned medium derived from DFO pre‐treated cells
CM derived from normal (P < 0.001), 150 μm (P < 0.01) and 300 μm (P < 0.001) DFO‐treated dADSCs remarkably increased migration of HUVECs in comparison with CM derived from non‐treated dADSCs. Potentials of CM derived from 150 and 300 μm DFO‐treated ADSCs to promote migration were similar to those derived from normal cells. Non‐significant changes in migration rate were detected between CM derived from diabetic group and serum‐free medium (Fig. 7a,b).
Figure 7.
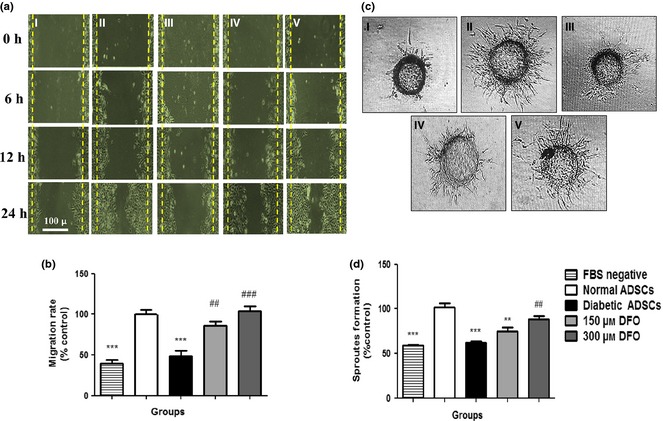
Assessment of angiogenic potential of conditioned media derived from ADSC s. (a) Representative image of migration of HUVECs cultured in different media (I) medium without FBS, (II) CM derived from normal ADSCs, (III) diabetic ADSCs, (IV) 150 μm and (V) 300 μm DFO‐treated ADSCs by inverted microscopy after 24 h. (b) Assessment of areas free of HUVECs by NIH image software, in five separated fields. (c) Sprout formation of HUVECs in (I) serum‐free medium, (II) CM derived from nADSCs, (III) dADSCs, (IV) 150 μm and (V) 300 μm DFO‐treated dADSCs were monitored by inverted microscopy after 48 h. (d) Change in sprout formation of HUVECs determined by NIH image. Data represented as mean ± SEM (n = 3; **P < 0.01, ***P < 0.001 versus normal cells and ## P < 0.01, ### P < 0.001 versus diabetic cells). Statistical significance measured by one‐way ANOVA.
DFO enhanced tube formation in a three‐dimensional model of angiogenesis
CM derived from nADSCs (P < 0.001) and 300 μm (P < 0.01) DFO‐treated ADSCs had significantly higher levels of endothelial cell sprout formations compared to CM derived from dADSCs. The potential of CM derived from 300 μm DFO‐treated ADSCs to promote sprout formation was similar to that derived from normal cells. Hence, DFO was applied at concentrations of 300 μm for evaluating effects of CM derived from DFO‐treated diabetic ADSCs on wound healing (Fig. 7c,d).
Effect of CM derived from DFO pre‐treated diabetic ADSCs on wound closure
On the first day, mean wound area was 51.45 ± 0.12 mm2. Analysis showed that there were no remarkable differences in primary wound area between the four groups (P > 0.05). A two‐way analysis of variances showed that wounds injected with CM derived from normal (normal ADSC group; P < 0.05) and 300 μm DFO‐treated ADSCs (DFO‐treated ADSC group; P < 0.05) showed significantly higher levels of wound closure rate compared to those injected with CM derived from dADSCs and FBS‐negative medium (Fig. 8a,b). Analysis with Duncan and Bonferroni post‐testing also showed that wound closure rate increased in all groups over 14 days, so that wound closure rate in groups injected with CM derived from normal or 300 μm DFO‐treated ADSCs was significantly higher than those injected with CM derived from dADSC groups after 10 days (P < 0.05).
Figure 8.
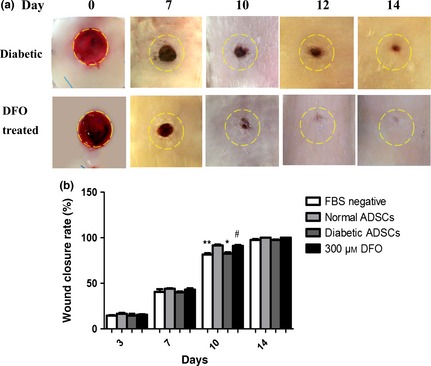
Assessment of rat wound closure rate after treatment with different conditioned media derived from ADSC s. Following creating 8 mm full‐thickness excisional skin wounds, wounds were injected with 100 μl concentrated medium and concentrated CM derived from ADSCs. Yellow dash lines indicate margins of primary wounds. (a) Representative gross picture of healing process of wounds injected with conditioned media derived from non‐treated diabetic ADSCs (control) and 300 μm DFO‐treated dADSCs (DFO‐treated) after 0, 7, 10, 12 and 14 days. (b) Quantification of wound closure rate in all groups using NIH ImageJ software. CM derived from normal and 300 μm DFO‐treated ADSCs significantly increased wound healing rates compared to CM derived from dADSC groups over 10 days. Data are represented as mean ± SEM. (n = 3; *P < 0.05, **P < 0.01 versus normal cells, # P < 0.05 versus diabetic cells). Statistical significance by two‐way ANOVA.
Effect of CM derived from DFO pre‐treated diabetic ADSCs on angiogenesis in wounds
Two‐way ANOVA testing indicated that there was a significant effect of time (P < 0.001) and treatments (P < 0.001) on angiogenesis in wounds. It was shown that interaction between time and groups was significant in all parameters (P < 0.001), so that groups injected with CM derived from normal and 300 μm DFO‐treated ADSCs had significantly higher levels of angiogenesis compared to those injected with CM derived from dADSCs groups (P < 0.001). However, non‐significant differences in angiogenesis were detected between wounds injected with CM from normal and DFO‐treated ADSCs, or between those injected with CM derived from dADSCs and FBS‐free medium (P > 0.001). Analysis with Duncan post‐testing also showed that angiogenesis significantly increased over the first 3 days and reached its maximum level after 7 days. It then decreased by days 10 and 14 in all groups. Analysis by Bonferroni post‐testing also showed that angiogenic activity of CM derived from normal or 300 μm DFO‐treated ADSCs was significantly (P < 0.001) higher than CM derived from dADSCs on 3 and 7 days, and non‐significant differences were observed between groups regarding angiogenesis on days 10 and 14 (Fig. 9a,b).
Figure 9.
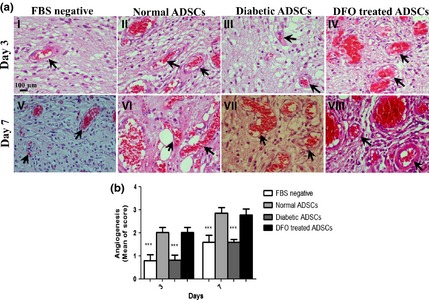
Assessment of rat wound angiogenesis after treatment with different conditioned media derived from ADSC s. (a) Haematoxylin and eosin‐stained histological sections for assessment of angiogenesis in wounds treated with serum‐free medium (I&V), CM derived from (II&VI) nADSCs, (III&VII) dADSCs and (IV&VIII) 300 μm DFO‐treated dADSCs are shown after 3 and 7 days respectively. Arrows denote blood vessels. (b) Comparison between angiogenic scores in groups after 3 and 7 days. Data are represented as mean ± SEM. (n = 3; ***P < 0.001 versus normal cells). Statistical significance measured by two‐way ANOVA.
Effect of CM derived from DFO pre‐treated diabetic ADSCs on collagenization and epitheliarization
Two‐way ANOVA testing indicated that there was a significant effect of time (P < 0.001) and treatments (P < 0.001) on collagenization and epitheliarization of wounds in all groups. It was shown that groups which were injected with CM derived from normal and 300 μm DFO‐treated ADSCs had significantly higher levels of collagenization and epitheliarization compared to those injected with CM derived from dADSC groups (P < 0.001). Epitheliarization also was enhanced in all groups over the 14 days experimentation (P < 0.001). Groups treated with CM derived from normal and DFO‐treated cells compared to those injected with CM derived from dADSCs had higher levels of epitheliarization, so that differences between CM derived from normal or 300 μm DFO‐treated ADSCs and CM derived from dADSCs were significant after 10 days (P < 0.001). On day 14, wounds of all groups were fully epitheliarized but in groups injected with CM derived from dADSCs, scabs covered wounds until day 14; otherwise scabs were not seen in wounds injected with CM derived from treated group (Fig. 10; Table 3). Collagen levels also increased after 3 days and reached to maximum levels by 10 days then reduced in all groups. Collagen levels were significantly (P < 0.001) higher in groups injected with CM derived from normal and DFO‐treated ADSCs compared to those treated with CM derived from dADSC groups (P < 0.001; Fig. 11; Table 3). There was no significant difference in macrophage count between any groups during the study (P > 0.05; Table 3).
Figure 10.
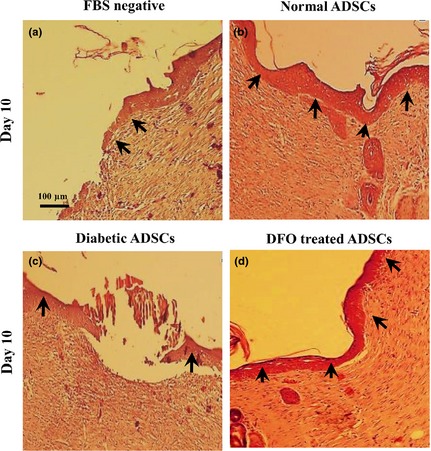
Effect of CM derived from DFO pre‐treated cells on epitheliarization. Epitheliarization was evaluated using histological analysis after H&E staining at x100 magnification by light microscopy. Arrows denote epithelium. Wounds injected with conditioned media derived from normal ADSCs (b) and 300 μm DFO‐treated diabetic ADSCs (d) had higher tissue epitheliarization compared to those injected with CM derived from serum‐free medium (a) and non‐treated diabetic ADSCs (c).
Table 3.
Histological findings between groups. Collagen, epithelialization and macrophage assessment of wounds injected with serum‐free medium and different conditioned media
| Parameter | Groups | Treatment days Mean ± SEM | |||
|---|---|---|---|---|---|
| Day 3 | Day 7 | Day 10 | Day 14 | ||
| Collagen | Serum‐free mediuma | 0.0 ± 0.0 | 1.0 ± 0.0 | 1.5 ± 0.1*** | 1.5 ± 0.1 |
| Normalb | 0.0 ± 0.0 | 1.3 ± 0.1 | 2.7 ± 0.1 | 1.6 ± 0.1 | |
| Diabeticc | 0.0 ± 0.0 | 1.1 ± 0.1 | 1.7 ± 0.1*** | 1.3 ± 0.1 | |
| DFO treatedd | 0.0 ± 0.0 | 1.4 ± 0.1 | 2.5 ± 0.1 | 1.5 ± 0.1 | |
| Epithelialization | Serum‐free medium | 0.0 ± 0.0 | 0.6 ± 0.3 | 1.3 ± 0.5*** | 2.6 ± 0.3 |
| Normal | 0.0 ± 0.0 | 0.6 ± 0.3 | 3.0 ± 0.0 | 3.0 ± 0.0 | |
| Diabetic | 0.0 ± 0.0 | 0.6 ± 0.3 | 1.3 ± 0.5*** | 3.0 ± 0.0 | |
| DFO treated | 0.0 ± 0.0 | 1.0 ± 0.0 | 2.6 ± 0.5 | 3.0 ± 0.0 | |
| Macrophage | Serum‐free medium | 0.8 ± 0.4 | 1.6 ± 0.5 | 1.7 ± 0.5 | 1.0 ± 0.0 |
| Normal | 1.0 ± 0.0 | 1.6 ± 0.5 | 1.8 ± 0.4 | 0.8 ± 0.4 | |
| Diabetic | 0.7 ± 0.5 | 1.8 ± 0.4 | 1.8 ± 0.4 | 1.4 ± 0.5 | |
| DFO treated | 0.8 ± 0.4 | 1.8 ± 0.4 | 1.6 ± 0.5 | 1.6 ± 0.5 | |
Data are represented as mean ± SEM (n = 3; ***P < 0.001 versus normal group).
Groups injected with serum‐free medium.
Groups injected with conditioned medium derived from normal ADSCs.
Groups injected with conditioned medium derived from non‐treated diabetic ADSCs.
Groups injected with conditioned medium derived from 300 μm DFO‐treated ADSCs
Figure 11.
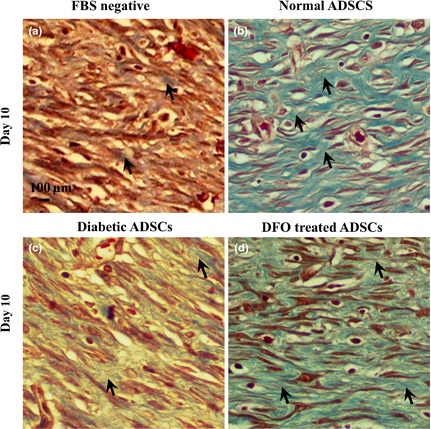
Effect of CM derived from DFO pre‐treated cells on collagenization. Collagenization was evaluated using Masson's trichrome staining at x400 magnification, by light microscopy. Collagen fibres are stained blue and arrows denote collagen fibres. Wounds injected with conditioned media derived from normal ADSCs (b) and 300 μm DFO‐treated diabetic ADSCs (d) had higher tissue collagenization compared to those injected with CM derived from non‐treated diabetic ADSCs (c) and serum‐free medium (a).
Discussion
Over the last decade, cell therapy based on ADSCs has emerged as an appealing approach for promoting angiogenesis in ischaemic tissues 12. However, diseases affecting vasculature can inversely influence therapeutic potential of autologous ADSCs utilized in cell therapy 34, 35. Hence, for enhancing angiogenesis, pre‐treatment strategies are required to revive normal function of autologous ADSCs before transplantation. To date, hypoxia preconditioning has been considered a desirable approach to enhance survival and therapeutic neovascularization capacity of implanted cells 23, 36. Interestingly, pharmacological agents mimicking hypoxia have been found to be used more easily and economically to restore impaired angiogenic mechanisms 24. In the current study, for the first time, we employed a pharmacological preconditioning approach based on targeting HIF‐1α to restore hampered cell functions of ADSCs, under diabetic conditions. First, proliferative capacity as well as angiogenic gene profiles of dADSCs were examined compared to healthy controls. The current results seem to indicate that proliferative possibility of dADSCs was lower than normal cells, at similar passages. Moreover, in the CFU test, colonies derived from dADSCs were remarkably smaller and fewer than from nADSCs. In agreement with us, other studies have reported significantly lower proliferation and colony formation capacity of BMSCs obtained from diabetic rats compared to controls 37, 38; furthermore, similar results have been reported for epidermal stem cells (ESCs) derived from diabetic rats 39. In contrast, non‐significant changes in growth rate have been detected in dADSCs compared to nADSCs of mice 40. This discrepancy could be related to differences in experimental conditions such as duration of post‐diabetes induction. Our current report has also shown diabetic cells to display a more flattened appearance. This morphology could be due to premature ageing processes of dADSCs, which represent lower proliferative capacity and also show changes at the molecular level compared to control cells 41.
In addition to macroscopic differences, expression of HIF‐1α and its downstream angiogenic genes (VEGF, FGF‐2 and SDF‐1) as well as activity of MMP‐2 and MMP‐9 were significantly lower in dADSCs compared to nADSCs. Correspondingly, conditioned medium derived from dADSCs showed a significantly lower potential in scratch assays, three‐dimensional tube formation and wound healing. Several lines of evidence are in agreement with this report indicating significant defects in secretion of angiogenic cytokines. such as VEGF, from MSCs as well as impairment in expression of other genes associated with cell survival 12, 42. In contrast, Gu and colleagues have reported non‐significant differences between angiogenic capacity of dADSCs and nADSCs after implantation into ischaemic skin 11. Following assessment of impaired mechanisms in dADSCs, this study has tried to establish effects of DFO on dADSCs, and to evaluate the effectiveness of DFO to correct hampered mechanisms with the goal of utilizing the cells in cell therapy for diabetic patients. In the cell viability assay, DFO from 75 to 300 μm did not show any cytotoxic effect after 24 h. Consistent with the current results, in a recent study performed on nADSCs, DFO from 50 to 500 μm for 24 h did not show any cytotoxic effects 13. These findings suggest that DFO pre‐treatment may be a safe pharmacological approach for promoting angiogenic activity of ADSCs. These results have also demonstrated that DFO preconditioning significantly enhanced HIF‐1α expression at the protein level in a time‐ and concentration‐dependent manner. In agreement with this report, one pervious study has shown that DFO‐induced expression of HIF‐1α protein in BMSCs, reached its maximum level after 24 h 43.
The present invetsigation has also elucidated that DFO significantly increased expression of VEGF, SDF‐1 and FGF‐2 in mRNA and protein levels. Existence of HREs at the promoter level of VEGF, SDF‐1 and FGF‐2 genes is the most important possible reason for concordant stabilization of HIF‐1α and up‐regulation of relevant genes here 20, 44, 45. These results are supported by work performed by Hou et al., confirming that DFO, in a HIF‐1α‐dependent manner, significantly increased expression of VEGF and SDF‐1 genes in an excisional diabetic wound model 27. Similarly, local injection of DFO has prevented skin flap necrosis in mice by elevating expression of HIF‐1α, VEGF and endothelial progenitor cell (EPCs) mobilization 46. In a further study performed by Chekanov and colleagues, DFO enhanced expression of FGF‐2 in fibroblasts and smooth muscle cells 47. In contrast, Potier et al. showed that FGF‐2 expression was non‐significantly increased in DFO pre‐treated BMSCs at mRNA and protein levels 28. This discrepancy might be due to differences in time and concentration of DFO treatment. Moreover, these results indicated that high compared to low concentration of DFO (300 and 150 μm) increased expression of FGF‐2 genes to a similar extent. Based on this finding, further experiments are required to clarify whether there are other intervening pathways that prevent the promoting effect of DFO on FGF‐2 expression.
In addition to angiogenic factors, proteolytic enzymes also contribute to angiogenic activity of ADSCs. MSCs secrete MMP‐2 and‐9, which are two pivotal members of the MMP enzyme family. These are strongly involved in physiological processes, including endothelial invasion during angiogenesis 48, 49, and homing processes of stem cells 50. MMPs have been shown to increase angiogenesis through several mechanisms including remodelling components of the ECM, degradation of basement membranes, cleaving of endothelial cell–cell adhesions and pericyte detachment from vessels 49. In the current study, we found that DFO pre‐treatment significantly promoted activity of secreted MMP‐2 and ‐9 via a HIF‐1‐dependent pathway. These results have also been reported in previous investigations indicating that promoter activities of MMP‐2 and ‐9 were HIF‐1α‐dependent 51, 52. Najafi et al. demonstrated that DFO remarkably enhanced MMP‐2 and ‐9 enzyme activity in BMSCs by a HIF‐1α‐mediated mechanism 43. In contrast, one study on hepatoma cells has shown that MMP expression is HIF‐1α independent 53. Furthermore, it must be noted that activity of these enzymes would be adversely increased in chronic ischaemic areas such as diabetic wounds 54, 55, 56.
The current study has also shown that CM derived from DFO‐treated ADSCs significantly improved migration and sprout formation capacity of endothelial cells. Along with this result, one further investigation has also shown that hypoxic preconditioning promotes the ability of dADSCs and nADSCs to enhance angiogenesis by paracrine means 11, 12. Conversely, Jiang and colleagues reported that there was no remarkable differences between numbers and lengths of tubules produced by HUVECs treated with CM from DFO‐preconditioned and control ADSCs 13.
To investigate whether enhanced in vitro angiogenic capacity of DFO pre‐treated ADSCs contributed to improved in vivo angiogenic paracrine potential of ADSCs in injured tissue, we established a surgical wound model in rats. Histological examination showed that CM derived from normal and treated ADSCs (300 μm DFO) significantly enhanced angiogenesis. It has previously been shown that transplantation of MSCs promoted angiogenesis in the wound area of diabetic mice. This effect was predominantly mediated by paracrine effects rather than by their direct differentiation and incorporation in vascular walls 8. MSCs‐derived CM contain high levels of important potent angiogenic growth factors and chemoattractants including VEGF, FGF‐2 and SDF‐1 57, 58. VEGF enhances migration and proliferation of endothelial cells 59, 60. FGF‐2 seems to be a crucial factor for proliferation of endothelial and smooth muscle cells and development of mature blood vessels 61. SDF‐1 acts as a chemoattractant and augments stem cell homing and vasculogenesis 62. Furthermore, SDF‐1 regulates angiogenesis through binding to its receptors C‐X‐C chemokine receptor type 4 63 and it has been observed that its deficiency contributes to impaired wound healing in aged mice 64.
In addition, our current study has evaluated effects of CM derived from ADSCs on epitheliarization, collagenization and wound closure rate. Results have shown that CM derived from DFO‐treated cells restored these parameters by around day 10 and thus might be related to their higher angiogenic potential compared to CM derived from non‐treated cells. It has also been reported that angiogenesis (which plays a key role during wound healing processes) also influences other non‐angiogenic parameters related to wound healing 65, 66, 67. Moreover, there is a reat deal of evidence describing a role for VEGF in accelerating wound healing through ameliorating wound closure rate, epitheliarization and collagenization 68. However, more experiments are required to elucidate exact mechanisms involved in improving these histological findings, by CM derived from normal or DFO‐treated cells.
Moreover, current results have evaluated underlying mechanisms involved in impairment of angiogenic activity of ADSCs derived from type 1 diabetic rats, and may not be similar to other types of diabetes, including type 2, which is commonly associated with obesity. It has been shown that adipose tissues form obese humans and mice are poorly oxygenated which leads to induction of HIF‐1α in tissues 69, 70, 71. Hence, in contrast to our results, HIF‐1α and its downstream pathways might be activated in poorly oxygenated adipose tissues from type 2 diabetic patients. However, on the other hand, it may not occur. Botusan and colleagues have demonstrated that hyperglycaemia can make HIF‐1α more sensitive to degradation and reduces its stability in hypoxia 72. Thus, it is possible that hypoxia, presented in adipose tissues of type 2 diabetic patients, was not able to induce HIF‐1 expression. Hence, further research is needed to clarify these mechanisms in type 2 diabetes.
In conclusion, these results may provide a reliable approach for pharmacological preconditioning prior to clinical application of ADSCs derived from patients with type 1 diabetes, to revive their normal therapeutic value. It could also be concluded that HIF‐1α may act as an important and key mediator in the effect of DFO to up‐regulate pivotal angiogenic genes and therefore restore impaired mechanisms in ADSCs from rats with type 1 diabetes.
Conflict of interest
The authors confirm that there are no conflicts of interest.
Acknowledgements
This work was supported by a grant from Iran University of Medical Sciences and University of Malaya.
References
- 1. Thangarajah H, Vial IN, Grogan RH, Yao D, Shi Y, Januszyk M et al (2010) HIF‐1alpha dysfunction in diabetes. Cell Cycle 9, 75–79. [DOI] [PubMed] [Google Scholar]
- 2. De Vriese AS, Verbeuren TJ, Van de Voorde J, Lameire NH, Vanhoutte PM (2000) Endothelial dysfunction in diabetes. Br. J. Pharmacol. 130, 963–974. [DOI] [PMC free article] [PubMed] [Google Scholar]
- 3. Krock BL, Skuli N, Simon MC (2011) Hypoxia‐induced angiogenesis good and evil. Genes Cancer 2, 1117–1133. [DOI] [PMC free article] [PubMed] [Google Scholar]
- 4. Martin A, Komada MR, Sane DC (2003) Abnormal angiogenesis in diabetes mellitus. Med. Res. Rev. 23, 117–145. [DOI] [PubMed] [Google Scholar]
- 5. Patel DM, Shah J, Srivastava AS (2013) Therapeutic potential of mesenchymal stem cells in regenerative medicine. Stem Cells Int. 2013, 496218. doi: 10.1155/2013/496218. [DOI] [PMC free article] [PubMed] [Google Scholar]
- 6. Gimble JM, Katz AJ, Bunnell BA (2007) Adipose‐derived stem cells for regenerative medicine. Circ. Res. 100, 1249–1260. [DOI] [PMC free article] [PubMed] [Google Scholar]
- 7. Bunnell BA, Flaat M, Gagliardi C, Patel B, Ripoll C (2008) Adipose‐derived stem cells: isolation, expansion and differentiation. Methods 45, 115–120. [DOI] [PMC free article] [PubMed] [Google Scholar]
- 8. Wu Y, Chen L, Scott PG, Tredget EE (2007) Mesenchymal stem cells enhance wound healing through differentiation and angiogenesis. Stem Cells 25, 2648–2659. [DOI] [PubMed] [Google Scholar]
- 9. Murohara T, Shintani S, Kondo K (2009) Autologous adipose‐derived regenerative cells for therapeutic angiogenesis. Curr. Pharm. Des. 15, 2784–2790. [DOI] [PubMed] [Google Scholar]
- 10. Ankrum JA, Ong JF, Karp JM (2014) Mesenchymal stem cells: immune evasive, not immune privileged. Nat. Biotechnol. 32, 252–260. [DOI] [PMC free article] [PubMed] [Google Scholar]
- 11. Gu JH, Lee JS, Kim DW, Yoon ES, Dhong ES (2012) Neovascular potential of adipose‐derived stromal cells (ASCs) from diabetic patients. Wound Repair Regen. 20, 243–252. [DOI] [PubMed] [Google Scholar]
- 12. El‐Ftesi S, Chang EI, Longaker MT, Gurtner GC (2009) Aging and diabetes impair the neovascular potential of adipose‐derived stromal cells. Plast. Reconstr. Surg. 123, 475–485. [DOI] [PMC free article] [PubMed] [Google Scholar]
- 13. Liu GS, Peshavariya HM, Higuchi M, Chan EC, Dusting GJ, Jiang F (2013) Pharmacological priming of adipose‐derived stem cells for paracrine VEGF production with deferoxamine. J. Tissue Eng. Regen. Med. In Press. doi: 10.1002/term.1796. [DOI] [PubMed] [Google Scholar]
- 14. Xu Y, Zuo Y, Zhang H, Kang X, Yue F, Yi Z et al (2010) Induction of SENP1 in endothelial cells contributes to hypoxia‐driven VEGF expression and angiogenesis. J. Biol. Chem. 285, 36682–36688. [DOI] [PMC free article] [PubMed] [Google Scholar]
- 15. Wang GL, Jiang B‐H, Rue EA, Semenza GL (1995) Hypoxia‐inducible factor 1 is a basic‐helix‐loop‐helix‐PAS heterodimer regulated by cellular O2 tension. Proc. Natl Acad. Sci. 92, 5510–5514. [DOI] [PMC free article] [PubMed] [Google Scholar]
- 16. Mole DR, Schlemminger I, McNeill LA, Hewitson KS, Pugh CW, Ratcliffe PJ et al (2003) 2‐oxoglutarate analogue inhibitors of HIF prolyl hydroxylase. Bioorg. Med. Chem. Lett. 13, 2677–2680. [DOI] [PubMed] [Google Scholar]
- 17. Schofield CJ, Ratcliffe PJ (2005) Signalling hypoxia by HIF hydroxylases. Biochem. Biophys. Res. Commun. 338, 617–626. [DOI] [PubMed] [Google Scholar]
- 18. Karuppagounder SS, Ratan RR (2012) Hypoxia‐inducible factor prolyl hydroxylase inhibition: robust new target or another big bust for stroke therapeutics? J. Cereb. Blood Flow Metab. 32, 1347–1361. [DOI] [PMC free article] [PubMed] [Google Scholar]
- 19. Pugh CW, Ratcliffe PJ (2003) Regulation of angiogenesis by hypoxia: role of the HIF system. Nat. Med. 9, 677–684. [DOI] [PubMed] [Google Scholar]
- 20. Ceradini DJ, Kulkarni AR, Callaghan MJ, Tepper OM, Bastidas N, Kleinman ME et al (2004) Progenitor cell trafficking is regulated by hypoxic gradients through HIF‐1 induction of SDF‐1. Nat. Med. 10, 858–864. [DOI] [PubMed] [Google Scholar]
- 21. Van Hinsbergh VW, Koolwijk P (2008) Endothelial sprouting and angiogenesis: matrix metalloproteinases in the lead. Cardiovasc. Res. 78, 203–212. [DOI] [PubMed] [Google Scholar]
- 22. Stetler‐Stevenson WG (1999) Matrix metalloproteinases in angiogenesis: a moving target for therapeutic intervention. J. Clin. Invest. 103, 1237–1241. [DOI] [PMC free article] [PubMed] [Google Scholar]
- 23. Hu X, Yu SP, Fraser JL, Lu Z, Ogle ME, Wang J‐A et al (2008) Transplantation of hypoxia‐preconditioned mesenchymal stem cells improves infarcted heart function via enhanced survival of implanted cells and angiogenesis. J. Thorac. Cardiovasc. Surg. 135, 799–808. [DOI] [PubMed] [Google Scholar]
- 24. Doorn J, Fernandes HA, Le BQ, van de Peppel J, van Leeuwen JP, De Vries MR et al (2013) A small molecule approach to engineering vascularized tissue. Biomaterials 34, 3053–3063. [DOI] [PubMed] [Google Scholar]
- 25. Mirzamohammadi S, Aali E, Najafi R, Kamarul T, Mehrabani M, Aminzadeh A et al (2014) Effect of 17β‐estradiol on mediators involved in mesenchymal stromal cell trafficking in cell therapy of diabetes. Cytotherapy 17, 46–57. [DOI] [PubMed] [Google Scholar]
- 26. Brittenham GM, Griffith PM, Nienhuis AW, McLaren CE, Young NS, Tucker EE et al (1994) Efficacy of deferoxamine in preventing complications of iron overload in patients with thalassemia major. N. Engl. J. Med. 331, 567–573. [DOI] [PubMed] [Google Scholar]
- 27. Hou Z, Nie C, Si Z, Ma Y (2013) Deferoxamine enhances neovascularization and accelerates wound healing in diabetic rats via the accumulation of hypoxia‐inducible factor‐1α. Diabetes Res. Clin. Pract. 101, 62–71. [DOI] [PubMed] [Google Scholar]
- 28. Potier E, Ferreira E, Dennler S, Mauviel A, Oudina K, Logeart‐Avramoglou D et al (2008) Desferrioxamine‐driven upregulation of angiogenic factor expression by human bone marrow stromal cells. J. Tissue Eng. Regen. Med. 2, 272–278. [DOI] [PubMed] [Google Scholar]
- 29. Bradford MM (1976) A rapid and sensitive method for the quantitation of microgram quantities of protein utilizing the principle of protein‐dye binding. Anal. Biochem. 72, 248–254. [DOI] [PubMed] [Google Scholar]
- 30. Liang C‐C, Park AY, Guan J‐L (2007) In vitro scratch assay: a convenient and inexpensive method for analysis of cell migration in vitro. Nat. Protoc. 2, 329–333. [DOI] [PubMed] [Google Scholar]
- 31. Griffith CK, Miller C, Sainson RC, Calvert JW, Jeon NL, Hughes CC et al (2005) Diffusion limits of an in vitro thick prevascularized tissue. Tissue Eng. 11, 257–266. [DOI] [PubMed] [Google Scholar]
- 32. Kumar MS, Sripriya R, Raghavan HV, Sehgal PK (2006) Wound healing potential of Cassia fistula on infected albino rat model. J. Surg. Res. 131, 283–289. [DOI] [PubMed] [Google Scholar]
- 33. Abramov Y, Golden B, Sullivan M, Botros SM, Miller JJR, Alshahrour A et al (2007) Histologic characterization of vaginal vs. abdominal surgical wound healing in a rabbit model. Wound Repair Regen. 15, 80–86. [DOI] [PubMed] [Google Scholar]
- 34. Dzhoyashvili NA, Efimenko AY, Kochegura TN, Kalinina NI, Koptelova NV, Sukhareva OY et al (2014) Disturbed angiogenic activity of adipose‐derived stromal cells obtained from patients with coronary artery disease and diabetes mellitus type 2. J. Transl. Med. 12, 337. [DOI] [PMC free article] [PubMed] [Google Scholar]
- 35. Shin L, Peterson DA (2012) Impaired therapeutic capacity of autologous stem cells in a model of type 2 diabetes. Stem Cells Transl. Med. 1, 125–135. [DOI] [PMC free article] [PubMed] [Google Scholar]
- 36. Wei L, Fraser JL, Lu Z‐Y, Hu X, Yu SP (2012) Transplantation of hypoxia preconditioned bone marrow mesenchymal stem cells enhances angiogenesis and neurogenesis after cerebral ischemia in rats. Neurobiol. Dis. 46, 635–645. [DOI] [PMC free article] [PubMed] [Google Scholar]
- 37. Jin P, Zhang X, Wu Y, Li L, Yin Q, Zheng L et al (2010) Streptozotocin‐induced diabetic rat–derived bone marrow mesenchymal stem cells have impaired abilities in proliferation, paracrine, antiapoptosis, and myogenic differentiation. Transplant. Proc. 42, 2745–2752. [DOI] [PubMed] [Google Scholar]
- 38. Kim YS, Kwon JS, Hong MH, Kang WS, Jeong H‐Y, Kang H‐J et al (2013) Restoration of angiogenic capacity of diabetes‐insulted mesenchymal stem cells by oxytocin. BMC Cell Biol. 14, 38. [DOI] [PMC free article] [PubMed] [Google Scholar]
- 39. Zhong Q‐L, Liu F‐R, Liu D‐W, Peng Y, Zhang X‐R (2011) Expression of β‐catenin and cyclin D1 in epidermal stem cells of diabetic rats. Mol. Med. Rep. 4, 377–381. [DOI] [PubMed] [Google Scholar]
- 40. Nambu M, Ishihara M, Kishimoto S, Yanagibayashi S, Yamamoto N, Azuma R et al (2011) Stimulatory effect of autologous adipose tissue‐derived stromal cells in an atelocollagen matrix on wound healing in diabetic db/db mice. J. Tissue Eng. 2, 158105. [DOI] [PMC free article] [PubMed] [Google Scholar]
- 41. Sethe S, Scutt A, Stolzing A (2006) Aging of mesenchymal stem cells. Ageing Res. Rev. 5, 91–116. [DOI] [PubMed] [Google Scholar]
- 42. Khan M, Akhtar S, Mohsin S, N Khan S, Riazuddin S (2010) Growth factor preconditioning increases the function of diabetes‐impaired mesenchymal stem cells. Stem Cells Dev. 20, 67–75. [DOI] [PubMed] [Google Scholar]
- 43. Najafi R, Sharifi AM (2013) Deferoxamine preconditioning potentiates mesenchymal stem cell homing in vitro and in streptozotocin‐diabetic rats. Expert Opin. Biol. Ther. 13, 959–972. [DOI] [PubMed] [Google Scholar]
- 44. Black SM, DeVol JM, Wedgwood S (2008) Regulation of fibroblast growth factor‐2 expression in pulmonary arterial smooth muscle cells involves increased reactive oxygen species generation. Am. J. Physiol. 294, C345–C354. [DOI] [PMC free article] [PubMed] [Google Scholar]
- 45. Shi X, Guo L, Seedial S, Si Y, Wang B, Takayama T et al (2014) TGF‐β/Smad3 inhibit vascular smooth muscle cell apoptosis through an autocrine signaling mechanism involving VEGF‐A. Cell Death Dis. 5, e1317. [DOI] [PMC free article] [PubMed] [Google Scholar]
- 46. Wang C, Cai Y, Zhang Y, Xiong Z, Li G, Cui L (2014) Local injection of deferoxamine improves neovascularization in ischemic diabetic random flap by increasing HIF‐1α and VEGF expression. PLoS ONE 9, e100818. [DOI] [PMC free article] [PubMed] [Google Scholar]
- 47. Chekanov VS, Nikolaychik V (2002) Iron contributes to endothelial dysfunction in acute ischemic syndromes. Circulation 105, e35. [PubMed] [Google Scholar]
- 48. Arkell J, Jackson CJ (2003) Constitutive secretion of MMP9 by early‐passage cultured human endothelial cells. Cell Biochem. Funct. 21, 381–386. [DOI] [PubMed] [Google Scholar]
- 49. Rundhaug JE (2005) Matrix metalloproteinases and angiogenesis. J. Cell Mol. Med. 9, 267–285. [DOI] [PMC free article] [PubMed] [Google Scholar]
- 50. De Becker A, Van Hummelen P, Bakkus M, Broek IV, De Wever J, De Waele M et al (2007) Migration of culture‐expanded human mesenchymal stem cells through bone marrow endothelium is regulated by matrix metalloproteinase‐2 and tissue inhibitor of metalloproteinase‐3. Haematologica 92, 440–449. [DOI] [PubMed] [Google Scholar]
- 51. Munoz‐Najar U, Neurath K, Vumbaca F, Claffey K (2005) Hypoxia stimulates breast carcinoma cell invasion through MT1‐MMP and MMP‐2 activation. Oncogene 25, 2379–2392. [DOI] [PubMed] [Google Scholar]
- 52. Choi JY, Jang YS, Min SY, Song JY (2011) Overexpression of MMP‐9 and HIF‐1α in breast cancer cells under hypoxic conditions. J. Breast Cancer 14, 88–95. [DOI] [PMC free article] [PubMed] [Google Scholar]
- 53. Miyoshi A, Kitajima Y, Ide T, Ohtaka K, Nagasawa H, Uto Y et al (2006) Hypoxia accelerates cancer invasion of hepatoma cells by upregulating MMP expression in an HIF‐1α‐independent manner. Int. J. Oncol. 29, 1533–1539. [DOI] [PubMed] [Google Scholar]
- 54. Kang L, Chen Q, Wang L, Gao L, Meng K, Chen J et al (2009) Decreased mobilization of endothelial progenitor cells contributes to impaired neovascularization in diabetes. Clin. Exp. Pharmacol. Physiol. 36, e47–e56. [DOI] [PubMed] [Google Scholar]
- 55. Liu Y, Min D, Bolton T, Nubé V, Twigg SM, Yue DK et al (2009) Increased matrix metalloproteinase‐9 predicts poor wound healing in diabetic foot ulcers. Diabetes Care 32, 117–119. [DOI] [PMC free article] [PubMed] [Google Scholar]
- 56. Lobmann R, Ambrosch A, Schultz G, Waldmann K, Schiweck S, Lehnert H (2002) Expression of matrix‐metalloproteinases and their inhibitors in the wounds of diabetic and non‐diabetic patients. Diabetologia 45, 1011–1016. [DOI] [PubMed] [Google Scholar]
- 57. Kwon HM, Hur SM, Park KY, Kim CK, Kim YM, Kim HS et al (2014) Multiple paracrine factors secreted by mesenchymal stem cells contribute to angiogenesis. Vascul. Pharmacol. 63, 19–28. [DOI] [PubMed] [Google Scholar]
- 58. Kinnaird T, Stabile E, Burnett M, Shou M, Lee C, Barr S et al (2004) Local delivery of marrow‐derived stromal cells augments collateral perfusion through paracrine mechanisms. Circulation 109, 1543–1549. [DOI] [PubMed] [Google Scholar]
- 59. Bao P, Kodra A, Tomic‐Canic M, Golinko MS, Ehrlich HP, Brem H (2009) The role of vascular endothelial growth factor in wound healing. J. Surg. Res. 153, 347–358. [DOI] [PMC free article] [PubMed] [Google Scholar]
- 60. Cebe‐Suarez S, Zehnder‐Fjällman A, Ballmer‐Hofer K (2006) The role of VEGF receptors in angiogenesis; complex partnerships. Cell. Mol. Life Sci. 63, 601–615. [DOI] [PMC free article] [PubMed] [Google Scholar]
- 61. Murakami M, Simons M (2008) Fibroblast growth factor regulation of neovascularization. Curr. Opin. Hematol. 15, 215–220. [DOI] [PMC free article] [PubMed] [Google Scholar]
- 62. Locatelli F, Bersano A, Ballabio E, Lanfranconi S, Papadimitriou D, Strazzer S et al (2009) Stem cell therapy in stroke. Cell. Mol. Life Sci. 66, 757–777. [DOI] [PMC free article] [PubMed] [Google Scholar]
- 63. Kiefer F, Siekmann AF (2011) The role of chemokines and their receptors in angiogenesis. Cell. Mol. Life Sci. 68, 2811–2830. [DOI] [PMC free article] [PubMed] [Google Scholar]
- 64. Loh SA, Chang EI, Galvez MG, Thangarajah H, El‐ftesi S, Vial IN et al (2009) SDF‐1α expression during wound healing in the aged is HIF dependent. Plast. Reconstr. Surg. 123, 65S–75S. [DOI] [PubMed] [Google Scholar]
- 65. Lugo LM, Lei P, Andreadis ST (2010) Vascularization of the dermal support enhances wound re‐epithelialization by in situ delivery of epidermal keratinocytes. Tissue Engin. 17, 665–675. [DOI] [PMC free article] [PubMed] [Google Scholar]
- 66. Tonnesen MG, Feng X, Clark RAF (2000) Angiogenesis in wound healing. in Journal of Investigative Dermatology Symposium Proceedings. J. Investig. Dermatol. Symp. Proc. 5, 40–46. [DOI] [PubMed] [Google Scholar]
- 67. Oryan A, Mohammadalipour A, Moshiri A, Tabandeh MR (2014) Topical application of aloe vera accelerated wound healing, modeling, and remodeling. Ann. Plast. Surg. In Press. doi: 10.1097/SAP.0000000000000239. [DOI] [PubMed] [Google Scholar]
- 68. Brem H, Kodra A, Golinko MS, Entero H, Stojadinovic O, Wang VM et al (2009) Mechanism of sustained release of vascular endothelial growth factor in accelerating experimental diabetic healing. J. Invest. Dermatol. 129, 2275–2287. [DOI] [PubMed] [Google Scholar]
- 69. Hosogai N, Fukuhara A, Oshima K, Miyata Y, Tanaka S, Segawa K et al (2007) Adipose tissue hypoxia in obesity and its impact on adipocytokine dysregulation. Diabetes 56, 901–911. [DOI] [PubMed] [Google Scholar]
- 70. Rausch ME, Weisberg S, Vardhana P, Tortoriello DV (2008) Obesity in C57BL/6J mice is characterized by adipose tissue hypoxia and cytotoxic T‐cell infiltration. Int. J. Obes. 32, 451–463. [DOI] [PubMed] [Google Scholar]
- 71. Ye J, Gao Z, Yin J, He Q (2007) Hypoxia is a potential risk factor for chronic inflammation and adiponectin reduction in adipose tissue of ob/ob and dietary obese mice. Am. J. Physiol. Endocrinol. Metab. 293, 1118–1128. [DOI] [PubMed] [Google Scholar]
- 72. Botusan IR, Sunkari VG, Savu O, Catrina AI, Grünler J, Lindberg S et al (2008) Stabilization of HIF‐1alpha is critical to improve wound healing in diabetic mice. Proc. Natl Acad. Sci. 105, 19426–19431. [DOI] [PMC free article] [PubMed] [Google Scholar]