



Abstract
Abstract. Objective: Serum is usually added to growth media when mammalian cells are cultured in vitro to supply the cells with growth factors, hormones, nutrients and trace elements. Defined proteins and metal ions, such as insulin, growth factors, transferrin and sodium selenite, are sometimes also included and can in some cases substitute serum components. How adaptation to serum free media influences cells has not been studied in detail. Materials and Methods: We have adapted the Burkitt's lymphoma line Ramos to a serum‐free medium that supports long‐term survival and studied gene expression changes that occurred during the adaptation process. Results and Conclusions: The adaptation process was characterized by initial cell population growth arrest, and after that extensive cell death, followed by proliferation and long‐term survival of clonal cultures. Proliferation and cell cycle progression of the serum‐free cultures closely mimicked that of serum‐dependent cells. Affymetrix micro‐array technology was used to identify gene expression alterations that had occurred during the adaptation. Most changes were subtle, but frequently the genes with altered expression were involved in basal cellular functions such as cell division, cell cycle regulation, apoptosis and cell signalling. Some alterations were restored when the cells were transferred back to serum‐containing medium, indicating that expression of these genes was controlled by components in serum. Others were not, and may represent changes that were selected during the adaptation process. Among these were, for example, several genes within the Wnt signalling pathway.
INTRODUCTION
Short‐term primary cell cultures are in general cultured in medium complemented with 5–15% foetal calf serum (Eagle 1955; Barnes & Sato 1980) that is essential for proliferation of most cell types in vitro. Serum provides the cells with growth factors, hormones and other nutrients, and may also protect against toxic products formed during culture. When primary cell cultures are transferred into basal media lacking serum, proliferation stops and cells arrest at the G1 stage of the cell cycle due to lack of growth factors (Burk 1970; Kamely & Rudland 1976). Proliferation can subsequently be re‐initiated if serum is added. Serum is, however, a complex mixture with many uncharacterized components, and the composition may vary between different batches. Thus, in many experimental systems, it is an advantage to work with cells that are grown in the absence of serum, and defined growth media with no or low levels of serum have been developed for many primary cell types (Rizzino et al. 1979; Barnes & Sato 1980). These serum‐free media include components such as insulin, defined growth factors, transferrin and trace elements. The supplements required for serum‐free culture of primary cells are, however, generally cell type specific, and it is often not clear if the supplements are sufficient for long‐term survival or only short‐term proliferation.
Many transformed cell lines can be adapted to continuous growth in defined serum‐free media as well. Some may, in common with primary cells, require addition of defined growth factors to not arrest the cycle in G1 phase. Others continue to go through cell cycle in the absence of growth factors, even though the cells still depend on undefined serum components for long‐term survival (Chiang et al. 1984). Population growth in the absence of serum usually requires cell adaptation through successive reductions of serum concentration in the culture media, a process that is often associated with extensive cell death and clonal selection. It is thus feasible that clones with specific changes in gene expression are selected during the adaptation, such as increased expression of autocrine growth factors or their receptors, or decreased expression of intracellular apoptotic signals. Autocrine growth factors are indeed secreted into supernatants of cells growing in serum‐free medium, and several have been purified and thereafter identified from serum‐free supernatants based on their ability to promote and stimulate cell survival (Kaplan et al. 1982; Uittenbogaart et al. 1986). It is, however, unclear if expression of the growth factors was selected during the adaptation process or not. Very few studies have addressed gene expression changes that occur during adaptation to serum‐free media and how these changes might influence experiments performed on serum‐free cultures.
Lymphocytes are subject to several stages of proliferation and selection during development. With regard to B lymphocytes, the purpose of the processes is production of high‐affinity antibodies against non‐self structures. The major part of antibody diversity is created in the bone marrow through variable (diversity) joining [V(D)J] recombination, which creates a pool of cells able to bind to different antigens. The antibody–antigen interaction is, however, fine‐tuned during an immune response to yield higher binding affinities, a phenomenon known as affinity maturation. This process takes place in specialized structures, germinal centres. In these, activated B lymphocytes proliferate vigorously and diversify their genes that code for their antibodies through antibody gene‐specific random mutagenesis (somatic hypermutation). Cells with increased affinity to an antigen are then selected, and high‐affinity cells leave to form memory B lymphocytes and antibody‐secreting plasma cells. Cell selection in germinal centres is thought to operate through survival signals given to high‐affinity cells, with low‐affinity cells following a default apoptotic pathway. Although antibody–antigen interactions appear to be the most important signals, the nature of other survival signals in the germinal centre is not clear, and germinal centre B lymphocytes enter apoptosis rapidly in vitro unless they are given proper stimulation (Pound & Gordon 1997).
Despite this, some types of B‐cell lymphomas originating from germinal centres can easily be cultured in vitro (Drexler et al. 2000). Among these are Burkitt's lymphoma cells, a form of cancer having a translocation between the c‐myc gene and an antibody‐encoding gene, as a genetic hallmark. This translocation deregulates c‐myc expression, but is not in itself sufficient to render the cells malignant (Smeland et al. 1985). Other events, such as p53 inactivating mutations (Wiman et al. 1991) or p16 silencing (Klangby et al. 1998) are needed for the malignant phenotype to develop. In addition, Epstein–Barr virus (EBV) infection plays a major role in endemic cases of B‐cell lymphomas that occur in Africa. Although the molecular mechanism is not fully clear, EBNA genes resembling nuclear transcription factors, LMP genes mimicking extracellular receptors and small non‐protein encoding RNA may all be involved at different stages of the lymphomagenesis (Komano et al. 1998). If there are other genetic alterations that play analogous roles in EBV‐negative sporadic cases they are not known. In addition, the role that different alterations play in allowing Burkitt's lymphomas to be cultured in vitro, in the presence and absence of external growth factors, is unclear.
Here, we have studied the EBV‐negative sporadic Burkitt's lymphoma cell line, Ramos. We have established two independent long‐term serum‐free cultures. This has allowed us to identify genes that are deregulated in serum‐free cultures using Affymetrix micro‐array technology, and also to determine that expression changes that are stable (and, presumably, selected for during adaptation) and that are not (and, presumably, regulated by factors in the serum). This is, as far as we are aware, the first study that addresses global gene expression changes that occur during adaptation of cell lines to serum‐free media. The serum‐free cell lines are thus well‐characterized tools for studying signals in germinal centres of B lymphocytes without interference from serum components. In addition, gene expression changes that we have identified may be important during germinal centre oncogenesis, as they allow survival of germinal centre cells when growth stimulation is limited, a state that may occur during metastasis.
MATERIALS AND METHODS
Cell culture and the establishment of serum‐free cultures
The Ramos Burkitt's lymphoma cell line [a gift from Dr. M.S. Neuberger (Sale & Neuberger 1998)] was cultured in RPMI (Invitrogen, Carlsbad, CA, USA; no. 16870‐010), 10% foetal calf serum, 50 µg/mL gentamicin and 50 µm 2‐mercaptoethanol (serum conditions) (Wasik et al. 1987), or in a mixture of equal volumes of RPMI and AIM‐V containing streptomycin (50 µg/mL), gentamicin (10 µg/mL) and 0.25% human serum albumin (Invitrogen; no. 12055‐091) complemented with 50 µm 2‐mercaptoethanol (serum‐free conditions) in incubators at 37 °C with 6% CO2. To establish serum‐free cultures, cells were adapted through successive dilution of the original cultures while growing in six‐well plates, started from 1 × 10⁶ cells. Initially, half the growth media was changed with serum‐free media every second to third day. Intervals between addition of new growth media were then prolonged as the cultures gradually became growth arrested; after arrest, extensive cell death was evident. In two out of 30 cultures, cell population growth adaptation to serum‐free media (SFI and SFII) was observed. All cultures were free from form Mycoplasma species contamination based on polymerase chain reaction (PCR) assays at the Laboratory of Bacteriology, Sahlgrenska University Hospital, Göteborg, Sweden. To avoid freezing/thawing effects, only samples that had been in continuous culture for 1 month or more were used for experiments.
RNA isolation
RNA was isolated from exponentially growing serum‐dependent Ramos cells (SD), using TriZol reagent (Gibco, Grand Island, NY, USA) according to the manufacturer's instructions, serum‐free adapted cultures and SFII cells cultured in serum containing media for 2 days. For micro‐array analysis, RNA was further purified using Rneasy mini kit (Qiagen, Stanford, CA, USA), and its integrity and purity were verified by spectrophotometry and gel electrophoresis.
Micro‐array analysis
Probe labelling and micro‐array hybridization to Affymetrix HG‐U133A gene chips were performed at Swegene MARC (Lund, Sweden) using RNA samples prepared as described above. The quality and quantity of RNA was verified using an Agilent Bioanalyser before biotinylated cRNA (Agilent Technologies UK, Cheshire, UK) was prepared and hybridized to the gene chip arrays according to standard procedures. Gene chip expression levels were subsequently analysed and normalized.
Numerical data for gene expression were analysed in two groups (four serum versus two samples each from the different serum‐free cultures) according to P value, using two‐sided t‐tests and 99.5%, 99.0% or 95.0% confidence intervals, after removing genes with absent calls in more than five of the eight samples; then, expression mean quotients were compared. Genes with a mean quotient higher than 1.5 or 2.0 were grouped according to confidence and relative up‐ or down‐regulation. We also used a ‘quotient method’ where criteria for selection were that all the four values in a group (serum or serum‐free) were to be higher than all four values in the other group, and expression mean quotient had to be above 1.5 or 2.0. Genes were further subdivided based on whether changes were stable in the SFII culture or if they reverted after addition of serum to the serum‐free cultures. As a randomized control, analysis using two SD, one SFI and one SFII sample in each group, was performed using the methods described above.
Analysis of cell proliferation, structure and cell cycle profiles
Cells from SD, SFI and SFII cultures were washed with phosphate‐buffered saline and 2500 cells/well were subsequently plated in serum or serum‐free media in 96‐well plates. New media were added after 4 days, and cells were counted for a total of 10 days using a Bürker chamber. Photographs were taken of cells dissolved in phosphate‐buffered saline on normal glass microscope slides.
The cell cycle profile of exponentially growing cultures was performed using a FITC BrdU flow kit (Becton Dickinson, San Diego, CA, USA) according to the manufacturer's instructions, and cells were analysed using FACScan (Becton Dickinson) apparatus. Immunoglobulin M (IgM) and HLA‐DR cell expression was measured by FACScan analysis of labelled cells using FITC antihuman IgM or HLA‐DR (both from Becton Dickinson).
Northern blot analysis
Five micrograms of total RNA or 0.25 µg mRNA isolated using polyA Spin mRNA isolation kit (New England Biolabs, Beverly, MA, USA) from SD, SFI, SFII cells was transferred to serum media for 2 h, 8 h, 24 h and 2 days, SFI and SFII transferred to serum media for 2 days were separated on 1.25% agarose gel (Cambrex, Rockland, ME, USA) and were transferred to positively charged nylon membranes (Amersham, Buckinghamshire, UK) through capillary blotting. Membranes were cross‐linked by ultraviolet irradiation, and the filters were pre‐incubated in hybridization solution, containing 7% (w/v) sodium dodecyl sulfate (SDS), 0.5 m sodium phosphate (pH 7.2) and 1 mm EDTA, for 2 h in a hybridization oven at 68 °C before addition of the probes (AID, CD27L, CRI1, ECH1, EP300, FADS1, HSP27, LOC51315, SH2D1 A or SMAD1; see below). Probes were labelled with α‐32P dCTP (Amersham) using a random primer labelling NEBlot kit (New England Biolabs), and were purified from unincorporated nucleotides using ProbeQuant micro columns (Amersham). Blots were hybridized overnight at 68 °C before being washed with 1× SSC (Saline‐sodium citrate buffer, SIGMA) and 0.1% SDS for 10 min at room temperature and then were washed three times in 0.5× SSC and 0.1% SDS for 10 min at 68 °C. Filters were then exposed on Phosphorimager screens and detected using Pharos molecular imaging (Bio‐Rad Laboratories Inc., Hercules, CA, USA). All membranes were stripped before re‐hybridization with a glycerol‐3‐phosphate dehydrogenase (G3PDH) probe. Amounts of 32P labelled probe were quantified using 1‐D Image analysis software (Kodak, New Haven, CT, USA). All results were normalized using expression of the G3PDH gene.
Probe preparation
The forward and reverse primers used for Northern blot probe preparation were:
AID: 5′‐ATGGACAGCCTCTTGATGAA‐3′ and 5′‐ATTTCGTACTTTGGGACTTTGA‐3′; CD27L: 5′‐CCTGTGCAGCTCCGATTTTA‐3′ and 5′‐AGGCTCCGGTTTTCGGTAAT‐3′; CRI1: 5′‐ACAGAGTATCAGCCGCTCTT‐3′ and 5′‐CTCATCACAGCCGAGTTCTT‐3′; ECH1: 5′‐TCATGCTGGATGCTGCCTTA‐3′ and 5′‐GTCTGCAGCATGCTCATGTT‐3′; EP300: 5′‐CGCTTTGTCTACACCTGCAA‐3′ and 5′‐GGCAGTGAGCAATTGGCATT‐3′; FADS1: 5′‐GTCCACAAGTCTGCCTTCAA‐3′ and 5′‐GGCTTGGACTGGTACTCTAT‐3′; G3PDH: 5′‐ACCACAGTCCATGCCATCAC‐3′ and 5′‐TCCACCACCCTGTTGCTGTA‐3′; HSP27: 5′‐TGACGGTCAAGACCAAGGAT‐3′ and 5′‐CGGCAGTCTCATCGGATTTT‐3′; LOC51315: 5′‐GAGGAGCGGTCTAAGCATAA‐3′ and 5′‐GCATTTCCTCCTCTGTCCTT‐3′; SH2D1: A 5′‐CAGCACCTGGGGTACATAAA‐3′ and 5′‐CAGGCAGACATCAGGAT CTT‐3′; and SMAD1: 5′‐CCTAGTGGGTGTAGTCTGAA‐3′ and 5′‐GCCGTCAGATGTAT CTCAA‐3′, respectively. For the probes, PCR was performed using cDNA from SD cells, with the exception of HSP27 and SH2D1 A, where cDNA from SFI was used, with PCR conditions as follows: 30–40 cycles denaturation 30 s at 95 °C, annealing 60 s at 65 °C to 55 °C, reduced by 1 °C per cycle for 10 cycles and further cycles at 55 °C, extension 60 s at 72 °C. PCR products (597 bp for AID, 219 bp for CD27L, 181 bp for CRI1, 156 bp for ECH1, 274 bp for EP300, 155 bp for FADS1, 285 bp for HSP27, 452 bp for G3PDH, 235 bp for LOC51315, 172 bp for SH2D1 A, 200 bp for SMAD1) were then purified using a QIAquick gel extraction kit (Qiagen Inc.). To confirm the identity of the probes and to remove any co‐migrating DNA species, PCR products were then cleaved with restriction enzymes into 90–170 bp fragments and were then re‐purified using gel extraction a second time.
Real‐time PCR
RNA samples used for micro‐array analysis were further analysed using real‐time PCR. Primer and probes for genes involved in Wnt pathway were designed using the Universal ProbeLibrary Assay Design Centre (Roche Applied Biosciences, Indianapolis, IN, USA). Assays were subsequently performed and were analysed in triplicate with the aid of Roche LightCycler 480 (Roche, Mannheim, Germany) according to manufacturer's instructions for relative quantification against hypoxanthine phosphoribosyltransferase.
Analysis of somatic hyper‐mutation in SFI and SFII cultures
Serum‐dependent, SFI and SFII cells were labelled with FITC‐labelled goat antihuman IgM antibodies (DAKO, Glostrup, Denmark) and were sorted into a 96‐well plate using a FACSAria (Becton Dickinson). IgM‐expressing clones were then cultured under normal conditions for 7 weeks, before the cells were again labelled with IgM‐FITC and sorted. DNA from cells that had lost IgM expression during culture was isolated using DNA blood mini kit (Qiagen) and expressed Ramos VH fragment was PCR amplified and analysed for mutations as previously described (Sale & Neuberger 1998).
RESULTS
The Ramos Burkitt's lymphoma cell line can be adapted to long‐term culture in serum‐free medium
B lymphoma cell lines are normally cultured in medium complemented with serum (Wasik et al. 1987). To study the effect that serum had on the cells, the Burkitt's lymphoma line, Ramos, was adapted to growth in the absence of serum, through successive dilution. Dilution was associated with cell population growth arrest within the first 2 weeks, followed by extensive cell death. In the majority of cases, no surviving cells were found in culture wells after 1 month. However, in 2 out of 30 wells cells survived and proliferation eventually appeared. Surviving cultures continued to proliferate, and have now been propagated for over 2 years as independent cultures (SFI and SFII). The small proportion of wells that generated proliferating cultures indicated that these cultures were clonal. This indeed seemed to be the case, as specific gene expression changes were observed between the cultures (see below).
Ramos cells cultured in serum‐free medium resemble serum‐grown cells
Proliferation rates of serum‐free cultures were comparable to serum growing ones, with a generation time of approximately 24 h (Fig. 1a). Similar proliferation rates were observed when SFI and SFII cultures were transferred back to serum‐containing media, and also initially when serum‐dependent Ramos cells were set up in serum‐free media. In the latter case, however, proliferation stopped approximately 6 days after serum removal, in agreement with observations made during adaptation. To further characterize proliferation of the cultures, cell cycle analyses were performed (Fig. 1b). Serum and serum‐free cultures appeared similar in this assay, but with a slight tendency for more cells at S phase in the serum‐growing cells. Notably, the proportion of sub‐G1 apoptotic cells did not differ between serum‐dependent and serum‐free cultures (1.46%, 2.79% and 1.85%, respectively). In addition, we did not observe any differences in morphology between cultures by light microscopy (Fig. 1c), and expression of several tested CD markers on cell surfaces was similar (data not shown). Cultures expressed similar levels of IgM on the cell surface (Fig. 1d). Notably, a small fraction of cells in SFI and SFII cultures did not, in similar with serum cultures, express IgM. Presence of this cell population in Ramos cultures is a sign of ongoing somatic hypermutation, as the process generates random stop codons in the expressed heavy chain antibody gene (Sale & Neuberger 1998). As SFI and SFII cultures both appeared to be clonal, somatic hypermutation thus seemed to be ongoing in the serum‐free cultures. To confirm this, we re‐cloned single IgM expressing cells and cultured them in serum‐free medium for 7 weeks. At this point, IgM expression was lost during culture in most cultures (Fig. 1e). Reversion frequencies of both clones were lower than for serum growing cells that was probably due to lowered expression of AID (see Discussion), but sequencing of antibody V heavy chain genes of these cells revealed mutations with a pattern typical for somatic hypermutation (Fig. 1f). Thus, all assays indicate that the Ramos cells maintained their phenotype during adaptation to serum‐free media, and that they still closely resembled germinal centre B lymphocytes.
Figure 1.
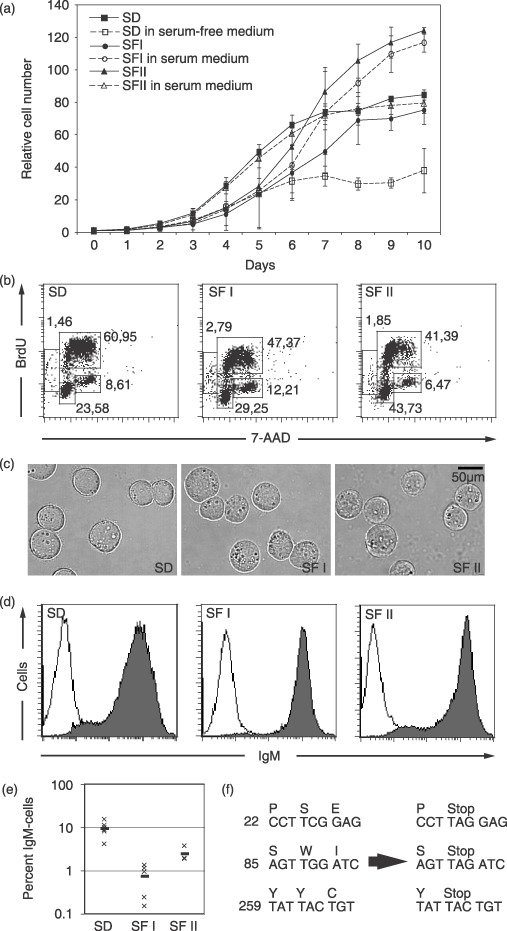
Phenotype of serum‐dependent Ramos cells and the serum‐free cultures SFI and SFII. (a) Cells were cultured in the indicated media and were counted for 10 days to determine proliferation rates. Serum‐dependent cells in normal serum‐containing medium (filled squares) and serum‐free medium (open squares), SFI and SFII cells cultured in serum‐free medium (filled circles and filled triangles, respectively) or serum‐containing medium (open circles and open triangles). Average of three experiments is presented together with the highest and lowest values shown as error bars. (b) Cell cycle progression of serum‐dependent Ramos cells and serum‐free SFI and SFII cultures, using BrdU and 7‐AAD labelling are shown. Relative sizes for the major populations (G1, S and G2) are shown from a representative experiment. (c) Photographs of serum‐dependent Ramos cells and the serum‐free cultures (d) IgM surface expression of serum‐dependent Ramos cells and the SFI and SFII serum‐free cultures. (e) Percentage of cells that not expressing IgM 7 weeks after subcloning are shown. For SD six distinct clones are shown, for SFI five distinct clones are shown and for SFII three clones are shown. Thick line indicates average number of non‐expressors. (f) Stop codons identified in IgM‐negative cells generated during culture of subclones. IgM non‐expressing cells were sorted from the subclone cultures, DNA prepared and the antibody heavy chain gene sequenced. Three examples of stop codon identified are shown.
Identification of genes differently expressed in Ramos cells cultured in serum‐free medium
When serum‐dependent cells were transferred to serum‐free medium, cells were adapted to survival without external growth factors, hormones or trace elements from the serum. To study how adaptation associated with changes in gene expression, RNA was isolated from serum‐dependent cells, serum‐free cell cultures (SFI and SFII) and from serum‐free cells that had been re‐transferred to serum containing medium for 2 days. Gene expression profiles were subsequently analysed through hybridization to Affymetrix gene chips. Cells growing in serum media were compared to those growing in serum‐free media. Figure 2a shows a scatter plot depicting mean expression in the serum cultures as compared to serum‐free ones. Most genes were close to the diagonal, and did not differ depending on culture conditions. Of array genes, 48% were classified as absent, that is, their expression levels were below the threshold for detection in both serum‐dependent and the serum‐free cultures (shown in grey in Fig. 2). Notably, there were significantly more genes that did diverge from the diagonal in the experimental comparison (Fig. 2a) than in control analysis performed with randomized groups (see Material and Methods; Fig. 2b), indicating that genes that did differ in expression in serum‐free clones were not due to random experimental variation.
Figure 2.

Scatter plots of micro‐array results. (a) Mean intensity value of serum‐dependent cells plotted against mean intensity value of serum‐free cells. Genes classified as absent are marked in grey and genes further analysed in black. Some significantly deregulated genes are marked. (b) Scatter plot of mean intensity values of randomized groups (see Material and Methods).
To identify significant differences between serum and serum‐free cells, P values were calculated for all expressed genes using a two‐sided t‐test, as were the quotients of mean expression for each gene. Depending on criteria used, between 35 (P < 0.005; quotient > 2) and 434 (P < 0.05, quotient > 1.5) differentially expressed genes were identified between serum‐dependent and serum‐free cells (Table 1). This exceeded the number of genes that were identified from randomized groups using identical criteria. Genes that had P values < 0.01 and mean quotient between groups higher than 2 are presented in 2, 3 (data from the less stringent analysis can be found as supplementary data). Independent of criteria, there were in the region of twice as many genes that were up‐regulated in serum‐free cells as repressed genes. Many of the differentially expressed genes were involved in central cellular processes such as cell division and cell cycle progression, apoptosis, differentiation, signal transduction, immunity and metabolism (2, 3 and supplementary data).
Table 1.
Summary of the number genes significantly altered between serum and serum‐free cultures
| Up‐regulated in SF cells | Down‐regulated in SF cells | Scramble analysis | ||||
|---|---|---|---|---|---|---|
| SF/SD > 2.0 | SF/SD > 1.5 | SD/SF > 2.0 | SD/SF > 1.5 | > 2.0 | > 1.5 | |
| P value < 0.005 | 23 (5) | 68 (17) | 12 (2) | 38 (8) | 1 | 4 |
| P value < 0.01 | 33 (9) | 101 (24) | 24 (7) | 56 (21) | 2 | 6 |
| P value < 0.05 | 91 (15) | 300 (58) | 54 (13) | 134 (37) | 8 | 45 |
| Quotient analysis* | 115 (19) | 321 (39) | 60 (14) | 144 (38) | 7 | 40 |
Values in parenthesis show a number of genes that expressions are restored after re‐culture in serum medium.
Quotient analysis is according to the criteria that all SF values are above all SD values or vice verse.
Table 2.
Genes up‐regulated in serum‐free cultures, P value < 0.01, fold change > 2.00
| Gene name | P value | Fold change | Expression restored after serum addition | Reference |
|---|---|---|---|---|
| Cell division, cell cycle | ||||
| CDKN1A | 0.00720 | 2.57 | YES | Dotto (2000) |
| CPR8 | 0.00617 | 3.27 | Edwards et al. (1997) | |
| FZD6 | 0.00881 | 2.46 | Golan et al. (2004) | |
| HABP4 | 0.00410 | 4.12 | YES | Bost et al. (1998) |
| ICAT | 0.00188 | 2.56 | Tago et al. (2000) | |
| RGC32 | 0.00198 | 2.02 | YES | Badea et al. (2002) |
| RPS6KA2 | 0.00311 | 1.98 | Frodin & Gammeltoft (1999) | |
| – || – | 0.00758 | 5.40 | ||
| TRIM44 | 0.00167 | 2.35 | Reymond et al. (2001) | |
| Transcription, differentiation | ||||
| HIST1H2BK | 0.00356 | 2.21 | YES | Moore et al. (2002) |
| PBXIP1 | 0.00034 | 2.29 | Abramovich et al. (2000) | |
| S100A4 | 0.00436 | 3.81 | Marenholz et al. (2004) | |
| SMAD1 | 0.00560 | 2.42 | YES | Itoh et al. (2000) |
| Central metabolism | ||||
| FADS1 | 0.00107 | 1.76 | Marquardt et al. (2000) | |
| 0.00061 | 2.32 | |||
| GALNT1 | 0.00272 | 1.85 | Ten Hagen et al. (2003) | |
| – || – | 0.00533 | 2.03 | ||
| PEX7 | 0.00803 | 2.11 | Hettema et al. (1999) | |
| PLA2G5 | 0.00958 | 2.12 | Kramer & Sharp (1997) | |
| SERPINI1 | 0.00007 | 3.71 | van Gent et al. (2003) | |
| STXBP1 | 0.00193 | 2.03 | Salaun et al. (2004) | |
| Signal transduction, cell adhesion | ||||
| KCNN4 | 0.00583 | 3.13 | YES | Stocker (2004) |
| PDE6D | 0.00050 | 2.46 | Hanzal‐Bayer et al. (2002) | |
| – || – | 0.00005 | 2.95 | ||
| RICH1 | 0.00387 | 2.04 | YES | Richnau & Aspenstrom (2001) |
| SPG7 | 0.00484 | 2.03 | Lindholm et al. (2004) | |
| Immunity, inflammation | ||||
| CNR1 | 0.00255 | 2.12 | Kaminski et al. (1994) | |
| PLXNC1 | 0.00078 | 3.22 | Comeau et al. (1998) | |
| Function unknown | ||||
| BRACE3011271 | 0.00088 | 4.15 | ||
| COL07487 | 0.00741 | 2.00 | YES | |
| FLJ32731 | 0.00113 | 3.76 | ||
| KIAA0182 | 0.00011 | 2.02 | YES | |
| KIAA0233 | 0.00066 | 2.58 | ||
| KIAA1049 | 0.00205 | 2.14 | ||
| LOC51315 | 0.00185 | 3.49 | ||
| MGC3265 | 0.00442 | 2.08 | ||
| TXNDC5 | 0.00062 | 2.08 | ||
Table 3.
Genes down‐regulated in serum‐free cultures, P value < 0.01, fold change > 2.00
| Gene name | P value | Fold change | Expression restored after serum addition | Reference |
|---|---|---|---|---|
| Apoptosis | ||||
| BIRC3 | 0.00457 | 2.27 | Yang et al. 2004 | |
| RRAS2 | 0.00059 | 6.25 | Bos, 1997 | |
| – || – | 0.00080 | 5.88 | ||
| – || – | 0.00055 | 5.26 | ||
| SGK | 0.00341 | 2.94 | Brunet et al. (2001) | |
| TP73L | 0.00198 | 3.45 | Harms et al. (2004) | |
| – || – | 0.00765 | 2.94 | ||
| Cell division, cell cycle | ||||
| CALCRL | 0.00758 | 2.13 | YES | Cuttitta et al. (2002) |
| DAL1 | 0.00999 | 2.04 | Sun et al. (2002) | |
| JUP | 0.00716 | 6.25 | Maeda et al. (2004) | |
| MSF | 0.00658 | 2.04 | YES | Montagna et al. (2003) |
| – || – | 0.00018 | 1.59 | ||
| SKIL | 0.00127 | 2.86 | Pearson‐White & Crittenden (1997) | |
| Transcription, differentiation | ||||
| BASP1 | 0.00099 | 5.00 | Carpender et al. (2004) | |
| METAP2 | 0.00742 | 2.17 | Ray et al. (1992) | |
| – || – | 0.00056 | 1.79 | ||
| RNGTT | 0.00505 | 3.03 | Moteki & Price, (2002) | |
| TAF7 | 0.00788 | 2.22 | YES | Munz et al. (2003) |
| Signal transduction, cell adhesion | ||||
| PEZ | 0.00140 | 2.50 | Wadham et al. (2004) | |
| Immunity, inflammation | ||||
| APOBEC3B | 0.00616 | 2.78 | YES | Yu et al. (2004) |
| CD1D | 0.00708 | 33,33 | Spada et al. (1998) | |
| CXCL11 | 0.00210 | 2.94 | YES | Cole et al. (1998) |
| IL10RA | 0.00165 | 2.08 | Rousset et al. (1992) | |
| IL8RB | 0.00615 | 3.45 | Jinquan et al. (1997) | |
| LCK | 0.00051 | 2.27 | Campbell & Sefton (1992) | |
| – || – | 0.00170 | 2.00 | ||
| Function unknown | ||||
| CGI‐83 | 0.00273 | 3.23 | YES | |
| Clone MGC:71411 | 0.00804 | 2.38 | ||
| – || – | 0.00050 | 1.89 | ||
| KIAA0937 | 0.00955 | 4.55 | YES | |
| TYRP1 | 0.00048 | 2.56 | Sturm et al. (2001) | |
Alteration in gene expression validated by Northern blot analysis
Differential gene expression profiles identified by micro‐array analysis were validated by Northern blots of randomly chosen genes. Up‐regulated genes tested included FADS1, LOC51315 and SMAD1 (Fig. 3a), and down‐regulated such as AID and CD27L (Fig. 3b). For all analysed genes but one (SMAD1 in SFII cells), changes were confirmed by blotting. In general, changes were more pronounced in the Northern blots than in micro‐array screens. This phenomenon was not further analysed, thus we are unable distinguish which of the measurements reflects true expression levels most accurately.
Figure 3.

Micro‐array results were validated using Northern blot and FACS analysis. (a) Northern blot analyses of representative genes up‐regulated in serum‐free cells. Data from the Northern blot analysis are black bars and from micro‐array analysis are grey bars. Data are presented as change in expression compared to serum‐dependent cells. (b) Northern blot analyses of representative genes down‐regulated in serum‐free cells. (c) FACS analysis of HLA‐DR expression of SD cells, SFI, SFII and SFI cells re‐cultured in serum medium for 2 days. (d) Changes that occurred only in one of the cultures are validated using Northern blotting.
Some of the alterations in gene expression are dependent on the serum, while others are not
Two rationales for a gene to be deregulated in serum‐free cells can be envisioned – either the alteration was selected during adaptation, or expression of the gene is controlled, directly or indirectly by factors in the serum, but are not involved in adaptation per se. To distinguish between these possibilities, we determined expression of deregulated genes in the SFII cultures after re‐transferred to serum for 2 days. In this set‐up expression changes that were directly dependent on serum factors should return to normal levels, while changes selected during adaptation would not. In all, the number of genes restored after serum addition was smaller than the number of genes that were not; 16 of the 57 gene expression levels were restored to normal among those that were selected with P values < 0.01 and quotients > 2.0 (2, 3). Among genes that did not revert and may be involved in adaptation of the cells to serum‐free conditions, were several genes for proteins of the Wnt pathway (Fig. 4a; see Discussion).
Figure 4.

Changes in gene expression that occurred when serum‐free cells were re‐transferred to serum containing medium, validated using real‐time PCR or Northern blots. (a) Real‐time PCR assays of genes of the Wnt pathway. (b,c) Expression of LOC51315 and SMAD1 in SFI cells when re‐transferred to serum containing medium for 2 h, 8 h and 2 days using northern blot. (d,e) Northern blot analysis of genes differentially expressed between SFI and SFII cultures. RNA from SD, SFI, SFII cells re‐cultured in serum medium for 2 h, 8 h and 2 days, SFI and SFII cells re‐cultured in medium containing serum for 2 days were used. Data are presented as changes in expression compared to serum‐dependent cells.
To study kinetics of the serum response, we analysed how expression changed 2 h, 8 h, and 2 days after serum was re‐added to SFI serum‐free culture, using Northern blot analysis (Fig. 4b,c). SFI was used to confirm that the response to serum was similar in SFI and SFII. Expression of LOC51315 was up‐regulated at all times, although decrease in expression was evident after 8 h. This indicated that the expression change of LOC51315 had been selected during adaptation. Expression of SMAD1, on the other hand, was fully restored to normal levels after 2 h, following re‐addition of serum, indicating that it was controlled by serum components. Both these results agreed with the micro‐array data (2, 3).
The serum‐free cultures SFI and SFII can be distinguished as two separate cultures
During the analysis, we noted that expression of some genes was changed in one of the serum‐free cultures but not the other (Table 4). Among these were transcripts from the MHC class II gene family that were undetectable in SFI cultures, but normal in SFII cultures. SFI cells indeed lacked cell surface expression of HLA‐DR (Fig. 3c), and the cells thus have a bare lymphocyte syndrome phenotype (Ting & Trowsdale 2002). The locus that contains MHC genes was, however, still present in the SFI cells (data not shown), and Affymetrix chips did not reveal any changes in expression of known bare‐lymphocyte syndrome genes. There is thus no obvious explanation for our data, but the cells may carry a de novo point mutation, in a known or novel bare‐lymphocyte syndrome gene, that results in lack of MHC expression.
Table 4.
Examples of genes where only one of the serum‐free cultures are altered as compared to the serum‐dependent cultures or where they are altered in different directions
| Gene name | SD | SFI | SFII |
|---|---|---|---|
| AGR2 | 46.7 | 1.0 | 76.0 |
| BCHE | 207.3 | 6.4 | 111.9 |
| CRI1 | 39.4 | 1.0 | 50.9 |
| ECH1 | 238.5 | 53.4 | 232.9 |
| EP300 | 41.3 | 73.4 | 25.9 |
| GPR65 | 64.8 | 6.0 | 48.9 |
| HLA‐DPA1 | 2063.3 | 7.3 | 2335.1 |
| HLA‐DQA1 | 824.3 | 8.4 | 819.9 |
| HLA‐DRA | 1973.6 | 8.2 | 1622.8 |
| HSP27 | 22.1 | 75.2 | 2.6 |
| SH2D1A | 18.3 | 176.4 | 1.4 |
| TRD | 39.6 | 310.1 | 5.8 |
There were also other gene expression differences between the two serum‐free cultures, and these could be confirmed using Northern blot analysis (Fig. 3d). Notably, all genes that were only deregulated in one of the cultures did not change upon re‐addition of serum (Fig. 4d,e), confirming that they were stable gene expression changes. From this, it can be concluded that serum‐free cultures are clonal, and that they most likely represent two distinct lineages of serum‐free growing cells that spontaneously arouse from the bulk serum‐dependent culture. Thus, stable gene expression changes detected in the serum‐free cultures compared to the originals, are candidates for change necessary for selection during survival of cells in serum‐free media, as they probably occurred independently from each other in the two cultures.
DISCUSSION
In vitro culturing of mammalian cells is generally performed in medium containing foetal calf serum as a source of growth factors and nutrients. In many cases, it is, however, advantageous to use growth media that are without undefined components. Few studies have addressed differences between cells grown in serum‐free and serum‐containing media. Some reports have investigated effects of serum addition to non‐cycling serum‐starved primary cells, but these studies have rather been focused on cell cycle control than on serum‐free conditions per se (Burk 1970; Kamely & Rudland 1976). Other studies have examined the production of autocrine growth factors from cell lines growing in serum‐free medium, but are more concerned with the growth factors than how serum influences cells during culture (Kaplan et al. 1982; Uittenbogaart et al. 1986). In this study, we have focused on a distinct question: what changes occur in gene expression when cells of a line are adapted to serum‐free media.
To address this question, the germinal centre‐derived B‐cell lymphoma cells, Ramos, were adapted to serum‐free conditions and RNA expression profiles, before and after adaptation, were compared using Affymetrix gene array technology. To reduce the risk that results were strongly skewed by co‐selection of irrelevant clonal variations, we used two independent serum‐free clones. The adaptation process was characterized by initial cell population growth arrest followed by extensive cell death before serum‐independent cultures eventually evolved. Founder cells were thus selected from the original pools of cells, presumably because they had alterations in their gene expression profiles that enabled long‐time survival in serum‐free medium. Expression analysis of the cultures did not, however, reveal any ‘master‐genes’ responsible for serum‐free cultures to survive. Rather, there were a relatively large number of genes that all were deregulated in less dramatic ways, often less than 2‐fold. Still, it is possible that distinct, but related, master genes were deregulated in the different serum‐free cultures, and that these controlled expression of similar sets of genes. Alternatively, the changes observed in both cultures may cooperate to compensate for the lack of growth‐promoting factors.
Most of the deregulated genes were involved in central cellular processes such as apoptosis, cell cycle regulation and signalling. The changes did, however, not follow a predictable pattern, and for example, many genes involved in protection from apoptosis were down‐regulated rather than up‐regulated in the serum‐free cultures. One possible explanation for this rather unexpected finding is that high expression of certain genes, the up‐regulated ones, was selected during adaptation, but that others were down‐regulated when cells were serum‐starved. Although this may explain some disparate changes of expression, it does not seem to be a general explanation, as expression of most genes, such as most genes that protect a cell from apoptosis, were not influenced by factors in serum. It is possible that this reflects careful fine‐tuning of signalling pathways during adaptation, where replacing related, but functionally slightly distinct signalling molecules with each other, permits cell survival.
Approximately one‐third of the genes identified were regulated by serum factors, and returned to normal after re‐addition of serum. Although these probably did not play any role in adaptation to serum‐free media, these changes can certainly influence experiments performed in such. If the same genes are regulated by serum factors in all cell types, or if there are differences between cell types, is an important issue to address. Still our data clearly show that the gene expression profile change in cells adapted to serum‐free media, both as a consequence of the adaptation process and presence or absence of serum, and that both types of change must be taken into account in studies using cells grown in serum‐free media.
It has previously been shown that the Ramos cell line can survive without antibody expression (Sale & Neuberger 1998), and that non‐expressing cells are constantly being generated during culture due to introduction of stop codons within the antibody heavy chain gene by somatic hypermutation machinery. We demonstrated ongoing generation of non‐IgM expressing cells in our serum‐free cultures, and we confirmed that these IgM− cells carried mutations in their antibody coding genes. Lowered reversion frequency of the serum‐free cells was probably related to decreased AID expression in the clones as compared to serum‐dependent culture. This may not be related to lack of serum factors, as variations in mutation rates due to differences in AID expression have been described for Ramos clones established from serum‐growing cells (Martin et al. 2002). Despite lowered frequency of mutations, our data show that somatic hypermutation can occur in the Ramos cell line in the absence of external serum stimuli. It is possible that even primary B cells do not depend on continuous external stimulation to maintain the hypermutation process in vivo, and that they rather receive an initial signal and thereafter maintain their hypermutation phenotype. In this case, signals received by B cells within germinal centres are survival signals rather than signals to maintain hypermutation. In favour of this view, B cells from small germinal centre‐like structures have ongoing somatic hypermutation even in the absence of T cell help in vivo, but these quickly disappear due to lack of signals that rescue the B cells from apoptosis (de Vinuesa et al. 2000).
Long‐term culture of Ramos cells in serum‐free medium have been described previously, and two autocrine factors that may be important for survival, prolactin‐like protein and growth hormone (GH), have been isolated from serum‐free supernatant of these cells (Baglia et al. 1991, 1992; Lytras et al. 1993). A polyclonal anti‐GH antibody has been shown to inhibit cell population growth, but neither human GH alone nor GH in combination with human prolactin‐like protein, affected proliferation of serum‐free cells. Our data did not show any difference in expression of these proposed autocrine growth factors. Thus, even though they may be important for survival of Ramos cells, their regulation does not seem to be involved in allowing survival of cells in serum‐free media.
Our study has identified other genes that may be regulated to allow survival in serum‐free media. Genes such as Fas, CD70 and LTα were down‐regulated in cells growing in the absence of serum, while the LTα receptor herpesvirus entry mediator was expressed at higher levels than in serum‐dependent cells (Mauri et al. 1998). Herpesvirus entry mediator activation has been shown to promote differentiation and cell survival while the other receptor for LTα expressed on Ramos cells, TNFR1, also has pro‐apoptotic functions (Hsu et al. 1995; Marsters et al. 1997). Thus, such fine‐tuning of expression of signalling molecules and their receptors may allow cells to survive in the absence of serum through balancing pro‐ and anti‐apoptotic signals.
Among the genes that were significantly (P < 0.01) altered, we also found several genes involved in the Wnt pathway (Fig. 4a). A repressive receptor for Wnt named Fzd6 was up‐regulated together with the β‐catenin/T‐cell factor interaction inhibitor ICAT and a protein (EBI) that is involved in β‐catenin degradation (Tago et al. 2000; Matsuzawa & Reed 2001; Golan et al. 2004), while the stimulatory junction proteins plakoglobin (JUP) and protein tyrosine phosphatase Pez (PEZ) were down‐regulated. Plakoglobin has similar functions to β‐catenin in the Wnt‐signalling pathway and Pez has been proposed to be a dephosphorylator, thereby an activator of β‐catenin (Maeda et al. 2004; Wadham et al. 2003). Together these results indicate that signalling through the Wnt pathway was diminished in the serum‐free cells. The Wnt‐signalling pathway activates lymphoid enhancer factor/T‐cell factor transcription factors, but only a few target genes have been identified for them so far; these are, however, involved in central processes. Plakoglobin mediated activation up‐regulates expression of c‐myc, while β‐catenin also up‐regulates cyclin D1 (Barker & Clevers 2000). It is thus possible that alterations in the Wnt pathway are important for cell survival in the absence of external serum factors.
The serum‐free cultures demonstrated proliferation rates and cell cycle progression comparable to serum‐dependent cells, even though they did not receive activating signals normally provided by serum (Burk 1970; Kamely & Rudland 1976). In addition, the cells maintained a germinal centre cell‐like phenotype. Serum‐free Ramos cultures described here are well‐characterized cell lines suited to study the effects signalling molecules have on B lymphocytes in germinal centres, in the absence of background signals from undefined serum factors.
It should, however, be noted that most of the changes observed in gene expression, in both serum‐free cell cultures were comparatively modest, and that most genes were expressed at comparable levels. Thus, studies using serum‐free and serum‐dependent cells will most likely result in similar results with regard to changes in gene expression, although basal levels of expression of some genes is different. On the other hand, there were large clonal variations between the serum‐free lines. If one alone is used in a study, a particular gene of interest may already be silenced or overexpressed. Thus, effects on that gene may be missed if a single serum‐free clone is used. It can be concluded that although serum‐free cells may be useful in certain assays, they will in most cases not provide distinct results compared to serum‐dependent cultures. Great care must also be taken when cells are adapted to serum‐free media, as clonal variations that are not related to serum conditions may occur. Thus, in most studies, the effort involved in adapting cells to serum‐free media will not result in more accurate results.
In summary, we have studied differences in gene expression between a Burkitt's lymphoma cell line cultured in serum‐positive and serum‐free medium. We show that the cells were similar in cell cycle progression and cell population growth, and that they did not exhibit any abnormal phenotype or increased apoptosis compared to serum‐growing cells. Our global gene expression analysis identifies both genes that are regulated by factors in serum and changes that may play a role in allowing cells to survive in serum‐free media. These cell lines may be useful tools to study extracellular signals within germinal centres, and how these directly activate cells in the absence of non‐defined factors in the serum.
Supporting information
Table S1a. Genes up‐regulated in serum‐free cultures, P value < 0.005, fold change > 1.50
Table S1b. Genes down‐regulated in serum‐free cultures, P value < 0.005, fold change > 1.50
Table S2a. Genes up‐regulated in serum‐free cultures, P value < 0.01, fold change > 1.50
Table S2b. Genes down‐regulated in serum‐free cultures, P value < 0.01, fold change > 1.50
Table S3a. Genes up‐regulated in serum‐free cultures, P value < 0.05, fold change > 1.50
Table S3b. Genes down‐regulated in serum‐free cultures, P value < 0.05, fold change > 1.50
Table S4a. Genes up‐regulated in serum‐free cultures, Quotient analysis, fold change > 1.50
Table S4b. Genes down‐regulated in serum‐free cultures, Quotient analysis, fold change > 1.50
This material is available as part of the online article from:
http://www.blackwell‐synergy.com/doi/abs/10.1111/j.1365‐2184.2007.00500.x
(This link will take you to the article abstract).
Please note: Blackwell Publishing are not responsible for the content or functionality of any supplementary materials supplied by the authors. Any queries (other than missing material) should be directed to the corresponding author for the article.
Supporting info item
Supporting info item
Supporting info item
Supporting info item
Supporting info item
Supporting info item
Supporting info item
Supporting info item
Supporting info item
Supporting info item
ACKNOWLEDGEMENTS
This study was supported by the Swedish Research Council, the Swedish Cancer Foundation and the Mucosal Immunobiology and Vaccine Center.
REFERENCES
- Abramovich C, Shen WF, Pineault N, Imren S, Montpetit B, Largman C, Humphries RK (2000) Functional cloning and characterization of a novel nonhomeodomain protein that inhibits the binding of PBX1‐HOX complexes to DNA. J Biol Chem 275, 26172–26177. [DOI] [PubMed] [Google Scholar]
- Badea T, Niculescu F, Soane L, Fosbrink M, Sorana H, Rus V, Shin ML, Rus H (2002) RGC‐32 increases p34CDC2 kinase activity and entry of aortic smooth muscle cells into S‐phase. J Biol Chem 277, 502–508. [DOI] [PubMed] [Google Scholar]
- Baglia LA, Cruz D, Shaw JE (1991) An Epstein‐Barr virus‐negative Burkitt lymphoma cell line (sfRamos) secretes a prolactin‐like protein during continuous growth in serum‐free medium. Endocrinology 128, 2266–2272. [DOI] [PubMed] [Google Scholar]
- Baglia LA, Cruz D, Shaw JE (1992) Production of immunoreactive forms of growth hormone by the Burkitt tumor serum‐free cell line sfRamos. Endocrinology 130, 2446–2454. [DOI] [PubMed] [Google Scholar]
- Barker N, Clevers H (2000) Catenins, Wnt signaling and cancer. Bioessays 22, 961–965. [DOI] [PubMed] [Google Scholar]
- Barnes D, Sato G (1980) Methods for growth of cultured cells in serum‐free medium. Anal Biochem 102, 255–270. [DOI] [PubMed] [Google Scholar]
- Bos JL (1997) Ras‐like GTPases. Biochim Biophys Acta 1333, M19–31. [DOI] [PubMed] [Google Scholar]
- Bost F, Diarra‐Mehrpour M, Martin JP (1998) Inter‐alpha‐trypsin inhibitor proteoglycan family – a group of proteins binding and stabilizing the extracellular matrix. Eur J Biochem 252, 339–346. [DOI] [PubMed] [Google Scholar]
- Brunet A, Park J, Tran H, Hu LS, Hemmings BA, Greenberg ME (2001) Protein kinase SGK mediates survival signals by phosphorylating the forkhead transcription factor FKHRL1 (FOXO3a). Mol Cell Biol 21, 952–965. [DOI] [PMC free article] [PubMed] [Google Scholar]
- Burk RR (1970) One‐step growth cycle for BHK21–13 hamster fibroblasts. Exp Cell Res 63, 309–316. [DOI] [PubMed] [Google Scholar]
- Campbell MA, Sefton BM (1992) Association between B‐lymphocyte membrane immunoglobulin and multiple members of the Src family of protein tyrosine kinases. Mol Cell Biol 12, 2315–2321. [DOI] [PMC free article] [PubMed] [Google Scholar]
- Carpenter B, Hill KJ, Charalambous M, Wagner KJ, Lahiri D, James DI, Andersen JS, Schumacher V, Royer‐Pokora B, Mann M, et al. (2004) BASP1 is a transcriptional cosuppressor for the Wilms’ tumor suppressor protein WT1. Mol Cell Biol 24, 537–549. [DOI] [PMC free article] [PubMed] [Google Scholar]
- Chiang L, Silnutzer J, Pipas JM, Barnes DW (1984) Serum‐Free Cell Culture for Growth of NIH 3T3 and 10T1/2 Mouse Embryo Fibroblast Cell Lines, SV40 Virus propagation, and Selection of SV40‐Transformed Cells In Methods for Serum‐Free Culture of Epithelial and Fibroblastic Cells, Barnes DW, Sirbasku DA, Sato GH. (eds) (New York, Alan R. Liss, Inc.), pp. 265–276. [Google Scholar]
- Cole KE, Strick CA, Paradis TJ, Ogborne KT, Loetscher M, Gladue RP, Lin W, Boyd JG, Moser B, Wood DE, et al. (1998) Interferon‐inducible T cell alpha chemoattractant (I‐TAC): a novel non‐ELR CXC chemokine with potent activity on activated T cells through selective high affinity binding to CXCR3. J Exp Med 187, 2009–2021. [DOI] [PMC free article] [PubMed] [Google Scholar]
- Comeau MR, Johnson R, DuBose RF, Petersen M, Gearing P, VandenBos T, Park L, Farrah T, Buller RM, Cohen JI, et al. (1998) A poxvirus‐encoded semaphorin induces cytokine production from monocytes and binds to a novel cellular semaphorin receptor, VESPR. Immunity 8, 473–482. [DOI] [PubMed] [Google Scholar]
- Cuttitta F, Pio R, Garayoa M, Zudaire E, Julian M, Elsasser TH, Montuenga LM, Martinez A (2002) Adrenomedullin functions as an important tumor survival factor in human carcinogenesis. Microsc Res Tech 57, 110–119. [DOI] [PubMed] [Google Scholar]
- De Vinuesa CG, Cook MC, Ball J, Drew M, Sunners Y, Cascalho M, Wabl M, Klaus GG, MacLennan IC (2000) Germinal centers without T cells. J Exp Med 191, 485–494. [DOI] [PMC free article] [PubMed] [Google Scholar]
- Dotto GP (2000) p21(WAF1/Cip1): more than a break to the cell cycle? Biochim Biophys Acta 1471, M43–56. [DOI] [PubMed] [Google Scholar]
- Drexler HG, Matsuo AY, MacLeod RA (2000) Continuous hematopoietic cell lines as model systems for leukemia‐lymphoma research. Leuk Res 24, 881–911. [DOI] [PubMed] [Google Scholar]
- Eagle H (1955) Nutrition needs of mammalian cells in tissue culture. Science 122, 501–514. [DOI] [PubMed] [Google Scholar]
- Edwards MC, Liegeois N, Horecka J, DePinho RA, Sprague GF, Jr., Tyers M, Elledge SJ (1997) Human CPR (cell cycle progression restoration) genes impart a Far‐phenotype on yeast cells. Genetics 147, 1063–1076. [DOI] [PMC free article] [PubMed] [Google Scholar]
- Frodin M, Gammeltoft S (1999) Role and regulation of 90 kDa ribosomal S6 kinase (RSK) in signal transduction. Mol Cell Endocrinol 151, 65–77. [DOI] [PubMed] [Google Scholar]
- Golan T, Yaniv A, Bafico A, Liu G, Gazit A (2004) The human Frizzled 6 (HFz6) acts as a negative regulator of the canonical Wnt. beta‐catenin signaling cascade. J Biol Chem 279, 14879–14888. [DOI] [PubMed] [Google Scholar]
- Hanzal‐Bayer M, Renault L, Roversi P, Wittinghofer A, Hillig RC (2002) The complex of Arl2‐GTP and PDE delta: from structure to function. Embo J 21, 2095–2106. [DOI] [PMC free article] [PubMed] [Google Scholar]
- Harms K, Nozell S, Chen X (2004) The common and distinct target genes of the p53 family transcription factors. Cell Mol Life Sci 61, 822–842. [DOI] [PMC free article] [PubMed] [Google Scholar]
- Hettema EH, Distel B, Tabak HF (1999) Import of proteins into peroxisomes. Biochim Biophys Acta 1451, 17–34. [DOI] [PubMed] [Google Scholar]
- Hsu H, Xiong J, Goeddel DV (1995) The TNF receptor 1‐associated protein TRADD signals cell death and NF‐kappa B activation. Cell 81, 495–504. [DOI] [PubMed] [Google Scholar]
- Itoh S, Itoh F, Goumans MJ, Ten Dijke P (2000) Signaling of transforming growth factor‐beta family members through Smad proteins. Eur J Biochem 267, 6954–6967. [DOI] [PubMed] [Google Scholar]
- Jinquan T, Moller B, Storgaard M, Mukaida N, Bonde J, Grunnet N, Black FT, Larsen CG, Matsushima K, Thestrup‐Pedersen K (1997) Chemotaxis and IL‐8 receptor expression in B cells from normal and HIV‐infected subjects. J Immunol 158, 475–484. [PubMed] [Google Scholar]
- Kamely D, Rudland PS (1976) Induction of DNA synthesis and cell division in human diploid skin fibroblasts by fibroblast growth factor. Exp Cell Res 97, 120–126. [DOI] [PubMed] [Google Scholar]
- Kaminski NE, Koh WS, Yang KH, Lee M, Kessler FK (1994) Suppression of the humoral immune response by cannabinoids is partially mediated through inhibition of adenylate cyclase by a pertussis toxin‐sensitive G‐protein coupled mechanism. Biochem Pharmacol 48, 1899–1908. [DOI] [PubMed] [Google Scholar]
- Kaplan PL, Anderson M, Ozanne B (1982) Transforming growth factor(s) production enables cells to grow in the absence of serum: an autocrine system. Proc Natl Acad Sci U S A 79, 485–489. [DOI] [PMC free article] [PubMed] [Google Scholar]
- Klangby U, Okan I, Magnusson KP, Wendland M, Lind P, Wiman KG (1998) p16/INK4a and p15/INK4b gene methylation and absence of p16/INK4a mRNA and protein expression in Burkitt's lymphoma. Blood 91, 1680–1687. [PubMed] [Google Scholar]
- Komano J, Sugiura M, Takada K (1998) Epstein‐Barr virus contributes to the malignant phenotype and to apoptosis resistance in Burkitt's lymphoma cell line Akata. J Virol 72, 9150–9156. [DOI] [PMC free article] [PubMed] [Google Scholar]
- Kramer RM, Sharp JD (1997) Structure, function and regulation of Ca2+‐sensitive cytosolic phospholipase A2 (cPLA2). FEBS Lett 410, 49–53. [DOI] [PubMed] [Google Scholar]
- Lindholm D, Eriksson O, Korhonen L (2004) Mitochondrial proteins in neuronal degeneration. Biochem Biophys Res Commun 321, 753–758. [DOI] [PubMed] [Google Scholar]
- Lytras A, Quan N, Vrontakis ME, Shaw JE, Cattini PA, Friesen HG (1993) Growth hormone expression in human Burkitt lymphoma serum‐free Ramos cell line. Endocrinology 132, 620–628. [DOI] [PubMed] [Google Scholar]
- Maeda O, Usami N, Kondo M, Takahashi M, Goto H, Shimokata K, Kusugami K, Sekido Y (2004) Plakoglobin (gamma‐catenin) has TCF/LEF family‐dependent transcriptional activity in beta‐catenindeficient cell line. Oncogene 23, 964–972. [DOI] [PubMed] [Google Scholar]
- Marenholz I, Heizmann CW, Fritz G (2004) S100 proteins in mouse and man: from evolution to function and pathology (including an update of the nomenclature). Biochem Biophys Res Commun 322, 1111–1122. [DOI] [PubMed] [Google Scholar]
- Marquardt A, Stohr H, White K, Weber BH (2000) cDNA cloning, genomic structure, and chromosomal localization of three members of the human fatty acid desaturase family. Genomics 66, 175–183. [DOI] [PubMed] [Google Scholar]
- Marsters SA, Ayres TM, Skubatch M, Gray CL, Rothe M, Ashkenazi A (1997) Herpesvirus entry mediator, a member of the tumor necrosis factor receptor (TNFR) family, interacts with members of the TNFR‐associated factor family and activates the transcription factors NF‐kappaB and AP‐1. J Biol Chem 272, 14029–14032. [DOI] [PubMed] [Google Scholar]
- Martin A, Bardwell PD, Woo CJ, Fan M, Shulman MJ, Scharff MD (2002) Activation‐induced cytidine deaminase turns on somatic hypermutation in hybridomas. Nature 415, 802–806. [DOI] [PubMed] [Google Scholar]
- Matsuzawa SI, Reed JC (2001) Siah‐1, SIP, and Ebi collaborate in a novel pathway for beta‐catenin degradation linked to p53 responses. Mol Cell 7, 915–926. [DOI] [PubMed] [Google Scholar]
- Mauri DN, Ebner R, Montgomery RI, Kochel KD, Cheung TC, Yu GL, Ruben S, Murphy M, Eisenberg RJ, Cohen GH, et al. (1998) LIGHT, a new member of the TNF superfamily, and lymphotoxin alpha are ligands for herpesvirus entry mediator. Immunity 8, 21–30. [DOI] [PubMed] [Google Scholar]
- Montagna C, Lyu MS, Hunter K, Lukes L, Lowther W, Reppert T, Hissong B, Weaver Z, Ried T (2003) The Septin 9 (MSF) gene is amplified and overexpressed in mouse mammary gland adenocarcinomas and human breast cancer cell lines. Cancer Res 63, 2179–2187. [PubMed] [Google Scholar]
- Moore SC, Jason L, Ausio J (2002) The elusive structural role of ubiquitinated histones. Biochem Cell Biol 80, 311–319. [DOI] [PubMed] [Google Scholar]
- Moteki S, Price D (2002) Functional coupling of capping and transcription of mRNA. Mol Cell 10, 599–609. [DOI] [PubMed] [Google Scholar]
- Munz C, Psichari E, Mandilis D, Lavigne AC, Spiliotaki M, Oehler T, Davidson I, Tora L, Angel P, Pintzas A (2003) TAF7 (TAFII55) plays a role in the transcription activation by c‐Jun. J Biol Chem 278, 21510–21516. [DOI] [PubMed] [Google Scholar]
- Pearson‐White S, Crittenden R (1997) Proto‐oncogene Sno expression, alternative isoforms and immediate early serum response. Nucleic Acids Res 25, 2930–2937. [DOI] [PMC free article] [PubMed] [Google Scholar]
- Pound JD, Gordon J (1997) Maintenance of human germinal center B cells in vitro. Blood 89, 919–928. [PubMed] [Google Scholar]
- Ray MK, Datta B, Chakraborty A, Chattopadhyay A, Meza‐Keuthen S, Gupta NK (1992) The eukaryotic initiation factor 2‐associated 67‐kDa polypeptide (p67) plays a critical role in regulation of protein synthesis initiation in animal cells. Proc Natl Acad Sci U S A 89, 539–543. [DOI] [PMC free article] [PubMed] [Google Scholar]
- Reymond A, Meroni G, Fantozzi A, Merla G, Cairo S, Luzi L, Riganelli D, Zanaria E, Messali S, Cainarca S, et al. (2001) The tripartite motif family identifies cell compartments. Embo J 20, 2140–2151. [DOI] [PMC free article] [PubMed] [Google Scholar]
- Richnau N, Aspenstrom P (2001) Rich, a rho GTPase‐activating protein domain‐containing protein involved in signaling by Cdc42 and Rac1. J Biol Chem 276, 35060–35070. [DOI] [PubMed] [Google Scholar]
- Rizzino A, Rizzino H, Sato G (1979) Defined media and the determination of nutritional and hormonal requirements of mammalian cells in culture. Nutr Rev 37, 369–378. [DOI] [PubMed] [Google Scholar]
- Rousset F, Garcia E, Defrance T, Peronne C, Vezzio N, Hsu DH, Kastelein R, Moore KW, Banchereau J (1992) Interleukin 10 is a potent growth and differentiation factor for activated human B lymphocytes. Proc Natl Acad Sci U S A 89, 1890–1893. [DOI] [PMC free article] [PubMed] [Google Scholar]
- Salaun C, James DJ, Chamberlain LH (2004) Lipid rafts and the regulation of exocytosis. Traffic 5, 255–264. [DOI] [PMC free article] [PubMed] [Google Scholar]
- Sale JE, Neuberger MS (1998) TdT‐accessible breaks are scattered over the immunoglobulin V domain in a constitutively hypermutating B cell line. Immunity 9, 859–869. [DOI] [PubMed] [Google Scholar]
- Smeland E, Godal T, Ruud E, Beiske K, Funderud S, Clark EA, Pfeifer‐Ohlsson S, Ohlsson R (1985) The specific induction of myc protooncogene expression in normal human B cells is not a sufficient event for acquisition of competence to proliferate. Proc Natl Acad Sci U S A 82, 6255–6259. [DOI] [PMC free article] [PubMed] [Google Scholar]
- Spada FM, Koezuka Y, Porcelli SA (1998) CD1d‐restricted recognition of synthetic glycolipid antigens by human natural killer T cells. J Exp Med 188, 1529–1534. [DOI] [PMC free article] [PubMed] [Google Scholar]
- Stocker M (2004) Ca(2+)‐activated K+ channels: molecular determinants and function of the SK family. Nat Rev Neurosci 5, 758–770. [DOI] [PubMed] [Google Scholar]
- Sturm RA, Teasdale RD, Box NF (2001) Human pigmentation genes: identification, structure and consequences of polymorphic variation. Gene 277, 49–62. [DOI] [PubMed] [Google Scholar]
- Sun CX, Robb VA, Gutmann DH (2002) Protein 4.1 tumor suppressors: getting a FERM grip on growth regulation. J Cell Sci 115, 3991–4000. [DOI] [PubMed] [Google Scholar]
- Tago K, Nakamura T, Nishita M, Hyodo J, Nagai S, Murata Y, Adachi S, Ohwada S, Morishita Y, Shibuya H, Akiyama T (2000) Inhibition of Wnt signaling by ICAT, a novel beta‐catenin‐interacting protein. Genes Dev 14, 1741–1749. [PMC free article] [PubMed] [Google Scholar]
- Ten Hagen KG, Fritz TA, Tabak LA (2003) All in the family: the UDP‐GalNAc:polypeptide N‐acetylgalactosaminyltransferases. Glycobiology 13, 1R‐16R. [DOI] [PubMed] [Google Scholar]
- Ting JP, Trowsdale J (2002) Genetic control of MHC class II expression. Cell 109 Suppl, S21–33. [DOI] [PubMed] [Google Scholar]
- Uittenbogaart CH, Nishanian PG, Anisman DJ, Erikson TK, Fahey JL (1986) Leukemia derived growth factors produced by human malignant T‐lymphoid cell lines. Cancer Res 46, 1219–1223. [PubMed] [Google Scholar]
- Van Gent D, Sharp P, Morgan K, Kalsheker N (2003) Serpins: structure, function and molecular evolution. Int J Biochem Cell Biol 35, 1536–1547. [DOI] [PubMed] [Google Scholar]
- Wadham C, Gamble JR, Vadas MA, Khew‐Goodall Y (2003) The protein tyrosine phosphatase Pez is a major phosphatase of adherens junctions and dephosphorylates beta‐catenin. Mol Biol Cell 14, 2520–2529. [DOI] [PMC free article] [PubMed] [Google Scholar]
- Wasik M, Gorski A, Nowaczyk M (1987) An optimal assay of human B cell proliferation in vitro. J Immunol Methods 99, 1–5. [DOI] [PubMed] [Google Scholar]
- Wiman KG, Magnusson KP, Ramqvist T, Klein G (1991) Mutant p53 detected in a majority of Burkitt lymphoma cell lines by monoclonal antibody PAb240. Oncogene 6, 1633–1639. [PubMed] [Google Scholar]
- Yang L, Dan HC, Sun M, Liu Q, Sun XM, Feldman RI, Hamilton AD, Polokoff M, Nicosia SV, Herlyn M, et al. (2004) Akt/protein kinase B signaling inhibitor‐2, a selective small molecule inhibitor of Akt signaling with antitumor activity in cancer cells overexpressing Akt. Cancer Res 64, 4394–4399. [DOI] [PubMed] [Google Scholar]
- Yu Q, Chen D, Konig R, Mariani R, Unutmaz D, Landau NR (2004) APOBEC3B and APOBEC3C are potent inhibitors of simian immunodeficiency virus replication. J Biol Chem 279, 53379–53386. [DOI] [PubMed] [Google Scholar]
Associated Data
This section collects any data citations, data availability statements, or supplementary materials included in this article.
Supplementary Materials
Table S1a. Genes up‐regulated in serum‐free cultures, P value < 0.005, fold change > 1.50
Table S1b. Genes down‐regulated in serum‐free cultures, P value < 0.005, fold change > 1.50
Table S2a. Genes up‐regulated in serum‐free cultures, P value < 0.01, fold change > 1.50
Table S2b. Genes down‐regulated in serum‐free cultures, P value < 0.01, fold change > 1.50
Table S3a. Genes up‐regulated in serum‐free cultures, P value < 0.05, fold change > 1.50
Table S3b. Genes down‐regulated in serum‐free cultures, P value < 0.05, fold change > 1.50
Table S4a. Genes up‐regulated in serum‐free cultures, Quotient analysis, fold change > 1.50
Table S4b. Genes down‐regulated in serum‐free cultures, Quotient analysis, fold change > 1.50
This material is available as part of the online article from:
http://www.blackwell‐synergy.com/doi/abs/10.1111/j.1365‐2184.2007.00500.x
(This link will take you to the article abstract).
Please note: Blackwell Publishing are not responsible for the content or functionality of any supplementary materials supplied by the authors. Any queries (other than missing material) should be directed to the corresponding author for the article.
Supporting info item
Supporting info item
Supporting info item
Supporting info item
Supporting info item
Supporting info item
Supporting info item
Supporting info item
Supporting info item
Supporting info item