

Abstract
Abstract. Recent research on the origin of brain cancer has implicated a subpopulation of self‐renewing brain cancer stem cells for malignant tumour growth. Various genes that regulate self‐renewal in normal stem cells are also found in cancer stem cells. This implies that cancers can occur because of mutations in normal stem cells and early progenitor cells. A predictive mathematical model based on the cell compartment method is presented here to pose and validate non‐intuitive scenarios proposed through the neural cancer stem cell hypothesis. The growths of abnormal (stem and early progenitor) cells from their normal counterparts are ascribed with separate mutation probabilities. Stem cell mutations are found to be more significant for the development of cancer than a similar mutation in the early progenitor cells. The model also predicts that, as previously hypothesized, repeated insult to mature cells increases the formation of abnormal progeny, and hence the risk of cancer.
INTRODUCTION
Self‐renewal is an intrinsic property of some cancer cells. Various genes that regulate self‐renewal in normal cells are also found in cancer cells (Al‐Hajj & Clarke 2004; Clarke 2004). This implies that cancers can occur because of mutations in normal stem and early progenitor cells or from abnormal self‐renewing cancer cells. The cancer stem cell hypothesis states that just as mature cells are maintained by self‐renewing stem cells, cancerous tumours are the abnormal progeny of abnormal stem cells or of progenitor cells whose DNA carries mutation(s). There is recent evidence that brain cancer tumours are driven by a very small subpopulation of self‐renewing brain cancer stem cells (Reya et al. 2001; Pardal et al. 2003; 2003, 2004; Clarke 2004). Brain tumour growth bears similarities to other cancer pathways for blood or epithelial cells (Al‐Hajj & Clarke 2004). It is likely that cancerous stem cells may often be responsible for recurrences that occur after treatment.
Transformation of stem cells into malignant cells is important because they already have an activated self‐renewal mechanism. These cells therefore require fewer mutations to become abnormal cells than are required to ectopically activate a more differentiated cell. Because stem cells are self‐renewing, they often persist for longer periods and are thus more likely to accumulate mutations than a short‐lived progenitor or differentiated cell. A progenitor cell could inherit mutations from a stem cell and itself could undergo continuing mutation to cause transformation. When the signalling pathways that normally regulate stem cell self‐renewal are disrupted, newly arising cancer cells appropriate the machinery for self‐renewal that is normally only expressed in stem cells. Many pathways associated with normal stem cells are also be involved in regulating the development of cancer cells, for example, Bmi‐1 (Lessard & Sauvageau 2003; Molofsky et al. 2003), sonic hedgehog (Taipale & Beachy 2001), and Wnt signalling (Polakis 2000; Taipale & Beachy 2001), which are all implicated in both oncogenesis and stem cell renewal.
Predictive models of stem cell systems provide the means to pose and validate non‐intuitive hypotheses. Hence, they serve as important tools to distinguish the underlying regulatory mechanisms that govern stem cell fate decisions. A model can also provide a basis for estimating the potential risk of malignant tumour growth in the event of a detectable oncogenic event (for example, formation of a cancer cluster), or physiological perturbation to the tissue (for example, radiation injury).
The literature cites several techniques for mathematical modelling of haematopoietic, neural and embryonic stem cells (Viswanathan & Zandstra 2003). However, none of these models can quantitatively describe the recently proposed neural cancer stem cell hypothesis (Reya et al. 2001; Al‐Hajj & Clarke 2004; Clarke 2004; Singh et al. 2004). Here we describe a mathematical model for the hypothesis that is based on the cell compartments method (Wichmann & Loeffler 1984). The role of internal cell signalling during cell proliferation is discussed. Growths of abnormal (stem and early progeny) cells from their normal counterparts are ascribed with separate mutation probabilities. The relative importance of mutation probabilities of stem and early progenitor cells on abnormal progeny's growth rates are discussed. It is also demonstrated how repeated insult to mature cells can lead to enhanced population growth rate of the abnormal cells.
THE MODEL
The mathematical model describes formation of cancer cells from stem cells. We have used it to analyse the influence of a stimulus, such as depletion of mature cells because of injury, on overall cancer growth. The model is deterministic (that is, not stochastic) so that for specified input conditions, it always provides the same prediction. However, this is not restrictive, since randomness is readily modelled by changing various parameters (such as those reported in 1, 2).
Table 1.
Parameters used in the model
| Parameter | Symbols | Values |
|---|---|---|
| Cell cycle time for SC, EP and LP compartments | τSC, τEP, τLP | 8 h |
| Cell maturation time for LP compartment | τm | 40 h |
| Self‐renewal probability upper and lower limits for SC | P max,SC, P min,SC | 0.6, 0.4 |
| Self‐renewal probability upper and lower limits for EP | P max,EP, P min,EP | 0.5, 0.5 |
| Upper and lower limits of mitotic fractions for stem cells | αmax,SC, αmin,SC | 1, 0.01 |
| Upper and lower limits of mitotic fractions for EP cells | αmax,EP, αmin,EP | 1, 0.3 |
| Number of EP cell self‐renewals | k | 5 |
| Upper and lower limits of the number of mitotic cycles | n LP,max, nLP,min | 3, 9 |
| Death rate (apoptosis) of MC | ώ0,MC | 0.01 |
| Death rate (apoptosis) of AP | ώ0,AP | 0.01 |
Table 2.
Mathematical representations of the regulatory signals (Wichmann & Loeffler 1984)
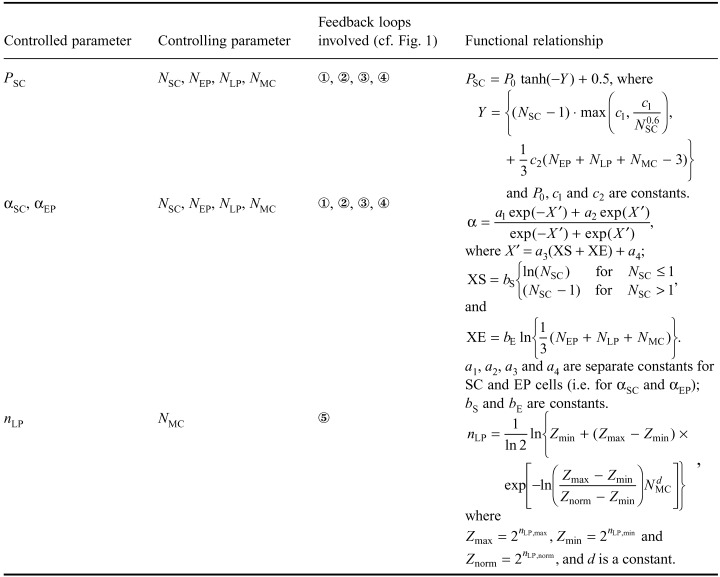
Figure 1 is a schematic representation of how normal stem cells and early progenitor cells undergo mutation to produce abnormal cells that give rise to abnormal progeny which ultimately form tumours (Clarke 2004). It is an evolutionary perspective that assumes that cells regularly undergo mutation in their DNA (the vast majority of which are detrimental to their survival). However, some cells, particularly those that are capable of self‐renewal, infrequently survive these mutations and subsequently drive the formation of pathological tumours.
Figure 1.
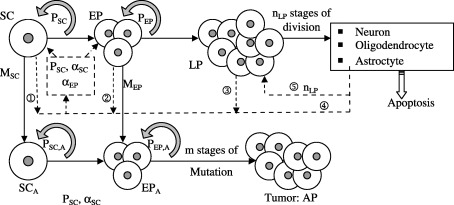
Schematic representation of the model. SC, stem cells; EP, early progenitor cells; LP, late progenitor cells; SCA, abnormal stem cells; EPA, abnormal early progenitor cells; AP, abnormal progeny (tumour); P, self‐renewal probability.
The incorporation of cell biological mechanistic information into stem cell models requires that signalling thresholds be mathematically represented in the context of cell fate choices. It has been suggested that the diffusion of a soluble signal can establish a concentration gradient and that cells within the gradient can adopt alternate, ‘all‐or‐none’ fates at critical threshold levels of the signal (Jessel & Lumsden 1997; O’Neill & Schaffer 2004). Our model is consistent with this principle, but we assume that this concentration gradient becomes negligible when the mature cell population reaches a desired sustainable level (that is, there must be an upper signalling threshold that should be modelled).
Consistent with previous findings (Oliver & Wechsler‐Reya 2004), the growth mechanisms and factors influencing stem cell self‐renewal are considered to be the same for both normal and abnormal stem cells. Consequently, in our model, the self‐renewal probabilities for normal and abnormal (DNA mutated) stem cells are identical. The same assumption applies for normal and abnormal early progenitor cells. Stem cells are assumed to self‐renew an unlimited number of times (Al‐Hajj & Clarke 2004) with a self‐renewal probability P SC. Cells that do not self‐renew differentiate to form early progenitor cells. Depending on the stem cell and early and late progenitor cell populations, the self‐renewal probability varies between a maximum P max,SC and a minimum P min,SC.
Unlike stem cells, early progenitor cells can self‐renew only a limited number of times (Al‐Hajj & Clarke 2004), assumed to be k
EP in our analysis. Depending on early and late progenitor cell populations, the early progenitor cells’ self‐renewal probability P
EP lies between P
max,EP and P
min,
EP. Late progenitor cells are assumed to undergo n
LP stages of cell division. Here, depending on the mature cell population, cell division regulatory feedback signalling controls the number of cell division stages (between n
LP,min and n
LP,max). This regulatory signal is responsible for maintaining a steady population of mature cells. The mature cell population also provides feedback to the stem cells and thus influences their mitotic fraction and self‐renewal rate. In Fig. 1, the regulatory feedback signals are represented by dotted lines and numbered  through
  . Table 2 summarizes the mathematical representations for these signals.
We have considered cancer‐initiating mutations both in normal stem cells and in early progenitor cells. Abnormal progeny are produced either through mutation of stem cells into abnormal stem cells and their subsequent self‐renewal and differentiation, or from differentiated early progenitor cells. Occurrences of mutation are probabilistic events. Each cell division event for stem cells or for early progenitor cells has the associated probabilities, M SC and M EP, that represent the occurrence of oncogenic mutation during DNA transcription. Hence, following cell division, one daughter cell acquires the mutated gene while the other retains the original DNA. As the self‐renewal process has a probability P SC, the probability that the mutated gene is inherited in the abnormal stem cell lineage is M SC × P SC. The same rationale applies to mutated early progenitor cells. Cancer arises if a cell undergoes a critical number of consecutive mutations and acquires the ability to proliferate indefinitely. Thereafter, the associated cell cluster produces a malignant tumour through its uncontrolled proliferation (Reya et al. 2001).
Each cell type is considered as a separate compartment. Cell population growth is modelled by considering individual rate expressions for each compartment.
(1) Stem cell compartment. During each cell division, there is a probability, P SC, that the two daughter stem cells retain their original features. Thus, the stem cell population increases by an amount (2PSC‐1). These self‐renewed cells add to the stem cell lineage, whereas the differentiated cells contribute to the early progenitor cell pool. When a mutation occurs during the DNA replication process (which is assumed to have a probability M SC), one of the two daughter cells inherits the mutated gene. Thus, for each cell division event, the number of cells lost from the normal stem cell pool is M SC. Consequently, the net rate of change of the stem cell population is
| (1) |
where ώSC = (αSC/τSC)ln2 denotes the cell division rate, αSC the mitotic fraction and τSC the cell cycle time (that is, the time required to complete a full cycle of cell division). The self‐renewal probability P SC = P SC(N SC, N EP, N LP, N MC) ∈ [P max,SC, P min,SC]. The mitotic fraction is a bounded function of the stem and early progenitor cell populations (Wichmann & Loeffler 1984), that is, αSC = αSC(N SC, N EP) ∈ [αmax,SC, αmin, SC].
(2) Early progenitor (EP) cell compartment. The model for this compartment considers that EP cells undergo a limited number (k) of self‐renewal steps. Thus, the early progenitor cells are split into k subcompartments that contain identical EP cells, which differ only with respect to the number of times they have undergone self‐renewal (and, hence, the number of times they can further self‐renew). We refer to these subgroups as EP1, EP2… EPk.
When a subgroup EPi undergoes cell division, it self‐renews (with a probability P EP that is assumed identical for i = 1 through k − 1) into a subgroup EPi+1 and also differentiates into LP. The first subgroup receives a flux of differentiated stem cells from the stem cell compartment, whereas the last one completely differentiates into LP (late progenitor) (i.e. P EP = 0 for the k th compartment). Each subgroup has a mutation probability M EP (assumed identical for i = 1 through k). The relations describing the population changes in each subgroup are
 |
(2a) |
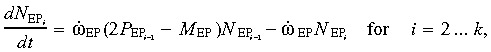 |
(2b) |
where ώEP = (αEP/τEPC)ln2. This is a set of state equations for the state variables  .
.
The output equation  can be used to determine the EP cell population. Because EP cells do not differ in cell characteristics (other than their ability to further self‐renew), the same values of ώEP, P
EP and M
EP are considered for all subgroups 1 through k
EP (except that the value of P
EP for the k
th subgroup is zero). The total efflux of differentiated EP cells that enters the LP compartment is
can be used to determine the EP cell population. Because EP cells do not differ in cell characteristics (other than their ability to further self‐renew), the same values of ώEP, P
EP and M
EP are considered for all subgroups 1 through k
EP (except that the value of P
EP for the k
th subgroup is zero). The total efflux of differentiated EP cells that enters the LP compartment is
| (3) |
Thus, the resulting efflux of mutated EP cells is 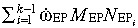 .
.
(3) Late progenitor cell compartment. The LP compartment receives an influx  as described previously. The cells contained in it undergo n
LP successive stages of cell division before transforming into mature cells, where n
LP = n
LP(NMC) ∈ [n
LP,max, n
LP,min]. Although a state–space model for the n stages of cell division can be explicitly written (as for the EP compartment), its solution would be needlessly complicated, as the dimension of the state–space matrix is itself a variable in this case. Instead, we follow an approach (Wichmann & Loeffler 1984) that assumes that the efflux from the EP compartment is amplified by a factor Z
in as soon as the cells enter the LP compartment. Immediately before leaving the LP compartment, they are further amplified by a factor Z
out. These two factors are selected such that
as described previously. The cells contained in it undergo n
LP successive stages of cell division before transforming into mature cells, where n
LP = n
LP(NMC) ∈ [n
LP,max, n
LP,min]. Although a state–space model for the n stages of cell division can be explicitly written (as for the EP compartment), its solution would be needlessly complicated, as the dimension of the state–space matrix is itself a variable in this case. Instead, we follow an approach (Wichmann & Loeffler 1984) that assumes that the efflux from the EP compartment is amplified by a factor Z
in as soon as the cells enter the LP compartment. Immediately before leaving the LP compartment, they are further amplified by a factor Z
out. These two factors are selected such that  .
.
The total time τLP spent by a cell in the LP compartment is the sum of the cell generation time (τg = αLP ln2/τLP) and the cell maturation time τm. The factor Z in = (2n − 1) τg/τLP+2nτm/τLP, and the LP population change is
 |
(4) |
and the efflux from the LP compartment (that is, the generation rate of mature cells)  . As before, ώLP = (αLP/τLP)ln2.
(4) Mature cell compartment. The mature cell compartment receives an efflux of  from the LP compartment. Considering a cell death (or apoptotic) rate of ώ0,MC, the rate of change in the mature cell population
 |
(5) |
(5) Abnormal stem cell compartment. As mutated stem cells behave in the same manner as normal cells, the relation representing the growth rate of the abnormal stem cell population is analogous to (1) except that the mutating fraction must be added to the cell population in this case. Thus,
 |
(6) |
(6) Abnormal early progenitor cell compartment. The equations for the abnormal EP cell population also resemble Eq. (2a) and (2b), except that here too the mutating cells add to the population. Hence,
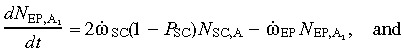 |
(7a) |
 |
(7b) |
The overall population of abnormal EP cells can be found by solving the above state equations and substituting the state variables into the output equation  . The outflux of abnormal EP cells
| (8) |
(7) Abnormal progeny compartment. If they originate from cancerous abnormal stem cells or from abnormal early progenitor cells, the abnormal progeny undergo uncontrolled cell division leading to a malignant tumour. The growth of the abnormal progeny
 |
(9) |
where ώ0,AP denotes the abnormal progeny cell death rate (or apoptosis).
RESULTS AND DISCUSSION
(1), (2a), (2b), (3), (4), (5), (6), (7a), (7b), (8), (9) are numerically solved through time marching using the parameters specified in Table 1 (Wichmann & Loeffler 1984). The model is first tested for its stability and steady state response by selecting an initial normalized condition N sc = 1.0, with all other normalized cell populations set to zero. The response of the SC, EP, LP and MC populations is then examined for a mature cell death rate of 0.01/h. For this base case, the mutation probabilities are assumed to be zero.
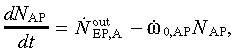
Figure 2a presents the growth of the EP, LP and MC populations from stem cells in response to these conditions. Initially, when these populations are very small, feedback signals  ,
,  and
and  from the EP, LP and MC compartments increase the values of αSC and αEP so as to quickly replenish the respective cell populations (Fig. 2b). Because P
SC = P
SC,min (that is, 0.4) initially, rapid cell division leads to an early depletion in the SC pool. Subsequently, as the value of P
SC slowly increases, so does the SC population stabilizes at N
SC = 0.77. The values of αSC and αEP concurrently decrease to steady values of 0.28 and 0.34, and the EP, LP and MC cell populations likewise stabilize at various steady values (3.19, 96.85 and 678.1, respectively) within the first 400 h. Figure 2 confirms that the modelled process is self‐regulating, that is, proper cell signalling limits cell proliferation to a steady value that is sufficient to replenish the steady death (apoptosis) of mature cells.
from the EP, LP and MC compartments increase the values of αSC and αEP so as to quickly replenish the respective cell populations (Fig. 2b). Because P
SC = P
SC,min (that is, 0.4) initially, rapid cell division leads to an early depletion in the SC pool. Subsequently, as the value of P
SC slowly increases, so does the SC population stabilizes at N
SC = 0.77. The values of αSC and αEP concurrently decrease to steady values of 0.28 and 0.34, and the EP, LP and MC cell populations likewise stabilize at various steady values (3.19, 96.85 and 678.1, respectively) within the first 400 h. Figure 2 confirms that the modelled process is self‐regulating, that is, proper cell signalling limits cell proliferation to a steady value that is sufficient to replenish the steady death (apoptosis) of mature cells.
Figure 2.
Transient response of the model beginning with NSC = 1.0 and with all other cell populations set to zero. (a) The SC, EP, LP and MC populations and (b) the internal signalling described by the model in terms of the transient values of αSC, αEP and P SC.
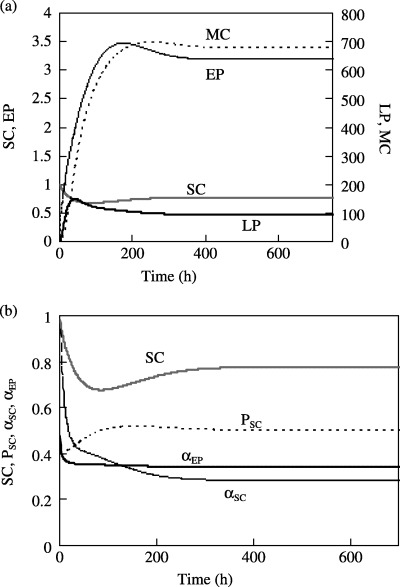
Next, we consider the occurrence of an oncogenic event in either of the SC or of the EP populations. First, we assume that there is a 10−3 probability that a mutation occurs during stem cell self‐renewal with M SC»M EP (or M EP≈ 0). Next, assuming that the abnormal progeny have an apoptotic rate (1%/h) equals the mature cell death rate, the growth rates of the SCA, EPA and AP populations are determined as shown in Fig. 3a. Since the mutation rate is very small, it has a negligible effect on the SC population. The abnormal cell populations are much smaller than those of healthy cells. Following an initial rapid growth period, the AP population grows steadily and nearly linearly to a normalized value of 0.15 at 700 h. This indicates that loss of self‐regulation (that is otherwise observed in healthy cells) is successfully modelled. When EP cells undergo mutation (with M EP = 10−3, and M EP»M SC), the AP population growth rate shown in Fig. 3b is far smaller than when the SC population is allowed to mutate. This is to be expected, since while stem cells can self‐renew indefinitely, EP cells have limited capability to do so. Hence, SC mutations have a much larger proliferation potential than mutations in EP cells. The model confirms that mutations leading to cancer are more significant when they occur in stem cells than when they occur in early progenitor cells.
Figure 3.
Growth rate of populations of abnormal stem cells, EP cells and abnormal progeny for a specific mutation probability in the SC or EP cell compartments. Model response for (a) M SC = 10−3, M EP = 0, and (b) M SC = 0, M EP = 10−3.
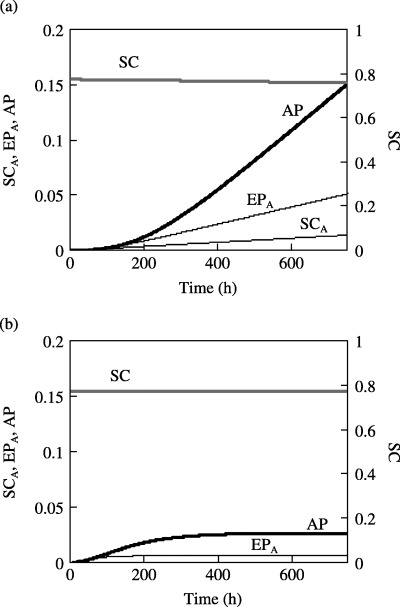
Regulation of healthy cells occurs through feedback signals that alter the values of P SC, αSC and αEP (Fig. 1). (This mechanism is also responsible for tissue healing; Craig et al. 1996; Calza et al. 2004.) In order to investigate the influence of these feedback loops on the onset of cancer, we simulated repeated insult to the mature cell population by periodically depleting its population by a specified amount. Figure 4a shows the response of the SC, EP, LP and MC populations when 50% of mature cells are removed at 200 h intervals. (Repetitive radiation therapy used to treat cancer could lead to a similar condition, that is, when some mature cells also periodically die because of treatment; Fujimaki 2005.)
Figure 4.
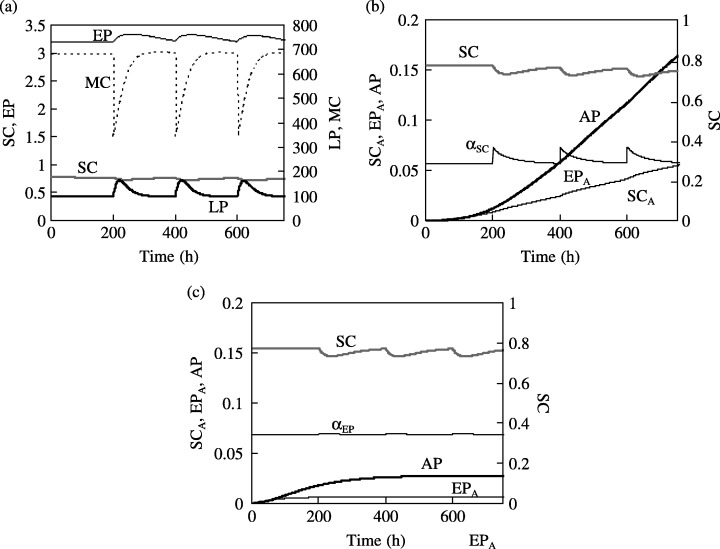
(a) Transient response of the SC, EP, LP and MC populations to periodic insult that depletes 50% of the MC population every 200 h. The corresponding response in the SCA, EPA and AP populations is shown for (b) M SC = 10−3, M EP = 0, and (c) M SC = 0, M EP = 10−3.
Upon loss of mature cells, the feedback loop immediately increases proliferation of LP cells, and feedback signal contributes to an immediate rise in the proliferative fraction of stem cells. This is reflected in Fig. 4b, which shows that the value of αSC temporarily increases to 0.34 from a steady value of 0.28. Therefore, repeated insult increases the proportion of the stem cell population that participates in cell division. Even assuming that the probability of cell mutation remains unchanged, the growth rate of the abnormal progeny is consequently enhanced.
A comparison of 3, 4 indicates that the abnormal progeny population becomes larger with repeated injury (when M SC = 10−3 and M EP = 0, the AP population increases to 0.16 in 700 h for repeated insult, whereas it would have been 0.15 in the absence of any insult). This is in conformity with the earlier findings (Beachy et al. 2004), which showed that repeated tissue invasion leads to an increased cancer risk. In comparison, the increase in the value of αEP following insult is negligible (Fig. 4c). Hence, when only EP cells are assumed to undergo mutation (for M EP = 10−3 and M SC = 0), the AP cell population is relatively unaffected by repeated insult to the MC population. The model indicates that repeated insult increases the cancer risk by influencing the mitotic fraction in the stem cell population.
When repeated MC insult occurs every 200 h as shown in Fig. 4b, the value of αSC first rapidly increases to a maximum but then decreases to its initial value within 200 h. However, when the frequency of insult is increased to once every 10 h, αSC does not decrease to that initial value at the end of each cycle. Here, Fig. 5 shows that the actively proliferating stem cell pool keeps increasing with time and consequently the AP population grows to an even larger value (N AP increases from 0.16 to 0.18 as the time between two consecutive insults is decreased from 200 to 100 h). This indicates that the cancer risk increases with increasing frequency of injury to the mature cell population.
Figure 5.
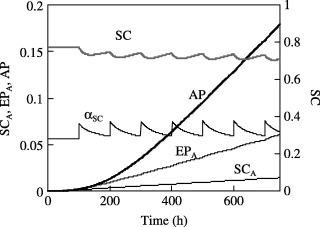
Response of the in SCA, EPA and AP populations when 50% of the MC population is depleted every 100 h.
The trend becomes obvious when the AP populations after 700 h are plotted as a function of the mean time between two consecutive insults (Fig. 6). Here, four different combinations of the SC and EP cell mutation probabilities are considered (M SC = 0.002 and 0.001 with M EP = 0; and M EP = 0.002 and 0.001 with M SC = 0) while all the other parameters were kept unchanged. As before, 50% insult of the MC population is considered. It is evident from Fig. 6 that the AP population increases as the time between two subsequent (regularly imposed) insults is reduced. The effect of changing the frequency of repeated insult is more profound when the mutations occur in SC rather than in EP cells. Also, the effect of changing the insult frequency is more pronounced at higher insult frequencies (that is, at smaller mean time between the insults – less than 100 h for the case shown here). With smaller time between two insults, MC population fails to rise to its normal value – leading to a high level of actively proliferating SC and EP cells at the end of each cycle. This means that the SC and EP cells undergo more frequent cell division. For a given probability of mutation, this essentially means a higher growth rate of the AP cells. When the mean time between two insults is very large (e.g. lager than 250 h for the cases presented here), nearly the steady normal MC population is re‐established after each insult. Each consecutive insult therefore can be treated as nearly isolated events, and the AP growth rate becomes almost insensitive to the insult frequency.
Figure 6.
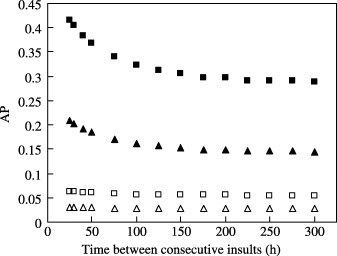
AP cell growth as a function of the time between consecutive insults. The AP cell population (after 700 h) increases with increasing frequency of insult. The plots correspond to the conditions: M EP = 0 (solid symbols) with M SC = 0.002 (▪) and 0.001 (▴); and M SC = 0 (empty symbols) with M EP = 0.002 (□) and 0.001 (▵).
CONCLUSION
A predictive model based on a cell compartments method is presented to pose and validate non‐intuitive scenarios arising from the cancer stem cell hypothesis.
-
1
Under normal circumstances, the model converges to a steady population of the stem, early and late progenitor cells that maintain a constant mature cell population for a specified cell apoptotic rate.
-
2
An oncogenic event in stem cells or EP cells produces abnormal stem or EP cells and eventually the abnormal progeny. For the same occurrence probability, mutations in stem cells (rather than in EP cells) lead to faster growth of the abnormal progeny.
-
3
When the mature cell population undergoes a sudden depletion because of an insult (for example, radiation damage to the mature tissue), regulatory feedback signals (that are responsible for tissue healing) increase the stem and EP cell proliferative fractions. This in turn leads to an increased growth rate of the abnormal progeny cells.
-
4
The abnormal progeny cell population growth rate increases as the mean time between two consecutive insults is reduced. This trend is more pronounced when the insult frequency is higher. However, when this frequency is small enough that the stable cell populations are restored between two consecutive insults, the AP growth rate is relatively unaffected.
REFERENCES
- Al‐hajj M, Clarke MF (2004) Self‐renewal and solid tumor cells. Oncogene 23, 7274. [DOI] [PubMed] [Google Scholar]
- Beachy PA, Karhadkar SS, Berman DM (2004) Tissue repair and stem cell renewal in carcinogenesis. Nature 432, 324. [DOI] [PubMed] [Google Scholar]
- Calza L, Fernandez M, Giuliani A, Pirondi S, D’intino G, Manservigi M, De Sordi N, Giardino L (2004) Stem cells and nervous tissue repair: from in vitro to in vivo. Prog. Brain Res. 146, 75. [DOI] [PubMed] [Google Scholar]
- Clarke MF (2004) At the root of brain cancer. Nature 432, 281. [DOI] [PubMed] [Google Scholar]
- Craig CG, Tropepe V, Morshead CM, Reynolds BA, Weiss S, van Der Kooy D (1996) In vivo growth factor expansion of endogenous subependymal neural precursor cell populations in the adult mouse brain. J. Neurosc. 16, 2649. [DOI] [PMC free article] [PubMed] [Google Scholar]
- Fujimaki T (2005) Surgical treatment of brain metastasis. Int. J. Clin. Oncol. 10, 74. [DOI] [PubMed] [Google Scholar]
- Jessell TM, Lumsden A (1997) In: Cowan WM, Jessell TM, Zipursky SL, eds. Molecular and Cellular Approaches to Neural Development, p. 290 Oxford: Oxford University Press. [Google Scholar]
- Lessard J, Sauvageau G (2003) Bmi‐1 determines the proliferative capacity of normal and leukaemic stem cells. Nature 15, 255. [DOI] [PubMed] [Google Scholar]
- Molofsky A, Pardal R, Iwashita T, Park I‐K, Clarke MF, Morrison SJ (2003) Bmi‐1 dependence distinguishes neural stem cell self‐renewal from progenitor proliferation. Nature 425, 962. [DOI] [PMC free article] [PubMed] [Google Scholar]
- O'Neill A, Schaffer DV (2004) The biology and engineering of stem‐cell control. Biotechnol. Appl. Biochem. 40, 5. [DOI] [PubMed] [Google Scholar]
- Oliver TG, Wechsler‐Reya RJ (2004) Getting at the root and stem of brain tumor. Neuron 42, 885. [DOI] [PubMed] [Google Scholar]
- Pardal R, Clarke MF, Morrison SJ (2003) Applying the principle of stem cell biology to cancer. Nat. Rev. Cancer 3, 895. [DOI] [PubMed] [Google Scholar]
- Polakis P (2000) Wnt Signaling and cancer. Genes Dev. 14, 1837. [PubMed] [Google Scholar]
- Reya T, Morrison SJ, Clarke MF, Wisseman IL (2001) Stem cells, cancer, and cancer stem cells. Nature 414, 105. [DOI] [PubMed] [Google Scholar]
- Singh SK, Clarke ID, Terasaki M, Bonn VE, Hawkins C, Squire J, Dirks PB (2003) Identification of a cancer stem cell in human brain tumors. Cancer Res. 63, 5821. [PubMed] [Google Scholar]
- Singh SK, Hawkins C, Clarke ID, Squire JA, Bayani J, Hide T, Henkelman RM, Cusimano MD, Dirks PB (2004) Identification of human brain tumor initiating cells. Nature 432, 396. [DOI] [PubMed] [Google Scholar]
- Taipale J, Beachy PA (2001) The hedgehog and Wnt signaling pathways in cancer. Nature 411, 349. [DOI] [PubMed] [Google Scholar]
- Viswanathan S, Zandstra P (2003) Towards predictive models of stem cell fate. Cytotechnol. 41, 75. [DOI] [PMC free article] [PubMed] [Google Scholar]
- Wichmann H E, Loeffler M (1984) Mathematical Modeling of Cell Proliferation: Stem Cell Regulation in Hemopoiesis, Vol‐I. Boca Raton, FL: CRC Press. [Google Scholar]