

Abstract
Abstract. Objectives: More than 50 years ago, we learned that breast cancer cells (and those of many other types of tumour) endogenously synthesize 95% of fatty acids (FAs) de novo, despite having adequate nutritional lipid supply. Today, we know that breast cancer cells benefit from this phenomenon in terms of enhanced cell proliferation, survival, chemoresistance and metastasis. However, the exact role of the major lipogenic enzyme fatty acid synthase (FASN) as cause, correlate or facilitator of breast cancer remains unidentified. Materials and methods: To evaluate a causal effect of FASN‐catalysed endogenous FA biosynthesis in the natural history of breast cancer disease, HBL100 cells (an SV40‐transformed in vitro model for near‐normal gene expression in the breast epithelium), and MCF10A cells (a non‐transformed, near diploid, spontaneously immortalized human mammary epithelial cell line) were acutely forced to overexpress the human FASN gene. Results: Following transient transfection with plasmid pCMV6‐XL4 carrying full‐length human FASN cDNA (gi: NM 004104), HBL100 cells enhanced their endogenous lipid synthesis while acquiring canonical oncogenic properties such as increased size and number of colonies in semisolid (i.e. soft‐agar) anchorage‐independent cultures. Anchorage‐dependent cell proliferation assays in low serum (0.1% foetal bovine serum), MTT‐based assessment of cell metabolic status and cell death ELISA‐based detection of apoptosis‐induced DNA‐histone fragmentation, together revealed that sole activation of endogenous FA biosynthesis was sufficient to significantly enhance breast epithelial cell proliferation and survival. When analysing molecular mechanisms by which acute activation of de novo FA biosynthesis triggered a transformed phenotype, HBL100 cells, transiently transfected with pCMV6‐XL4/FASN, were found to exhibit a dramatic increase in the number of phosphor‐tyrosine (Tyr)‐containing proteins, as detected by 4G10 antiphosphor‐Tyr monoclonal antibody. Phosphor‐Tyr‐specific antibodies recognizing the phosphorylation status of either the 1173 Tyr residue of epidermal growth factor receptor (HER1) or the 1248 Tyr residue of HER2, further revealed that FASN‐induced Tyr‐phosphorylation at ∼180 kDa region mainly represented that of these key members of the HER (erbB) network, which remained switched‐off in mock‐transfected HBL100 cells. ELISA and immunoblotting procedures demonstrated that FASN overactivation significantly increased (> 200%) expression levels of epidermal growth factor receptor and HER2 proteins in HBL100 cells. Proteome Profiler™ antibody arrays capable of simultaneously detecting relative levels of phosphorylation of 42 phospho‐receptor Tyr‐kinases (RTKs) confirmed that acute activation of endogenous FA biosynthesis specifically promoted hyper‐Tyr‐phosphorylation of HER1 and HER2 in MCF10A cells. This FASN‐triggered HER1/HER2‐breast cancer‐like phenotype was specifically inhibitable either by FASN inhibitor C75 or by Tyr‐kinase inhibitors (TKIs) gefitinib (Iressa™) and lapatinib (Tykerb™) but not by chemotherapeutic agents such as cisplatin. Transient overexpression of FASN dramatically increased HBL100 breast epithelial cells’ sensitivity to cytotoxic effects of C75, gefitinib and lapatinib (∼8, 10 and > 15 times, respectively), while significantly decreasing (∼3 times) cisplatin efficacy. Conclusions: Although we cannot definitely establish FASN as a novel oncogene in breast cancer, this study reveals for the first time that exacerbated endogenous FA biosynthesis in non‐cancerous epithelial cells is sufficient to induce a cancer‐like phenotype functionally dependent on the HER1/HER2 duo. These findings may perhaps radically amend our current perspective of endogenously synthesized fat, as on its own, it appears to actively increase signal‐to‐noise ratio in the HER1/HER2‐driven progression of human breast epithelial cells towards malignancy.
INTRODUCTION
A limited set of phenotypes exit in virtually all aggressive cancers despite their major genotypic diversity. One of them has been recognized since the 1920s, with Otto Warburg's observation that cancer cells avidly consume glucose and produce lactic acid under aerobic conditions (Warburg & Posener 1924; Warburg 1956). Indeed, high levels of carbon fluxing through aerobic glycolysis (called the Warburg effect) have become a hallmark of the transformed phenotype and may provide cancer cells growth advantages in the tumour microenvironment (Garber 2004, 2006; Bui & Thompson 2006; Shaw 2006). A second hallmark, functionally related to the glycolytic pathway but commonly forgotten, is increased de novo fatty acid (FA) synthesis. FAs are obtained from the diet or can be synthesized directly from carbohydrate precursors. Most normal human tissues acquire the majority of required FAs from the circulation, and accordingly original lipogenesis and expression of lipogenic enzymes is extremely low (Weiss et al. 1986; Menendez & Lupu 2004; Menendez et al. 2005a). In striking contrast, and as first suggested more than half a century ago, breast cancer cells (and many other tumour cell types) synthesize 95% of their saturated and mono‐unsaturated FAs de novo, despite adequate nutritional lipid supply (Medes et al. 1953; Greenstein 1954; Ookhtens et al. 1984). This increased lipogenesis is reflected in significantly elevated expression and activity of numerous lipogenic enzymes (Swinnen et al. 2006).
Most attention in the past few years has been directed at fatty acid synthase (FASN), the main enzyme involved in FA synthesis, that catalyses NADPH‐dependent condensation of acetyl‐coenzyme A (CoA) and malonyl‐CoA, mainly to produce palmitate (Wakil 1989; Smith 1994; Maier et al. 2006). Up‐regulation of FASN gene expression is an early event in breast cancer development, being more pronounced in more advanced tumours, and correlating with poorer prognoses (Kuhajda et al. 1994; Kuhajda 2000, 2006). Studies with either chemical inhibitors of FASN activity or RNAi‐mediated down‐regulation of FASN gene expression have revealed that FASN blockade dramatically impacts on breast cancer cells as they cease proliferation and ultimately die mainly by an apoptotic process (Pizer et al. 1998; Menendez et al. 2004a, 2005b). On the basis of these findings, it has been proposed that breast cancer cells benefit from FASN hyperactivity in terms of enhanced cell proliferation, cell survival and metastasis, and increased resistance to chemo‐ and endocrine‐therapies (Lupu & Menendez 2006a, 2006b; Menendez & Lupu 2006). However, the exact role of exacerbated endogenous FA biogenesis as cause, correlate or facilitator of breast cancer remains largely unknown (Baron et al. 2004; 2004b, 2005c, 2005d). It is currently accepted that the same disturbances in signalling pathways responsible for oncogenic transformation also contribute to increased FASN‐driven lipogenesis in breast cancer cells. Thus, activation of FASN gene in breast carcinomas cells is commonly viewed as a mere (down‐stream) manifestation of early and common deregulation of (up‐stream) regulatory circuits (e.g. hormones/growth factors hormone receptors/growth factor receptors lipogenic transcription factors lipogenic genes) (Kuhajda 2006; Menendez & Lupu 2006; Swinnen et al. 2006).
We have recently demonstrated that pharmacological and RNAi‐mediated inhibition of FASN profoundly affects expression, activity and/or cellular localization of proteins closely related to breast malignant transformation and/or breast cancer progression, including Her‐2/neu (erbB‐2), HIF‐1α, vascular endothelial growth factor, oestrogen receptor, mitogen‐activated protein kinase, p53‐p21WAF1/CIP1, p27Kip1 and BRCA1 (Menendez & Lupu 2004, 2006; Menendez et al. 2004a,2004c, 2004d, 2005b, 2005e,f; Lupu & Menendez 2006a). These studies indirectly suggested that breast cancer‐associated FASN (also called oncogenic antigen‐519; OA‐519) is not only necessary to integrate a number of signalling pathways that regulate metabolism, proliferation and survival in breast cancer cells, but also it plays an active role in breast cancer evolution. Although forced overexpression and/or overactivation of FASN in normal breast epithelial cells (or in cells of transgenic animals) represents the sole valid approach to establish whether endogenous FA biogenesis is sufficient to promote transition from precursor lesions to invasive breast cancer phenotypes, no previous experimental studies have examined this possibility. In this first attempt to definitively establish a causal effect of de novo FA biosynthesis in the natural history of breast cancer disease, we acutely activated cell lipogenesis by transiently transfecting non‐cancerous HBL100 cells (an SV40‐transformed in vitro model for near‐normal gene expression in the breast epithelium (Gaffney 1982; Caron de Fromentel et al. 1985; Marlhens et al. 1988; Krief et al. 1989; Souttou et al. 1994; Hu et al. 2002) and MCF10A cells (non‐transformed, near diploid, spontaneously immortalized human mammary epithelial cell line; Ciardiello et al. 1992; Giunciuglio et al. 1995), with full‐length human FASN cDNA. Here, we present evidence that FASN‐catalysed endogenous FA biogenesis, on its own can trigger an invasive breast cancer‐like phenotype, functionally dependent on tyrosine kinase activity of HER1 (EGFR) and HER2, thus recapitulating a complex cross‐talk existing in many breast carcinomas with the worst prognosis. This study may open a completely new perspective on the role of de novo breast cell FA biogenesis as a previously unrecognized molecular driver of human breast epithelial cells’ progression towards malignancy.
MATERIALS AND METHODS
Reagents
C75 and cisplatin were purchased from Alexis Biochemicals (San Diego, CA, USA) and Sigma‐Chemicals (St. Louis, MO, USA), respectively. They were dissolved in dimethyl sulfoxide (DMSO) and were stored in the dark as stock solutions (25 mg/mL and 10 mm, respectively) at –20 °C until use. Gefitinib (ZD1839; Iressa®) was kindly provided by AstraZeneca (AstraZeneca PLC Headquarters, 15 Stanhope Gate, W1K 1LN, London, UK). Lapatinib (GW572016; Tykerb®) was kindly provided by GlaxoSmithKline (GSK), Corporate Environment, Health & Safety (Brentford, Middlesex TW8 9GS, UK). Iressa® and Tykerb® were dissolved in DMSO and were stored in the dark as stock solutions (10 mm) at –20 °C until utilization. For experimental use, C75, gefitinib, lapatinib and cisplatin were prepared fresh from stock solutions and were diluted with cell growth medium. Control cells were cultured in media containing identical concentrations (v/v) as the test cells. Vehicle solutions had no noticeable influence on the proliferation of experimental cells.
Cell culture
HBL100 (breast epithelial), NIH‐3T3 (mouse fibroblast), MCF10A (normal breast epithelial), MCF10AT (premalignant breast epithelial) and MCF10CA1 (malignant breast epithelial) cell lines were kindly provided by Dr. Santiago Ropero (Epigenetics Laboratory, Spanish National Cancer Centre, Madrid, Spain). HBL100 and NIH‐3T3 cells were grown in Dulbecco's modified Eagle's medium (DMEM) (Gibco® Cell Culture Systems, Invitrogen Corporation, Paisley, UK) containing 10% heat‐inactivated foetal bovine serum (FBS), 1%l‐glutamine, 1% sodium pyruvate, 50 U/mL penicillin, and 50 µg/mL streptomycin. MCF10A and MCF10AT cells were cultured in DMEM: Ham's F‐12 supplemented with 5% horse serum, 10 mm HEPES buffer, 10 ng/mL insulin, 20 ng/mL EGF, 100 ng/mL cholera toxin, and 0.5 mg/mL hydrocortisone. MCF10CA1 cells were cultured in DMEM: Ham's F‐12 with 5% horse serum. Cells were fed twice a week and were passaged on a weekly basis. They were maintained at 37 °C in a humidified atmosphere of 95% air and 5% CO2. Cells were screened periodically for Mycoplasma contamination.
Transfection procedures
pCMV6‐XL4 empty plasmid vector (OriGene Technologies, Rockville, MD, USA) and pCMV6‐XL4 carrying the full‐length human FASN cDNA (gi: NM 004104) were purified using Marligen High Purity Plasmid‐Prep Systems (Invitrogen, Carlsbad, CA, USA). For transient transfection, cells were seeded onto 60‐mm or 100‐mm plates and cultured in culture medium supplemented with 10% FBS until they reached ∼60–70% confluence. The cells were washed twice with serum‐free DMEM, and incubated overnight in serum‐free DMEM. Cells were then transfected in low‐serum (0.1% FBS) medium with 2.5 and 5 µg of total plasmid DNA per plate, using FuGENE 6 as per manufacturer's instructions (Roche Diagnostics, Indianapolis, IN, USA). At 24 and/or 48 h after transfection, the cells were used as specified (Fig. 1). For all transfection experiments, HBL100 cells were used between passages 5 and 10.
Figure 1.
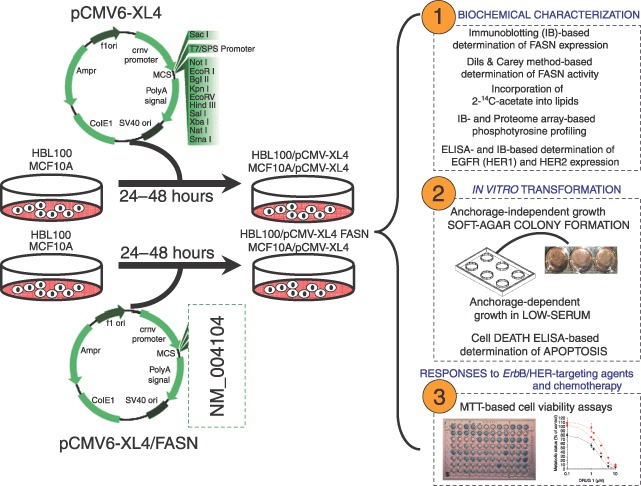
Development of noncancerous breast epithelial cells acutely overexpressing FASN. Normal breast epithelial cells were acutely forced to activate FASN‐driven endogenous lipogenesis upon transient transfection with the plasmid pCMV6‐XL4 carrying the full‐length human FASN cDNA (gi: NM 004104). FASN expression was characterized by immunoblotting procedures and FASN enzymatic activity was evaluated by recording spectrophotometrically the linear increase in NADPH oxidation following the addition of the FASN substrate malonyl‐CoA (the method by Dils & Carey). Lipogenic activity was assessed by measuring incorporation of 2‐14C‐acetate into lipids. Changes in the cellular pattern of tyrosine (Tyr) phosphorylation were detected either by immunoblotting procedures using the 4G10 antiphosphor‐Tyr monoclonal antibody or by antibody arrays‐based Proteome Profiling of Human Phospho‐RTKs. The expression level and the activation status of EGFR (HER1) and HER2 (erbB‐2) receptors was assessed by ELISA and immunoblotting procedures, respectively. Semiliquid colony formation (i.e. soft agar), anchorage‐dependent cell growth in low serum, MTT and cell death ELISA assays were used to evaluate the effects of FASN overexpression on cell proliferation and survival.
Determination of FASN enzymatic activity
At 48 h following transfection of HBL100 cells with pCMV6‐XL4 and pCMV6‐XL4/FASN plasmids, cells were lysed in lysis buffer (1 mm EDTA, 150 mm NaCl, 100 µg/mL PMSF and 50 mm Tris‐HCl, pH 7.5) and after thorough mixing on the vortex, the suspension was sonicated and then a particle‐free supernatant solution was obtained by centrifugation at 14 000 g for 15 min. FASN activity was assayed in particle‐free supernatants by recording spectrophotometrically at 25 °C the decrease of A340 nm due to oxidation of NADPH essentially as described by Dils & Carey (1975). Ninety‐six micrograms of particle‐free supernatant, 200 mm potassium phosphate buffer pH 6.6, 1 mm dithiothreitol, 1 mm EDTA, 0.24 mm NADPH and 30 µm acetyl‐CoA in 0.2 mL reaction volume were monitored at 340 nm for 3 min to measure background NADPH oxidation. After the addition of 50 µm of malonyl‐CoA, the reaction was assayed for an additional 10 min to determine FASN‐dependent oxidation of NADPH. Preliminary experiments determined the linear response range for the assay: the rate of NADPH oxidation was linear for at least 20 min of incubation following the addition of malonyl‐CoA when increasing concentrations of cellular proteins (2–120 µg) were tested. Rates were corrected for the background rate of NADPH oxidation in the presence of acetyl‐CoA. FASN activity was expressed in nmoles NADPH oxidized min/mg protein. FASN activities from particle‐free supernatants of cerulenin‐treated cells were compared to those from mock cells, which consisted of cells transiently transfected with the empty vector.
Lipid synthesis
2‐14C‐labelled acetate (57 mCi/mmol; 2 µCi/dish; Amersham International, Aylesbury, UK) was added to the culture medium of cells growing in 60‐mm dishes. After 4 h incubation at 37 °C, cells were washed with phosphate‐buffered saline (PBS) and trypsinized. Cells were pelleted by centrifugation and re‐suspended in 0.8 mL PBS. Lipids were extracted using the method of Bligh & Dyer (1959) and incorporation of 2‐14C‐acetate into lipids was measured by scintillation counting. The results were normalized for sample protein content to avoid effects caused by differences in cell mass.
Transformation (soft agar colony formation) assays
The efficiency of colony formation in semiliquid culture was determined by monitoring anchorage‐independent cell growth in soft agar experiments. Briefly, a bottom layer of 1 mL 2X complete DMEM medium containing 0.7% agar and 10% FBS was prepared in 35 mm multiwell cluster dishes. After the bottom layers solidified pCMV6‐XL4‐ and pCMV6‐XL4/FASN‐transfected HBL100 cells (10 000/dish) were added in a 1‐mL top layer of 2X complete DMEM medium containing 0.35% agar and 10% FBS. All samples were prepared in triplicate. Dishes were incubated in a humidified 5% CO2 incubator at 37 °C, and colonies measuring ≥ 50 µm were counted after ∼14 days after staining with nitroblue tetrazolium (Sigma‐Chemicals) using a cell colony counter (Ommias 3600, Imaging Products International Inc., Charley, VA, USA).
Cell proliferation
HBL100 and MCF10A cells transiently transfected (24 h) with either the pCMV6‐XL4 empty plasmid vector or with the pCMV6‐XL4 carrying the full‐length human FASN cDNA were trypsinized and re‐plated into 24‐well plates at a density of 10 000 cells per well. Cells were incubated for 24 h to allow for attachment, after which a zero time point was determined. Cells were then incubated in low‐serum condition (DMEM; 0.1% FBS) in the absence or presence of 10 µg/mL C75. Cell numbers were determined at days 0, 1, 2, 3, 4 and 5 using a trypan blue‐exclusion cell assay. All assays were performed at least three times in triplicate. The data are presented as mean of number cells × 104/well ± SD.
Apoptosis
The induction of apoptosis was assessed using the Cell Death Detection ELISAPLUS kit obtained from Roche Diagnostics (Barcelona, Spain). This kit uses a photometric enzyme immunoassay that quantitatively determines the formation of cytoplasmic histone‐associated DNA fragments (mono‐ and oligo‐nucleosomes) after apoptotic cell death. For determination of apoptosis by ELISA, pCMV6‐XL4‐ and pCMV6‐XL4/FASN‐transfected HBL100 cells were treated with C75 for 48 h in 96‐well plates. The induction of apoptosis was evaluated using cytosolic fractions obtained from pooled adherent and floating cells by assessing the enrichment of nucleosomes in the cytoplasm (by using antihistone biotin and anti‐DNA peroxidase antibodies). Briefly, the 96‐well plates were centrifuged (200 g) for 10 min. The supernatant was discharged, lysis buffer was added, and samples were incubated at room temperature for 30 min as described in the manufacturer's protocol. Antihistone biotin and anti‐DNA peroxidase antibodies were added to each well and incubated at room temperature for 2 h. After three washes, the peroxidase substrate was added to each well, and the plates were read at 405 nm at multiple time intervals. The enrichment of histone‐DNA fragments in treated cells was expressed as fold increase in absorbance as compared to control (vehicle‐treated) cells.
HER2‐ and EGFR‐specific enzyme‐linked immunosorbent assays
Quantitative determination of EGFR and HER2 protein content was performed with commercially available quantitative ELISAs (Oncogene Science, Bayer Diagnostics, Cambridge, MA, USA) according to the manufacturer's protocol. Following transfection, cells were washed twice with cold PBS and then lysed in buffer (20 mm Tris pH 7.5, 150 mm NaCl, 1 mm EDTA, 1 mm EGTA, 1% Triton X‐100, 2.5 mm sodium pyrophosphate, 1 mmβ‐glycerolphosphate, 1 mm Na3VO4, 1 µg/mL leupeptin, 1 mm phenylmethylsulfonyl fluoride) for 30 min on ice. The lysates were cleared by centrifugation in an eppendorf tube (15 min at 14 000 g, 4 °C). Protein content was determined against a standardized control using the Pierce protein assay kit (Rockford, IL, USA). 1 : 50, 1 : 500; 1 : 5000 and 1 : 10 000 dilutions of total cell lysates were used to quantify EGFR and HER2 protein expression in cell cultures. A standard curve was generated by using standard solutions as per manufacturer's instructions. The concentrations of EGFR and HER2 in test samples (in nanograms of EGFR and HER2 per milligram of total protein) were determined by interpolation of the sample absorbances from the standard curve. Each experiment was performed in duplicate wells.
Immunoblotting analyses
For assaying levels of FASN, Phosphor‐tyrosine (Tyr)‐protein, HER2, Phosphor‐HER2, HER1 and Phosphor‐HER1, cells were washed with cold PBS, placed on ice and lysed in a non‐denaturing 1X lysis buffer (Cell Signalling, Beverly, MA, USA) containing 20 mm Tris‐HCl, 150 mm NaCl, 1 mm EDTA, 1 mm EGTA, 1% Triton X‐100, 2.5 mm sodium pyrophosphate, 1 mmβ‐glycerophosphate, 1 mm Na3VO4, 1 µg/mL leupeptin and 1 mm phenylmethylsulfonyl fluoride. Cells were scraped, added to eppendorf tubes and incubated on ice for 20 min before debris were removed by a 15‐min spin at 14 000 r.p.m. at 4 °C. A bicinchoninic acid protein reagent kit (Pierce, Rockford, IL, USA) was used to determine levels of total protein. Equal amounts of protein were heated in sodium dodecyl sulfate sample buffer (Laemmli) for 10 min at 70 °C, subjected to electrophoresis on 3–8% Tris‐Acetate NuPAGE and transferred to nitrocellulose membranes. Non‐specific binding on the nitrocellulose filter paper was minimized by blocking for 1 h at room temperature with TBS‐T [25 mm Tris‐HCl, 150 mm NaCl (pH 7.5), and 0.05% Tween 20] containing 5% (w/v) non‐fat dry milk. The treated filters were washed in TBS‐T and then incubated with primary antibodies for 2 h at room temperature in TBS‐T containing 1% (w/v) non‐fat dry milk. The membranes were washed in TBS‐T, horseradish peroxidase‐conjugated secondary antibodies in TBS‐T were added for 1 h, and immunoreactive bands were visualized with electrochemiluminescent detection reagent (Pierce, Rockford, IL, USA). Blots were re‐probed with an antibody for β‐actin to control for protein loading and transfer. Densitometric values of protein bands were quantified using Scion imaging software (Scion Corporation, Frederick, MD, USA).
The following primary antibodies were used at the concentrations indicated: FASN (clone 23, BD Biosciences Pharmingen, San Diego, CA, USA; 1 µg/mL), Phosphor‐Tyr (4G10; Upstate USA, Chicago, IL, USA; 2 µg/mL), HER2 (Ab‐3; Oncogene Research Products, Cambridge, MA, USA; 2.5 µg/mL), Phosphor‐HER2 (Ab‐18, clone PN2A; NeoMarkers, Fremont, CA, USA; 2.5 µg/mL), EGFR (Upstate USA; 1 µg/mL), Phosphor‐EGFR (Upstate USA; 1 µg/mL). To verify equivalent protein loadings, β‐actin (Sigma‐Chemicals) was included at a concentration of 0.2 µg/mL. Horseradish peroxidase‐conjugated antirabbit or antimouse secondary antibodies (Oncogene Research Products; San Diego, CA, USA) were used at a concentration of 1 : 10 000.
Phosphor‐proteome profiling
Cells were rinsed with cold PBS and immediately solubilized in NP‐40 lysis buffer [1% NP‐40, 20 mm Tris‐HCl (pH 8.0), 137 mm NaCl, 10% glycerol, 2 mm EDTA, 1 mm sodium orthovanadate, 10 µg/mL aprotinin, 10 µg/mL leupeptin] by rocking the lysates gently at 4 °C for 30 min. Following microcentrifugation at 14 000 g for 5 min, supernatants were transferred into a clean test tube and sample protein concentrations were determined using the Pierce Protein assay kit. Five hundred mircograms of lysates were diluted and incubated with the Human Phospho‐RTK Array Kit (Proteome Profiler™; R&D Systems, Minneapolis, MN, USA) as per manufacturer's instructions. Phospho‐RTK array data were developed on X‐ray films following exposure to chemiluminescent reagents.
Cell sensitivity to antibreast cancer treatments
The effects of transient FASN overexpression/hyperactivation on breast cancer cell viability were determined using a standard colorimetric MTT [3‐(4,5‐dimethylthiazol‐2‐yl)‐2,5‐diphenyl tetrazolium bromide) reduction assay. Briefly, at 24 h after transfection, the cells were harvested by trypsinization and seeded at a concentration of ∼2.5 × 10³ cells/200 µL/well into 96‐well plates, and allowed an overnight period for attachment. Then, the medium was removed and fresh medium along with various concentrations of C75, gefitinib, lapatinib and cisplatin, as specified, were added to cultures in parallel. Control cells without agents were cultured using the same conditions with comparable media changes. Compounds were not renewed during the entire period of cell exposure. Following treatment (5 days), the medium was removed and replaced by fresh drug‐free medium (100 µL/well), and MTT (5 mg/mL in PBS) was added to each well at a 1/10 volume. After incubation for 2–3 h at 37 °C, the supernatants were carefully aspirated, 100 µL of DMSO were added to each well, and the plates agitated to dissolve the crystal product. Absorbances were measured at 570 nm using a multiwell plate reader (Model Anthos Labtec 2010 1.7 reader). The cell viability effects from exposure of cells to each compound were analysed as percentages of the control cell absorbances, which were obtained from control wells treated with appropriate concentrations of the compounds vehicles that were processed simultaneously. For each treatment, cell viability was evaluated as a percentage using the following equation: (A570 of treated sample/A570 of untreated sample) × 100.
Cell sensitivity to gefitinib, lapatinib and cisplatin was expressed in terms of the concentration of drug required to decrease by 50% cell viability (IC50). Because the percentage of control absorbance was considered to be the surviving fraction of cells, the IC50 values were defined as the concentration of gefitinib, lapatinib and cisplatin that produced 50% reduction in control absorbance (by interpolation).
Statistics
Two‐group comparisons were performed by the Student's t‐test for paired and unpaired values. Comparisons of means of ≥ 3 groups were performed by anova, and the existence of individual differences, in case of significant F‐values at anova, tested by Scheffé's multiple contrasts.
RESULTS
Transient transfection with the plasmid pCMV6‐XL4 carrying the full‐length human FASN cDNA enhances FASN protein expression and de novo FA synthesis in HBL100 breast epithelial cells. To evaluate a causal effect of de novo fatty acid biosynthesis in the natural history of breast cancer disease, we took advantage of the HBL100 cell line. HBL100 cells were originally derived from the milk secretion of a nursing mother without breast lesion, and they have widely been used as a near‐normal in vitro model for gene expression in the breast. Although immortalized due to the presence of simian virus 40 (SV40) large T‐antigen, which is defective in a function(s) essential to the replication of the viral DNA, human breast myoepithelial HBL100 cells exhibit some characteristics of transformation including an aneuploid chromosome complement and continuous growth (Gaffney 1982; Caron de Fromentel et al. 1985; Marlhens et al. 1988; Krief et al. 1989; Souttou et al. 1994; Hu et al. 2002). Interestingly, HBL100 cells evolve during in vitro maintenance, acquiring the capacity to invade normal tissues and to replace them by proliferation in vitro only at high passage levels until becoming tumourigenic in nude mice. They, therefore, represent a useful model for studying the progression of human breast epithelial cells towards malignancy. Importantly for this study, HBL100 cells naturally express extremely low levels of FASN (Fig. 2a).
Figure 2.
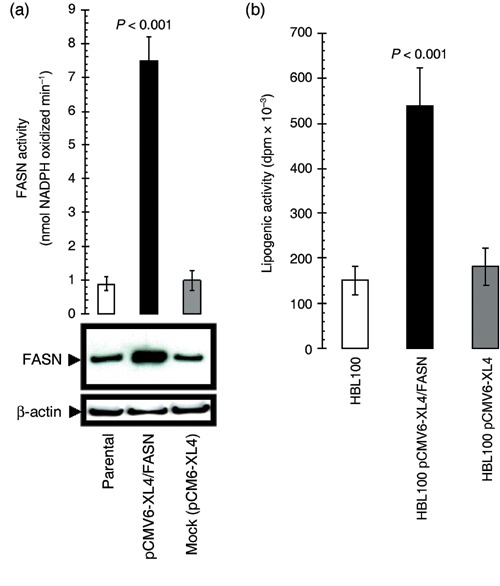
Acute activation of FASN‐catalysed endogenous FA biogenesis promotes the appearance of oncogenic canonical properties in breast epithelial cells. (a) Top. FASN‐specific activity was assayed spectrophotometrically in fresh 14 000 g supernatants from pCMV6‐XL4/FASN‐transfected, pCMV6‐XL4 (mock)‐transfected and parental (non‐transfected) HBL100 cells by measuring the rate of disappearance of NADPH at 340 nm. Results are means (columns) and 95% confidence intervals (bars) of three independent experiments made in triplicate. One‐factor anova was used to analyse differences FASN activity between each experimental condition (P < 0.001 for transfection with pCMV6‐XL4/FASN cells versus all other conditions; one‐factor analysis of variance). All statistical tests were two‐sided. Bottom. Five micrograms of total protein from cultures of HBL100 cells engineered to transiently express either the pCMV6‐XL4 plasmid vector carrying the full‐length human FASN cDNA (pCMV6‐XL4/FASN) or the empty vector pCMV6‐XL4 were resolved by 3–8% Tris‐Acetate NuPAGE and subjected to immunoblotting analyses for FASN using an anti‐FASN monoclonal antibody (clone 23) as described in ‘Materials and methods’. Blots were re‐probed for β‐actin expression to control for protein loading and transfer. Figure shows a representative immunoblotting analysis. Equivalent results were obtained in three independent experiments. (b) HBL100 cells grown in 60‐mm plates were transfected either with the pCMV6‐XL4 plasmid vector carrying the full‐length human FASN cDNA (pCMV6‐XL4/FASN) or the empty vector pCMV6‐XL4. Two days later, medium was changes, and fresh medium was added together with [2‐14C] acetate (57 mCi/mmol; 2 µCi/dish) and incubation was continued for another 4 h. Cells were washed with PBS and trypsinized. Lipids were extracted as described in ‘Materials and methods’, and the radioactivity of aliquots was measured by scintillation counting. Results shown represent mean d.p.m. × 10−3 (columns) and 95% confidence intervals (bars) of incubations performed in triplicate following normalization by protein content in cell lysates. One‐factor anova was used to analyse differences in the lipogenic activity between each experimental condition (P < 0.001 for HBL100‐pCMV6‐XL4/FASN cells versus HBL100‐pCMV6‐XL4 matched control cells; one‐factor analysis of variance).
Because neoplastic development is commonly associated with altered expression of oncogenes and/or tumour suppressor genes, we here hypothesized that, if indeed oncogenic, the sole up‐regulation of FASN gene expression should trigger a breast cancer‐like phenotype in low (non‐tumourigenic) passage levels (< 12) of HBL100 cells. HBL100 cells were transiently transfected (up to 48 h) with the plasmid pCMV6‐XL4 carrying the full‐length human FASN cDNA (gi: NM 004104) (Fig. 1). This library plasmid contains the SV40 origin of replication for propagation in mammalian cells. The plasmid also contains the cytomegalovirus promoter, which will drive expression of the insert if it contains a translational start site. The human growth hormone polyadenylation signal is finally present to effect proper transcriptional termination. Upon this approach, immunoblotting procedures using an anti‐FASN monoclonal antibody revealed a ∼5‐fold up‐regulation of FASN protein expression over that endogenously expressed by parental and mock (empty vector)‐transfected HBL100 cells (Fig. 2a, bottom panel). FASN‐associated lipogenic activity, which was measured by recording spectrophotometrically the linear increase in NADPH oxidation following the addition of the FASN substrate malonyl‐CoA, was increased by ∼8 times when compared to basal FASN activity in parental and mock‐transfected HBL100 cells (Fig. 2a, top panel). To further corroborate these findings, mock‐ and pCMV6‐XL4/FASN‐transfected HBL100 cells were exposed to 2‐14C‐labelled acetate, allowing the measurement of the effects of acute FASN overexpression on lipid synthesis in live cells. After 4 h, cellular lipids were extracted, and acetate incorporation was quantified by scintillation counting. HBL100 cells transiently transfected with plasmid pCMV6‐XL4/FASN increased the incorporation of 2–14C‐labelled acetate by ~3.5‐fold when compared to control levels found in parental HBL100 cells (Fig. 2b). Transient transfection with the empty vector pCMV6‐XL4 did not modify lipid synthesis in HBL100 cells.
Acute overexpression of FASN enhances anchorage‐independent growth of breast epithelial cells. A striking picture emerged when we examined the effects of exacerbated FASN‐driven endogenous lipogenesis on the efficiency of HBL100 cells to grow under anchorage‐independent conditions (i.e. to form colonies in soft agar), a cellular phenotype representing an in vitro transformation phenotype that highly correlates with in vivo tumourigenicity. HBL100 cells forced to transiently overexpress FASN for 48 h significantly increased, when monitored 10 days later, both the size and the number of colonies in semisolid cultures (∼200 colonies; 50 µm > ∅ > 100 µm) when compared to parental and mock‐transiently transfected cells (∼75 colonies; 25 µm > ∅ > 100 µm) (Fig. 2c). Malignant conversion of HBL100 cells at high passage level (> 50), which was evidenced in our experiments by enhanced growth in soft agar (data not shown), was likewise accompanied by a significant increase in both the endogenous level of FASN expression and the lipid synthesis in live HBL100 cells (Fig. 2d).
Figure 2.
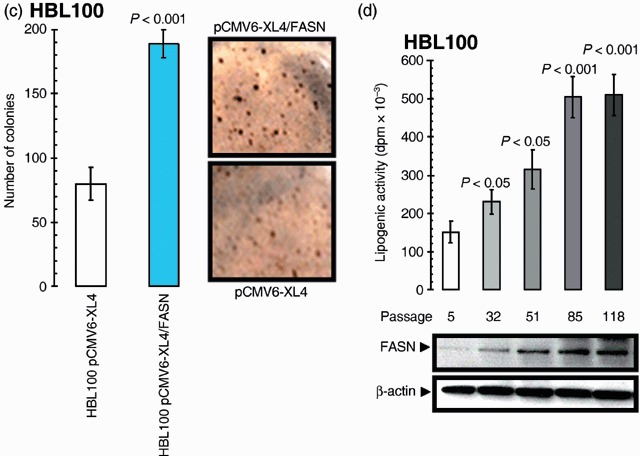
. (c) HBL100 cells engineered to transiently express either the pCMV6‐XL4 plasmid vector carrying the full‐length human FASN cDNA (pCMV6‐XL4/FASN) or the empty vector pCMV6‐XL4 were seeded (10 000 per well) in six‐well plates in culture medium containing 0.35% low‐melting agarose over a 0.7% agarose base layer and incubated for 10 days. Colonies were then stained with p‐iodonitrotetrazolium violet (1 mg/mL stock diluted at 1 : 500) for 18 h, and colonies larger than 50 µm in diameter were counted. Each experimental value on the graph (right panel) represents the mean colony number (columns) and 95% confidence intervals (bars) from three separate experiments in which triplicate dishes were counted. One‐factor anova was used to analyse differences in the number of colonies between each experimental condition (P < 0.001 for HBL100‐pCMV6‐XL4/FASN cells versus HBL100‐pCMV6‐XL4 matched control cells; one‐factor analysis of variance). Representative microphotographs of soft agar assays are shown (200‐fold magnification). (d) Top. Following 4 h incubation with [2‐14C] acetate (57 mCi/mmol; 2 µCi/dish), lipids from cultures of HBL100 cells at different passage levels were extracted as described in ‘Materials and methods’, and the radioactivity of aliquots was measured by scintillation counting. Results shown represent mean d.p.m. × 10–3 (columns) and 95% confidence intervals (bars) of incubations performed in triplicate following normalization by protein content in cell lysates. One‐factor anova was used to analyse differences in the lipogenic activity between high passage level (HPL) and the low passage level (LPL) control group. Bottom. Five micrograms of total protein from HBL100 cultures were resolved by 3–8% Tris‐Acetate NuPAGE and subjected to immunoblotting analyses for FASN using an anti‐FASN monoclonal antibody (clone 23) as described in ‘Materials and methods’. Blots were re‐probed for β‐actin expression to control for protein loading and transfer. Figure shows a representative immunoblotting analysis. Equivalent results were obtained in three independent experiments.
To assess whether FASN‐related growth advantage in semisolid conditions took place through either an induction of the proliferative potential and/or an enhancement of the anti‐apoptotic phenotype of HBL100 cells, we first investigated the effect of FASN overexpression on cell proliferation and cell survival in low‐serum (i.e. 0.1% FBS) conditions. After 0, 24, 48, 72 or 96 h of transfection either with the plasmid pCMV6‐XL4 carrying the full‐length human FASN cDNA or with the empty vector pCMV6‐XL4, cells were collected, and cell growth and viability were determined using a trypan blue dye exclusion assay. Of note, the proliferative rate was significantly higher in HBL100 cells acutely engineered to overexpress FASN than in mock‐transfected and parental HBL100 cells (Fig. 2e). We further characterized these effects in the classic NIH‐3T3 transformation model. The NIH‐3T3 cell model suffers from the fact that these cells are pre‐neoplastic and are differentially sensitive to transformation by different oncogenes. Interestingly, NIH‐3T3 murine fibroblasts transiently engineered to overexpress human FASN exhibited an enhanced proliferative rate despite the presence of FBS‐containing free FAs in culture (Fig. 2f). Bromodeoxyuridine incorporation experiments confirmed that FASN overexpression significantly increased proliferation of HBL100 and NIH‐3T3 cells (data not shown).
Figure 2.
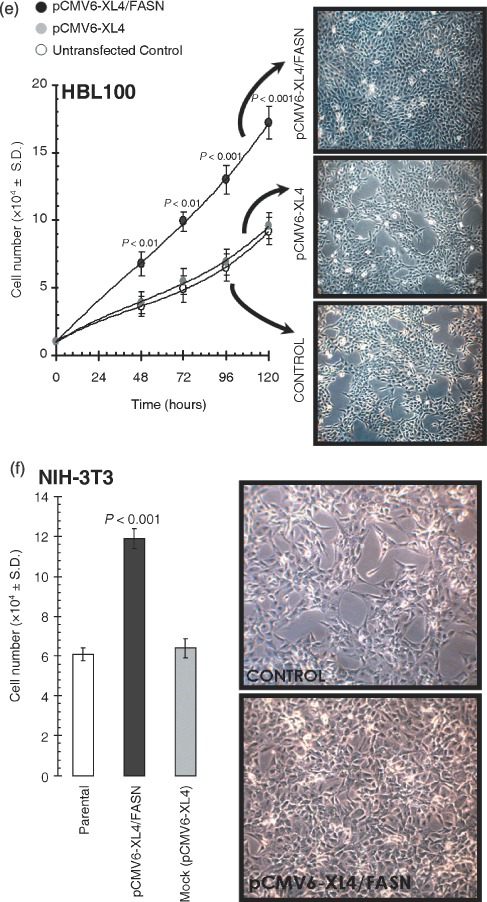
. (e) Left. HBL100 cells engineered to transiently express either the pCMV6‐XL4 plasmid vector carrying the full‐length human FASN cDNA (pCMV6‐XL4/FASN) or the empty vector pCMV6‐XL4 were seeded (10 000 per well) in 24‐well plates. Cells were plated in the presence of 10% FBS, changed to serum‐free conditions overnight, and processed further in culture medium supplemented with 0.1% FBS. For each experimental condition and time point cell numbers were determined using a trypan blue exclusion assay as described in ‘Materials and methods’. The data presented are mean of cell numbers × 104 (circles) and 95% confidence intervals (bars) from three separate experiments in which triplicate wells were counted. All assays were performed at least three times in triplicate. One‐factor anova was used to analyse differences in the number of cells between each experimental condition (P < 0.01, 48 and 72 h; and P < 0.001, 96 and 120 h for transfection with pCMV6‐XL4/FASN cells versus all other conditions; one‐factor analysis of variance). All statistical tests were two‐sided. Right. Representative microphotographs of anchorage‐dependent HBL100 cultures (at day 4 after transfection) are shown. (f) Left. NIH‐3T3 cells engineered to transiently express either the pCMV6‐XL4 plasmid vector carrying the full‐length human FASN cDNA (pCMV6‐XL4/FASN) or the empty vector pCMV6‐XL4 were seeded (10 000 per well) in 24‐well plates. Cells were plated and processed further in culture medium supplemented with 10% FBS. For each experimental condition, cell numbers were determined using a trypan blue exclusion assay as described in ‘Materials and methods’. The data presented are mean of cell numbers × 104 (circles) and 95% confidence intervals (bars) from three separate experiments in which triplicate wells were counted at day 4 after transfection. All assays were performed at least three times in triplicate. One‐factor anova was used to analyse differences in the number of cells between each experimental condition (P < 0.001 for transfection with pCMV6‐XL4/FASN cells versus all other conditions; one‐factor analysis of variance). All statistical tests were two‐sided. Right. Representative microphotographs of anchorage‐dependent NIH‐3T3 cultures (at day 4 after transfection) are shown.
To evaluate a role of the lipogenic activity of FASN in the enhanced transforming ability of breast epithelial cells, parallel cell viability experiments were carried out in the presence of C75 [trans‐4‐carboxy‐5‐octyl‐3‐methylenebutyrolactone], a slow‐binding inhibitor of FASN activity (Kuhajda et al. 2000; Pizer et al. 2000; Zhou et al. 2003; Alli et al. 2005; Lupu & Menendez 2006b). C75 treatment completely suppressed FASN‐responsive signalling sustaining growth of HBL100 cells both in soft agar and in low‐serum conditions. In contrast, C75‐induced inhibition of FASN activity did not affect proliferation or viability of mock‐transfected and parental HBL100 cells (data not shown). Moreover, when the cell metabolic status was judged by the mitochondrial conversion of the tetrazolium salt MTT to its formazan product (MTT assay), we found that cell viabilities of HBL100 cells transiently transfected with pCMV6‐XL4/FASN were drastically reduced by > 80% following 4‐day treatment with C75 (Fig. 3a). Conversely, HBL100 cells transiently transfected with no insert (mock transfection) showed no significant changes following pharmacological blockade of endogenous FASN activity (∼10% reduction in cell viability). We finally evaluated whether this exacerbated sensitivity to the FASN blocker C75 was not simply the result of changes in FASN‐enhanced cell proliferation, but might actually be due to changes in FASN‐decreased apoptotic cell death. To address this question, pCMV6‐XL4‐ and pCMV6‐XL4/FASN‐transfected HBL100 cells were exposed to increasing concentrations of the FASN blocker C75, apoptotic cell death was measured by a cell death ELISA specifically detecting apoptosis‐induced DNA‐histone fragmentation, and the x‐fold increase in apoptosis was calculated by comparing the ELISA optical density readings of treated samples, with the values of untreated cells as 1.0 (Fig. 3b). Whereas parental and mock‐transfected HBL100 cells exhibited extremely low levels of apoptosis upon treatment with C75 (1.7‐fold increase versus 1.0‐fold in untreated HBL100 cells), HBL100 cells engineered to overexpress FASN were exquisitely sensitive to the pro‐apoptotic effects of C75 (up to 8.1‐fold increase versus 1.0‐fold in untreated HBL100/pCMV6‐XL4/FASN cells).
Figure 3.
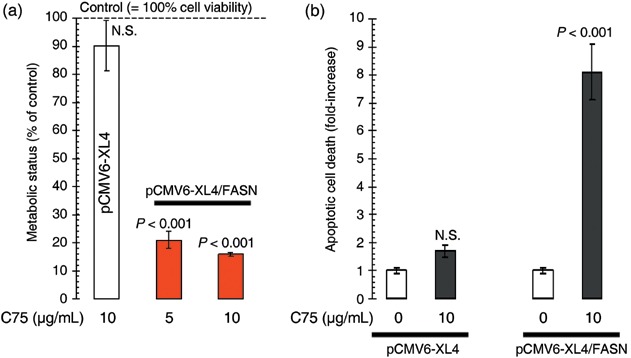
Acute activation of FASN‐catalysed endogenous FA biogenesis enhances breast epithelial cell viability and survival. (a) HBL100 cells transiently transfected with pCMV6‐XL4/FASN or the empty vector pCMV6‐XL4 for 48 h were incubated in the absence or presence of the specified concentrations of the FASN inhibitor C75 for 5 days. Cell growth, measured using MTT assay, was expressed as percentage of untreated cells (100% cell viability). Results are means (columns) and 95% confidence intervals (bars) of three independent experiments made in triplicate. One‐factor anova was used to analyse differences in the levels of sensitivity to C75 by comparing MTT‐based determination of optical densities at 570 nm in C75‐treated and control‐untreated groups; NS, not statistically significant, one‐factor analysis of variance). All statistical tests were two‐sided. (b) Quantification of apoptosis‐related cell death upon treatment with the FASN inhibitor C75 was determined by cell death ELISA, which measures cytoplasmic histone‐DNA fragments produced during apoptosis. The enrichment of histone‐DNA fragments in treated cells was expressed as fold increase in absorbance by comparing with control (vehicle‐treated) cells using the following formula: [A405–A490]TREATED/[A405–A490]UNTREATED. Data are the mean (columns) and 95% confidence intervals (bars) of three independent experiments performed in duplicate. One‐factor anova was used to analyse differences in the percentage of apoptosis between the C75 treatment group and the control‐untreated group. NS, not statistically significant (one‐factor analysis of variance). All statistical tests were two‐sided.
Acute overexpression of FASN enhances the tyrosine‐kinase activity of HER1 (EGFR) and HER2 in breast epithelial cells. What is the ultimate mechanism(s) by which acute activation of FASN drives the acquired transformed phenotype of HBL100 cells? Growth in soft agar is a canonical oncogenic property that simultaneously reflects anchorage‐independent proliferation and cell survival. Therefore, we speculated that the proliferative and anti‐apoptotic phenotype induced by FASN overexpression should be due to changes in the activity and/or expression of key ‘master‐proteins’ regulating breast cancer cell proliferation and apoptosis. Because the process of malignant transformation in many cancers may depend on the abnormal activation of ligands, receptors and signal transduction cascades that function as part of the HER‐(Tyr‐kinase) axis (Olayioye 2001; Yarden & Sliwkowski 2001; Gross et al. 2004; Marmor et al. 2004; Citri & Yarden 2006), we monitored changes in the cellular pattern of Tyr‐phosphorylation upon transient transfection with human FASN cDNA in HBL100 cultures at similar densities. Remarkably, a dramatic hyperactivation of several phosphotyrosine‐Tyr‐containing proteins – as evidenced by the pattern of Tyr‐phosphorylated bands detected by the 4G10 antiphosphotyrosine‐Tyr monoclonal antibody – was detected in cell lysates from HBL100 cells acutely overexpressing FASN for 24 and 48 h (Fig. 4a). Moreover, when Tyr‐phosphorylation at the ∼180 kDa region was further evaluated using a phosphor‐specific monoclonal antibody that specifically recognizes one of the Tyr‐phosphorylated forms of HER2, the acute activation of FASN‐driven endogenous lipogenesis was found to notably activate the 1248 Tyr residue of HER2 (erbB2), which constitutes its main autophosphorylation site. Furthermore, a prominent hyperactivation of HER1 (EGFR) was detected in FASN‐overexpressing HBL100 cells when using a phosphor‐specific antibody that specifically recognizes the phosphorylation status of the 1173 Tyr residue of HER1 (Fig. 4a). These effects were not due post‐transfection artifacts, as parallel experiments with the pCMV6‐XL4 empty vector did not significantly modify the Tyr‐phosphorylation pattern of HB100 cell lysates (Fig. 4b). Moreover, when HBL100 cells were forced to overexpress FASN gene in the presence of the chemical FASN inhibitor C75, they did not exhibit any significant up‐regulation of phosphotyrosine‐Tyr‐containing proteins (Fig. 4b).
Figure 4.
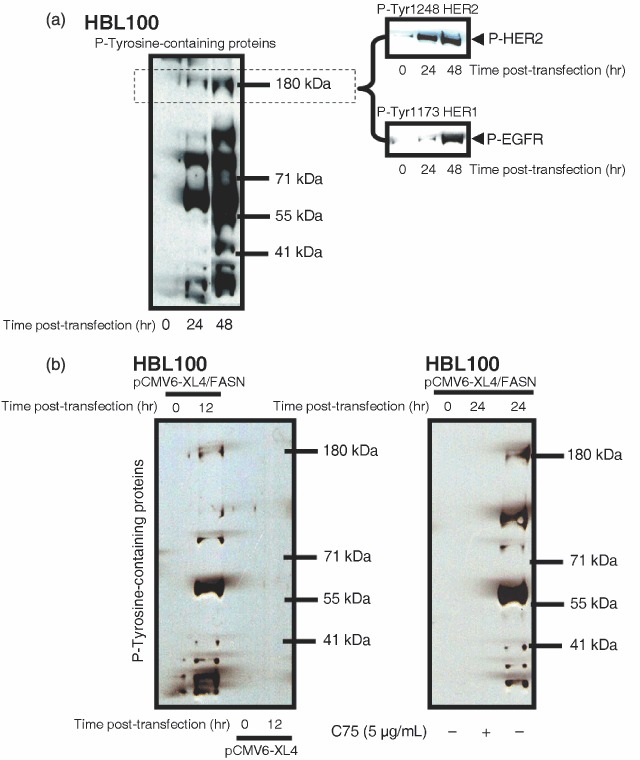
(a,b) Acute activation of FASN‐catalysed endogenous FA biogenesis alters both the activation (phosphorylation) and the expression status of HER‐ axis in normal breast epithelial cells. Overnight serum‐starved HBL100 cells were transiently transfected with 5 µg of either the pCMV6‐XL4 empty plasmid vector or the pCMV6‐XL4 plasmid vector carrying the full‐length human FASN cDNA in DMEM, 0.1% FBS for 0, 12, 24 or 48 h in the absence or presence of 5 µg/mL C75 as specified. Total content in phosphotyrosine (P)‐Tyr‐proteins and activation status of HER1 and HER2 receptors were tested using P‐Tyr (4G10), P‐Tyr1173‐HER1 and P‐Tyr1248‐HER2 immunoblotting procedures as described in ‘Materials and methods’. Figure shows a representative immunoblotting analysis. Equivalent results were obtained in, at least, three independent experiments.
To investigate whether FASN‐induced trans‐activation of the HER network members HER1 and HER2 was a molecular phenomenon not restricted to HBL100 cells and to evaluate whether an exacerbated endogenous FA metabolism affected phospho‐receptor Tyr‐kinases other than HER1 and HER2, we took advantage of the recently developed Human Proteome Profiler™ (R&D Systems Inc.). This rapid, sensitive and semiquantitative protein array technology can simultaneously identify and screen the levels of Tyr‐phosphorylation of up to 42 receptor Tyr‐kinases (RTKs) without performing numerous immunoprecipitation and/or immunoblotting analyses. Proteome Profiler™ evaluation of the activation status of RTKs was performed in MCF10A cells, a non‐transformed, near diploid, spontaneously immortalized mammary epithelial cell line. These cells provide a useful in vitro system to analyse the effect of the expression of specific genes that have been involved in breast cancer development in a non‐transformed genetic background (Ciardiello et al. 1992; Giunciuglio et al. 1995). MCF10A cells transiently transfected with pCMV6‐XL4/FASN significantly and specifically increased the activation status of HER1 and HER2 without further increases in the Tyr‐phosphorylation status of other cellular RTKs (Fig. 4c). In the presence of the FASN blocker C75, FASN‐promoted HER1/HER2 hyperactivation was decreased to, and even below, the baseline HER1 activation levels found in matched control MCF10A transiently transfected with the pCMV6‐XL4/FASN empty vector. The proliferative rate was significantly higher in MCF10A cells acutely forced to overexpress FASN than in mock‐transfected and parental MCF10A cells (data not shown) while exposure to chemical FASN inhibitor C75 drastically impaired cell viability, with some FASN‐overexpressing MCF10A cells noticeably exhibiting apoptotic features (Fig. 4c).
Figure 4.
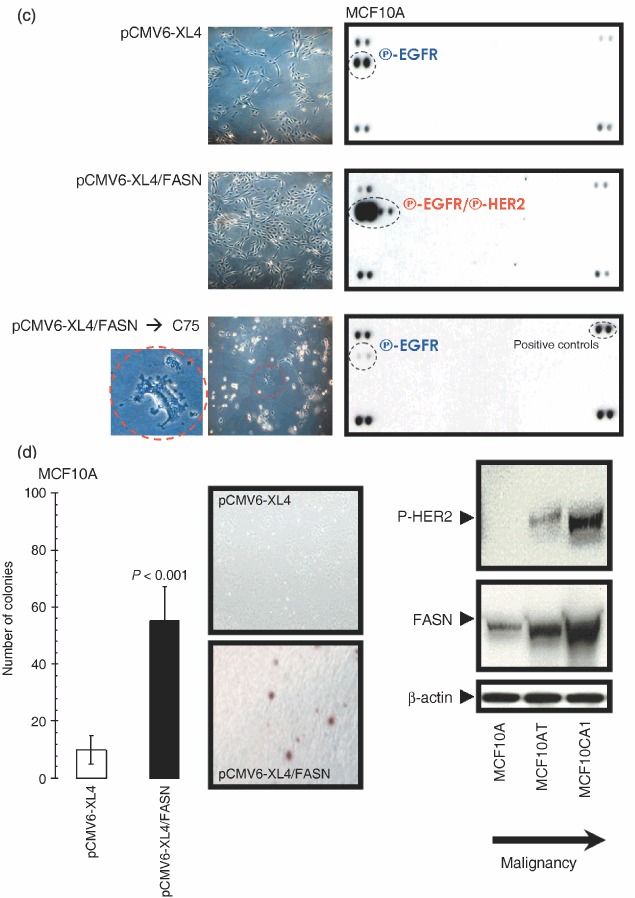
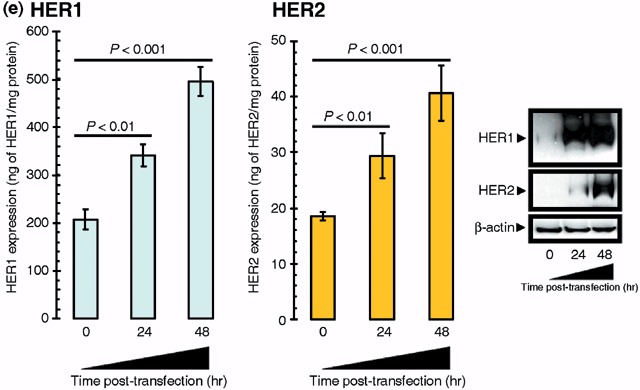
(c) Five hundred micrograms of total cell lysates from MCF10A transiently transfected with 5 µg of the pCMV6‐XL4 empty plasmid (48 h), with 5 µg of the pCMV6‐XL4 vector plasmid carrying the full‐length human FASN cDNA (48 h), or with 5 µg of pCMV6‐XL4/FASN (48 h) prior treatment with 5 µg/mL C75 (24 h) were incubated with membranes of the Human Phospho‐RTK Array Kit (Proteome Profiler™; R&D Systems) as per manufacturer's instructions. Phospho‐RTK array data were developed on X‐ray films following exposure to chemiluminescent reagents. Figure shows a representative phosphor‐proteome analysis. Equivalent results were obtained in three independent experiments. Representative microphotographs of anchorage‐dependent cultures (at day 2 after transfection) are shown. (d) Left. MCF10A cells engineered to transiently express either the pCMV6‐XL4 plasmid vector carrying the full‐length human FASN cDNA (pCMV6‐XL4/FASN) or the empty vector pCMV6‐XL4 were seeded (10 000 per well) in six‐well plates in culture medium containing 0.35% low‐melting agarose over a 0.7% agarose base layer and incubated for 14 days. Colonies were then stained with p‐iodonitrotetrazolium violet (1 mg/mL stock diluted at 1 : 500) for 18 h, and colonies larger than 50 µm in diameter were counted. Each experimental value on the graph (right panel) represents the mean colony number (columns) and 95% confidence intervals (bars) from three separate experiments in which triplicate dishes were counted. One‐factor anova was used to analyse differences in the number of colonies between each experimental condition (P < 0.001 for MCF10A‐pCMV6‐XL4/FASN cells versus MCF10A‐pCMV6‐XL4 matched control cells; one‐factor analysis of variance). Representative microphotographs of soft agar assays are shown (200‐fold magnification). Right. Fifty micrograms (for P‐HER2) or 5 µg (for FASN) of total protein from MCF10A, MCF10AT and MCF10CA1 cultures were resolved by 3–8% Tris‐Acetate NuPAGE and subjected to immunoblotting analyses for P‐HER2 and FASN using anti‐P‐HER2 and anti‐FASN monoclonal antibodies (clone PN2A and clone 23, respectively) as described in ‘Materials and methods’. Blots were re‐probed for β‐actin expression to control for protein loading and transfer. Figure shows a representative immunoblotting analysis. Equivalent results were obtained in three independent experiments. (e) Left. The Oncogene Science HER1 and HER2 microtiter ELISAs were used according to the manufacturer's instructions to compare HER1 and HER2 concentrations in HBL100 cells transfected as described above. Results are means (columns) and 95% confidence intervals (bars) of three independent experiments made in triplicate. One‐factor anova was used to analyse differences in the amounts of HER1 or HER2 24 and 48 h after transfection with pCMV6‐XL4/FASN (one‐factor analysis of variance). All statistical tests were two‐sided. No changes were observed when HBL100 cells were mock‐transfected with 5 µg of the empty vector pCMV6‐XL4 (data not shown). Right. Fifty micrograms of total protein from HBL100 cells transfected as described above were subjected to Western blot analyses with specific antibodies against HER1 and HER2. Blots were re‐probed for β‐actin expression to control for protein loading and transfer. A representative immunoblotting analysis is shown. Equivalent results were obtained in three independent experiments.
Although less markedly than when acutely overexpressed in HBL100 cells, transient transfection of FASN gene was capable to significantly enhance the ability of MCF10A cells to grow upon anchorage‐independent conditions (Fig. 4d, left). To further support the notion that FASN status may relate to the natural history of breast cancer disease, we examined FASN expression in the human MCF10 series, which derives from a single, clonal MCF10A cell line. The human MCF10 series was developed by spontaneous immortalization of normal breast epithelial cells from a patient with fibrocystic disease (Dawson et al. 1996) and it consists of a well‐differentiated MCF10A line, a pre‐malignant, ras‐transformed line called MCF10AT, and a fully malignant subclone from this line called MCF10CA1 (Dawson et al. 1996). MCF10A cells are unable to form lesions in nude mice (Miller et al. 1993), MCF10AT cells can generate benign ductal structures in mice with a potential for malignant tumour progression, and MCF10CA1 cells produce highly invasive cancers immediately after transplantation into nude mice (Santner et al. 2001). Of relevance for this study, as cells in the MCF10 series become progressively malignant they express higher levels of HER2 and exhibit high basal levels of HER receptor phosphorylation (Li et al. 2004). We observed that as cells in the MCF10 series become progressively malignant, they likewise expressed higher levels of endogenous FASN (Fig. 4d, right).
Acute overexpression of FASN enhances the expression of HER1 (EGFR) and HER2 in breast epithelial cells. It is known that HER2 can be phosphorylated as a consequence of HER1 (EGFR) interaction by either one of two mechanisms: by heterodimerization of the two receptors or by direct phosphorylation of HER2 by activated HER1. It has also been demonstrated that HER2 inhibits the down‐regulation of HER1, thus resulting in constitutive activation of HER1 in a ligand‐independent manner (Wada et al. 1990; Graus‐Porta et al. 1997; Worthylake et al. 1999). Because this complex cross‐talk between HER1 and HER2 appeared to be recapitulated following acute activation of FASN‐driven endogenous lipogenesis in our experimental models, we next asked whether transient up‐regulation of FASN did not only affect the activation status of HER1 and HER2 but further modulated their expression levels. HER2‐specific ELISA employed to quantitatively assess the expression of this receptor detected a significant 120% increase in HER2 expression following transient transfection of HBL100 cells with human FASN cDNA (i.e. from 18 ± 1 ng of HER2 per mg protein in parental HBL100 cells to 41 ± 5 ng of HER2 per mg protein 48 h after transfection with pCMV6‐XL4/FASN; Fig. 4e, left panels). However, this FASN‐enhanced HER2 expression cannot be considered ‘HER2 overexpression’ as HER2 protein levels in HBL100 transiently transfected with pCMV6‐XL4/FASN are far below from those found in breast cancer cell lines naturally exhibiting HER2 gene‐amplification and HER2 protein‐overexpression (e.g. > 900 ng of HER2 per mg protein in SKBR3 and BT474 cells) (Konecny et al. 2006). Parental HBL100 cells were found to express high levels of HER1 (207 ± 9 ng of HER1 per mg protein). This HER1‐overexpressing phenotype was notably enhanced up to ∼500 ng of EGFR per mg protein upon acute activation of endogenous FA biosynthesis (Fig. 4e, left panels). Therefore, HBL100 cells engineered to overexpress FASN did reach HER1 levels comparable to those found in breast cancer cells lines naturally exhibiting HER1‐gene amplification and HER1‐protein overexpression (e.g. ∼300 ng and 900 ng of EGFR per mg protein in BT20 and MDA‐MB‐468 cells, respectively) (Konecny et al. 2006). Immunoblotting procedures with anti‐HER2 and anti‐HER1 specific antibodies further confirmed the ability of FASN‐catalysed de novo biogenesis to significantly up‐regulate the expression of HER2 and HER1 proteins in HBL100 cells (Fig. 4e, right panels).
Acute overexpression of FASN triggers a ‘HER1/HER2’‐dependent breast cancer phenotype. To confirm that the sole activation of FASN‐catalysed endogenous FA biogenesis was capable to promote a ‘HER1/HER2’‐dependent breast cancer phenotype in HBL100 cells, we monitored cell responses to the EGFR (HER1) TK inhibitor (TKi) gefitinib (Iressa®) and to the dual HER1/HER2 TKi lapatinib (Tykerb®) (Normanno et al. 2003; Albanell & Gascon 2005; Hynes & Lane 2005; Johnston & Leary 2006; Konecny et al. 2006). When cell numbers were measured using a tetrazolium salt‐based (MTT) assay, we found FASN‐related exacerbated breast epithelial cell responses to gefitinib (Fig. 5a), and especially to lapatinib (Fig. 5b). In order to measure FASN‐dependent changes in the degree of sensitivity to HER TKIs, a sensitization factor was determined by dividing the IC50 values for gefitinib and lapatinib (the concentration of the compounds necessary to reduce cell viability by 50%) in HBL100 cells transiently transfected with no insert (mock transfection) by those obtained in HBL100 cells transiently transfected with human FASN cDNA. Interestingly, HBL100 cells transiently engineered to overexpress increasing concentrations of the pCMV6‐XL4/FASN construct exhibited a ‘FASN dose’‐dependent 3‐ to 10‐fold increase in gefitinib sensitivity (Fig. 5a). Moreover, we failed to calculate the actual concentrations of lapatinib needed to reduce cell viability by 50% as, by interpolation, the IC50 values dropped below 100 nm lapatinib, the lowest concentration of this HER1/HER2 TKi employed in our experiments. That is, acute FASN overexpression was sufficient to increase > 15 times the sensitivity of HBL100 cells to lapatinib (Fig. 5b). Treatments with gefitinib and lapatinib also suppressed FASN‐responsive signalling sustaining growth of HBL100 cells in soft agar (data not shown).
Figure 5.
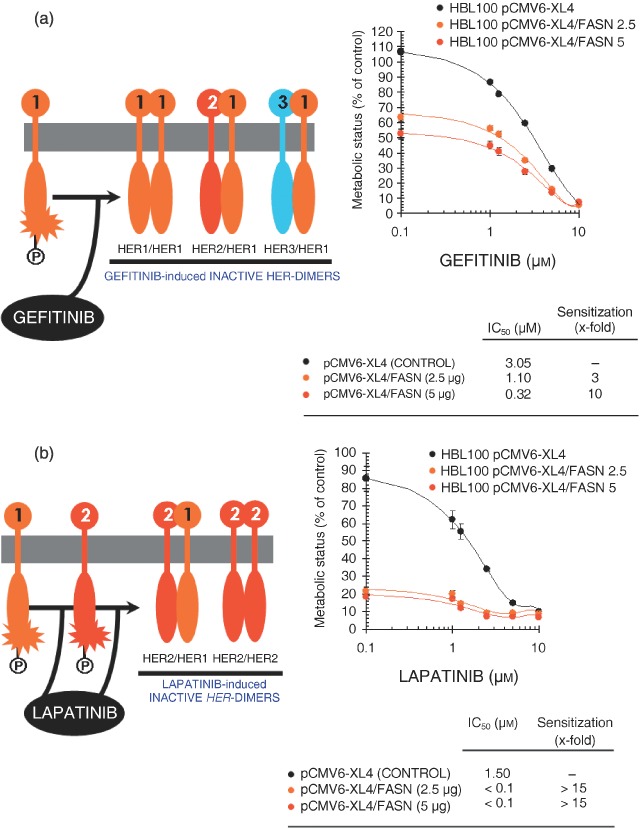
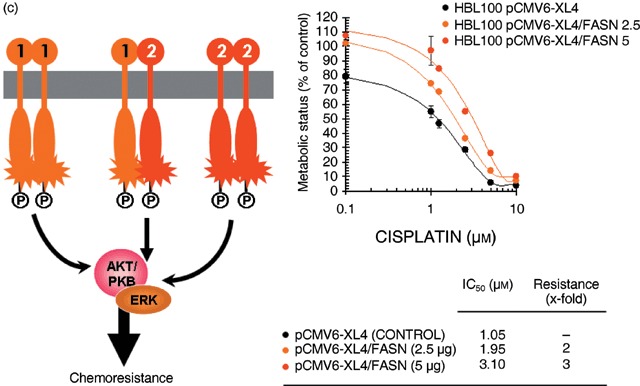
Cell viability of breast epithelial cells engineered to overexpress FASN depends on the function of the HER1/HER2 duo. Figure shows dose–response curves of HBL100 cells engineered to transiently express increasing amounts of the pCMV6‐XL4 plasmid vector carrying the full‐length human FASN cDNA (i.e. 2.5 and 5 µg of pCMV6‐XL4/FASN) or 5 µg of the empty vector pCMV6‐XL4 to gefitinib (a), lapatinib (b) and cisplatin (c). Cells seeded in 96‐well plates (2000–3000 per well) were cultured in triplicate in the absence or presence of graded concentrations of the agents, which were not renewed during the entire period of cell exposure. Once control‐untreated wells reached confluency, cells were exposed to MTT reagent and optical density at 570 nm was measured in a microplate reader. The cell viability effects from exposure of cells to gefitinib, lapatinib and cisplatin were analysed by generating concentration‐effect curves as a plot of the fraction of unaffected (surviving) cells versus drug concentration. Dose–response curves were plotted as percentages of the control cells’ absorbance (= 100%), which was obtained from wells treated with appropriate concentrations (DMSO, v/v) of agents vehicle that were processed simultaneously. IC50 values were designated for the concentrations of the agents (µm) decreasing absorbance values at 570 nm by 50%, as determined by interpolation using the MTT‐based colorimetric growth viability assay (see ‘Materials and methods’). Values are means of three independent experiments carried out in triplicate. Sensitization/resistance factors were obtained by dividing the IC50 values of gefitinib, lapatinib and cisplatin from HBL100 cells transfected with the empty vector pCMV6‐XL4 by those obtained when cells were transfected with pCMV6‐XL4/FASN.
We finally reasoned that, if acute activation of FASN‐catalysed de novo FA biogenesis was driving a functional ‘HER1/HER2‐like’ breast cancer phenotype, FASN‐overexpressing HBL100 cells might be resistant to the cytotoxic effects induced by chemotherapeutic agents. Transient transfection of HB100 cells with pCMV6‐XL4/FASN likewise conferred a 2‐ to 3‐fold resistance to cisplatin‐induced cell injury (Fig. 5c). An equivalent protection was also observed when HBL100 cells acutely expressing FASN were treated with paclitaxel (data not shown). Treatments with cisplatin and paclitaxel failed to suppress FASN‐responsive signalling sustaining growth of HBL100 cells in soft agar (data not shown).
DISCUSSION
Although altered metabolism of tumour cells has been recognized since the 1920s with the observation of increased anaerobic glycolysis in cancer cells by Otto Warburg (Warburg & Posener 1924), our current perception of tumour cell metabolism ascertains that, while an altered metabolism is not the cause of malignancy, without the required metabolic transformation, the neoplastic cell cannot successfully elicit its malignant capabilities (Gatenby & Gillies 2004; Costello & Franklin 2006; Kim & Dang 2006; Merida & Avila‐Flores 2006). To date, this assumption appeared to be also true for de novo FA biogenesis, another adaptive metabolic requirement of malignant cells.
In the 1950s, some studies showed that endogenous FA biosynthesis in tumour tissues occur at very high rates. By the mid‐1980s, it was established that de novo synthesis of FAs accounts for almost all FAs in the tumour cells despite adequate nutritional supply. Despite these data, the endogenous FA pathway did not become a focus of clinical interest as a means to treat or diagnose human cancer until the early 1990s, when Kuhajda and colleagues unambiguously identified through sequence homology and enzymology the Oncogenic Antigen‐519 (OA‐519) – a prognostic molecule found in tumour cells from breast cancer patients with markedly worsened prognosis – as FASN, the key metabolic multienzyme that is responsible for the terminal catalytic step in the de novo FA biogenesis (Medes et al. 1953; Greenstein 1954; Ookhtens et al. 1984; Kuhajda et al. 1994; Kuhajda 2000; Menendez & Lupu 2004; Menendez et al. 2005a; Kuhajda 2006; Swinnen et al. 2006). Recent clinical and basic research studies have evidenced that up‐regulation of FASN gene expression and FASN biosynthetic activity are molecular events accompanying the pathogenesis and natural history of cancer disease (Menendez & Lupu 2004, 2006; Menendez et al. 2004b, 2005a, 2005e; Alli et al. 2005; Kuhajda 2006; Swinnen et al. 2006): First, endogenously synthesized FAs in cancer cells are esterified predominantly to phospholipids, not triglyceride as occurs in normal cells. Second, FA synthesis in cancer cells is transcriptionally regulated either hormonally or through oncogene signalling via kinase pathways, not by diet as occurs in lipogenic tissues. Third, the consequences of FASN inhibition differ widely between cancer and normal cells as FASN blockade rapidly induces apoptosis in human cancer cells both in vitro and in vivo with no effects towards normal cells, thus implying the reliance of cancer cell survival on FASN activity.
Thought specific FASN blockade revert oncogene‐induced malignant phenotypes such as anchorage‐independent cell growth, increased cell survival and/or chemoresistance, FASN‐dependent endogenous de novo FA biosynthesis is largely considered, similarly to anaerobic glycolysis, as a metabolic feature necessary to maintain the state of malignant transformation. But, is it sufficient? To definitely consider FASN as a metabolic oncogene in breast cancer disease, transfection of non‐cancerous breast epithelial cells with the FASN gene should lead to its tumourigenic conversion in a dose‐dependent manner as assessed by growth under serum‐free conditions, growth in soft agar and growth as xenografts in nude mice. Our current findings do not definitely establish an oncogenic role for FASN but reveal, for the first time in the best of our knowledge, that the sole up‐regulation of FASN expression and activity in non‐cancerous breast epithelial cells can, on its own, trigger the activation of key members of the HER network which, in turn, induce a breast cancer‐like phenotype functionally dependent on the TK activity of the HER1/HER2 duo. Although HER2 does not bind any of the HER ligands (i.e. EGF, amphiregulin, TGFα, betacellulin, epiregulin, neuregulins) directly, we know that its catalytic activity can potently amplify signalling by HER2‐containing heterodimers via increasing ligand binding affinity and/or receptor recycling and stability (Graus‐Porta et al. 1997; Worthylake et al. 1999; Yarden & Sliwkowski 2001; Marmor et al. 2004; Citri & Yarden 2006). Subsequent activation of the HER network leads to receptor autophosphorylation in C‐terminal Tyr and the recruitment to these sites of cytoplasmic signal transducers that regulate cellular processes such as proliferation, differentiation, motility, adhesion, protection from apoptosis, and transformation. This study strongly suggests that FASN overexpression potently increases the signal‐to‐noise ratio in the HER1/HER2‐driven oncogenic signalling and therefore recapitulates the ability of HER2 to potently amplify signalling through the HER network: first, HER2 auto‐activation upon FASN overexpression is accompanied not only by an increased Tyr‐phosphorylation of HER1 but also further with a significant up‐regulation of HER1 protein expression. Second, FASN‐promoted stimulation of the HER family members HER1 and HER2 resulted in the activation of down‐stream transduction cascades that functionally worked in the acquisition of an in vitro transformed phenotype. This HER1/2‐dependence of FASN‐induced enhanced cell survival (e.g. growth in soft agar) and protection from apoptosis (e.g. chemoresistance) resulted obvious when monitoring the responses of HBL100 cells transiently overexpressing FASN to HER‐targeted TKis, as they become significantly more sensitive to the HER1 TKi gefitinib while acquiring an exquisite cytotoxic response to the HER1–HER2 dual inhibitor lapatinib.
The unexpected ability of FASN overexpression to function as an oncogenic‐like stimulus in normal breast epithelial cells may drastically modify our perspective on the role of endogenous FA biogenesis in breast cancer biology. Most of our current notions clearly establish that breast cancer‐associated FASN represents a growth factors/growth factor receptors‐driven change in the genetic program controlling lipogenesis through sterol regulatory element‐binding proteins (SREBPs), a family of transcription factors that coordinately activate genes involved in the synthesis of cholesterol and FAs (Swinnen 2001; Eberle et al. 2004). Changes in up‐stream regulatory circuits (e.g. activation of the HER network by either gene amplification of HER members or by overproduction of HER ligands) lead to down‐stream activation of the transduction cascades Ras/Raf/MEK/ERK and PI‐3′K/AKT, and ultimately to SREBP‐dependent up‐regulation of FASN gene expression (Fig. 6, left panel) (Menendez & Lupu 2004, 2006; Menendez et al. 2005a,e; Kuhajda 2006; Swinnen et al. 2006). In this scenario, an active FASN signalling is necessary for the maintenance of the transformed phenotype. We now propose that exacerbated endogenous FA biogenesis works as an intrinsic stimulus capable to hyper‐activate an oncogenic and chemoresistance signalling through the HER network (Fig. 6, right panel). The data presented here demonstrate that low levels of basal HER1/HER2 activity in non‐cancerous breast epithelial cells can be dramatically enhanced by FASN overexpression. Thus, de novo FA biogenesis, directly or indirectly, appears to significantly affect the formation of HER1/HER2 signal transduction complexes at the membrane, changing their state from ‘off’ to ‘on’. In this alternative scenario, FASN‐induced activation of the HER network would indirectly up‐regulate SREBP‐driven FASN gene expression and therefore FASN hyperactivity may create, on its own, a feed‐back able to continuously maintain high levels of FASN in breast cancer cells. Indeed, we recently observed that pharmacological and siRNA‐induced inhibition of FASN in breast cancer cells negatively regulates its own expression by shutting‐down FASN gene promoter activity (data not shown). We are currently investigating the ultimate mechanism(s) linking endogenous FA biogenesis and its pro‐transformation behaviour via activation of the HER network.
Figure 6.
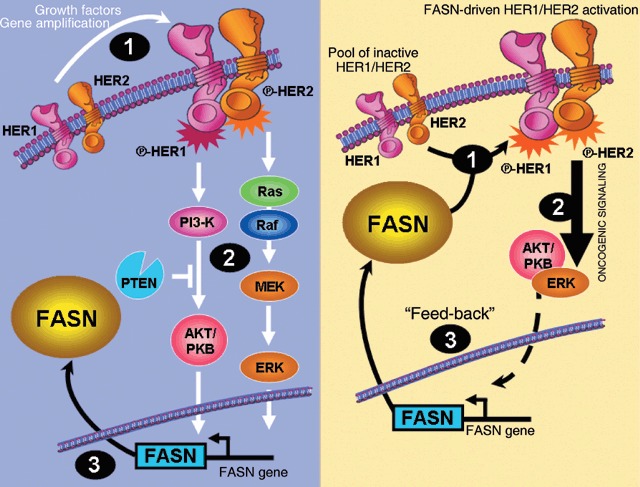
A new mode of action for endogenous lipogenesis in breast cancer disease. It is widely accepted that tumour‐associated FASN represents a growth factors/growth factor receptors‐driven change in the genetic program controlling lipogenesis through sterol regulatory element‐binding proteins (SREBPs), a family of transcription factors that coordinately activate genes involved in the synthesis of cholesterol and FAs. In this classic ‘out‐to‐in’model (left), changes in up‐stream regulatory circuits (e.g. activation of the HER network by either gene amplification of HER members or by overproduction of HER ligands ‐1‐) lead to down‐stream activation of the transduction cascades Ras/Raf/MEK/ERK and PI‐3′K/AKT ‐2‐, and ultimately to SREBP‐dependent up‐regulation of FASN gene expression ‐3‐. We here propose an alternative ‘in‐to‐out’scenario (right) in which, de novo FA biogenesis, directly or indirectly, significantly affects the formation of HER1/HER2 signal transduction complexes at the membrane, changing their state from ‘off’ to ‘on’ ‐1‐. FASN‐induced activation of the HER network would indirectly up‐regulate SREBP‐driven FASN gene expression ‐2‐ and therefore FASN hyperactivity may create a feed‐back able to continuously maintain high levels of FASN in breast cancer cells ‐3‐.
Two important properties of neoplastic cells are immortalization and transformation. While it is unlikely that FASN‐catalysed de novo FA biogenesis may have a direct role in immortalization, our current findings support the notion that FASN overexpression/hyperactivation would impart immortalized breast epithelial cells with a profound neoplastic advantage over those maintaining physiological levels of endogenous FA biogenesis. Although we acknowledge that animal experiments are needed to substantiate this hypothesis, a very recent report by Priolo et al. (2006) revealed that the ubiquitin‐specific protease 2a (USP2a), which interacts and stabilizes FASN in prostate cancer cells (Graner et al. 2004), exhibits oncogenic behaviour both in vitro and in vivo and prevented apoptosis induced by chemotherapeutic agents when overexpressed in non‐transformed cells (Priolo et al. 2006). Therefore, FASN can be considered an oncogene in prostate cancer disease by virtue of its ability to enhance tumour cell survival. Considering that the transforming ability of USP2a‐induced FASN up‐regulation was accompanied, similarly to our current findings, by up‐regulation of some members of the HER network (Priolo et al. 2006), it is reasonable to suggest that exacerbated endogenous FA biogenesis in the breast epithelium may also represents a previously unrecognized oncogenic stimulus in mammary tumourigenesis. Supporting this notion, a recent study characterizing genome‐wide changes accompanying knockdown of FASN in breast cancer cells (Knowles & Smith 2007) evidenced the ability of FASN to modulate a wide network of pathways that regulate several aspects of tumour function, including metabolism, cell survival/proliferation, DNA replication/transcription, and protein degradation.
The concept that FASN overexpressipon/hyperactivation would impart immortalized cells with a profound neoplasic growth/survival advantage over those maintaining physiological levels of endogenous FA biosynthesis strongly suggests that FASN can work as a previously unrecognized metabolic intermediate of oncogenesis linking cellular anabolism and malignant transformation.
ACKNOWLEDGEMENTS
J.A.M. is the recipient of a Basic, Clinical and Translational Research Award (BCTR0600894) from the Susan G. Komen Breast Cancer Foundation (TX, USA). This work was also supported by the Instituto de Salud Carlos III (Ministerio de Sanidad y Consumo, Fondo de Investigación Sanitaria (FIS), Spain, Grants CP05‐00090 and PI06‐0778 to J.A.M., and Grant RD06‐0020‐0028 to J.A.M., R.C. and J.B.).
REFERENCES
- Albanell J, Gascon P (2005) Small molecules with EGFR‐TK inhibitor activity. Curr. Drug Targets 6, 259–274. [DOI] [PubMed] [Google Scholar]
- Alli PM, Pinn ML, Jaffee EM, McFadden JM, Kuhajda FP (2005) Fatty acid synthase inhibitors are chemopreventive for mammary cancer in neu‐N transgenic mice. Oncogene 24, 39–46. [DOI] [PubMed] [Google Scholar]
- Baron A, Migita T, Tang D, Loda M (2004) Fatty acid synthase: a metabolic oncogene in prostate cancer? J. Cell. Biochem. 91, 47–53. [DOI] [PubMed] [Google Scholar]
- Bligh EG, Dyer WJ (1959) A rapid method of total lipid extraction and purification. Can. J. Biochem. Physiol. 37, 911–917. [DOI] [PubMed] [Google Scholar]
- Bui T, Thompson CB (2006) Cancer's sweet tooth. Cancer Cell 9, 419–420. [DOI] [PubMed] [Google Scholar]
- Caron de Fromentel C, Nardeux PC, Soussi T, Lavialle C, Estrade S, Carloni G, Chandrasekaran K, Cassingena R (1985) Epithelial HBL‐100 cell line derived from milk of an apparently healthy woman harbours SV40 genetic information. Exp. Cell Res. 160, 83–94. [DOI] [PubMed] [Google Scholar]
- Ciardiello F, Gottardis M, Basolo F, Pepe S, Normanno N, Dickson RB, Bianco AR, Salomon DS (1992) Additive effects of c‐erbB‐2, c‐Ha‐ras, and transforming growth factor‐alpha genes on in vitro transformation of human mammary epithelial cells. Mol. Carcinog. 6, 43–52. [DOI] [PubMed] [Google Scholar]
- Citri A, Yarden Y (2006) EGF‐ERBB signalling: towards the systems level. Nat. Rev. Mol. Cell Biol. 7, 505–516. [DOI] [PubMed] [Google Scholar]
- Costello LC, Franklin RB (2006) Tumor cell metabolism: the marriage of molecular genetics and proteomics with cellular intermediary metabolism; proceed with caution. Mol. Cancer 5, 59. [DOI] [PMC free article] [PubMed] [Google Scholar]
- Dawson PJ, Wolman SR, Tait L, Heppner GH, Miller FR (1996) MCF10AT: a model for the evolution of cancer from proliferative breast disease. Am. J. Pathol. 148, 313–319. [PMC free article] [PubMed] [Google Scholar]
- Dils R, Carey EM (1975) Fatty acid Synthase from rabbit mammary gland. Meth. Enzymol. 35, 74–83. [DOI] [PubMed] [Google Scholar]
- Eberle D, Hegarty B, Bossard P, Ferre P, Foufelle F (2004) SREBP transcription factors: master regulators of lipid homeostasis. Biochimie 86, 839–848. [DOI] [PubMed] [Google Scholar]
- Gaffney EV (1982) A cell line (HBL‐100) established from human breast milk. Cell Tissue Res. 227, 563–568. [DOI] [PubMed] [Google Scholar]
- Garber K (2004) Energy boost: the Warburg effect returns in a new theory of cancer. J. Natl. Cancer Inst. 96, 1805–1806. [DOI] [PubMed] [Google Scholar]
- Garber K (2006) Energy deregulation: licensing tumors to grow. Science 312, 1158–1159. [DOI] [PubMed] [Google Scholar]
- Gatenby RA, Gillies RJ (2004) Why do cancers have high aerobic glycolysis? Nat. Rev. Cancer 4, 891–899. [DOI] [PubMed] [Google Scholar]
- Giunciuglio D, Culty M, Fassina G, Masiello L, Melchiori A, Paglialunga G, Arand G, Ciardiello F, Basolo F, Thompson EW (1995) Invasive phenotype of MCF10A cells overexpressing c‐Ha‐ras and c‐erbB‐2 oncogenes. Int. J. Cancer 63, 815–822. [DOI] [PubMed] [Google Scholar]
- Graner E, Tang D, Rossi S, Baron A, Migita T, Weinstein LJ, Lechpammer M, Huesken D, Zimmermann J, Signoretti S, Loda M (2004) The isopeptidase USP2a regulates the stability of fatty acid synthase in prostate cancer. Cancer Cell 5, 253–261. [DOI] [PubMed] [Google Scholar]
- Graus‐Porta D, Beerli RR, Daly JM, Hynes NE (1997) ErbB‐2, the preferred heterodimerization partner of all ErbB receptors, is a mediator of lateral signaling. EMBO J. 16, 1647–1655. [DOI] [PMC free article] [PubMed] [Google Scholar]
- Greenstein JP (1954) Biochemistry of Cancer. New York: Academic Press. [Google Scholar]
- Gross ME, Shazer RL, Agus DB (2004) Targeting the HER‐kinase axis in cancer. Semin Oncol. 31 (1 Suppl. 3), 9–20. [DOI] [PubMed] [Google Scholar]
- Hu X, Juneja SC, Maihle NJ, Cleary MP (2002) Leptin‐a growth factor in normal and malignant breast cells and for normal mammary gland development. J. Natl. Cancer Inst. 94, 1704–1711. [DOI] [PubMed] [Google Scholar]
- Hynes NE, Lane HA (2005) ERBB receptors and cancer: the complexity of targeted inhibitors. Nat. Rev. Cancer 5, 341–354. [DOI] [PubMed] [Google Scholar]
- Johnston SR, Leary A (2006) Lapatinib: a novel EGFR/HER2 tyrosine kinase inhibitor for cancer. Drugs Today (Barc) 42, 441–453. [DOI] [PubMed] [Google Scholar]
- Kim JW, Dang CV (2006) Cancer's molecular sweet tooth and the Warburg effect. Cancer Res. 66, 8927–8930. [DOI] [PubMed] [Google Scholar]
- Knowles LM, Smith JW (2007) Genome‐wide changes accompanying knockdown of fatty acid synthase in breast cancer. BMC Genomics 8, 168. [DOI] [PMC free article] [PubMed] [Google Scholar]
- Konecny GE, Pegram MD, Venkatesan N, Finn R, Yang G, Rahmeh M, Untch M, Rusnak DW, Spehar G, Mullin RJ, Keith BR, Gilmer TM, Berger M, Podratz KC, Slamon DJ (2006) Activity of the dual kinase inhibitor lapatinib (GW572016) against HER‐2‐overexpressing and trastuzumab‐treated breast cancer cells. Cancer Res. 66, 1630–1639. [DOI] [PubMed] [Google Scholar]
- Krief P, Saint‐Ruf C, Bracke M, Boucheix C, Billard C, Billard M, Cassingena R, Jasmin C, Mareel M, Azzarone B (1989) Acquisition of tumorigenic potential in the human myoepithelial HBL100 cell line is associated with decreased expression of HLA class I, class II and integrin beta 3 and increased expression of c‐myc. Int. J. Cancer 43, 658–664. [DOI] [PubMed] [Google Scholar]
- Kuhajda FP (2000) Fatty‐acid synthase and human cancer: new perspectives on its role in tumor biology. Nutrition 16, 202–208. [DOI] [PubMed] [Google Scholar]
- Kuhajda FP (2006) Fatty acid synthase and cancer: new application of an old pathway. Cancer Res. 66, 5977–5980. [DOI] [PubMed] [Google Scholar]
- Kuhajda FP, Jenner K, Wood FD, Hennigar RA, Jacobs LB, Dick JD, Pasternack GR (1994) Fatty acid synthesis: a potential selective target for antineoplastic therapy. Proc. Natl. Acad. Sci. USA 91, 6379–6383. [DOI] [PMC free article] [PubMed] [Google Scholar]
- Kuhajda FP, Pizer ES, Li JN, Mani NS, Frehywot GL, Townsend CA (2000) Synthesis and antitumor activity of an inhibitor of fatty acid synthase. Proc. Natl. Acad. Sci. USA 97, 3450–3454. [DOI] [PMC free article] [PubMed] [Google Scholar]
- Li Q, Ahmed S, Loeb JA (2004) Development of an autocrine neuregulin signaling loop with malignant transformation of human breast epithelial cells. Cancer Res. 64, 7078–7085. [DOI] [PubMed] [Google Scholar]
- Lupu R, Menendez JA (2006a) Targeting fatty acid synthase in breast and endometrial cancer: An alternative to selective estrogen receptor modulators? Endocrinology 147, 4056–4066. [DOI] [PubMed] [Google Scholar]
- Lupu R, Menendez JA (2006b) Pharmacological inhibitors of fatty acid synthase (FASN)‐catalyzed endogenous fatty acid biogenesis: a new family of anti‐cancer agents? Curr. Pharm. Biotechnol. 7, 495–502. [DOI] [PubMed] [Google Scholar]
- Maier T, Jenni S, Ban N (2006) Architecture of mammalian fatty acid synthase at 4.5 Å resolution. Science 311, 1258–1262. [DOI] [PubMed] [Google Scholar]
- Marlhens F, Saint‐Ruf C, Nardeux P, Lavialle C, Brouty‐Boye D, Dutrillaux B, Cassingena R (1988) Karyotype evolution of the human HBL‐100 cell line and mapping of the integration site of SV40 DNA. Ann. Genet 31, 81–86. [PubMed] [Google Scholar]
- Marmor MD, Skaria KB, Yarden Y (2004) Signal transduction and oncogenesis by ErbB/HER receptors. Int. J. Radiat. Oncol. Biol. Phys. 58, 903–913. [DOI] [PubMed] [Google Scholar]
- Medes G, Thomas A, Weinhouse S (1953) Metabolism of neoplastic tissue. IV. A study of lipid synthesis in neoplastic tissue slices in vitro . Cancer Res. 13, 27–29. [PubMed] [Google Scholar]
- Menendez JA, Lupu R (2004) Fatty acid synthase‐catalyzed de novo fatty acid biosynthesis: from anabolic‐energy‐storage pathway in normal tissues to jack‐of‐all‐trades in cancer cells. Arch. Immunol. Ther. Exp. (Warsz) 52, 414–426. [PubMed] [Google Scholar]
- Menendez JA, Lupu R (2006) Oncogenic properties of the endogenous fatty acid metabolism: molecular pathology of fatty acid synthase in cancer cells. Curr. Opin. Clin. Nutr. Metab. Care 9, 346–357. [DOI] [PubMed] [Google Scholar]
- Menendez JA, Mehmi I, Atlas E, Colomer R, Lupu R (2004a) Novel signaling molecules implicated in tumor‐associated fatty acid synthase‐dependent breast cancer cell proliferation and survival: role of exogenous dietary fatty acids, p53‐p21WAF1/CIP1, ERK1/2 MAPK, p27KIP1, BRCA1, and NF‐kappaB. Int. J. Oncol. 24, 591–608. [PubMed] [Google Scholar]
- Menendez JA, Ropero S, Mehmi I, Atlas E, Colomer R, Lupu R (2004b) Overexpression and hyperactivity of breast cancer‐associated fatty acid synthase (oncogenic antigen‐519) is insensitive to normal arachidonic fatty acid‐induced suppression in lipogenic tissues but it is selectively inhibited by tumoricidal alpha‐linolenic and gamma‐linolenic fatty acids: a novel mechanism by which dietary fat can alter mammary tumorigenesis. Int. J. Oncol. 24, 1369–1383. [PubMed] [Google Scholar]
- Menendez JA, Vellon L, Mehmi I, Oza BP, Ropero S, Colomer R, Lupu R (2004c) Inhibition of fatty acid synthase (FAS) suppresses HER2/neu (erbB‐2) oncogene overexpression in cancer cells. Proc. Natl. Acad. Sci. USA 101, 10715–10720. [DOI] [PMC free article] [PubMed] [Google Scholar]
- Menendez JA, Mehmi I, Verma VA, Teng PK, Lupu R (2004d) Pharmacological inhibition of fatty acid synthase (FAS): a novel therapeutic approach for breast cancer chemoprevention through its ability to suppress Her‐2/neu (erbB‐2) oncogene‐induced malignant transformation. Mol. Carcinog. 41, 164–178. [DOI] [PubMed] [Google Scholar]
- Menendez JA, Colomer R, Lupu R (2005a) Why does tumor‐associated fatty acid synthase (oncogenic antigen‐519) ignore dietary fatty acids? Med. Hypotheses 64, 342–349. [DOI] [PubMed] [Google Scholar]
- Menendez JA, Vellon L, Colomer R, Lupu R (2005b) Pharmacological and small interference RNA‐mediated inhibition of breast cancer‐associated fatty acid synthase (oncogenic antigen‐519) synergistically enhances Taxol (paclitaxel)‐induced cytotoxicity. Int. J. Cancer 115, 19–35. [DOI] [PubMed] [Google Scholar]
- Menendez JA, Lupu R, Colomer R (2005c) Obesity, fatty acid synthase, and cancer: serendipity or forgotten causal linkage? Mol. Genet. Metab. 84, 293–295. [DOI] [PubMed] [Google Scholar]
- Menendez JA, Decker JP, Lupu R (2005d) In support of fatty acid synthase (FAS) as a metabolic oncogene: extracellular acidosis acts in an epigenetic fashion activating FAS gene expression in cancer cells. J. Cell. Biochem. 94, 1–4. [DOI] [PubMed] [Google Scholar]
- Menendez JA, Lupu R, Colomer R (2005e) Targeting fatty acid synthase: potential for therapeutic intervention in Her‐2/neu‐overexpressing breast cancer. Drug News Perspect. 18, 375–385. [DOI] [PubMed] [Google Scholar]
- Menendez JA, Vellon L, Oza BP, Lupu R (2005f) Does endogenous fatty acid metabolism allow cancer cells to sense hypoxia and mediate hypoxic vasodilatation? Characterization of a novel molecular connection between fatty acid synthase (FAS) and hypoxia‐inducible factor‐1alpha (HIF‐1alpha)‐related expression of vascular endothelial growth factor (VEGF) in cancer cells overexpressing her‐2/neu oncogene. J. Cell. Biochem. 94, 857–863. [DOI] [PubMed] [Google Scholar]
- Merida I, Avila‐Flores A (2006) Tumor metabolism: new opportunities for cancer therapy. Clin. Transl. Oncol. 8, 711–716. [DOI] [PubMed] [Google Scholar]
- Miller FR, Soule HD, Tait L, Pauley RJ, Wolman SR, Dawson PJ, Heppner GH (1993) Xenograft model of progressive human proliferative breast disease. J. Natl. Cancer Inst. 85, 1725–1732. [DOI] [PubMed] [Google Scholar]
- Normanno N, Bianco C, De Luca A, Maiello MR, Salomon DS (2003) Target‐based agents against ErbB receptors and their ligands: a novel approach to cancer treatment. Endocr. Relat. Cancer 10, 1–21. [DOI] [PubMed] [Google Scholar]
- Olayioye MA (2001) Update on HER‐2 as a target for cancer therapy: intracellular signaling pathways of ErbB2/HER‐2 and family members. Breast Cancer Res. 3, 385–389. [DOI] [PMC free article] [PubMed] [Google Scholar]
- Ookhtens M, Kanna R, Lyon I, Baker N (1984) Liver and adipose tissue contributions to newly formed fatty acids in an ascites tumor. Am. J. Physiol. 247, R146–R153. [DOI] [PubMed] [Google Scholar]
- Pizer ES, Chrest FJ, Digiuseppe JA, Han WF (1998) Pharmacological inhibition of mammalian fatty acid synthase suppress DNA replication and induce apoptosis in tumor cell lines. Cancer Res. 58, 4611–4615. [PubMed] [Google Scholar]
- Pizer ES, Thupari J, Han WF, Pinn ML, Chrest FJ, Frehywot GL, Townsend CA, Kuhajda FP (2000) Malonyl‐coenzyme‐A is a potential mediator of cytotoxicity induced by fatty‐acid synthase inhibition in human breast cancer cells and xenografts. Cancer Res. 60, 213–218. [PubMed] [Google Scholar]
- Priolo C, Tang D, Brahamandan M, Benassi B, Sicinska E, Ogino S, Farsetti A, Porrello A, Finn S, Zimmermann J, Febbo P, Loda M (2006) The Isopeptidase USP2a Protects Human Prostate Cancer from Apoptosis. Cancer Res. 66, 8625–8632. [DOI] [PubMed] [Google Scholar]
- Santner SJ, Dawson PJ, Tait L, Soule, HD , Eliason, J , Mohamed, AN , Wolman, SR , Heppner, GH , Miller, FR (2001) Malignant MCF10CA1 cell lines derived from premalignant human breast epithelial MCF10AT cells. Breast Cancer Res. Treat. 65, 101–110. [DOI] [PubMed] [Google Scholar]
- Shaw RJ (2006) Glucose metabolism and cancer. Curr. Opin. Cell Biol. 18, 598–608. [DOI] [PubMed] [Google Scholar]
- Smith S (1994) The animal fatty acid synthase: one gene, one polypeptide, seven enzymes. FASEB J. 8, 1248–1259. [PubMed] [Google Scholar]
- Souttou B, Hamelin R, Crepin M (1994) FGF2 as an autocrine growth factor for immortal human breast epithelial cells. Cell Growth Differ. 5, 615–623. [PubMed] [Google Scholar]
- Swinnen JV (2001) Increased lipogenesis in steroid‐responsive cancer cells: mechanisms of regulation, role in cancer cell biology and perspectives on clinical applications. Verh. K. Acad. Geneeskd. Belg. 63, 321–333. [PubMed] [Google Scholar]
- Swinnen JV, Brusselmans K, Verhoeven G (2006) Increased lipogenesis in cancer cells: new players, novel targets. Curr. Opin. Clin. Nutr. Metab. Care 9, 358–365. [DOI] [PubMed] [Google Scholar]
- Wada T, Qian XL, Greene MI (1990) Intermolecular association of the p185neu protein and EGF receptor modulates EGF receptor function. Cell 61, 1339–1347. [DOI] [PubMed] [Google Scholar]
- Wakil S (1989) Fatty acid synthase, a proficient multifunctional enzyme. Biochemistry 28, 4523–4530. [DOI] [PubMed] [Google Scholar]
- Warburg O (1956) On the origin of cancer cells. Science 123, 309–314. [DOI] [PubMed] [Google Scholar]
- Warburg O, Posener KEN (1924) Uber den stoffwechsel der carcinomzelle. Biochem. Z 152, 309. [Google Scholar]
- Weiss L, Hoffmann GE, Schreiber R, Andres H, Fuchs E, Körber E, Kolb HJ (1986) Fatty‐acid biosynthesis in man, a pathway of minor importance. Biol. Chem. 367, 905–912. [DOI] [PubMed] [Google Scholar]
- Worthylake R, Opresko LK, Wiley HS (1999) ErbB‐2 amplification inhibits down regulation and induces constitutive activation of both ErbB‐2 and epidermal growth factor receptors. J. Biol. Chem. 274, 8865–8874. [DOI] [PubMed] [Google Scholar]
- Yarden Y, Sliwkowski MX (2001) Untangling the ErbB signalling network. Nat. Rev. Mol. Cell Biol. 2, 127–137. [DOI] [PubMed] [Google Scholar]
- Zhou W, Simpson PJ, McFadden JM, Townsend CA, Medghalchi SM, Vadlamudi A, Pinn ML, Ronnett GV, Kuhajda FP (2003) Fatty acid synthase inhibition triggers apoptosis during S phase in human cancer cells. Cancer Res. 63, 7330–7337. [PubMed] [Google Scholar]