

Abstract
Objectives
Mechanisms that regulate proliferation of adult neural stem cells are largely unknown. Here, we have investigated the role of microR‐30c (miR‐30c) and its target, semaphoring 3A (sema3A), in regulating adult neurogenesis and mechanisms underlying this process.
Materials and methods
In situ hybridization, immunofluorescence and quantitative real‐time PCR were used to assess complementary expression patterns of miR‐30c and sema3A in mice. Effects of miR‐30c in the subventricular zone (SVZ) were examined by stereotaxic injection of up‐ and down‐regulating lentiviruses. 5′‐bromo‐2′‐deoxyuridine labelling was performed to investigate effects of miR‐30c and sema3A on adult neurogenesis. Real‐time cell assays, morphological analysis and cell cycle measurements were used to reveal the mechanisms by which miR‐30c and sema3A regulate adult neurogenesis.
Results
Expression of miR‐30c negatively correlated with that of sema3A in neurons, and levels of miR‐30c and sema3A correlated positively with numbers of newborn cells in the SVZ and rostral migration stream. miR‐30c and sema3A affected adult neurogenesis by regulating proliferation and differentiation, as well as cycles of stem cells in the SVZ.
Conclusions
miR‐30c and sema3A regulate adult neurogenesis by controlling proliferation and differentiation of stem cells in the SVZ. This finding reveals a novel regulatory mechanism of adult neurogenesis.
Introduction
The principal property of stem cells and pluripotent cells is their proliferative capacity, which peaks during embryonic development. Most cells in the adult brain are quiescent, having lost the ability to self‐renew 1. Two regions, the SVZ bordering the lateral ventricle (LV) and the dentate gyrus of the hippocampus, are the main sources of stem cells in the adult rodent brain; they continuously provide newborn neurons to replace those in existing circuits 2. Adult‐born neurons are considered to play critical roles in maintaining the normal functions of the nervous system and its adaption to the changing environment. Recent reports have proposed that neural stem cells are involved in causing and exacerbating the degenerative diseases, as a result of a compromised or lost capacity for cell renewal. Moreover, a gradual loss of neuronal populations occurs in neurodegenerative diseases and brain trauma. Unravelling the mechanisms that control the renewal of adult stem cells is pivotal for developing novel therapies for such conditions 3, 4, 5, 6.
miRNAs are important regulators both in embryonic development and in adult, due to their differential expression in specific tissue over time 7, 8. Their expressions changes during development, and they are abundant in specific tissues, suggesting that they play their roles at specific stages. miR‐30c is abundant in brain and is known to be critical for the renewal of glioma cells in vitro 9.
Novel research has suggested that the molecules in axon guidance are not only just confined to directing axon elongation but are also associated with cell proliferation. Some genes that encoded axon guidance molecules are located in the chromosome of cancer cells and their promoter regions are highly methylated, suggesting that they play an inhibitory role in cancer 10. Given that cancer cells constantly proliferate 11, these axon‐guidance genes may be involved in cell proliferation and differentiation. Sema3A, a protein involved in repulsive axon guidance, plays roles in neuronal regeneration and polarity 12, 13. Having confirmed that miR‐30c negatively regulates the expression of sema3A in human embryonic kidney 293T (HEK293T) cells 14, and taking these findings together, we set out to determine whether miR‐30c and sema3A play roles in neuronal proliferation and differentiation.
Materials and methods
Animals
Mice were housed under standard laboratory conditions at the Animal Facility of Zhejiang University. The experimental protocols were approved by Zhejiang University Animal Care and Use Committee and conformed to the international guidelines on the ethical use of animals. The experimental animals were male C57BL/6 mice (8–16 weeks old) from the Shanghai Laboratory Animal Center (SLAC, Chinese Academy of Sciences, Shanghai, China).
Vectors construction
Sema3a‐WT‐3′UTR (wild‐type 3′ untranslated region) and sema3a‐MUT‐3′UTR (mutant 3′ untranslated region) were constructed as previously reported 14. The pre‐miRNA sequence of miR‐30c (miR‐30c overexpression, miR‐30c‐OE) was cloned into the lentiviral vector pLVX‐tdTomato. The miR‐30c knockdown vector (miR‐30c‐KD), with 8 tandem repeats of an imperfectly complementary sequence forming a central bulge when binding to miR‐30c, was synthesized and cloned into the lentiviral vector pLVX‐EGFP. One unit of the miR‐30c‐KD sequence was as follows: 5′‐GCTGAGAGTGTGAAGTGTTTACAGCATCG‐3′ (underline indicates the sequence imperfectly complementary to miR‐30c) 15. All the vectors were validated by sequencing.
Cell cultures and transfection
The neuro2A cells used in this study were limited to <10 passages and were cultured in Dulbecco's modified Eagle's medium with 10% foetal bovine serum and 1% penicillin–streptomycin, and they were incubated at 37 °C in a humidified atmosphere with 5% CO2. miR‐30c‐OE was transfected with or without miR‐30c‐KD into neuro2A cells using Lipofectamine 2000 (11668019; Invitrogen, Carlsbad, CA, USA) according to the manufacturer's instructions. To assess the effects of miR‐30c‐OE and miR‐30c‐KD on sema3A, the total RNA at 24, 48 and 72 h after transfection was harvested for quantification by quantitative real‐time PCR (qRT‐PCR).
Primary neuronal culture
Dissection of the SVZ and isolation of the neural stem cells and progenitor cells from E18 mice were performed as previously described 16. miR‐30c‐OE, miR‐30c‐KD and control plasmid were individually transfected into isolated cells by electroporation (Amaxa Nucleofector II, Lonza, Switzerland). Then, the cells were seeded on poly (l‐lysine)‐coated coverslips in 6‐well plates and cultured in Neurobasal medium containing 1% penicillin–streptomycin supplemented with 2 mm l‐glutamine and B27. Two weeks after seeding, the cells were fixed with 4% paraformaldehyde for morphological examination.
Dual luciferase reporter assay
miR‐30c‐OE was transfected with psiCHECK‐2‐sema3a‐WT‐3′UTR or psiCHECK‐2‐sema3a‐MUT‐3′UTR into HEK293T cells using 1 μL Lipofectamine 2000 (11668019; Invitrogen). Six hours after transfection, parallel wells were re‐transfected with miR‐30c‐KD. The activity of both firefly and Renilla luciferase was assayed at 24 h after the last transfection using a Dual Luciferase Reporter Kit (E1910; Promega, Madison, WI, USA) and a DLReady Veritas 96‐well plate luminometer (Turner Biosystems, Madison, WI, USA). The whole procedure was carried out according to the manufacturer's protocol. Experimental replication and data calculation were performed as previously described 17.
Quantitative RT‐PCR
The relative expression of miR‐30c, sema3a and miR‐30c‐KD was determined by two steps of quantitative RT‐PCR. To avoid the influence of the RNA extraction procedure and to guarantee the reliability of the endogenous internal controls, the spike‐in miRNA, cel‐miR‐39 (Qiagen, Hilden, Germany), was added to the cell lysate before miRNA extraction 18. The cDNA of mRNA was synthesized with a Universal cDNA kit (RR047A; Takara, Dalian, China), and the cDNA of microRNA was synthesized with the specific stem‐loop primer. Then, PCR reactions containing SYBR Green Mix (RR39LR, Takara) were performed on a CFX96 (Bio‐Rad, Hercules, CA, USA) with specific amplification primers (Invitrogen) (Table S1). The relative miRNA and mRNA levels were computed using the 2−ΔΔCt method, where Snord2 and NADPH served as internal controls for miRNA and mRNA, respectively. All reactions were run in triplicate 14.
In situ hybridization
Digoxigenin‐labelled locked nucleic acid detection riboprobes for miR‐30c and sema3A were used (Exqion) (Table S2) 19. The proteinase treatment, endogenous peroxidase quenching, pre‐hybridization and hybridization procedures were performed as described 20. After hybridization, the horseradish peroxidase‐tagged anti‐digoxigenin antibody (11207733910; Roche, Basel, Switzerland) was added to recognize the digoxigenin moieties on probes.
Lentivirus packaging and stereotaxic injection
Lentiviruses were produced as previously described 21, 22. The lentivirus titres for in vivo microinjection were in the range from 5 × 10⁸ to 1 × 10⁹ transducing units (TU)/ml, and the same infectivity of lentivirus (106 TU) was injected into the right SVZ of 8‐week‐old mice. Mice were deeply anesthetized with pentobarbital sodium (P3761; Sigma‐Aldrich, St. Louis , MO, USA) before positioning them in a stereotaxic frame (RWD Life Science Co. Ltd, Shenzhen, China). Coordinates from bregma were AP +0.86, ML −0.8 and DV −3.8 mm for lentivirus injection 23. A subgroup of mice was killed 2 weeks after injection to assess the expression of miR‐30c in the SVZ.
Fluorescence‐Activated Cell Sorting (FACS)
Eight mice from each group (2 weeks after stereotaxic injection) were anesthetized with pentobarbital sodium (P3761; Sigma‐Aldrich). Brain slice preparation, micro‐dissection and dissociation were carried out as per previous report 20. Cells infected with miR‐30c‐OE and miR‐30c‐KD were each isolated by FACS based on their tagged fluorescent proteins.
BrdU labelling and quantification
BrdU (50 μg/g body weight, i.p.) was used to label newborn cells in the SVZ, and mice were killed 4 h after injection. To evaluate the migration of newborn cells in the rostral migration stream (RMS), mice were given one daily injection of BrdU for 7 days (n = 4 mice/group) 24.
Sectioning of the brain and calculation of the newborn cells in the SVZ were carried out as in a previous report with minor modifications 25. Six sets of sagittal sections (20 μm/section) from each mouse were obtained by cutting the right hemisphere in the lateral to medial direction. Each set provided a representative sample of the total SVZ. Sections with ventricles in the first set were selected for calculation (15 sections). The number of newborn cells were counted under the same conditions and photographed with identical microscope settings. Another parallel set of sections was used to count the number of newborn cells in the RMS. The cells were counted and analysed in a blinded fashion. The proliferation rates were estimated as the number of BrdU‐positive cells per unit area, and the mean proliferation rate for each group was calculated by averaging the rates of animals from animals in the same group (n = 4 mice/group).
Immunofluorescence
The primary antibodies used were mouse anti‐BrdU (B8434; Sigma‐Aldrich), mouse anti‐Nestin (MAB353; Millipore), rabbit anti‐S100β (S2644; Sigma‐Aldrich), rabbit anti‐NeuN (MABN140; Millipore, Boston, MA, USA), mouse anti‐PSA‐NCAM (MAB5324; Millipore), rabbit anti‐GFAP (ARH4195; AR, San Diego, CA, USA), goat anti‐sema3A (sc‐1147; Santa Cruz, Shanghai, China) and rabbit anti‐Tuji (T2200; Sigma‐Aldrich). The secondary antibodies were Alexa Fluor 546 donkey anti‐mouse IgG (A10036; Thermo Scientific, Waltham, MA, USA), Alexa Fluor 488 donkey anti‐rabbit IgG (CA21206s; Invitrogen) and Alexa Fluor 568 donkey anti‐goat (A‐11057; Thermo). Immunofluorescence of BrdU and the other proteins was measuring using standard procedures 25.
Proliferation detection
Neuro2A cells were transfected with miR‐30c‐OE or miR‐30c‐KD using Lipofectamine 2000 (11668019; Invitrogen). Ten hours after transfection, the cells were trypsinized, counted and suspended in culture medium. E16 plates from the real‐time cell analysis instrument (ACEA Biosciences Inc., San Diego, CA, USA) were calibrated with 50 μl of the same medium. Then, the cells were plated at 20 000/wells with fresh medium in a final volume of 150 μl. The xCELLigence software (ACEA Biosciences Inc.) records the impedance signal and converts it into the Cell Index, which is used as a measure of proliferation (the original explanation of the Cell Index is in the website: http://www.aceabio.com/theory.aspx?cateid=281). The impedance signals were recorded for 240 sweeps at 15 min intervals to assess proliferation 26.
Cell‐cycle measurement
Neuro2A cells transfected with vehicle control, miR‐30c‐OE or miR‐30c‐KD were harvested and incubated with propidium iodide buffer (50 μg/ml propidium iodide, Sigma; 10 μg/ml RNAase A, Thermo; 0.3% Triton X‐100, Amresco; 0.1% sodium citrate, Merk) for 30 min at room temperature 27. Stained cells were subjected to flow cytometric analysis using 10 000 cells/sample (FlowCytometer; Beckman Coulter, Brea, CA) and analysed using Wincycle 32 software (Beckman Coulter).
Statistical analysis
Data are presented as mean ± SD. Differences were assessed using one‐way analysis of variance (ANOVA) with SPASS version 20.0 (SPSS Inc., Chicago, IL, USA), and P < 0.05 was considered statistically significant.
Results
Negative correlation between miR‐30c and sema3A
To determine the distribution of miR‐30c and sema3A in the brain, in situ hybridization was applied to the SVZ, olfactory bulb and hippocampus. The results showed that miR‐30c was abundant at the anterior lateral walls of the LV and sema3A had a complementary reversed distribution. Furthermore, miR‐30c and sema3A were also complementarily distributed in the olfactory bulb and hippocampus (Fig. 1a). We had found preliminary evidence that the level of sema3A is controlled by miR‐30c 14. To confirm this relationship, miR‐30c‐KD, which captures miR‐30c by binding to miR‐30c mature sequences, was added in a luciferase assay. Without miR‐30c‐KD, the sema3A level was significantly reduced by miR‐30c. When miR‐30c‐KD was added, this inhibitory effect was partly relieved. However, when the sites on the 3′UTR of sema3A that binding to miR‐30c were mutated, miR‐30c had no effect on the level of mutant sema3A and the subsequent addition of miR‐30c‐KD did not further elevate its level. These results demonstrated that miR‐30c negatively regulates sema3A by the binding sites between its seed sequence and the 3′UTR of sema3A (Fig. 1b).
Figure 1.
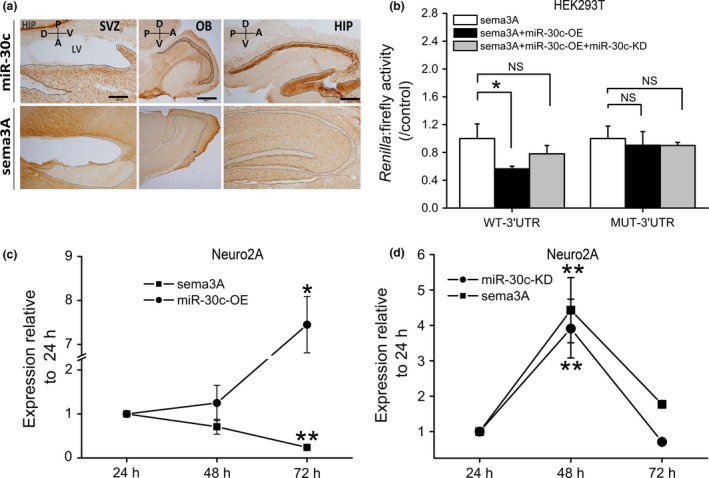
Negative association between miR‐30c and sema3A in mouse brain. (a) Representative images of complementary distribution of miR‐30c and sema3A as visualized by in situ hybridization. LV, lateral ventricle; SVZ, subventricular zone; OB, olfactory bulb; HIP, hippocampus. Domains abundant in miR‐30c and lacking sema3A are indicated by the outlines. Scale bars, 200 μm in SVZ and HIP; 200 μm in OB. (b) Inhibitory effect of miR‐30c on sema3A expression assessed by dual luciferase assays in HEK‐293T cells (n = 3 wells/group). WT‐3′UTR, wild‐type 3′UTR of sema3A; MUT‐3′UTR, mutant 3′UTR of sema3A. Data normalized to wells with sema3A transfection only. The data are representative of two independent experiments. Data passed Kolmogorov–Smirnov normality test: one‐way ANOVA followed by Bonferroni post‐test. (c, d) Effects of up‐ and down‐regulated miR‐30c on the expression of sema3A in neuro2A cells assessed by qRT‐PCR (n = 3 wells/group). (c) Neuro2A cells transfected with miR‐30c‐OE only; (d) neuro2A cells co‐transfected with miR‐30c‐OE and miR‐30c‐KD. The data are representative of three independent experiments and normalized to the value at 24 h. Data were analysed by one‐way ANOVA followed by Dunnett's T3 post‐test. All data are shown as mean ± SD, *P < 0.05, **P < 0.01, NS, not significant. miR‐30c‐OE, miR‐30c overexpression; miR‐30c‐KD, miR‐30c knockdown.
The inhibitory effect of miR‐30c on sema3A was further evaluated in neuro2A cells using the overexpression (miR‐30c‐OE) and knockdown (miR‐30c‐KD) vectors. The addition of miR‐30c‐OE increased the level of miR‐30c and decreased that of sema3A, reflecting their inverse expression with time (Fig. 1c). Interestingly, when miR‐30c‐KD was co‐transfected with miR‐30c‐OE, the expression of sema3A was highly correlated with that of miR‐30c‐KD (Fig. 1d). Taken together, the sema3A level is reduced by miR‐30c in neurons.
Sema3A is abundant in neuronal progenitors and neurons in the SVZ
To investigate the roles of sema3A in vivo, we first examined the neuronal lineage distribution of sema3A in the SVZ. Double staining showed that neuronal progenitor cells and mature neurons expressed sema3A‐immunoreactive cells (Fig. 2a,b). However, sema3A was not detectable in cells immunoreactive for nestin, a marker of neural stem cells (Fig. 2c). Sema3A was scarcely expressed by ependymal cells or S100β‐positive cells in the SVZ (Fig. 2d), both of which are candidate neural stem cells. The distinct neuronal lineage distribution of sema3A suggested that it plays a role in neuronal proliferation and differentiation in the SVZ.
Figure 2.
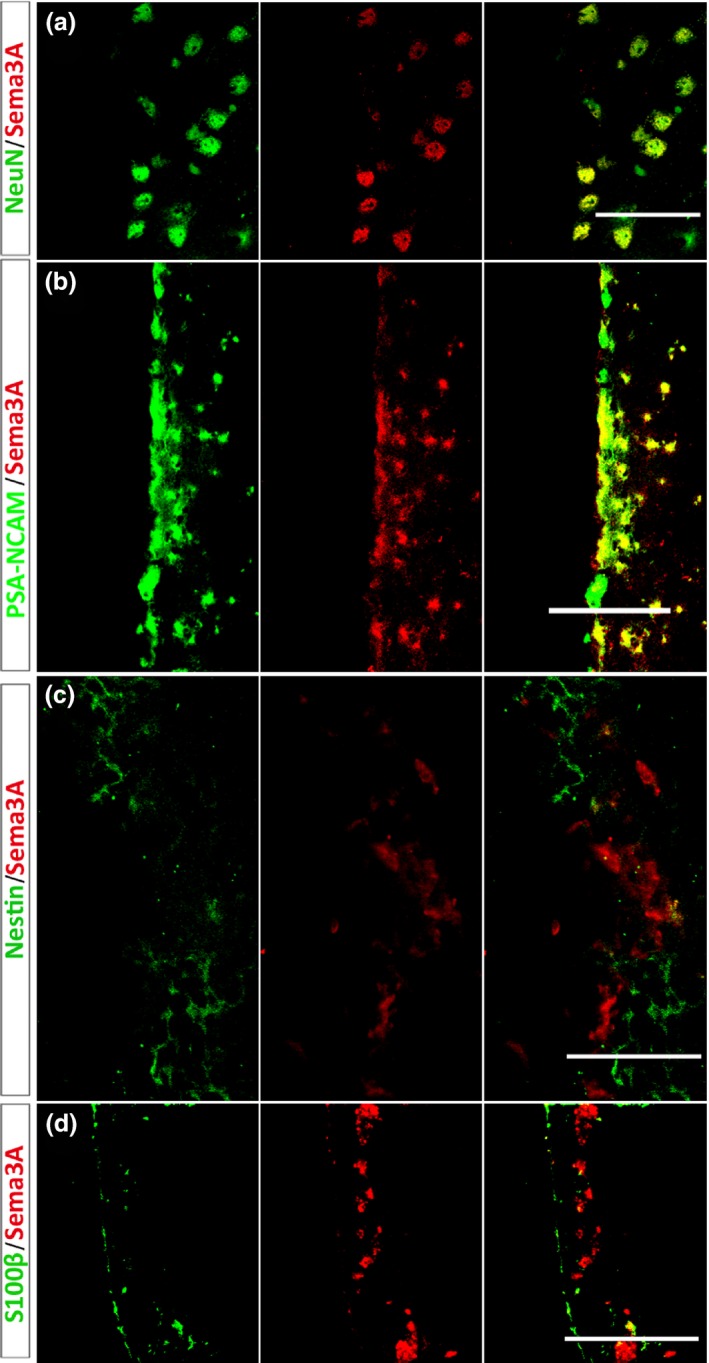
Lineage distribution of sema3A in the subventricular zone (SVZ) of adult mouse brain detected by double immunofluorescence (n = 6 sections per mouse, 4 mice per group). (a, b) Sema3A is expressed in PSA‐NCAM‐positive migratory neuroblasts and NeuN‐positive mature neurons. (c, d) Sema3A‐immunoreactivity is absent from Nestin‐immunoreactive cells and S100β‐immunoreactive ependymal cells. Scale bars, 50 μm in (a) and (c); 100 μm in (b) and (d).
miR‐30c increases stem cell proliferation by negative regulation of sema3A
The distinct lineage distribution of sema3A prompted us to explore its role on neuronal proliferation and differentiation in the SVZ. Since the above results confirmed that sema3A is negatively regulated by miR‐30c, up‐ and down‐regulation of sema3A in vivo could be achieved by knockdown and overexpression of miR‐30c. We constructed lentiviral vectors for the overexpression and knockdown of miR‐30c and tagged them with tdTomato (red) and EGFP (enhanced green fluorescent protein), respectively (Fig. 3a). These fluorescent protein‐tagged viral vectors were successfully expressed by integration into the genomes of the SVZ cells after stereotactic injection (Fig. 3b,c).
Figure 3.
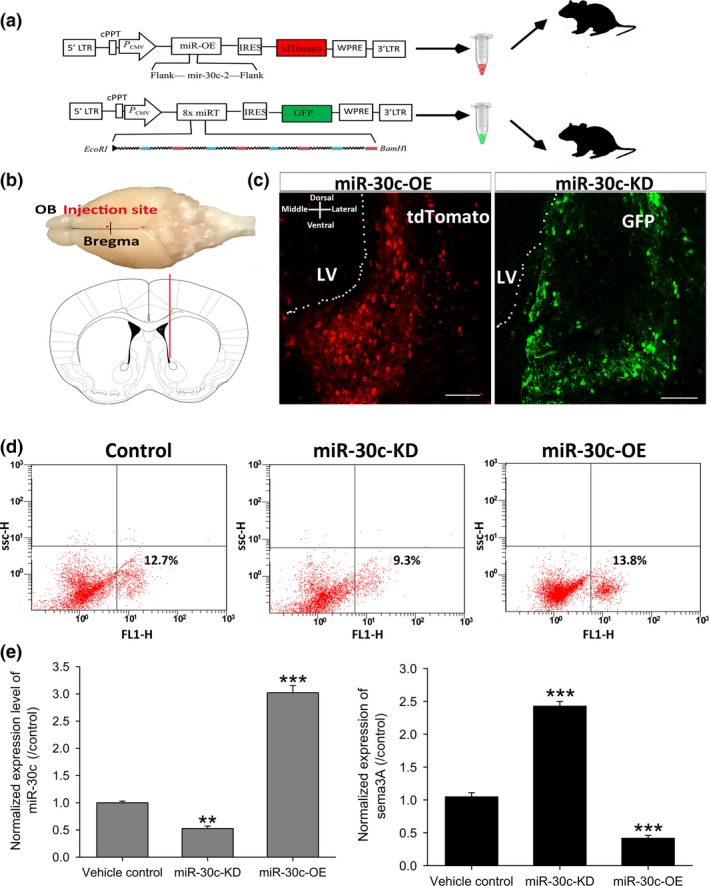
Biosensor fidelity of miR‐30c and sema3A in vivo . (a, b) Schematics of vector construction (a) and experimental approach (b) to generate an miR‐30c reporter system in the SVZ of mice. miR‐30c‐OE and miR‐30c‐KD vectors were tagged with tdTomato and EGFP, respectively. Stereotaxic injection site: AP +0.86, ML −0.8 and DV −3.8 mm. (c) Representative images of miR‐30c‐OE and miR‐30c‐KD expression in the SVZ 2 weeks after stereotaxic injection. Scar bars, 50 μm. (d, e) FACS of cells expressing the miR‐30c‐OE and miR‐30c‐KD followed by qRT‐PCR for quantification of miR‐30c and sema3A. n = 8 mice/group. Data were normalized to vehicle control and analysed by one‐way ANOVA. All data are shown as mean ± SD, **P < 0.01, ***P < 0.001. miR‐30c‐OE, miR‐30c overexpression; miR‐30c‐KD, miR‐30c knockdown; OB, olfactory bulb; LV, lateral ventricle.
To assess whether these viral vectors served as indicators for the levels of miR‐30c and sema3A in SVZ cells, fluorescent protein‐tagged SVZ cells were sorted by flow cytometry and the levels of miR‐30c and sema3A were then quantified using qRT‐PCR. The results revealed that the miR‐30c‐OE and miR‐30c‐KD vectors gave rise to the corresponding changes in the level of miR‐30c. The miR‐30c level in cells infected with miR‐30c‐OE increased 3.12 ± 0.031‐fold (P < 0.001), while the level decreased in cells infected with miR‐30c‐KD (0.62 ± 0.013‐fold, P < 0.01). Moreover, the sema3A level was negatively correlated with that of miR‐30c in these lentivirus‐infected SVZ cells. The level of sema3A decreased (0.41 ± 0.012‐fold versus control, P < 0.001) when the miR‐30c level increased in miR‐30c‐OE‐expressing cells. Correspondingly, there was a remarkable increase in sema3A (2.48 ± 0.02‐fold versus control, P < 0.001) when miR‐30c expression decreased in miR‐30c‐KD‐expressing cells (Fig. 3d,e).
The above findings demonstrated that miR‐30c‐OE and miR‐30c‐KD as miR‐30c biosensors successfully intervened in the expression of sema3A in vivo. To investigate the role of sema3A in adult neurogenesis, newborn cells were traced with BrdU, a nucleotide analogue that integrates into the genome during DNA duplication. In the miR‐30c‐OE group, the number of BrdU‐labelled newborn cells in the SVZ was strikingly higher (3.12 ± 0.4‐fold, log2 transformed, P < 0.001) than that in the control littermates. In contrast, the number of labelled cells in the miR‐30c‐KD group was lower than that in control littermates (‐1.02 ± 0.21‐fold, log2 transformed, P = 0.43), suggesting a negative role of sema3A in regulating the proliferation of stem cells (Fig. 4a–c). However, other than changes in the proliferative capacity, apoptosis can also result in changes in neuronal lineages. To exclude the possibility that apoptosis induced the discrepancy of newborn cells in the adult SVZ, TUNEL labelling was used to detect apoptosis in the SVZ, and quantification revealed no significant difference among the three groups of mice (Fig. S1).
Figure 4.
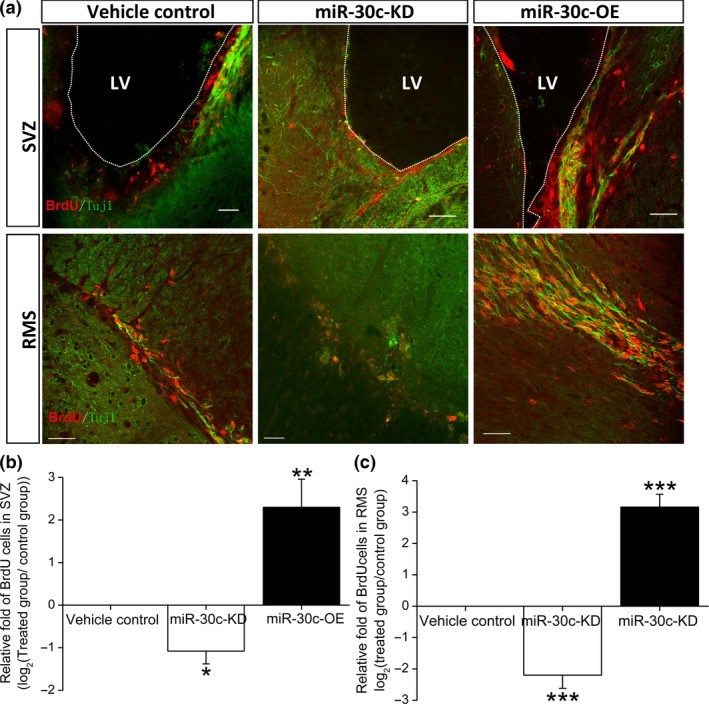
Effects of miR‐30c and sema3A on cells born in the adult mouse SVZ. (a) Representative images of newborn cells in the SVZ 4 h after intraperitoneal injection of BrdU and in the rostral migration stream (RMS) 7 days after cumulative administration of BrdU. Scale bars, 40 μm. (b, c) Numbers of newborn cells in the adult SVZ (b) and RMS (c). Data were normalized to vehicle control and transformed to log2 values. *P < 0.05, **P < 0.01, ***P < 0.001 by one‐way ANOVA followed by the Bonferroni post‐test; n = 15 sections/mouse, 4 mice/group.
Roles of miR‐30c and sema3A in neuronal proliferation and differentiation
Proliferation and differentiation are mutually exclusive in a given cell. Having demonstrated that elevated miR‐30c and reduced sema3A in the SVZ increased proliferation, we inferred that these processes probably inhibit differentiation. SVZ cells infected with miR‐30c‐OE had fewer neurites than miR‐30c‐KD‐infected cells, suggesting a negative effect of miR‐30c and a positive effect of sema3A on neuronal differentiation. (Fig. 5a,b). Further, proliferation assays showed more proliferation of neuro2A cells infected with miR‐30c‐OE and less proliferation in the miR‐30c‐KD group, demonstrating the stimulatory effect of miR‐30c and inhibitory effect of sema3A on neuronal proliferation (Fig. 5c).
Figure 5.
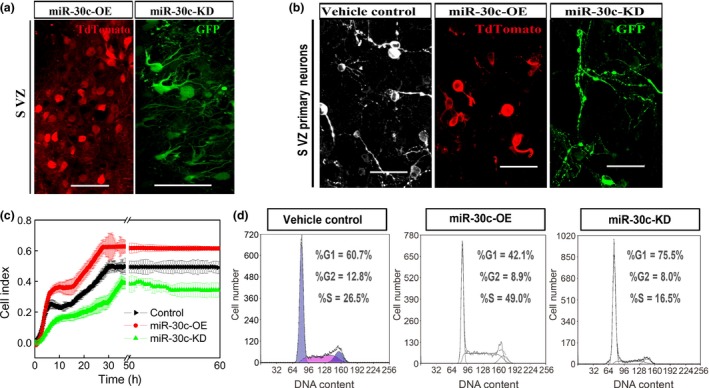
Effects of miR‐30c on the proliferation and differentiation of cells in the subventricular zone (SVZ). (a, b) Representative images showing the effects of miR‐30c overexpression (OE) and knockdown (KD) on the morphology of neurons in the SVZ after stereotaxic injection (a) and in primary culture (b). Scale bars, 50 μm. (c) Effects of miR‐30c OE and KD on the proliferation of neuro2A cells by real‐time cell analysis. Curves represent the mean ± SD cell index value from 3 wells. The index was normalized to the star‐point value. (d) Cell‐cycle assessment by flow cytometry. n = 3 wells/group and the data are representative of three independent experiments.
Roles of miR‐30c and sema3A in the cell cycle
To further disclose the mechanisms by which miR‐30c and sema3A modulate neuronal proliferation and differentiation, we investigated the cell cycle in neuro2A cells infected with miR‐30c‐OE or miR‐30c‐KD. When the cells expressed miR‐30c‐OE, cell cycling was stimulated, as shown by the increased proportion of cells in the G2 + M stages (1.47‐fold, P = 0.021). In contrast, in neuro2A cells that expressed miR‐30c‐KD, cell cycling was inhibited, as indicated by the increased proportion of cells in G1 (1.35‐fold, P < 0.001) (Fig. 5d). Taken together, miR‐30c regulates adult neurogenesis by modulating the cell cycle.
Discussion
Here, we confirmed that miR‐30c is a negative regulator of sema3A both in vitro and in vivo. Up‐ and down‐regulation of miR‐30c and sema3A demonstrated that adult neurogenesis is closely associated with their levels in the SVZ. Elevated miR‐30c and reduced sema3A resulted in a significantly increased numbers of newborn cells in the adult SVZ and RMS. On the other hand, reduced miR‐30c and elevated sema3A led to a dramatic decrease in newborn cells in the adult SVZ and RMS. Furthermore, neuronal morphology, proliferation and cell‐cycle data revealed that miR‐30c and sema3A control adult neurogenesis by acting on the cell cycle to ultimately regulate the proliferation and differentiation of stem cells in the SVZ.
Adult neurogenesis is conserved across evolutionary boundaries from crustaceans to higher vertebrates 28, 29. Although adult neurogenesis in mammals is restricted to a few regions, it contributes a certain degree of plasticity to the adult brain 2, 30. Evidence suggests that the capacity for adult neurogenesis is determined by the proliferative and differentiated states of adult stem cells 31, 32. A correlation between differentiation and cell‐cycle lengthening has been reported in several cell lineages in vitro and in vivo 33. Neuronal differentiation is accompanied by exit from the cell cycle into the quiescent G0 phase, and the length of G1 is the key factor that influences the balance between neuronal precursor and the differentiated neuron 34, 35. Generally, when the inhibitors of the cell‐cycle process are reduced, then an increase in proliferation and the number of neuronal precursors and stem cells follows 36. In the last decade, researchers have provided a detailed explanation of the mechanisms underlying cell‐cycle length, especially the duration of G1 in determining the terminal differentiation of neurons 37, 38. Changes of cytokines and their associated transcriptional factors impact directly on adult neurogenesis 39, 40, 41. The cytokines are non‐uniformly distributed in the stem‐cell niche during neurogenesis. Actually, many cytokines are expressed in specific tissues at certain times, and this leads to asynchronous cell division 42. The cortical plate in cyclin‐dependent kinase 2(cdk2) and cdk4 double‐knockout mice is reduced by ≥46% at embryonic day 13.5, and correspondingly, the basal progenitor populations are severely reduced 43. Although the knockout cells retain the ability to replicate, G1 is lengthened, resulting in premature symmetric neurogenic divisions, and over time the neuronal output is reduced 44. Besides these functions of cytokines in the cell cycle, some transcriptional factors are directly involved. Karsten et al. have provided evidence from the in vitro microarray data that the expression of transcriptional factors differs dramatically between proliferating neuronal stem cells and differentiating neurons. By focusing on proteins that are specifically enriched in vivo in the proliferating neuroepithelial zones, specific transcriptional factors such as Sox3 and FoxM1 have been shown to play roles in the cell cycle and cell fate events 45. The above findings show that cell proliferation and differentiation as two mutually exclusive processes are critical in maintaining a dynamic balance of neurogenesis.
miRNAs are key regulators of development, owing to their roles in large‐scale transcriptomic changes that occur during cell‐fate transitions. miRNAs are specifically expressed in somatic stem and progenitor cells, and they are considered to be involved in haematopoiesis and myogenesis, as well as skin and neural development. miRNA functions are precisely regulated during development to promote and stabilize cell‐fate choice, and they are integrated within the regulatory networks as positive and negative modulators 46, 47, 48, 49. These regulatory networks result in a refined molecular response system that enables proper cellular proliferation, differentiation and function. miR‐30c, an abundant miRNA in brain, has been reported to enable the proliferation of C6 glioma cells and simultaneously inhibit their differentiation 9. In our study, using the methods of SVZ microdomain intervention, morphological analysis, cell‐cycle analysis and cell‐proliferation assays, miR‐30c was demonstrated to stimulate the proliferation and inhibit the differentiation of stem cells in the adult SVZ.
Neural stem cells and their precursors initially undergo symmetric proliferative cell divisions to expand the progenitor pool. Later, they switch to asymmetric division to generate cellular diversity and asynchronous growth within the stem‐cell regions 50, 51. Sema3A has the ability to regulate neuronal polarization by suppressing axon formation and promoting dendrite growth when it is added to hippocampal neurons in culture 12. Consistent with this, we found that a high level of sema3A (low level of miR‐30c) resulted in reduced cell proliferation, while a low level of sema3A (high level of miR‐30c) led to increased cell proliferation in the SVZ.
In conclusion, miR‐30c, a negative regulator of sema3A, determines the number of newborn neurons in the adult SVZ by regulating the proliferation and differentiation of stem cells. Although further work is required to identify the downstream molecules mediating the miR‐30c/sema3A signal, miR‐30c/sema3A could serve as targets in treatment of neurodegenerative diseases and other brain trauma in the perspective of stimulation of endogenous regenerative processes.
Competing interests
The authors declare that no financial or other potential competing interests exist with regard to this study.
Author contributions
TS and SL conceived the project and designed the experiments; TS and WL performed the immunofluorescence experiments, stereotaxic injection and animal care; TS performed the vectors construction, FACS sorting, qRT‐PCR and cell‐cycle evaluation; analysed the data; and wrote the manuscript; SL financially and administratively supported this project. All authors made critical revisions of the manuscript and all approved the final version.
Supporting information
Fig. S1. Cellular apoptosis detection by terminal deoxynucleotidyl transferase dUTP nick‐end labelling (TUNEL) assay. (A) Apoptosis cells were restricted to subventricular zone microdomains. Scale bar, 100 μm. (B) Quantification of cellular apoptosis in SVZ. n = 6 sections, data were determined by one‐way ANOVA, followed by LSD test. MiR‐30c‐KD, miR‐30c knockdown; miR‐30c‐OE, miR‐30c overexpression; control, sham group.
Table S1. Quantitative RT‐PCR primers
Table S2. Sequences for in situ hybridization
Acknowledgements
We thank members of Prof. Ling's lab for suggestions and discussions, Prof. IC Bruce for reading the article, and the core facilities of Zhejiang University Institute of Neuroscience for technical assistance. This work was supported by the National Natural Science Foundation of China (81371404 and 81571243).
References
- 1. Cheng A, Wang S, Cai J, Rao MS, Mattson MP (2003) Nitric oxide acts in a positive feedback loop with BDNF to regulate neural progenitor cell proliferation and differentiation in the mammalian brain. Dev. Biol. 258, 319–333. [DOI] [PubMed] [Google Scholar]
- 2. Lledo PM, Alonso M, Grubb MS (2006) Adult neurogenesis and functional plasticity in neuronal circuits. Nat. Rev. Neurosci. 7, 179–193. [DOI] [PubMed] [Google Scholar]
- 3. Jordan JD, Ming GL, Song H (2006) Adult neurogenesis as a potential therapy for neurodegenerative diseases. Discov. Med. 6, 144–147. [PubMed] [Google Scholar]
- 4. Huang KF, Hsu WC, Chiu WT, Wang JY (2012) Functional improvement and neurogenesis after collagen‐GAG matrix implantation into surgical brain trauma. Biomaterials 33, 2067–2075. [DOI] [PubMed] [Google Scholar]
- 5. Niv F, Keiner S, Krishna Witte OW, Lie DC, Redecker C (2012) Aberrant neurogenesis after stroke: a retroviral cell labeling study. Stroke 43, 2468–2475. [DOI] [PubMed] [Google Scholar]
- 6. Winner B, Winkler J (2015) Adult neurogenesis in neurodegenerative diseases. Cold Spring Harb. Perspect. Biol. 7, a021287. [DOI] [PMC free article] [PubMed] [Google Scholar]
- 7. Shenoy A, Blelloch RH (2014) Regulation of microRNA function in somatic stem cell proliferation and differentiation. Nat. Rev. Mol. Cell Biol. 15, 565–576. [DOI] [PMC free article] [PubMed] [Google Scholar]
- 8. Wakabayashi T, Hidaka R, Fujimaki S, Asashima M, Kuwabara T (2014) MicroRNAs and epigenetics in adult neurogenesis. Adv. Genet. 86, 27–44. [DOI] [PubMed] [Google Scholar]
- 9. Chao CC, Kan D, Lu KS, Chien CL (2015) The role of microRNA‐30c in the self‐renewal and differentiation of C6 glioma cells. Stem Cell Res. 14, 211–223. [DOI] [PubMed] [Google Scholar]
- 10. Ma WJ, Zhou Y, Lu D, Dong D, Tian XJ, Wen JX et al (2014) Reduced expression of Slit2 in renal cell carcinoma. Med. Oncol. 31, 768. [DOI] [PubMed] [Google Scholar]
- 11. Plaks V, Kong N, Werb Z (2015) The cancer stem cell niche: how essential is the niche in regulating stemness of tumor cells? Cell Stem Cell 16, 225–238. [DOI] [PMC free article] [PubMed] [Google Scholar]
- 12. Shelly M, Cancedda L, Lim BK, Popescu AT, Cheng PL, Gao H et al (2011) Semaphorin3A regulates neuronal polarization by suppressing axon formation and promoting dendrite growth. Neuron 71, 433–446. [DOI] [PMC free article] [PubMed] [Google Scholar]
- 13. Omoto M, Yoshida S, Miyashita H, Kawakita T, Yoshida K, Kishino A et al (2012) The semaphorin 3A inhibitor SM‐345431 accelerates peripheral nerve regeneration and sensitivity in a murine corneal transplantation model. PLoS ONE 7, e47716. [DOI] [PMC free article] [PubMed] [Google Scholar]
- 14. Sun T, Li S, Yang J, Yin Y, Ling S (2014) Identification of a microRNA regulator for axon guidance in the olfactory bulb of adult mice. Gene 547, 319–328. [DOI] [PubMed] [Google Scholar]
- 15. Ebert MS, Neilson JR, Sharp PA (2007) MicroRNA sponges: competitive inhibitors of small RNAs in mammalian cells. Nat. Methods 4, 721–726. [DOI] [PMC free article] [PubMed] [Google Scholar]
- 16. Guo W, Patzlaff NE, Jobe EM, Zhao X (2012) Isolation of multipotent neural stem or progenitor cells from both the dentate gyrus and subventricular zone of a single adult mouse. Nat. Protoc. 7, 2005–2012. [DOI] [PMC free article] [PubMed] [Google Scholar]
- 17. Subramanyam D, Lamouille S, Judson RL, Liu JY, Bucay N, Derynck R et al (2011) Multiple targets of miR‐302 and miR‐372 promote reprogramming of human fibroblasts to induced pluripotent stem cells. Nat. Biotechnol. 29, 443–448. [DOI] [PMC free article] [PubMed] [Google Scholar]
- 18. Peng H, Zhong M, Zhao W, Wang C, Zhang J, Liu X et al (2013) Urinary miR‐29 correlates with albuminuria and carotid intima‐media thickness in type 2 diabetes patients. PLoS ONE 8, e82607. [DOI] [PMC free article] [PubMed] [Google Scholar]
- 19. Thomsen R, Nielsen PS, Jensen TH (2005) Dramatically improved RNA in situ hybridization signals using LNA‐modified probes. RNA 11, 1745–1748. [DOI] [PMC free article] [PubMed] [Google Scholar]
- 20. Shi Z, Johnson JJ, Stack MS (2012) Fluorescence In Situ Hybridization for MicroRNA Detection in Archived Oral Cancer Tissues. J. Oncol. 2012, 903581. [DOI] [PMC free article] [PubMed] [Google Scholar]
- 21. Gentner B, Schira G, Giustacchini A, Amendola M, Brown BD, Ponzoni M et al (2009) Stable knockdown of microRNA in vivo by lentiviral vectors. Nat. Methods 6, 63–66. [DOI] [PubMed] [Google Scholar]
- 22. Li Z, Ling L, Liu X, Laus R, Delcayre A (2010) A flow cytometry‐based immuno‐titration assay for rapid and accurate titer determination of modified vaccinia Ankara virus vectors. J. Virol. Methods 169, 87–94. [DOI] [PubMed] [Google Scholar]
- 23. Paxinos G, Franklin KBJ (2001) The Mouse Brain in Stereotaxic Coordinates. 2nd edn, pp. 72–76. San Diego: Academic Press. [Google Scholar]
- 24. Wojtowicz JM, Kee N (2006) BrdU assay for neurogenesis in rodents. Nat. Protoc. 1, 1399–1405. [DOI] [PubMed] [Google Scholar]
- 25. Encinas JM, Enikolopov G (2008) Identifying and quantitating neural stem and progenitor cells in the adult brain. Method Cell Biol. 85, 243–272. [DOI] [PubMed] [Google Scholar]
- 26. Roshan Moniri M, Young A, Reinheimer K, Rayat J, Dai LJ, Warnock GL (2015) Dynamic assessment of cell viability, proliferation and migration using real time cell analyzer system (RTCA). Cytotechnology 67, 379–386. [DOI] [PMC free article] [PubMed] [Google Scholar]
- 27. Hui W, Yuntao L, Lun L, WenSheng L, ChaoFeng L, HaiYong H et al (2013) MicroRNA‐195 inhibits the proliferation of human glioma cells by directly targeting cyclin D1 and cyclin E1. PLoS ONE 8, e54932. [DOI] [PMC free article] [PubMed] [Google Scholar]
- 28. Harzsch S, Dawirs RR (1996) Neurogenesis in the developing crab brain: postembryonic generation of neurons persists beyond metamorphosis. J. Neurobiol. 29, 384–398. [DOI] [PubMed] [Google Scholar]
- 29. Gould E, Reeves AJ, Graziano MS, Gross CG (1999) Neurogenesis in the neocortex of adult primates. Science 286, 548–552. [DOI] [PubMed] [Google Scholar]
- 30. Hess DC, Borlongan CV (2008) Stem cells and neurological diseases. Cell Prolif. 41(Suppl 1), 94–114. [DOI] [PMC free article] [PubMed] [Google Scholar]
- 31. Bordiuk OL, Smith K, Morin PJ, Semenov MV (2014) Cell proliferation and neurogenesis in adult mouse brain. PLoS ONE 9, e111453. [DOI] [PMC free article] [PubMed] [Google Scholar]
- 32. Ulrich H, Bocsi J, Glaser T, Tarnok A (2014) Cytometry in the brain: studying differentiation to diagnostic applications in brain disease and regeneration therapy. Cell Prolif. 47, 12–19. [DOI] [PMC free article] [PubMed] [Google Scholar]
- 33. Lange C, Calegari F (2010) Cdks and cyclins link G1 length and differentiation of embryonic, neural and hematopoietic stem cells. Cell Cycle 9, 1893–1900. [DOI] [PubMed] [Google Scholar]
- 34. Calegari F, Haubensak W, Haffner C, Huttner WB (2005) Selective lengthening of the cell cycle in the neurogenic subpopulation of neural progenitor cells during mouse brain development. J. Neurosci. 25, 6533–6538. [DOI] [PMC free article] [PubMed] [Google Scholar]
- 35. Lacomme M, Liaubet L, Pituello F, Bel‐Vialar S (2012) NEUROG2 drives cell cycle exit of neuronal precursors by specifically repressing a subset of cyclins acting at the G1 and S phases of the cell cycle. Mol. Cell. Biol. 32, 2596–2607. [DOI] [PMC free article] [PubMed] [Google Scholar]
- 36. Carruthers S, Mason J, Papalopulu N (2003) Depletion of the cell‐cycle inhibitor p27(Xic1) impairs neuronal differentiation and increases the number of ElrC(+) progenitor cells in Xenopus tropicalis. Mech. Dev. 120, 607–616. [DOI] [PubMed] [Google Scholar]
- 37. Cremisi F, Philpott A, Ohnuma S (2003) Cell cycle and cell fate interactions in neural development. Curr. Opin. Neurobiol. 13, 26–33. [DOI] [PubMed] [Google Scholar]
- 38. Zhang RL, Zhang ZG, Lu M, Wang Y, Yang JJ, Chopp M (2006) Reduction of the cell cycle length by decreasing G1 phase and cell cycle reentry expand neuronal progenitor cells in the subventricular zone of adult rat after stroke. J. Cereb. Blood Flow Metab. 26, 857–863. [DOI] [PubMed] [Google Scholar]
- 39. Doetsch F, Verdugo JM, Caille I, Alvarez‐Buylla A, Chao MV, Casaccia‐Bonnefil P (2002) Lack of the cell‐cycle inhibitor p27Kip1 results in selective increase of transit‐amplifying cells for adult neurogenesis. J. Neurosci. 22, 2255–2264. [DOI] [PMC free article] [PubMed] [Google Scholar]
- 40. Beukelaers P, Vandenbosch R, Caron N, Nguyen L, Moonen G, Malgrange B (2012) Cycling or not cycling: cell cycle regulatory molecules and adult neurogenesis. Cell. Mol. Life Sci. 69, 1493–1503. [DOI] [PMC free article] [PubMed] [Google Scholar]
- 41. Li H, Zhong X, Chau KF, Santistevan NJ, Guo W, Kong G et al (2014) Cell cycle‐linked MeCP2 phosphorylation modulates adult neurogenesis involving the Notch signalling pathway. Nat. Commun. 5, 5601. [DOI] [PMC free article] [PubMed] [Google Scholar]
- 42. Vernon AE, Philpott A (2003) The developmental expression of cell cycle regulators in Xenopus laevis. Gene Expr. Patterns 3, 179–192. [DOI] [PubMed] [Google Scholar]
- 43. Lim S, Kaldis P (2012) Loss of Cdk2 and Cdk4 induces a switch from proliferation to differentiation in neural stem cells. Stem Cells 30, 1509–1520. [DOI] [PubMed] [Google Scholar]
- 44. Lange C, Huttner WB, Calegari F (2009) Cdk4/cyclinD1 overexpression in neural stem cells shortens G1, delays neurogenesis, and promotes the generation and expansion of basal progenitors. Cell Stem Cell 5, 320–331. [DOI] [PubMed] [Google Scholar]
- 45. Karsten SL, Kudo LC, Jackson R, Sabatti C, Kornblum HI, Geschwind DH (2003) Global analysis of gene expression in neural progenitors reveals specific cell‐cycle, signaling, and metabolic networks. Dev. Biol. 261, 165–182. [DOI] [PubMed] [Google Scholar]
- 46. Chen JF, Mandel EM, Thomson JM, Wu Q, Callis TE, Hammond SM et al (2006) The role of microRNA‐1 and microRNA‐133 in skeletal muscle proliferation and differentiation. Nat. Genet. 38, 228–233. [DOI] [PMC free article] [PubMed] [Google Scholar]
- 47. De Pietri Tonelli D, Pulvers JN, Haffner C, Murchison EP, Hannon GJ, Huttner WB (2008) miRNAs are essential for survival and differentiation of newborn neurons but not for expansion of neural progenitors during early neurogenesis in the mouse embryonic neocortex. Development 135, 3911–3921. [DOI] [PMC free article] [PubMed] [Google Scholar]
- 48. Guo S, Lu J, Schlanger R, Zhang H, Wang JY, Fox MC et al (2010) MicroRNA miR‐125a controls hematopoietic stem cell number. Proc. Natl Acad. Sci. USA 107, 14229–14234. [DOI] [PMC free article] [PubMed] [Google Scholar]
- 49. Zhang L, Stokes N, Polak L, Fuchs E (2011) Specific microRNAs are preferentially expressed by skin stem cells to balance self‐renewal and early lineage commitment. Cell Stem Cell 8, 294–308. [DOI] [PMC free article] [PubMed] [Google Scholar]
- 50. Gotz M, Huttner WB (2005) The cell biology of neurogenesis. Nat. Rev. Mol. Cell Biol. 6, 777–788. [DOI] [PubMed] [Google Scholar]
- 51. Zhong W, Chia W (2008) Neurogenesis and asymmetric cell division. Curr. Opin. Neurobiol. 18, 4–11. [DOI] [PubMed] [Google Scholar]
Associated Data
This section collects any data citations, data availability statements, or supplementary materials included in this article.
Supplementary Materials
Fig. S1. Cellular apoptosis detection by terminal deoxynucleotidyl transferase dUTP nick‐end labelling (TUNEL) assay. (A) Apoptosis cells were restricted to subventricular zone microdomains. Scale bar, 100 μm. (B) Quantification of cellular apoptosis in SVZ. n = 6 sections, data were determined by one‐way ANOVA, followed by LSD test. MiR‐30c‐KD, miR‐30c knockdown; miR‐30c‐OE, miR‐30c overexpression; control, sham group.
Table S1. Quantitative RT‐PCR primers
Table S2. Sequences for in situ hybridization