Abstract
Objectives
In human post‐menopausal osteoporosis, enhanced adipogenesis in bone marrow and enhanced formation of adipose tissue in vivo are observed. These changes correlate with reduced trabecular bone volume and increased adipocyte cell size as well as cell number. However, cellular and molecular mechanisms underlying osteoporosis‐related changes in adipocyte cell volume are not known. This study was designed to compare adipogenic potential of adipose tissue‐derived stem cells (ADSCs) obtained from ovariectomized mice with that of control ADSCs, and to analyse pathological mechanisms from the point of functional changes of ADSCs.
Materials and methods
Healthy female C57BL/6J mice were randomly divided into ovariectomy and sham‐surgery groups. Mouse ADSCs were isolated and cultured in vitro up to passage 3. After adipogenic induction, oil red O staining of lipid droplets was used to detect adipogenic ability of ADSCs; real‐time PCR and immunofluorescence staining were used to detect expression of adipogenesis‐related genes and proteins.
Results
As indicated by increased expression of adipogenic and lipogenic genes and proteins, and lipid droplets accumulation shown by oil red‐O staining, adipogenic differentiation of ADSCs was significantly enhanced in the ovariectomy group compared to the sham‐surgery group (P < 0.05).
Conclusion
These findings suggest that enhanced adipogenic differentiation of ADSCs is likely to be the important cause for increased adipogenesis in vivo and subsequent obesity‐like changes in body mass, in mice, after ovariectomy.
Introduction
Osteoporosis is a disease characterized by abnormalities in quantity and quality of bone tissue, which leads to impaired skeletal strength and increased susceptibility to fracture. It is an age‐related disease caused by imbalance between bone‐forming osteoblasts and bone‐resorbing osteoclasts, commonly resulting from post‐menopausal oestrogen deficiency 1, 2. This prevalence is especially high among elderly post‐menopausal women, increasing risk of fracture at any site, thus exposing this section of the population to particularly high morbidity and mortality 3, 4.
Previous findings have reported that with ageing, adipogenesis is enhanced and is associated with reduced osteogenesis 5. These changes are more pronounced in patients with osteoporosis 6. In post‐menopausal osteoporosis, enhanced adipogenesis in the bone marrow and enhanced formation of adipose tissue in vivo were observed. These changes correlate to reduced trabecular bone volume and increased adipocyte cell size, as well as cell number. Cell studies 7, 8, 9 comparing differentiation potential of bone marrow mesenchymal stem cells (BMSCs) derived from osteoporotic patients, to that of control BMSCs, have shown unbalanced osteogenic/adipogenic processes, including increased adipose cell formation, counterbalanced by reduced production of osteogenic cells.
These observations, coupled with the proposal that osteogenic and adipogenic differentiation pathways are regulated jointly, point to marrow adipogenesis and fat mass promotion being of concern in osteoporosis 9. However, cellular and molecular mechanisms underlying osteoporosis‐related changes in adipocyte cell volume have not yet been well clarified.
Adipose tissue‐derived mesenchymal stem cells (ADSCs) have been identified as an alternative source of post‐natal progenitor cells and are thought to have several advantages over BMSCs, including simpler harvesting procedures with less pain and donor site morbidity compared to BMSCs, relative abundance, rapidity of expansion in culture and ability to be cryo‐preserved 10, 11, 12, 13. Multipotentiality and accessibility of ADSCs make them promising candidates for potential mesodermal defect repair and disease management 14.
Due to growing attention to ADSCs and their advantages over BMSCs, thorough understanding of the biological properties of ADSCs in relation to osteoporosis is crucial. However, there is only scarce information concerning how osteoporosis affects properties of ADSCs. In the present study, proliferation and adipogenic differentiation potential of ADSCs obtained from ovariectomized (OVX) and control mice have been compared, to determine effects of osteoporosis on ADSCs and to analyse pathological mechanisms of functional changes of ADSCs.
Materials and methods
Development of OVX mouse osteoporosis model
Two‐month‐old healthy female C57BL/6J mice, of similar body mass and from the same batch were selected and randomly divided into two groups: one group was OVX (n = 10) and the other sham‐operated (control) group (n = 10). To induce the osteoporosis model, the mice were anaesthetized by intraperitoneal injection of sodium pentobarbital (40 mg/kg body weight). A lumbar lateral incision was made around the midpoint between lower margin of free ribs and iliac crest, location of the ovary. The ovarian artery and vein were constricted be suture, prior to removal of each ovary. For the sham‐operated group, partial adipose tissue adjacent to bilateral ovaries was resected. To tightly close incisions, muscles were repositioned in layers, and sutured with resorbable suture; skin was closed with nylon 4‐0 suture.
Isolation and culture of mADSCs
Adipose tissue‐derived stem cells from OVX and control (C57) group mice were obtained from inguinal sites. All surgical procedures were performed under approved anaesthetic methods using Nembutal at 35 mg/kg. Inguinal fat pads were dissected from the mice, chopped and washed extensively in sterile PBS to remove contaminating debris. They were then incubated in 0.075% type 1 collagenase (Sigma‐Aldrich, St. Louis, MO, USA) for 50 min at 37 °C with agitation. Cells released from adipose tissues were filtered and collected by centrifugation at 300 g for 5 min. Resulting pellets were re‐suspended, washed three times in medium and cells were seeded in tissue culture‐treated flasks in basic medium (α‐MEM plus 10% FBS). Cultures were maintained in a humidified atmosphere of 5% CO2 at 37 °C and mADSCs were passaged three times prior to all assays.
Cell adhesion and proliferation assay
Cell adhesion and proliferation were monitored using the xCELLigence system (Roche Diagnostics GmbH, Basel, Switzerland). xCELLigence is a method based on impedancemetry to assess global resistance of adherent cells, using a cell index (CI) metric. Variation of CI reflects either variation in cell number or cell morphology and membrane integrity. For the Roche xCelligence system, ADSCs obtained from OVX and C57 group (2 × 10³ cells per well) were plated in 96‐well E‐plates and growth was monitored as impedance value continuously, on the RTCA SP xCelligence system for 7 days at 37 °C in 5% CO2. Normalized cell index (CI) was analysed using the provided RTCA software.
Adipogenic induction
Third passage OVX‐ and C57‐mADSCs were respectively seeded into six‐well plates at 1 × 10⁵ cells/cm2. Once 80% confluence was reached, all wells were divided into two experimental groups: with or without adipogenic induction, with at least three parallel wells in each group. Then, all cells were divided into four groups: (i) OVX‐mADSCs with induction (OVX); (ii) OVX‐mADSCs without induction (OVX control); (iii) control (C57)‐mADSCs with induction (C57); (iv) control (C57)‐mADSCs without induction (C57 control). Cells cultured in basic medium alone were set as control (OVX control and C57 control). Cells in induction groups (OVX and C57) were then cultured in adipogenic differentiation medium (AM) containing α‐MEM, 10% FBS, dexamethasone (0.1 μm), insulin (5 μg/ml), indomethacin (0.2 mm) and 3‐isobutyl‐1‐methylxanthine (0.5 mm) (Sigma‐Aldrich, Oakville, ON, Canada).
Oil red‐O staining
Lipid droplets of differentiated mADSCs were analysed using oil red‐O (ORO) staining as follows: cells in each well were fixed in 10% paraformaldehyde solution for 20 min, washed in PBS and stained in ORO (Amresco, Solon, OH, USA) solution (in 60% isopropanol) for 20 min. To quantify adipogenic progress, 10 random microscopic fields (magnification ×200) were observed using an Olympus IX 710 microscope (Olympus, Tokyo, Japan) for each well. Images were captured for each field and image analysis was carried out using Image‐Pro Plus 6.0.0.260 (Media Cybernetics, Silver Spring, MD, USA). After microscopic study, quantification of lipid accumulation was measured by ORO staining extraction assay. Four hundred microlitre extraction solution (100% isopropanol) was added to each well, gently mixed for 15 min, then extract was transferred to a 96‐well plate; absorbance was recorded at 510 nm using a Varioskan Flash spectral scanning multimode reader (Thermo Scientific, Waltham, MA, USA).
Extraction of total RNA, RT‐PCR and real‐time PCR
We assessed expression of PPAR‐γ2, adiponectin (APN) and lipoprotein lipase (LPL) at transcriptional levels by real‐time PCR. Initially, total RNA was extracted from fresh cells using Simply P total RNA extraction kit (BioFlux, Hangzhou, China) and was reverse transcribed into cDNA using a PrimeScript RT reagent Kit with gDNA Eraser (Takara Bio, Tokyo, Japan) according to manufacturer's instructions. Total RNA and cDNA of each sample were examined using agarose gel electrophoresis according to the protocol outlined in Molecular Cloning: A Laboratory Manual (2001, 3rd edition). To establish the standard curve for any certain gene, cDNA samples were amplified using an RT‐PCR kit (Tiangen, Beijing, China) with primers as displayed in Table 1. Expression of certain genes was then quantified with real‐time PCR, utilizing SYBR® Premix ExTaq TM (Perfect Real Time) kit (Takara). Reactions were carried out on an ABI 7300 system (ABI, Foster City, CA, USA). For each reaction, a melting curve was generated to test primer dimer formation and false priming. Then, relative expression of mRNA levels was carried out by means of the double standard curve method. GAPDH was used for normalization of real‐time PCR results.
Table 1.
Primer sequences of target genes and GAPDH for real‐time PCR assay
| Genes | NM | Primer sequence (5′–3′) |
|---|---|---|
| PPARγ2 | NM_011146.3 | F: TGCACTGCCTATGAGCACTT |
| R: TGATGTCAAAGGAATGCGAG | ||
| APN | NM_009605.4 | F: GCAGAGATGGCACTCCTGGA |
| R: CCCTTCAGCTCCTGTCATTCC | ||
| LPL | NM_008509.2 | F: AGGGCTCTGCCTGAGTT |
| R: AGAAATCTCGAAGGCCTGGT | ||
| GAPDH | NM_017008 | F: GACGGCCGCATCTTCTTGTGC |
| R: TGCAAATGGCAGCCCTGGTGA |
Immunofluorescence staining of PPAR‐γ and ph‐PPAR‐γ
To demonstrate distribution of PPAR‐γ and PPAR‐γ with phosphoserine at residue 84 (ph‐PPAR‐γ) proteins, cells obtained from OVX and C57 group were respectively seeded into 24‐well plates at 5 × 10³cells/cm2 for immunofluorescence (IF) staining. Next cells were induced to adipocytes in AM for 7 days. They were then washed briefly in PBS, fixed in cold paraformaldehyde for 20 min at room temperature, then blocked in 1% bovine serum albumin for 30 min. Plates were subsequently incubated overnight at 4 °C in rabbit polyclonal antibody against PPAR‐γ (1:100) (Abcam, Cambridge, MA, USA) and rabbit polyclonal antibody against PPAR‐γ with phosphoserine at residue 84 (1:100) (Santa Cruz Biotechnology, Santa Cruz, CA, USA). Sequentially, plates were incubated with secondary antibodies conjugated to fluorescein isothiocyanate (Invitrogen, Carlsbad, CA, USA) for 1 h at 37 °C, and nuclei were counterstained with DAPI (Molecular Probes, Eugene, OR, USA) for 5 min. After being rinsed in PBS, cells were observed and photomicrographs were taken using the Olympus IX 710 microscope. To evaluate PPAR‐γ and ph‐PPAR‐γ concentrations, different images were analysed using Image‐Pro Plus 6.0.0.260 and integral optical density (IOD) was measured.
Western blot assay
Western blot analysis was conducted to assess adipogenesis at the protein level using the following primary rabbit antibodies: anti‐PPAR‐γ (1:500; Abcam), anti‐phosphorylated PPAR‐γ (1:200; Santa Cruz Biotechnology) and anti‐GAPDH (1:1000; Abcam). Protein (20 μg) from lysed cells was separated using 10% SDS‐PAGE gels, electrotransferred to PVDF membranes, and probed with specific antibodies, as previously described. Membranes were then hybridized with horseradish peroxidase (HRP)‐conjugated goat anti‐rabbit IgG secondary antibodies (Beyotime, Guangzhou, China) and exposed with enhanced chemiluminescence (Merk Millipore, Schwalbach, Germany). Quantification of intensity of protein in bands was performed using the ChemiDoc XRS imaging system (Bio‐Rad, Hercules, CA, USA). GAPDH was used as load control.
Data analysis
All experiments were repeated a minimum of three times and representative data are presented as mean ± SD. Data were analysed using analysis of variance (ANOVA) testing, and means were compared using the Student–Newman–Keuls (SNK) test. Differences were considered significant if P < 0.05.
Results
Proliferation curve of ADSCs obtained from OVX and control groups
Cells (2 × 10³ per well) had been plated in 96‐well E‐plates and growth was monitored by RTCA SP xCelligence system for 7 days (Fig. 1). Medium had been changed in both groups after 24 h. Cell number increased in both groups for 6 days, and proliferation rate of cells of the control group was higher than that of the OVX group, after 48 h.
Figure 1.
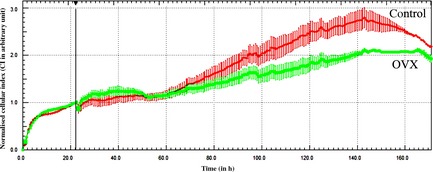
Growth of adipose tissue‐derived stem cells obtained from ovariectomized ( OVX ) and control groups was monitored by Roche xCelligence for 7 days. After 24 h, medium of both groups was changed and then measured continuously for a further 6 days. Each curve represents an average of three replicates.
OVX group ADSCs had more lipid accumulation compared to control cells
Adipose tissue‐derived stem cells had been cultured in 24‐well plates and divided into four groups as previously described. Induction groups (OVX and C57) had been cultured in insulin‐containing cocktail AM, while control groups (OVX control and C57 control) had been cultured in basic medium. After 5 and 7 days differentiation, oil red‐O staining had been performed to analyse adipogenesis in all four groups (Fig. 2a). After staining, oil red‐O spectrophotometer quantification was evaluated for induction groups (Fig. 2b). As the results show, lipid droplets in OVX groups were significantly more concentrated than those in C57 groups on day 5 and 7 respectively.
Figure 2.
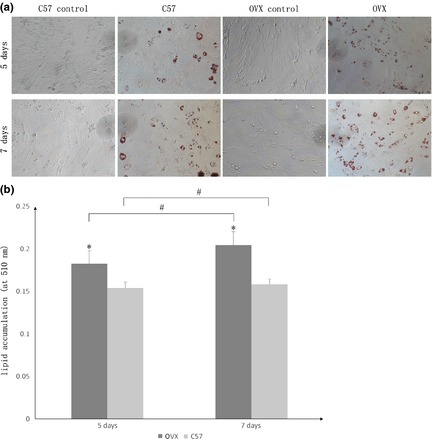
Oil red O staining and spectrophotometer quantification results after adipogenic induction of adipose tissue‐derived stem cells ( ADSC s) in each group (×200). (a) Cells were divided into four groups: (i) Those obtained from ovariectomized (OVX) group with induction (OVX); (ii) Cells obtained from OVX group without induction (OVX control); (iii) Cells obtained from control group with induction (C57); (iv) Cells obtained from control group without induction (C57 control). After 5 and 7 days in differentiation medium, oil red‐O staining was carried out to investigate adipogenic differentiation of all the four groups of ADSCs. (b) Oil red‐O spectrophotometer quantification was performed for OVX and C57 groups. The data demonstrate that lipid accumulation of the OVX group was significantly higher than that of the C57 group, at each time point, as indicated by *. Adipogenic induction also promoted adipogenesis time dependently as indicated by #. Both # and * represent P < 0.05.
PPARγ2, APN and LPL mRNAs transcription were enhanced in OVX group ADSCs compared to controls
After 3, 5 and 7 days induction, PPARγ2, APN and LPL mRNAs were detected using real‐time PCR (Fig. 3). mRNA level of PPARγ2 in OVX groups was significantly higher than C57 groups, at each time point. On day 3, mRNA level of PPARγ was significantly higher than that on days 5 and 7 in both OVX and C57 groups, while transcript levels between days 5 and 7 are not significantly different. Transcript levels of the gene coding for APN were similar to PPARγ2. However, APN transcript level in OVX groups on day 5 was found to be significantly higher than on day 7. However, expression of LPL was higher in C57 than OVX groups, opposite of other two genes, while on day 7, expression of LPL was higher in OVX than C57 groups.
Figure 3.
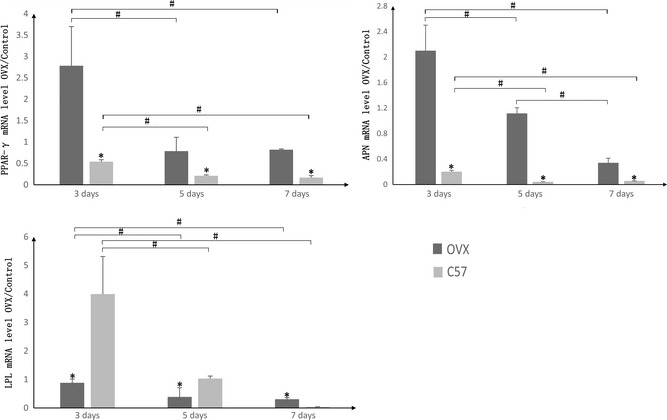
mRNA expression change of peroxisome PPAR γ2, adiponectin ( APN ) and lipoprotein lipase ( LPL ) in ovariectomized ( OVX ) and control groups after adipogenic induction. At days 3, 5 and 7 of adipogenic induction, OVX group showed higher expressions of PPAR‐γ2 and APN than control (C57) group. However, the expression of LPL is higher in C57 than OVX group at day 3 and 5, which is the opposite of other two genes. While on day 7, the expression of LPL is higher in OVX group than C57 group. *Represents significant difference between OVX and C57 groups, and # indicated adipogenesis was promoted by adipogenic induction in specified group time dependently (P < 0.05).
PPARγ and ph‐PPARγ protein expression were enhanced in OVX group ADSCs compared to controls
PPAR‐γ of cell cytoplasm is commonly activated by dephosphorylation. Dephosphorylated PPAR‐γ moves into nuclei and functions as an intranuclear transcription factor. After 3, 5 and 7 days differentiation, IF was performed with anti‐PPARγ (Fig. 4) and anti‐ph‐PPARγ (Fig. 5) antibodies. Expression of PPARγ and ph‐PPARγ were both found to be higher in OVX than C57 groups. To evaluate PPAR‐γ and ph‐PPAR‐γ concentrations, integral optical density (IOD) was measured (Fig. 6). We observed that PPAR‐γ expression was higher in OVX groups than in controls at each time point. On day 7, there was a significant difference between OVX (4.88 ± 0.92%) and controls (3.57 ± 0.80%). Expression of ph‐PPAR‐γ was also higher in OVX groups than in controls. On day 3 and 7, IOD was statistically significantly different in OVX groups (2.95 ± 0.37%, 3.21 ± 0.35%) compared to controls (2.64 ± 0.35%, 2.85 ± 0.39%).
Figure 4.
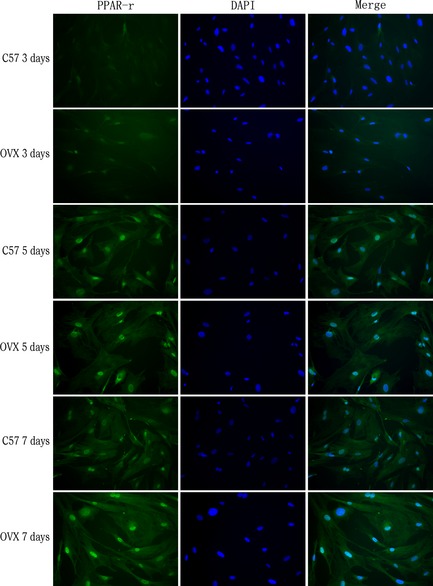
Immunofluorescence staining revealed expression of PPAR γ in differentiated ovariectomized ( OVX ) adipose tissue‐derived stem cells and control groups. At days 3, 5 and 7 of adipogenic differentiation, expression of PPARγ in the OVX group and control (C57) group was examined (magnification ×200).
Figure 5.
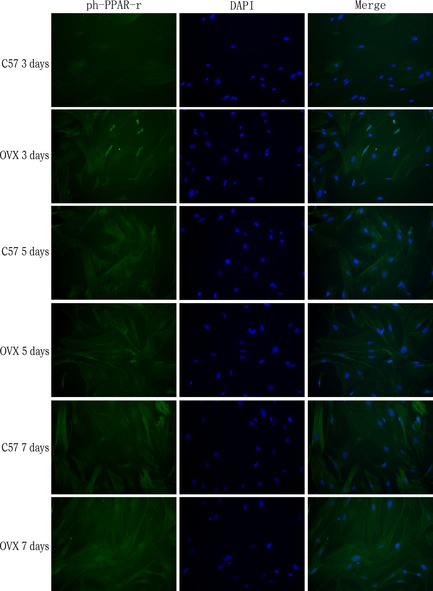
Immunofluorescence staining revealed expression of ph‐ PPAR γ in differentiated adipose tissue‐derived stem cells obtained from ovariectomized ( OVX ) and control groups. At day 3, 5 and 7 of adipogenic differentiation, expression of ph‐PPARγ in the OVX group and control (C57) group was examined (magnification ×200).
Figure 6.
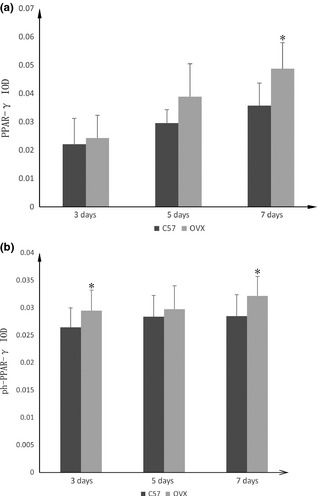
Integral optical density ( IOD ) was measured to evaluate PPAR ‐γ and ph‐ PPAR ‐γ concentration. (a) PPAR‐γ expression was higher in ovariectomized (OVX) groups than in controls at each time point and the difference was significant on day 7. (b) IOD of ph‐PPAR‐γ also higher in OVX groups than in controls at each time point, and the difference was significant on day 3 and 7. P < 0.05 were considered statistically significant, as indicated by *.
Results of Western blot analysis were similar to those of immunofluorescence staining (Fig. 7). By analysing quantification of intensity of proteins, expression of PPARγ and ph‐PPARγ in OVX, were both found to be higher than C57 groups at all three time points (Fig. 7b,c). On day 3 and 7, difference in ratio expression of PPARγ between OVX and controls was significant, while that of ph‐PPARγ expression was significant between the two groups at each time point. Expression of the two proteins increased over induction time, in the OVX group. However in controls, both proteins were reduced by 7 days after differentiation; this might be due to toxic effects of adipogenic induction medium, leading to cell stagnantion. We also determined the ratio of PPARγ/ph‐PPARγ expression (Fig. 7d) which is more important than expression of each protein individually. Results indicated that phosphorylated PPARγ expression increased when expression of active PPARγ protein increased.
Figure 7.
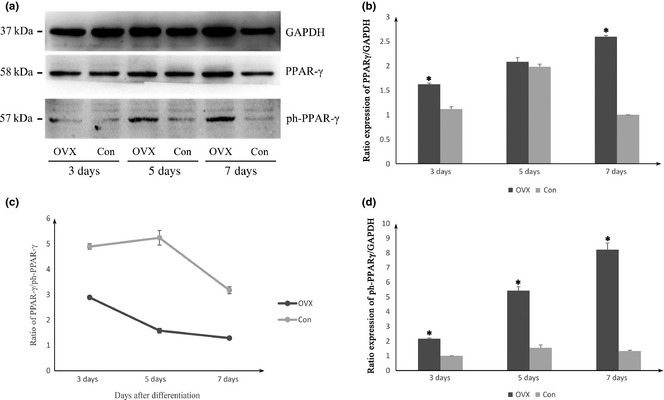
Protein expression levels of PPAR γ and ph‐ PPAR γ in ovariectomized ( OVX ) and control group. (a) Representative Western blot analysis of PPARγ and ph‐PPARγ proteins separated by SDS‐PAGE. Histograms represent relative PPARγ level (b) and ph‐PPARγ level (c) as detected by Western blot and densitometric analysis, *P < 0.05 compared with respective value of control group. (d) The ratio of PPARγ/ph‐PPARγ expression was also determined in both groups. All data were normalized by GAPDH, expressed as optical density and represent the mean ± SD of three different samples.
Discussion
Osteoporosis is characterized by low bone mass and microarchitectural deterioration of bones, due to more rapid bone resorption than bone formation; this usually leads to bone fragility and increased risks of fractures 15, 16. Such bone defects are frequently found to occur in the proximal femur or distal radius after fracture, metastasis, bone tumour resection, and arthroplasty revision of the knee and hip, in osteoporosis patients 17, 18.
Previous findings have reported that with ageing, adipogenesis is enhanced and that this is associated with reduced osteogenesis 5. These changes are more pronounced in patients with osteoporosis 6. Increased numbers of adipose cells in the bone marrow also have been demonstrated in patients with osteoporosis 19. In newborn mammals, there is no marrow fat; however, number of adipocytes increases with age so that, in humans over 30 years of age, most of the femoral cavity is occupied by adipose tissue 20. Some studies have indicated that in normal pre‐ and post‐menopausal women, total body fat is positively related to bone marrow density (BMD) throughout the skeleton 21, 22. Furthermore, one longitudinal study has shown that changes in BMD at most sites is positively related to rate of change in fat mass 23. However, other independent groups have suggested that excessive fat mass may not protect against reductions in bone mass, or even have a negative relationship between fat mass and bone mass 24, 25. The majority of epidemiological studies have highlighted the existence of the interaction between adiposity and bone. However, based on data generated to date, it is unclear whether fat mass has a beneficial or negative effect on bone. In our study, we also found that fat mass was increased in osteoporosis mice after ovariectomization compared to normal mice. Hence, this study has addressed a key question: what happened to the adipose tissue in osteoporosis mice and relationship and underlying mechanisms between fat mass and osteoporosis?
Similar to bone marrow, adipose tissue 12, 26 is also a considerable source of MSCs with great potential for use in treatment of various diseases, including bone defects or repair 27, 28, 29. Morphological characteristics and expression of surface markers of phenotypic characterization are similar between MSCs from adipose tissue and those from bone marrow. Some researchers have reported similar characteristics between these two cell types 30, 31, others have higher preference for adipose tissue as a source of MSCs. This tissue tends to have higher numbers of stem cells that can be obtained by lipoaspiration, thus, without needing to perform more invasive procedures, aimed exclusively at obtaining MSCs 26. Moreover, in vitro, ADSCs proliferate more rapidly 30, take longer to enter senescence 32 and have a greater ability to be cryopreserved compared to BMSCs 33, 34. Besides these advantages, ADSCs have been shown to possess multi‐lineage potential capable of differentiating into adipogenic, osteogenic, myogenic and chondrogenic cells and comparable functional characteristics as stem cells obtained from the bone marrow 12, 35.
Multipotentiality and accessibility of ADSCs make them promising candidates for treatment of osteoporosis. However, before claiming MSCs from adipose tissue to be the best option for cell therapy, more studies are needed to compare both in vitro and in vivo differential potential of these cells in the treatment of osteoporosis. Moreover, cellular and molecular mechanisms underlying osteoporosis‐related changes in adipocyte cell volume have not yet been sufficiently clarified, and there is scarce information on how osteoporosis affects properties of ADSCs. In the present study, proliferation and adipogenic differentiation potentials of ADSCs obtained from OVX and control mice were compared to determine effects of osteoporosis on ADSCs. The results reveal that ADSCs obtained from the OVX group had more lipid accumulation compared to control cells, and that PPARγ2 and APN mRNA transcription were enhanced in OVX group ADSCs. Interestingly, expression of LPL was higher in C57 than the OVX group, contrary to other two genes. While at day 7, expression of LPL was higher in OVX group than C57 cells. Meanwhile, growth rate of OVX group ADSCs was slower than control cells, which corresponds with previous studies on BMSCs 36.
Intracellular and extracellular environmental signals control ADSC differentiation into osteoblasts or adipocytes. A reciprocal relationship has been postulated to exist between the two differentiation pathways whose alteration would facilitate adipose accretion in the bone marrow, at the expense of osteoblast formation, thus reducing bone mass 8, 9, 37. Previous studies have indicated that MSC commitment and differentiation into a specific phenotype depends on regulation of expression and/or activity of master differentiation genes 38.
Peroxisome proliferator‐activated receptor (PPAR) γ gene is located on chromosome 3p‐25 and plays an important role in regulation of cell differentiation, development and metabolism 39. The PPARγ pathway is the master regulator of adipogenesis, and has been indicated as a critical switch in commitment of progenitor cells to either the adipogenic or osteogenic pathway 7, 38. PPAR‐γ is commonly activated by dephosphorylation in cytoplasm. Dephosphorylated PPAR‐γ moves into nuclei and functions as an intranuclear transcription factor. Results here, of immunofluorescence staining and Western blot analysis indicate that PPARγ and ph‐PPARγ protein expression were both enhanced in OVX group ADSCs, which promoted their adipogenic differentiation process. We also determined the ratio of PPARγ/ph‐PPARγ expression. The results show that phosphorylated PPARγ expression enhanced while expression of active PPARγ protein increased, although the mechanism involved needs further study. Phosphorylation of PPARγ2 at Ser112 by secretory factors such as epidermal growth factor and platelet‐derived growth factor, results in impaired PPARγ2 transcriptional activity 40. However, previous studies have indicated that phosphorylation of PPARγ by cyclin‐dependent kinase 5 (Cdk5) at Ser273 is linked to diabetic changes 41. Down‐regulation of PPARγ is considered a novel strategy to promote bone regeneration, which is critical in the treatment of bone defects caused by trauma or bone resorption 42. Stimulation of PPARγ therefore might have an impact on bone metabolism by determining lineage commitment of ADSCs.
Adiponectin is the most abundant protein derived from adipocytes. Previous studies have suggested that APN and its receptors are expressed in bone‐forming cells 43. Some studies have revealed that human osteoblasts treated with APN have increased proliferation, differentiation and mineralization, suggesting a positive effect of APN on bone formation 44. Clinical studies show that increasing levels of APN are associated with a significantly reduction in whole body bone mineral content and BMD, indicating a negative association between APN and BMD 45, 46. Studies using mouse models have further confirmed the role of APN in negative regulation of BMD.
Lipoprotein lipase is a multifunctional enzyme produced by many tissues, including adipose tissue, cardiac and skeletal muscle, islets of Langerhans, and macrophages 47. It is responsible for hydrolysis of core triglycerides (TGs) in chylomicrons and very low‐density lipoproteins, producing chylomicron remnants and intermediate‐density lipoproteins respectively 48. Enzymatic activity of LPL is regulated in a complex manner in response to hormonal changes, due to such as testosterone and oestrogen. In mice, addition of 17β‐estradiol to hearts from OVX females increases LPL mRNA. This effect on LPL is blocked by oestrogen receptor antagonist ICI‐182,780 or by progesterone 49. In post‐menopausal women, treatment with both oestrogen and progestin increases LPL activity in adipose tissue, preferentially in the femoral depot 50. Calcium also has been shown to trigger folding of LPL into active dimers 51, a process that might also be involved in post‐translational regulation of LPL activity. Here, in OVX‐induced osteoporosis, oestrogen and calcium content were reduced which may be why at days 3 and 5, expression of LPL mRNA in the OVX group was lower than that of the C57 group. LPL expression increases as pre‐adipocytes differentiate 52, which may be the reason for LPL mRNA expression being higher in the OVX group at day 7. More detailed mechanistic studies need to be performed before utilizing the ability to selectively modify LPL in adipose tissue in therapy strategies for osteoporosis.
In present study, we compared proliferation and adipogenic differentiation potentials of ADSCs obtained from OVX and control mice. Our findings suggest that enhanced adipogenic differentiation of ADSCs is likely to be the important cause for increased adipogenesis in vivo and subsequent obesity‐like changes in body mass of mice after ovariectomy.
Conflict of interests
The authors have declared that no competing interests exist.
Acknowledgements
This work was funded by National Natural Science Foundation of China (31170929, 81201211), Doctoral Fund of Ministry of Education of China (20110181120071, 20130181110012) and Funding of State Key Laboratory of Oral Diseases (SKLOD201405).
Y. Fu and R. Li contributed equally to this work.
References
- 1. Pei L, Tontonoz P (2004) Fat's loss is bone's gain. J. Clin. Invest. 113, 805–806. [DOI] [PMC free article] [PubMed] [Google Scholar]
- 2. Rodan GA, Martin TJ (2000) Therapeutic approaches to bone diseases. Science 289, 1508–1514. [DOI] [PubMed] [Google Scholar]
- 3. Johnell O, Kanis J (2005) Epidemiology of osteoporotic fractures. Osteoporos. Int. 16, S3–S7. [DOI] [PubMed] [Google Scholar]
- 4. Johnell O, Kanis J (2006) An estimate of the worldwide prevalence and disability associated with osteoporotic fractures. Osteoporos. Int. 17, 1726–1733. [DOI] [PubMed] [Google Scholar]
- 5. Burkhardt R, Kettner G, Böhm W, Schmidmeier M, Schlag R, Frisch B et al (1987) Changes in trabecular bone, hematopoiesis and bone marrow vessels in aplastic anemia, primary osteoporosis, and old age: a comparative histomorphometric study. Bone 8, 157–164. [DOI] [PubMed] [Google Scholar]
- 6. Justesen J, Stenderup K, Ebbesen E, Mosekilde L, Steiniche T, Kassem M (2001) Adipocyte tissue volume in bone marrow is increased with aging and in patients with osteoporosis. Biogerontology 2, 165–171. [DOI] [PubMed] [Google Scholar]
- 7. Nuttall ME, Gimble JM (2004) Controlling the balance between osteoblastogenesis and adipogenesis and the consequent therapeutic implications. Curr. Opin. Pharmacol. 4, 290–294. [DOI] [PubMed] [Google Scholar]
- 8. Rodríguez JP, Astudillo P, Rios S, Pino AM (2008) Involvement of adipogenic potential of human bone marrow mesenchymal stem cells (MSCs) in osteoporosis. Curr. Stem Cell Res. Ther. 3, 208–218. [DOI] [PubMed] [Google Scholar]
- 9. Rosen CJ, Bouxsein ML (2006) Mechanisms of disease: is osteoporosis the obesity of bone? Nat. Clin. Pract. Rheumatol. 2, 35–43. [DOI] [PubMed] [Google Scholar]
- 10. De Ugarte DA, Morizono K, Elbarbary A, Alfonso Z, Zuk PA, Zhu M et al (2003) Comparison of multi‐lineage cells from human adipose tissue and bone marrow. Cells Tissues Organs 174, 101–109. [DOI] [PubMed] [Google Scholar]
- 11. Zuk PA, Zhu M, Ashjian P, De Ugarte DA, Huang JI, Mizuno H et al (2002) Human adipose tissue is a source of multipotent stem cells. Mol. Biol. Cell 13, 4279–4295. [DOI] [PMC free article] [PubMed] [Google Scholar]
- 12. Zuk PA, Zhu M, Mizuno H, Huang J, Futrell JW, Katz AJ et al (2001) Multilineage cells from human adipose tissue: implications for cell‐based therapies. Tissue Eng. 7, 211–228. [DOI] [PubMed] [Google Scholar]
- 13. Aust L, Devlin B, Foster S, Halvorsen Y, Hicok K, Du Laney T et al (2004) Yield of human adipose‐derived adult stem cells from liposuction aspirates. Cytotherapy 6, 7–14. [DOI] [PubMed] [Google Scholar]
- 14. Pachón‐Peña G, Yu G, Tucker A, Wu X, Vendrell J, Bunnell B et al (2011) Stromal stem cells from adipose tissue and bone marrow of age‐matched female donors display distinct immunophenotypic profiles. J. Cell. Physiol. 226, 843–851. [DOI] [PMC free article] [PubMed] [Google Scholar]
- 15. Verron E, Gauthier O, Janvier P, Pilet P, Lesoeur J, Bujoli B et al (2010) In vivo bone augmentation in an osteoporotic environment using bisphosphonate‐loaded calcium deficient apatite. Biomaterials 31, 7776–7784. [DOI] [PubMed] [Google Scholar]
- 16. Rachner TD, Khosla S, Hofbauer LC (2011) Osteoporosis: now and the future. The Lancet 377, 1276–1287. [DOI] [PMC free article] [PubMed] [Google Scholar]
- 17. Reichert JC, Saifzadeh S, Wullschleger ME, Epari DR, Schütz MA, Duda GN et al (2009) The challenge of establishing preclinical models for segmental bone defect research. Biomaterials 30, 2149–2163. [DOI] [PubMed] [Google Scholar]
- 18. Cao L, Liu G, Gan Y, Fan Q, Yang F, Zhang X et al (2012) The use of autologous enriched bone marrow MSCs to enhance osteoporotic bone defect repair in long‐term estrogen deficient goats. Biomaterials 33, 5076–5084. [DOI] [PubMed] [Google Scholar]
- 19. Meunier P, Aaron J, Edouard C, Vignon G (1971) Osteoporosis and the replacement of cell populations of the marrow by adipose tissue: a quantitative study of 84 iliac bone biopsies. Clin. Orthop. Relat. Res. 80, 147–154. [DOI] [PubMed] [Google Scholar]
- 20. Moore S, Dawson K (1990) Red and yellow marrow in the femur: age‐related changes in appearance at MR imaging. Radiology 175, 219–223. [DOI] [PubMed] [Google Scholar]
- 21. Khosla S, Atkinson EJ, Riggs BL, Melton LJ (1996) Relationship between body composition and bone mass in women. J. Bone Miner. Res. 11, 857–863. [DOI] [PubMed] [Google Scholar]
- 22. Douchi T, Yamamoto S, Oki T, Maruta K, Kuwahata R, Nagata Y (2000) Relationship between body fat distribution and bone mineral density in premenopausal Japanese women. Obstet. Gynecol. 95, 722–725. [DOI] [PubMed] [Google Scholar]
- 23. Reid I, Ames R, Evans M, Sharpe S, Gamble G (1994) Determinants of the rate of bone loss in normal postmenopausal women. J. Clin. Endocrinol. Metab. 79, 950–954. [DOI] [PubMed] [Google Scholar]
- 24. Blum M, Harris S, Must A, Naumova E, Phillips S, Rand W et al (2003) Leptin, body composition and bone mineral density in premenopausal women. Calcif. Tissue Int. 73, 27–32. [DOI] [PubMed] [Google Scholar]
- 25. Hsu Y‐H, Venners SA, Terwedow HA, Feng Y, Niu T, Li Z et al (2006) Relation of body composition, fat mass, and serum lipids to osteoporotic fractures and bone mineral density in Chinese men and women. Am. J. Clin. Nutr. 83, 146–154. [DOI] [PubMed] [Google Scholar]
- 26. Zhu Y, Liu T, Song K, Fan X, Ma X, Cui Z (2008) Adipose‐derived stem cell: a better stem cell than BMSC. Cell Biochem. Funct. 26, 664–675. [DOI] [PubMed] [Google Scholar]
- 27. Levi B, Longaker MT (2011) Concise review: adipose‐derived stromal cells for skeletal regenerative medicine. Stem Cells 29, 576–582. [DOI] [PMC free article] [PubMed] [Google Scholar]
- 28. Oreffo R, Triffitt J (1999) Future potentials for using osteogenic stem cells and biomaterials in orthopedics. Bone 25, 5S–9S. [DOI] [PubMed] [Google Scholar]
- 29. Shoji T, Ii M, Mifune Y, Matsumoto T, Kawamoto A, Kwon S‐M et al (2010) Local transplantation of human multipotent adipose‐derived stem cells accelerates fracture healing via enhanced osteogenesis and angiogenesis. Lab. Invest. 90, 637–649. [DOI] [PubMed] [Google Scholar]
- 30. Nakanishi C, Nagaya N, Ohnishi S, Yamahara K, Takabatake S, Konno T et al (2010) Gene and protein expression analysis of mesenchymal stem cells derived from rat adipose tissue and bone marrow. Circ. J. 75, 2260–2268. [DOI] [PubMed] [Google Scholar]
- 31. Gronthos S, Franklin DM, Leddy HA, Robey PG, Storms RW, Gimble JM (2001) Surface protein characterization of human adipose tissue‐derived stromal cells. J. Cell. Physiol. 189, 54–63. [DOI] [PubMed] [Google Scholar]
- 32. Dmitrieva RI, Minullina IR, Bilibina AA, Tarasova OV, Anisimov SV, Zaritskey AY (2012) Bone marrow‐and subcutaneous adipose tissue‐derived mesenchymal stem cells: differences and similarities. Cell Cycle 11, 377–383. [DOI] [PubMed] [Google Scholar]
- 33. Mambelli LI, Santos EJ, Frazão PJ, Chaparro MB, Kerkis A, Zoppa AL et al (2009) Characterization of equine adipose tissue–derived progenitor cells before and after cryopreservation. Tissue Eng. Part C Methods 15, 87–94. [DOI] [PubMed] [Google Scholar]
- 34. Carvalho K, Cury C, Oliveira L, Cattaned R, Malvezzi M, Francisco J et al (2008) Evaluation of bone marrow mesenchymal stem cell standard cryopreservation procedure efficiency. Transplant. Proc. 40, 839–841. [DOI] [PubMed] [Google Scholar]
- 35. Rider DA, Dombrowski C, Sawyer AA, Ng GH, Leong D, Hutmacher DW et al (2008) Autocrine fibroblast growth factor 2 increases the multipotentiality of human adipose‐derived mesenchymal stem cells. Stem Cells 26, 1598–1608. [DOI] [PubMed] [Google Scholar]
- 36. Rangiani A, Cao ZG, Liu Y, Voisey Rodgers A, Jiang Y, Qin CL et al (2012) Dentin matrix protein 1 and phosphate homeostasis are critical for postnatal pulp, dentin and enamel formation. Int. J. Oral Sci. 4, 189–195. [DOI] [PMC free article] [PubMed] [Google Scholar]
- 37. Grottkau BE, Lin Y (2013) Osteogenesis of adipose‐derived stem cells. Bone Res. 1, 133–145. [DOI] [PMC free article] [PubMed] [Google Scholar]
- 38. Muruganandan S, Roman A, Sinal C (2009) Adipocyte differentiation of bone marrow‐derived mesenchymal stem cells: cross talk with the osteoblastogenic program. Cell. Mol. Life Sci. 66, 236–253. [DOI] [PMC free article] [PubMed] [Google Scholar]
- 39. Berger J, Moller DE (2002) The mechanisms of action of PPARs. Annu. Rev. Med. 53, 409–435. [DOI] [PubMed] [Google Scholar]
- 40. Hosooka T, Noguchi T, Kotani K, Nakamura T, Sakaue H, Inoue H et al (2008) Dok1 mediates high‐fat diet‐induced adipocyte hypertrophy and obesity through modulation of PPAR‐gamma phosphorylation. Nat. Med. 14, 188–193. [DOI] [PubMed] [Google Scholar]
- 41. Choi JH, Banks AS, Estall JL, Kajimura S, Boström P, Laznik D et al (2010) Anti‐diabetic drugs inhibit obesity‐linked phosphorylation of PPARgamma by Cdk5. Nature 466, 451–456. [DOI] [PMC free article] [PubMed] [Google Scholar]
- 42. Arvidson K, Abdallah B, Applegate L, Baldini N, Cenni E, Gomez‐Barrena E et al (2011) Bone regeneration and stem cells. J. Cell Mol. Med. 15, 718–746. [DOI] [PMC free article] [PubMed] [Google Scholar]
- 43. Berner HS, Lyngstadaas SP, Spahr A, Monjo M, Thommesen L, Drevon CA et al (2004) Adiponectin and its receptors are expressed in bone‐forming cells. Bone 35, 842–849. [DOI] [PubMed] [Google Scholar]
- 44. Luo X‐H, Guo L‐J, Yuan L‐Q, Xie H, Zhou H‐D, Wu X‐P et al (2005) Adiponectin stimulates human osteoblasts proliferation and differentiation via the MAPK signaling pathway. Exp. Cell Res. 309, 99–109. [DOI] [PubMed] [Google Scholar]
- 45. Jürimäe J, Jürimäe T (2007) Plasma adiponectin concentration in healthy pre‐and postmenopausal women: relationship with body composition, bone mineral, and metabolic variables. Am. J. Physiol. Endocrinol. Metab. 293, E42–E47. [DOI] [PubMed] [Google Scholar]
- 46. Richards J, Valdes A, Burling K, Perks U, Spector T (2007) Serum adiponectin and bone mineral density in women. J. Clin. Endocrinol. Metab. 92, 1517–1523. [DOI] [PubMed] [Google Scholar]
- 47. Kirchgessner TG, LeBoeuf RC, Langner CA, Zollman S, Chang CH, Taylor BA et al (1989) Genetic and developmental regulation of the lipoprotein lipase gene: loci both distal and proximal to the lipoprotein lipase structural gene control enzyme expression. J. Biol. Chem. 264, 1473–1482. [PubMed] [Google Scholar]
- 48. Goldberg IJ, Merkel M (2001) Lipoprotein lipase: physiology, biochemistry, and molecular biology. Front. Biosci. 6, D388–D405. [DOI] [PubMed] [Google Scholar]
- 49. Liu D, Deschamps A, Korach KS, Murphy E (2008) Estrogen‐enhanced gene expression of lipoprotein lipase in heart is antagonized by progesterone. Endocrinology 149, 711–716. [DOI] [PMC free article] [PubMed] [Google Scholar]
- 50. Rebuffé‐Scrive M1, Lönnroth P, Mårin P, Wesslau C, Björntorp P, Smith U (1987) Regional adipose tissue metabolism in men and postmenopausal women. Int. J. Obes. 11, 347–355. [PubMed] [Google Scholar]
- 51. Zhang L, Lookene A, Wu G, Olivecrona G (2005) Calcium triggers folding of lipoprotein lipase into active dimers. J. Biol. Chem. 280, 42580–42591. [DOI] [PubMed] [Google Scholar]
- 52. Semenkovich CF, Wims M, Noe L, Etienne J, Chan L (1989) Insulin regulation of lipoprotein lipase activity in 3T3‐L1 adipocytes is mediated at posttranscriptional and posttranslational levels. J. Biol. Chem. 264, 9030–9038. [PubMed] [Google Scholar]


