

Abstract
Abstract. In response to DNA damage by genotoxic agents, histone H2AX is phosphorylated on Ser‐139. However, during the cell cycle, predominantly in S and G2M phase, histone H2AX is also phosphorylated in untreated normal and tumour cells. This constitutive H2AX phosphorylation is markedly reduced by exposure of cells to the reactive oxygen species scavenger N‐acetyl‐L‐cysteine. Therefore, it appears likely that constitutive H2AX phosphorylation reflects the ongoing oxidative DNA damage induced by the reactive oxygen species during progression through the cell cycle. Because the tumour suppressor p53 (tumour protein p53) is known to induce transcription of genes associated with cell response to oxidative stress, we have compared the intensity of constitutive H2AX phosphorylation, and the effect of N‐acetyl‐L‐cysteine on it, in cells with different tumour protein p53 status. These were human lymphoblastoid cell lines derived from WIL2 cells: TK6, a p53 wt line, NH32, a tumour protein p53 knock‐out derived from TK6, and WTK1, a WIL2‐derived line that expresses a homozygous mutant of tumour protein p53. Also tested were the tumour protein p53‐null promyelocytic HL‐60 cells. The degree of constitutive H2AX phosphorylation was distinctly lower in NH32, WTK1 and HL‐60 compared to TK6 cells in all phases of the cell cycle. Also, the degree of attenuation of constitutive H2AX phosphorylation by N‐acetyl‐L‐cysteine was less pronounced in NH32, WTK1, and HL‐60, compared to TK6 cells. However, the level of reactive oxygen species detected by the cells’ ability to oxidize carboxyl‐dichlorodihydrofluorescein diacetate was not significantly different in the cell lines studied, which would suggest that regardless of tumour protein p53 status, the level of oxidative DNA damage was similar. The observed higher level of constitutive H2AX phosphorylation in cells harbouring wt tumour protein p53 may thus indicate that tumour protein p53 plays a role in facilitating histone H2AX phosphorylation, an important step in the mobilization of the DNA repair machinery at the site of DNA double‐strand breaks.
INTRODUCTION
Histone H2AX, one of the variants of histone H2A (West & Bonner 1980; Thatcher & Gorovsky 1994), is considered to be one of the critical proteins responsible for the surveillance of genome integrity (Celeste et al. 2002; Bassing et al. 2003; Celeste et al. 2003). In response to DNA damage that involves formation of DNA double‐strand breaks (DSBs), histone H2AX becomes phosphorylated on Ser‐139 (Rogakou et al. 1998; Sedelnikova et al. 2002). The phosphorylation, mediated by the PI‐3–like kinases ataxia telangiectasia mutated (ATM)‐ (Anderson et al. 2001; Burma et al. 2001), ataxia telangiectasia mutated and Rad3‐related protein (ATR)‐ (Furuta et al. 2003), and/or DNA‐dependent protein kinase (Park et al. 2003), takes place on H2AX molecules on both sides of DSBs along a megabase length of DNA (Rogakou et al. 1999). The Ser‐139‐phosphorylated H2AX has been named γH2AX. It should be noted that H2AX is also phosphorylated during the formation of DSBs in physiological processes that involve DNA recombination such as V(D)J class‐switch recombination during immune system development and at sites of recombinational DSB formation in meiosis (Jackson 2001; Modesti & Kanaar 2001; Fernandez‐Capetillo et al. 2002). DSBs generated during DNA fragmentation in apoptotic cells also induce H2AX phosphorylation (Huang et al. 2003; Huang et al. 2004; Huang et al. 2005).
The presence of γH2AX can be detected immunocytochemically in the form of distinct nuclear γH2AX immunofluorescent (IF) foci, each focus presumed to correspond to a single DSB (Rogakou et al. 1999; Sedelnikova et al. 2002). A variety of signalling and repair proteins including the M/R/N complex (Mre11/Rad50/Nbs1), Brca1 and the p53‐binding protein 1 (53BP1) colocalize with γH2AX at the foci (Paull et al. 2000; Anderson et al. 2001; Furuta et al. 2003; Downs & Cote 2005; Foster & Downs 2005).
Cells are continuously exposed to oxidants generated by metabolic activity and other biochemical reactions as well as to external oxidants or oxidant inducers and it is generally recognized that oxidative stress induces DNA damage. In fact, progressive oxidative DNA damage has been considered one of the primary factors of ageing (Nohl 1994; Parrinello et al. 2003; Barzilai & Yamamoto 2004; Moller & Loft 2004; Schriner et al. 2005). Endogenous reactive oxygen species (ROS) modify approximately 20 000 bases of DNA per day in a single cell (Beckman & Ames 1997). It has been estimated that approximately 50 DSBs per nucleus (which amounts to approximately 0.8 DSBs per 108 bp) are generated during a single cell cycle in human cells untreated with any exogenous genotoxic agent (Vilenchik & Knudson 2003).
Given the previous discussion, it would be expected that DNA damage by endogenous ROS will be reflected by the presence of γH2AX reporting formation of DSBs continuously throughout the cell cycle. Indeed, a fraction of histone H2AX molecules remains phosphorylated in untreated normal cells as well in the cells of different tumour lines (MacPhail et al. 2003; Huang et al. 2005). The extent of this constitutive H2AX phosphorylation (CHP), also called ‘programmed’ or ‘intrinsic’γH2AX, tends to be higher in S, G2 and mitotic cells compared to G1 cells and varies depending on the cell type (line) (MacPhail et al. 2003; Huang et al. 2005; Huang et al. 2006b). CHP manifests in the form of diffuse, weakly fluorescent heteromorphous structures distributed over the entire nucleus (Huang et al. 2005) rather than discrete and strongly fluorescent γH2AX foci. The heterogeneity may reflect a large dispersion in the ‘age’ of individual γH2AX foci, including the ones diminished in size resulting from γH2AX dephosphorylation as DNA repair progresses. In cells of different cell types, a large portion of this CHP can be prevented by cell exposure to an antioxidant, the free radical scavenger N‐acetyl‐L‐cysteine (NAC) (Albino et al. 2004; Albino et al. 2006; Huang et al. 2006b). Furthermore, cell growth in the presence of the glutathione synthetase inhibitor buthionine sulfoximine raised the level of CHP (Huang et al. 2006b). These results taken collectively implicate ROS as a mediator of DNA damage that, in turn, is being reported by CHP throughout the cell cycle.
During studying CHP in a variety of cell types (lines), we noticed that its level in NHBE and pulmonary carcinoma A549 cells that both express wt TP53, was distinctly higher than in several other cell lines that had mutated TP53 or were TP53 null (Huang et al. 2006b). There is evidence that TP53 plays a dominant role in modulating oxidative stress (Polyak et al. 1997; Achanta & Huang 2004; Sablina et al. 2005). Thus, for example, it was observed that in the absence of severe stress, normal levels of expression of TP53 up‐regulated several genes coding for proteins with antioxidant activity and was associated with a reduction of ROS (Sablina et al. 2005). Conversely, down‐regulation of TP53 led to excessive oxidation of DNA, increased mutation rate and genome instability, all of which could be prevented by NAC (Sablina et al. 2005). There is also evidence that TP53 phosphorylated at Ser‐15 directly binds to sites of DNA breaks most likely facilitating DNA repair (Al Rashid et al. 2005). In light of the evidence that TP53 may modulate the generation of ROS and affect DNA repair, the present study was designed to compare the level of CHP and its sensitivity to NAC in cells with different p53 status. Specifically, we have tested human B lymphoblastoid cell lines derived from WIL2 cells: TK6, a TP53 wt line, NH32, a TP53 knock‐out derived from TK6, and WTK1, a WIL2‐derived line that expresses a homozygous mutant of TP53 (Schwartz et al. 2003). Also tested were the TP53‐null human promyelocytic HL‐60 cells. The data show distinct differences in the extent of CHP among the lines studied, with wt TK6 having the highest level of NAC‐sensitive CHP.
MATERIALS AND METHODS
Cells and culture conditions
Human B‐cell lymphoblastoid TK6, WTK1 and NH32 were kindly provided by Dr Howard Liber of the Colorado State University (Fort Collins CO). HL‐60 cells were obtained from American Type Culture Collection (ATCC; Manassas, VA). The cells were grown in 25 ml Falcon flasks (Becton‐Dickinson Co., Franklin Lakes, NJ) in RPMI 1640 supplemented with 10% foetal calf serum, 100 units/ml penicillin, 100 µg/ml streptomycin and 2 mm L‐glutamine (all from Gibco/BRL Life Technologies, Inc., Grand Island, NY) at 37 °C in an atmosphere of 5% CO2 in air. At the onset of the experiments, there were fewer than 5 × 10⁵ cells per ml in culture such that the cells were at an exponential and asynchronous phase of growth.
Cell treatments
N‐acetyl‐L‐cysteine was obtained from Sigma Chemical Co. (St. Louis, MO). The pH of the NAC solution was adjusted to 7.0 before being applied to the cells. The cultures were incubated with various concentrations of NAC as described in the figure legends. Intracellular level of ROS was measured with the fluorescent probe carboxyl‐dichlorodihydrofluorescein diacetate (H2DCF‐DA) obtained from Molecular Probes (Eugene, OR). Briefly, the cells were washed twice with phosphate buffered saline (PBS), then resuspended in prewarmed PBS containing 10 µm H2DCF‐DA and incubated at 37 °C for 30 min or 1 h. The cells were then washed in PBS, resuspended in PBS, and their fluorescence immediately measured by flow cytometry. For analysis of histone H2AX phosphorylation, the cells were fixed in suspension in a solution of 1% methanol‐free formaldehyde (Polysciences, Inc., Warrington, PA) dissolved in PBS for 15 min on ice followed by suspension in 80% ethanol, where they were stored at −20 °C for 2–24 h.
Immunocytochemical detection of γH2AX phosphorylation
The fixed cells were washed twice in PBS and suspended in 1% (w/v) solution of bovine serum albumin (BSA; Sigma) in PBS for 30 min to suppress nonspecific antibody (Ab) binding. The cells were then incubated in 100 µL of 1% BSA containing 1 : 100 diluted antiphospho‐histone H2AX (Ser‐139) mAb (Upstate, Lake Placid, NY). The cells were then incubated for 2 h at room temperature, washed twice with PBS and resuspended in BSA in 100 µl of 1 : 30 diluted flourescein isothiocyanate (FITC)‐conjugated F(ab′)2 fragment of goat antimouse immunoglobulin (Dako, Carpinteria, CA, USA) for 30 min at room temperature in the dark. The cells were then counterstained with 5 µg/ml propidium iodide (PI) in the presence of 100 µg/ml of RNase A (Sigma). Other details of the experimental procedure have been presented previously (Halicka et al. 2005; Kurose et al. 2005; Tanaka et al. 2006).
Fluorescence measurements
Cellular green (FITC) and red (PI) fluorescence of cells in suspension were measured using a FASCcan flow cytometer (Becton‐Dickinson, San Jose, CA). The red (PI) and green (FITC) fluorescence from each cell were separated and quantified using the standard optics and CELLQuest software (Becton‐Dickinson). Gating analysis was carried out to obtain mean values of γH2AX IF for G1 (DI = 0.9–1.1), S (DI = 1.2–1.8) and G2M (DI = 1.9–2.1) cells in each experiment. The mean values (± SD) of the measurement from three independent experiments are presented in 2, 3. Oxidation of H2DCF‐DA (Sheng‐Tanner et al. 1998) was assayed by measuring green fluorescence of the cells exposed to these reagents with the FACScan flow cytometer. Each experiment was run in duplicate or triplicate. All experiments were repeated at least three times.
Figure 2.
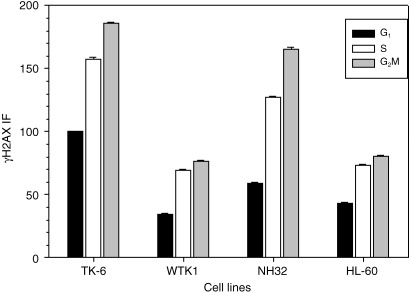
Differences in γH2AX IF between untreated (Ctrl) TK6, WTK1, NH32 and HL‐60 cells, at different phases of the cell cycle. For comparison, the data were normalized to express mean values of γH2AX IF of cells in G1, S and G2M subpopulations of each of the cell lines as a fraction of the mean γH2AX IF of G1‐phase cells from TK6 cultures (x = 100). Because of the large number of cells measured per sample (10 000) the SEM was very small (marked by ticks that are barely visible).
Figure 3.
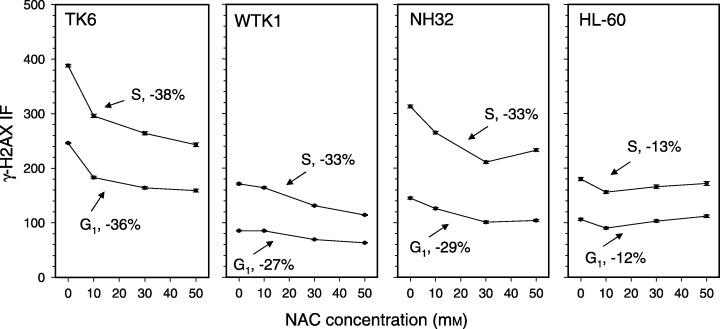
Changes in mean γH2AX IF of G1 and S cells as a function of cell treatment with different concentration of NAC. The cells were untreated or were treated with 10, 30 or 50 mm NAC for 2 h, then fixed, and by gating analysis their mean γH2AX IF and the DNA content were estimated for subpopulations of cells in G1 and S phases of the cell cycle. The percent of maximal decrease of the mean γH2AX IF of the NAC‐treated G1 or S‐phase cells, with respect to the untreated cells in S or G1 phase, respectively, is shown for each cell line. As in Fig. 2, the ticks representing SEM for each measurement can barely be seen.
RESULTS
Figure 1 illustrates expression of γH2AX with respect to cellular DNA content (cell‐cycle phase) in TK6, WTK1, NH32 and HL‐60 cells, untreated (control) or exposed to different concentrations of NAC. The intensity γH2AX IF of cells of all four cell lines was measured under identical conditions (with the same, laser and photomultiplier voltage settings and the same flow rate). Therefore, the observed differences reflect variability in expression of γH2AX. The dashed line was plotted in all panels of Fig. 1 to outline the position of the mean value of γH2AX IF of the S‐phase cells from untreated TK6 samples, to allow for better visualization of the differences in the level of γH2AX expression between control and NAC‐treated cells, and between the cell lines. It is evident that among the untreated cells, when compared in their respective cell‐cycle phases, the intensity of γH2AX IF of TK6 cells was higher than that of the cells of the other three cell lines. It is also apparent that in all four cell lines the S‐ and G2M‐phase cells had higher expression of γH2AX compared to cells in G1 phase. These raw data also demonstrate that exposure of cells to NAC led to a decrease in intensity of γH2AX IF. In the case of TK6 and NH32 cells, the decrease was distinctly NAC‐concentration dependent. For WTK1 and HL60 cells, the decrease was much less pronounced and, thus, any NAC‐concentration dependency was less evident.
Figure 1.
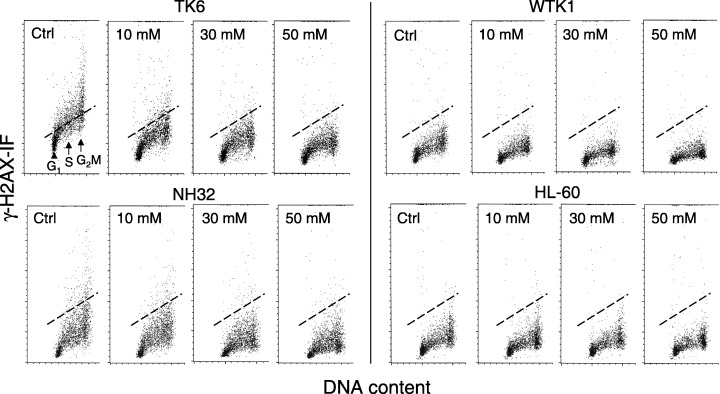
Bivariate cellular DNA content vs. γH2AX IF distributions (scatterplots) of TK6, WTK1, NH32 and HL‐60 cells, untreated (ctrl) and treated with NAC at a concentration of 10–50 mm for 2 h. The intensity of γH2AX IF of cells in all four lines was measured under identical settings of photomultiplier sensitivity. The dashed‐line provides the position marker that represents the mean value of γH2AX IF of S‐phase TK6 cells from the untreated culture. The line is positioned at the same level in other panels, for comparison with γH2AX IF of NAC‐treated cells and between the other cell lines studied.
Figure 2 shows the data that reveal the differences in expression of γH2AX between G1 versus S versus G2M cells, and between different cell lines. To allow the comparison to be made, the data were normalized to express means of γH2AX IF of the untreated cells, in respective phases of the cell cycle, in relation to the mean γH2AX IF of G1 cells of the TK6 cell line defined as 100. As is evident, the mean values of γH2AX IF of S‐ and G2M‐phase cells were distinctly higher compared to G1 cells in each of the cell lines studied. Furthermore, in each phase of the cell cycle, WTK1, HL‐60 and NH32 cells had lower expression of γH2AX compared to TK6 cells in their respective cell cycle phases.
The statistical significance of the observed differences in expression of γH2AX between the cell lines (untreated cells) was estimated by comparing the mean values of γH2AX IF of subpopulations of G1, S and G2M cells, respectively, in each experiment (10 000 cells measured per sample). The difference between TK6 and each of the other cell lines, for subpopulations of cells in G1 and S phase, respectively, was statistically significant at P < 0.001 in each of the three separate experiments.
The decrease in expression of γH2AX for TK6, WTK1, NH32 and HL‐60 cells treated with different concentrations of NAC is illustrated in Fig. 3. Changes in γH2AX IF were calculated separately for subpopulations of cells in G1 and S phases of the cell cycle. The data show that for TK6, WTK1 and NH32 cells, a decrease in the expression of γH2AX was NAC‐concentration dependent, and was most pronounced for TK6 cells (36–38%). Furthermore, in all four cell lines the cells in S phase of the cell cycle showed a somewhat greater decrease compared to G1 cells. The least affected were HL‐60 cells, for which a drop in γH2AX expression (12–13%) was seen at 10 mm, rather than at a higher NAC concentration.
The level of endogenous ROS in TK6, WTK, NH32 and HL‐60 cells was assayed by measuring oxidation of H2DCF‐DA in these cells (Fig. 4). As it is evident, the differences between the cell lines in this study were minor, with a large overlap between the lines. These experiments were repeated several times. No significant differences in oxidative properties between the cell lines were observed in all these measurements.
Figure 4.
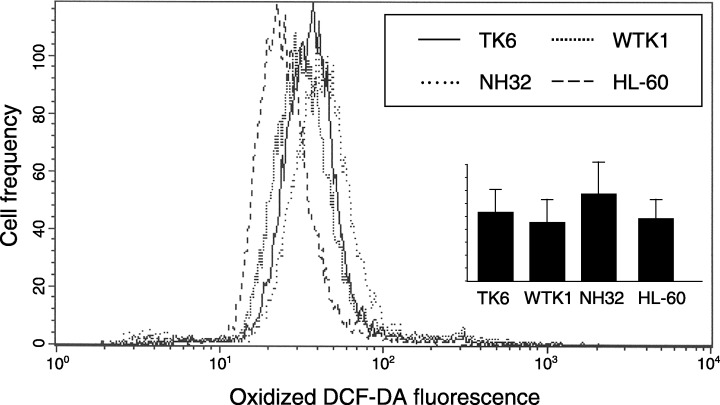
Intracellular ROS in different cell lines. TK6, WTK1, NH32 and HL‐60 cells were treated in cultures with 10 µm H2DCF‐DA for 1 h and their green fluorescence was subsequently measured by flow cytometry. The plot shows results of a single experiment. The bar graph (inset) shows mean values of H2DCF‐DA fluorescence of the cell lines measured in five independent experiments (± SD; n = 5).
DISCUSSION
The present findings confirm our earlier observation (Huang et al. 2006b) that CHP, as manifested by the presence of a fraction of phosphorylated histone H2AX, varies depending on the cell type and cycle phase, and is sensitive to NAC, the ROS scavenger.
It is likely that CHP reflects oxidative DNA damage caused by endogenous ROS, a product of metabolic activity during progression through the cell cycle. As mentioned, about 50 DSBs are being generated in the course a single cell cycle in normal, untreated human cells (Vilenchik & Knudson 2003). DSBs are formed predominantly during the S phase when replication forks collide with the ROS‐induced DNA single‐strand lesions such as DNA single‐strand breaks, apurinic/apyrimidinic sites or oxidation‐modified bases (Vilenchik & Knudson 2003). Given such a mechanism of DSB formation, it would be expected that the expression of γH2AX, known to be elevated for several hours following induction of DSBs (Sedelnikova et al. 2003; Halicka et al. 2005), would be maximal during S and G2M. Indeed, the NAC‐sensitive CHP was at higher levels in S and G2M cells than in G1 cells in the present study.
Among different cell types/lines studied by our group previously (Huang et al. 2006b), CHP was most pronounced in NHBE and pulmonary carcinoma A549 cells, both of which have wt TP53, and was distinctly lower in cell lines lacking TP53 or that expressed in its mutated form. To reveal whether indeed the CHP level is associated with expression of wt TP53, we compared the cells of three cell lines derived from the same B‐lymphoblastoid line, differing with respect to TP53 status. Also included were TK53‐null HL‐60 cells. Consistent with our earlier observation (Huang et al. 2006b), the cells expressing TP53 (TK6) had the highest level of NAC‐sensitive CHP of all four lines.
What mechanism could explain the observed differences in CHP that may be related to p53 status? TP53 is one of the key molecules involved in response to DNA damage, facilitating DNA repair (Iwabuchi et al. 1998; Squires et al. 2004; Kang et al. 2005). DNA damage‐induced phosphorylation of TP53 on Ser‐15 is directly mediated by activation of ATM and ATR (Banin et al. 1998; Canman et al. 1998). Its phosphorylation on Ser‐20 is indirectly mediated by ATM through activation of Chk2 (Chehab et al. 2000; Hirao et al. 2000). It was also reported that DNA damage induces TP53 acetylation by inhibition of both the histone deacetylase complex (HDAC1) and Sir2‐mediated deacetylation (Luo et al. 2004). Acetylated TP53 binds to DNA with higher affinity and is more effective as a transcriptional inducer (Luo et al. 2004). Depending on the nature of the DNA‐damaging agent and the extent of the damage, these modifications of TP53 trigger transcription of target genes that either activate pathways arresting cells in the cell cycle to allow for damage repair before it may be transferred to progeny cells, or alternatively, the apoptotic pathway that leads to cell demise (Hofseth et al. 2004). However, none of these interactions involving TP53 following DNA damage discussed previously, although they are pertinent to central role of TP53 in facilitating repair, provides any clue to explain the observed differences in the extent of CHP in cell lines with different TP53.
Interestingly, among its broad range of activities, TP53 induces transcription of numerous genes that not only trigger the cell's response to DNA damage, but also modulate oxidative stress (Polyak et al. 1997; Achanta & Huang 2004; Sablina et al. 2005). Early studies demonstrated that activation of TP53 following DNA damage‐induced transcription of the genes coding for proteins with oxidative function and rising endogenous ROS (Polyak et al. 1997). In these studies, however, the cells were stressed by extensive DNA damage, TP53 was up‐regulated above its normal level, and the induced oxidative stress provided the mechanism to trigger apoptosis. However, TP53 appears to have an entirely different effect when expressed at lower levels, in cells not treated with genotoxic agents. In systematic studies, Chumakov and his collaborators observed that normal levels of expression of TP53 were actually required for transcription of the genes coding for proteins with antioxidant activity (Sablina et al. 2005). Expression of these genes led to a distinct reduction of endogenous ROS. Conversely, down‐regulation of TP53 resulted in excessive oxidation of DNA that increased mutation rate and genome instability, all of which could be prevented by treatment with NAC (Sablina et al. 2005). In support of these observations are findings of Erker et al. (2005) who reported that cancer chemoprevention by some antioxidants is mediated by TP53. However, we were unable to observe significant differences in ROS production between the cell lines used in the present study (Fig. 4). Apparently, the antioxidant effect of TP53 may vary depending on other attributes of particular cell lines.
Because no significant differences in ROS were seen in our cell lines differing in TP53 status (Fig. 4), one would expect similar levels of oxidative DNA damage, and thus similar levels of CHP, indicative of the frequency of DSBs. Yet in cells bearing wt TP53, CHP was significantly elevated. Given the previous discussion, one may speculate that one of the many functions of TP53 may be to facilitate phosphorylation of H2AX on Ser‐139. Thus, with the same level of DNA damage, histone H2AX may be more effectively phosphorylated in cells bearing wt TP53. Such a function for TP53 may, in turn, facilitate activation and translocation of other DNA repair components, known to be recruited by phosphorylated H2AX (Anderson et al. 2001; Furuta et al. 2003; Downs & Cote 2005), to the sites of DSBs, thereby increasing the efficiency of DNA repair. Such a function for TP53 would be compatible with its role in sensing oxidative DNA damage and facilitating base excision repair (Offer et al. 2001; Zhou et al. 2001; Achanta & Huang 2004) as well as its direct binding to sites of DSBs and interaction with γH2AX (Al Rashid et al. 2005).
It should be stressed that although constitutive histone H2AX phosphorylation in G1, S and G2 may primarily reflect oxidative DNA damage, H2AX phosphorylation in mitotic cells may also be triggered by additional mechanisms, as discussed elsewhere (Ichijima et al. 2005; McManus & Hendzel 2005; Huang et al. 2006a). Thus, the γH2AX IF of the G2M cell subpopulation, as measured in the present study, represents the mean of G2 and M cells, and induction of γH2AX in the latter cells may involve different mechanisms from those operating in G2, G1 or S phase.
ACKNOWLEDGEMENT
Supported by NIH NCI RO1 28 704.
T. Tanaka and A. Kurose contributed equally to this study.
REFERENCES
- Achanta G, Huang P (2004) Role of p53 in sensing oxidative DNA damage in response to reactive oxygen species‐generating agents. Cancer Res. 64, 6233–6239. [DOI] [PubMed] [Google Scholar]
- Al Rashid ST, Dellaire G, Cuddihy A, Jalali F, Vaid M, Coackley C, Folkard M, Xu M, Chen BPC, Chen DJ, Lilge L, Prise KM, Bazet Jones DP, Bristow RG (2005) Evidence for the direct binding of phosphorylated p53 to sites of DNA breaks in vivo . Cancer Res. 65, 10810–10821. [DOI] [PubMed] [Google Scholar]
- Albino AP, Huang X, Yang J, Gietl D, Jorgensen E, Traganos F, Darzynkiewicz Z (2004) Induction of histone H2AX phosphorylation in A549 human pulmonary epithelial cells by tobacco smoke and in human bronchial epithelial cells by smoke condensate: a new assay to detect the presence of potential carcinogens in tobacco. Cell Cycle 3, 1062–1068. [PubMed] [Google Scholar]
- Albino AP, Huang X, Jorgensen E, Gietl D, Traganos F, Darzynkiewicz Z (2006) Induction of DNA double‐strand breaks in A549 and normal human pulmonary epithelial cells by cigarette smoke is mediated by free radicals. Int. J. Oncol. 28, 1491–1506. [PubMed] [Google Scholar]
- Anderson L, Henderson C, Adachi Y (2001) Phosphorylation and rapid relocalization of 53BP1 to nuclear foci upon DNA damage. Mol. Cell. Biol. 21, 1719–1729. [DOI] [PMC free article] [PubMed] [Google Scholar]
- Banin S, Moyal L, Shieh S, Taya Y, Anderson CW, Chessa L, Smorodinsky NI, Prives C, Reiss Y, Shiloh Y, Ziv Y (1998) Enhanced phosphorylation of p53 by ATM in response to DNA damage. Science 281, 1674–1677. [DOI] [PubMed] [Google Scholar]
- Barzilai A, Yamamoto K (2004) DNA damage responses to oxidative stress. DNA Repair 3, 1109–1115. [DOI] [PubMed] [Google Scholar]
- Bassing CH, Suh H, Ferguson DO, Chua KF, Manis J, Eckersdorff M, Gleason M, Bronson R, Lee C, Alt FW (2003) Histone H2AX: a dosage‐dependent suppressor of oncogenic tranlocations in tumors. Cell 114, 359–370. [DOI] [PubMed] [Google Scholar]
- Beckman KB, Ames BN (1997) Oxidative decay of DNA. J. Biol. Chem. 272, 13300–13306. [DOI] [PubMed] [Google Scholar]
- Burma S, Chen BP, Murphy M, Kurimasa A, Chen DJ (2001) ATM phosphorylates histone H2AX in response to DNA double‐strand breaks. J. Biol. Chem. 276, 42462–42467. [DOI] [PubMed] [Google Scholar]
- Canman CE, Lim DS, Cimprich KA, Taya Y, Tamai K, Sakaguchi K, Appella E, Kastan MB, Siciliano JD (1998) Activation of the ATM kinase by ionizing radiation and phosphorylation of p53. Science 281, 1677–1679. [DOI] [PubMed] [Google Scholar]
- Celeste A, Difilippantonio S, Fernandez‐Capetillo O, Pilch DR, Sedelnikova O, Eckhaus M, Ried T, Bonner WM, Nussenzweig A (2003) H2AX haploinsufficiency modifies genomic stability and tumor susceptibility. Cell 114, 371–383. [DOI] [PMC free article] [PubMed] [Google Scholar]
- Celeste A, Paterson S, Romanienko PJ, Fernandez‐Capetillo O, Chen HT, Sedelnikov OA, Reina‐San_martin B, Coppola V, Meffre E, Difilippantonio MJ, Redon C, Pilch DR, Olaru A, Eckhaus M, Camerini‐Otero RD, Tessarollo L, Livak F, Manova K, Bonner WM, Nussenzweig MC, Nussenzeig A (2002) Genomic instability in mice lacking histone H2AX. Science 296, 922–927. [DOI] [PMC free article] [PubMed] [Google Scholar]
- Chehab NH, Malikzay A, Appel M, Halazonetis TD (2000) Chk2/hCds1 functions as a DNA damage checkpoint in G (1) by stabilizing p53. Genes Dev. 14, 278–288. [PMC free article] [PubMed] [Google Scholar]
- Downs JA, Cote J (2005) Dynamics of chromatin during the repair of DNA double‐strand breaks. Cell Cycle 4, 1373–1376. [DOI] [PubMed] [Google Scholar]
- Erker L, Schubert R, Yakushiji H, Barlow C, Larson D, Mitchell JB, Wynshaw‐Boris A (2005) Cancer chemoprevention by the antioxidant tempol acts partially via the p53 tumor suppressor. Human Mol. Genet. 14, 1699–1708. [DOI] [PubMed] [Google Scholar]
- Fernandez‐Capetillo O, Chen H‐T, Celecte A, Ward I, Romanienko P, Morales JC, Naka K, Xia Z, Camerini‐Otero RD, Motoyama N, Carpenter PB, Bonner WM, Chen J, Nussenzweig A (2002) DNA damage‐induced G2‐M checkpoint activation by histone H2AX and 53BP1. Nat. Cell Biol. 4, 993–997. [DOI] [PubMed] [Google Scholar]
- Foster ER, Downs JA (2005) Histone H2AX phosphorylation in DNA double‐strand break repair. FEBS J. 272, 3231–3240. [DOI] [PubMed] [Google Scholar]
- Furuta T, Takemura H, Liao Z‐Y, Aune GJ, Redon C, Sedelnikova OA, Pilch DR, Rogakou EP, Celeste A, Chen HT, Nussenzweig A, Aladjem MI, Bonner WM, Pommier Y (2003) Phosphorylation of histone H2AX and activation of Mre11, Rad50, and Nbs1 in response to replication‐dependent DNA double‐strand breaks induced by mammalian topoisomerase I cleavage complexes. J. Biol. Chem. 278, 20303–20312. [DOI] [PubMed] [Google Scholar]
- Halicka HD, Huang X, Traganos F, King MA, Dai W, Darzynkiewicz Z (2005) Histone H2AX phosphorylation after cell irradiation with UV‐B: Relationship to cell cycle phase and induction of apoptosis. Cell Cycle 4, 339–345. [PubMed] [Google Scholar]
- Hirao A, Konh YY, Mathuoka S, Wakeham A, Ruland J, Yoshida H, Liu D, Elledge SJ, Mak TW (2000) DNA damage‐induced activation of p53 by the checkpoint kinase Chk2. Science 287, 1765–1767. [DOI] [PubMed] [Google Scholar]
- Hofseth LJ, Hussain SP, Harris CC (2004) p53: 25 years after its discovery. Trends Pharmacol. Sci. 25, 177–181. [DOI] [PubMed] [Google Scholar]
- Huang X, Traganos F, Darzynkiewicz Z (2003) DNA damage induced by DNA topoisomerase I‐ and topoisomerase II‐ inhibitors detected by histone H2AX phosphorylation in relation to the cell cycle phase and apoptosis. Cell Cycle 2, 614–619. [PubMed] [Google Scholar]
- Huang X, Okafuji M, Traganos F, Luther E, Holden E, Darzynkiewicz Z (2004) Assessment of histone H2AX phosphorylation induced by DNA topoisomerase I and II inhibitors topotecan and mitoxantrone and by DNA crosslinking agent cisplatin. Cytometry 58A, 99–110. [DOI] [PubMed] [Google Scholar]
- Huang X, Halicka HD, Traganos F, Tanaka T, Kurose A, Darzynkiewicz Z (2005) Cytometric assessment of DNA damage in relation to cell cycle phase and apoptosis. Cell Prolif. 38, 223–243. [DOI] [PMC free article] [PubMed] [Google Scholar]
- Huang X, Kurose A, Tanaka T, Traganos F, Dai W, Darzynkiewicz Z (2006a) Sequential phosphorylation of Ser‐10 on histone H3 and Ser‐139 on histone H2AX and ATM activation during premature chromosome condensation: Relationship to cell‐cycle and apoptosis. Cytometry 69A, 222–229. [DOI] [PubMed] [Google Scholar]
- Huang X, Tanaka T, Kurose A, Traganos F, Darzynkiewicz Z (2006b) Constitutive histone H2AX phosphorylation on Ser‐139 in cells untreated by genotoxic agents is cell‐cycle phase specific and attenuated by scavenging reactive oxygen species. Int. J. Oncol. in press. [PubMed] [Google Scholar]
- Ichijima Y, Sakasai R, Okita N, Asahina K, Mizutani S, Teraoka H (2005) Phosphorylation of histone H2AX at M phase in human cells without DNA damage response. Biochem. Biophys. Res. Commun. 336, 807–812. [DOI] [PubMed] [Google Scholar]
- Iwabuchi K, Li B, Massa BJ, Trask T, Date T, Fields S (1998) Stimulation of p53‐mediated transcriptional activation by the p53‐binding proteins, 53BP1 and 53BP2. J. Biol. Chem. 273, 26061–26068. [DOI] [PubMed] [Google Scholar]
- Jackson SP (2001) DNA damage signaling and apoptosis. Biochem. Soc. Trans. 29, 655–661. [DOI] [PubMed] [Google Scholar]
- Kang J, Ferguson D, Song H, Bassing C, Eckersdorff M, Alt FW, Xu Y (2005) Functional interaction of H2AX, NBS1, and p53 in ATM‐dependent DNA damage responses and tumor suppression. Mol. Cell. Biol. 25, 661–670. [DOI] [PMC free article] [PubMed] [Google Scholar]
- Kurose A, Tanaka T, Huang X, Halicka HD, Traganos F, Dai W, Darzynkiewicz Z (2005) Assessment of ATM phosphorylation on Ser‐1981 induced by DNA topoisomerase I and II inhibitors in relation to Ser‐139‐histone H2AX phosphorylation, cell cycle phase and apoptosis. Cytometry 68A, 1–9. [DOI] [PubMed] [Google Scholar]
- Luo J, Li M, Tang Y, Laszkowska M, Roeder RG, Gu W (2004) Acetylation of p53 auguments its site‐specific DNA binding both in vitro and in vivo . Proc. Natl. Acad. Sci. USA 101, 2259–2264. [DOI] [PMC free article] [PubMed] [Google Scholar]
- MacPhail SH, Banath JPYuY, Chu E, Olive PL (2003) Cell cycle‐dependent expression of phosphorylated histone H2AX: reduced expression in unirradiated but not X‐irradiated G1‐phase cells. Radiat. Res. 159, 759–767. [DOI] [PubMed] [Google Scholar]
- McManus KJ, Hendzel MJ (2005) ATM‐dependent DNA damage independent mitotic phosphorylation of H2AX in normally growing mammalian cells. Mol. Biol. Cell. 16, 5013–5025. [DOI] [PMC free article] [PubMed] [Google Scholar]
- Modesti M, Kanaar R (2001) DNA repair: spot(light)s on chromatin. Curr. Biol. 11, R229–R232. [DOI] [PubMed] [Google Scholar]
- Moller P, Loft S (2004) Interventions with antioxidants and nutrients in relation to oxidative DNA damage and repair. Mutat. Res. 551, 79–89. [DOI] [PubMed] [Google Scholar]
- Nohl H (1994) Generation of superoxide radicals as byproducts of cellular respiration. Ann. Biol. Clin. 52, 199–204. [PubMed] [Google Scholar]
- Offer H, Milyavsky M, Erez N, Matas D, Zurer I, Harris CC, Rotter V (2001) Structural and functional involvement of p53 in BER in vitro and in vivo . Oncogene 20, 581–589. [DOI] [PubMed] [Google Scholar]
- Park EJ, Chan DW, Park JH, Oettinger MA, Kwon J (2003) DNA‐PK is activated by nucleosomes and phosphorylated H2AX within the nucleosomes in an acetylation‐dependent manner. Nucleic Acids Res. 31, 6819–6827. [DOI] [PMC free article] [PubMed] [Google Scholar]
- Parrinello S, Samper E, Krtolica A, Goldstein J, Melov S, Campisi J (2003) Oxygen sensitivity severely limits the replicative lifespan of murine fibroblasts. Nat. Cell Biol. 5, 741–747. [DOI] [PMC free article] [PubMed] [Google Scholar]
- Paull TT, Rogakou EP, Yamazaki V, Kirchgesser CU, Gellert M, Bonner WM (2000) A critical role for histone H2AX in recruitment of repair factors to nuclear foci after DNA damage. Curr. Biol. 10, 886. [DOI] [PubMed] [Google Scholar]
- Polyak K, Xia Y, Zweier JL, Kinzler KW, Vogelstein B (1997) A model for p53‐induced apoptosis. Nature 389, 300–305. [DOI] [PubMed] [Google Scholar]
- Rogakou EP, Boon C, Redon C, Bonner WM (1999) Megabase chromatin domains involved in DNA double‐strand breaks in vivo . J. Cell Biol. 146, 905–916. [DOI] [PMC free article] [PubMed] [Google Scholar]
- Rogakou EP, Pilch DR, Orr AH, Ivanova VS, Bonner WM (1998) DNA double‐stranded breaks induce histone H2AX phosphorylation on serine 139. J. Biol. Chem. 273, 5858–5868. [DOI] [PubMed] [Google Scholar]
- Sablina AA, Budanov AV, Ilyinskaya GV, Agapova LS, Kravchenko JE, Chumakov PM (2005) The anti‐oxidant function of the p53 tumor suppressor. Nat. Med. 11, 1306–1313. [DOI] [PMC free article] [PubMed] [Google Scholar]
- Schriner SE, Linford NJ, Martin GM, Treuting P, Ogburn CE, Emond M, Coskun PE, Ladiges W, Wolf N, Van Remmen H, Wallace DC, Rabinovitch PS (2005) Extension of murine life span by overexpression of catalase targeted to mitochondria. Science 308, 1909–1911. [DOI] [PubMed] [Google Scholar]
- Schwartz JL, Jordan E, Evans HH, Lenarczyk M, Liber H (2003) The TP53 dependence of radiation–induced chromosome instability in human lymphoblastoid lines. Radiat. Res. 159, 730–736. [DOI] [PubMed] [Google Scholar]
- Sedelnikova OA, Pilch DR, Redon C, Bonner WM (2003) Histone H2AX in DNA damage and repair. Cancer Biol. Ther. 2, 233–235. [DOI] [PubMed] [Google Scholar]
- Sedelnikova OA, Rogakou EP, Panyutin IG, Bonner W (2002) Quantitive detection of 125IUdr‐induced DNA double‐strand breaks with γ‐H2AX antibody. Radiat. Res. 158, 486–492. [DOI] [PubMed] [Google Scholar]
- Sheng‐Tanner X, Bump EA, Hedley DW (1998) An oxidative stress‐mediated death pathway in irradiated human leukemia cells mapped using multilaser flow cytometry. Radiat. Res. 150, 636–647. [PubMed] [Google Scholar]
- Squires S, Coates JA, Goldberg M, Toji LH, Jackson SP, Clarke DJ, Johnson RT (2004) p53 prevents the accumulation of double‐strand DNA breaks at stalled–replication forks induced by UV in human cells. Cell Cycle 3, 1543–1557. [DOI] [PubMed] [Google Scholar]
- Tanaka T, Kurose A, Huang X, Dai W, Darzynkiewicz Z (2006) ATM kinase activation and histone H2AX phosphorylation as indicators of DNA damage by DNA topoisomerase I inhibitor topotecan and during apoptosis. Cell Prolif. 39, 49–60. [DOI] [PMC free article] [PubMed] [Google Scholar]
- Thatcher TH, Gorovsky MA (1994) Phylogenetic analysis of the core histones H2A, H2B, H3 and H4. Nucleic Acids Res. 22, 174–179. [DOI] [PMC free article] [PubMed] [Google Scholar]
- Vilenchik MM, Knudson AG (2003) Endogenous DNA double‐strand breaks: Production, fidelity of repair, and induction of cancer. Proc. Natl. Acad. Sci. USA 100, 12871–12875. [DOI] [PMC free article] [PubMed] [Google Scholar]
- West MH, Bonner WM (1980) Histone 2A, a heteromorphous family of eight protein species. Biochemistry 19, 3238–3245. [DOI] [PubMed] [Google Scholar]
- Zhou J, Ahn J, Wilson SH, Prives C (2001) A role for p53 in base excision repair. EMBO J. 20, 914–923. [DOI] [PMC free article] [PubMed] [Google Scholar]