Abstract.
Polyploid cells are made by DNA reduplication without cell division, however, it is not easy to establish polyploid mammalian cell lines. It is worth studying the difference in cell character between hyperploid and parent cell lines. Meth‐A cells were polyploidized by demecolcine, K‐252a, staurosporine and paclitaxel. The cell‐cycle responses of highly polyploid Meth‐A cells after the removal of the drugs were examined by flow cytometry (FCM). Meth‐A cells were highly polyploidized by these drugs. The polyploid Meth‐A cells gradually decreased in ploidy after the drug release. A tetraploid Meth‐A cell line was established only from the demecolcine‐induced polyploid Meth‐A cells. The duration of G1, S and G2/M phases of the tetraploid cell line were mostly the same as those of the parent diploid cells, except that the G2/M phase was 1.5 h longer. The chromosome number of tetraploid Meth‐A cell line was about twice of the diploidy. A tetraploid Meth‐A cell line was established.
Introduction
Meth‐A cells, a methylcholanthrene‐induced sarcoma cell line, are polyploidized by demecolcine, K‐252a, staurosporine and paclitaxel (Roberts et al. 1990; Fujikawa‐Yamamoto, Teraoka & Odashima 1993; Fujikawa‐Yamamoto et al. 1994), though some of the highly polyploidized cells die by apoptosis (Zong et al. 1998). The cells always have a small population of large cells which were spontaneously polyploidized and resulted in apoptosis (Fujikawa‐Yamamoto et al. 1997a). Meth‐A cells may be easily polyploidizable. It is of interest whether or not Meth‐A cells polyploidized by different mechanisms behave in a different manner after drug removal.
Demecolcine (Colcemid) antagonizes tubulin polymerization and induces the disassembly of microtubules into monomers (Inoue 1981). The drug inhibits spindle fibre formation in the M phase and polyploidizes many cells. Paclitaxel (Taxol), a diterpenoid plant product (Wani et al. 1971), enhances tubulin polymerization and prevents microtubule depolymerization (Schiff & Horwitz 1981). The unusual stability of microtubules leads to failure of cell division (Jordan et al. 1993; Long & Fairchild 1994) and induces polyploidization (Roberts et al. 1990; Lieu, Chang & Lai 1997). K‐252a and staurosporine are protein kinase inhibitors with a similar molecular structure (Kase et al. 1987; Tamaoki et al. 1986). Both polyploidize cultured cells without mitosis (G2‐G1 transition) (Usui et al. 1991), though the enzymes that are specifically inhibited by these drugs are unknown (Zollner 1993). These four drugs can polyploidize Meth‐A cells. The mechanisms of polyploidization may be different.
A relationship between the rate of DNA synthesis and DNA content has been reported for Chinese hamster cells by Graves & McMillan (1984) namely that the duration of S phase is almost constant regardless of the DNA content. Although many studies have reported a constant duration of the S phase in the polyploidization of cultured cells (Graves & McMillan 1984; Gong, Traganos & Darzynkiewicz 1993; Brenneisen, Gogol & Bayreuther 1994; Fujikawa‐Yamamoto et al. 1997b), the rate of DNA synthesis of polyploidized Meth‐A cells was constant (Fujikawa‐Yamamoto et al. 1997b). The duration of G1, S and G2/M phases of polyploid cells in a steady state of growth have not been well studied because of the difficulty in achieving such a state. It is of interest to establish a hyperploid cell line to examine what is altered by the polyploidization.
Polyploidization of mammalian cells occurs in various organs, particularly in the aged or partially hepatectomized liver. The mechanisms of polyploidization are poorly understood (Mossin et al. 1994; Zong et al. 1994; Fogt & Nanji 1996; Seglen 1997). The difference in cell character between a hyperploid and its parent cell line would be valuable to the study of polyploidization in organs. In this study, the behaviour of Meth‐A cells polyploidized by demecolcine, paclitaxel, K‐252a and staurosporine was examined by flowcytometry (FCM) for about 1 month after the removal of the drugs. A hyperploid cell line was established. The cells were examined for cell cycle parameters and the chromosome number.
MATERIALS AND METHODS
Cells
Meth‐A cells (a methylcholanthrene‐induced mouse abdominal dropsy sarcoma cell line) were maintained in a humidified atmosphere of 5% CO2 at 37 °C as a suspension culture in Leibovitz’s L15: Ham’s F10 mixture (7 : 3) supplemented with 10% fetal calf serum (M.A. Bioproducts, Walkersville, MD, USA), streptomycin (100 µg/ml) and penicillin (50 units/ml). The tetraploid Meth‐A cells were cultured in the same culture‐conditions described above.
Drug treatment and subculture
Exponentially growing Meth‐A cells were plated in culture dishes (90 mm diameter, Nalge Nunc International, IL, USA) at a density of about 5 × 10⁵ cells/dish. Twelve hours thereafter, the cells were exposed to demecolcine (270 nm, Sigma, St. Louis, MO, USA), K‐252a (800 nm, Funakoshi, Tokyo Japan), staurosporine (100 nm, Funakoshi) or paclitaxel (117 nm, Sigma) for 72 h. Then the cells were centrifuged and released from the drug exposure by resuspending them in the drug‐free medium. To obtain independent results, the Meth‐A cells were divided into six dishes after the drug release. Every 72 h, the Meth‐A cells in two dishes were subcultured by one‐half or one‐fourth, and the residual cells were prepared for FCM and cell growth measurements. This subculture cycle was started at 0, 24 and 48 h after the drug removal.
Cell preparation for FCM and cell counting
The Meth‐A cells obtained through subculture were divided into two groups. One group was enumerated by a Coulter counter (Coulter USA). The other was fixed with 20% ethanol, then incubated with 0.5 ml of 0.25% RNase (Type II‐A, Sigma) for 3 h at 4 °C. Immediately before the measurements, the cells were stained with PI (propidium iodide, 7.5 × 10⁻⁵ m) and red fluorescence was examined by means of FCM. Under these staining conditions, the signal due to residual double stranded RNA is negligible and the relative intensity of the red fluorescence corresponds to the DNA content (Krishan 1975).
Flow cytometry
The fluorescence from individual cells was measured using a FACSCalibur (Becton Dickinson immunocytometry Systems, USA). The fluorescence of individual cells irradiated with a focused laser light at a wavelength of 488 nm was detected using a photomultiplier tube. The relative intensity of red fluorescence was measured and DNA histograms were obtained.
Cell cycle analysis
FCM data (signals of red‐fluorescence intensity through a logarithmic amplifier) were input to CASL (a software for cell cycle analysis of DNA histograms on a log scale) and the DNA histograms were decomposed to cell fractions depending on the DNA content (Fujikawa‐Yamamoto 1999a). CASL is written on Mathematica (Version 2.2) with a personal computer (Quadra 840AV, Macintosh) and can analyse DNA histograms with 2c to 128c DNA content. The algorithm is similar to Fried’s method (Fried, Perez & Clarkson 1976; Fried 1977) except that normal distribution functions having a same half‐width instead of same CV value are used as components.
Chromosome analysis
Exponentially growing diploid and tetraploid Meth‐A cells were plated in culture dishes (60 mm diameter, Nalge Nunc International, IL, USA) at a density of about 5 × 10⁵ cells/dish. Twelve hours thereafter, the cells were exposed to demecolcine at a concentration of 270 nm for 1 h. The cells were swelled by 75 mm KCl, fixed with a fixing solution (CH3OH:CH3COOH = 7 : 3) and dropped onto glass slides. The cells were stained with Giemsa solution to take photographs of the chromosomes. Chromosome number was counted from the photographs. Lymphocytes of a male mouse were used for the control for karyotyping. Karyotype analysis was performed by a Karyovision (Sumitomo Kinzoku, Tokyo, Japan).
Observation of cell morphology
Exponentially growing diploid and tetraploid Meth‐A cells were washed once with PBS(–) and fixed with methanol. The cells were smeared on glass slides and stained by a haematoxylin/eosine method. The photographs were taken under a microscope (Eclipse E800, Nikon, Tokyo, Japan.) equipped with a camera system (H‐3). The photographs were taken into a personal computer (Macintosh) and printed out at a given magnification.
RESULTS
To examine the polyploidization of Meth‐A cells by demecolcine, K‐252a, staurosporine and paclitaxel, changes in DNA histograms were measured for Meth‐A cells exposed to those drugs (Fig. 1). Though the responses of Meth‐A cells differed with the drug, peaks of 16C DNA content were observed at 72 h after the drug addition, revealing the cells to be polyploid. It was concluded that at least a part of the cell population was polyploidized by these drugs.
Figure 1.
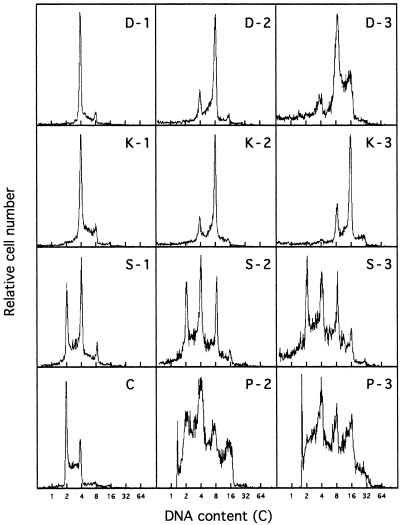
Changes in DNA fluorescence histograms of Meth‐A cells after the addition of demecolcine (D), K‐252a (K), staurosporine (S) and paclitaxel (P). Exponentially growing Meth‐A cells were exposed to demecolcine (270 nm), K‐252a (800 nm), staurosporine (100 nm) and paclitaxel (117 nm) for 3 days. DNA histograms of the cells were measured 1 (−1), 2 (−2) and 3 days (−3) after the drug addition. The histogram C is of the control. The abscissa represents the relative DNA content.
To examine the growth of Meth‐A cells after the release from drugs, cell numbers were counted, corrected for the subcultures and plotted against days after the drug removal (Fig. 2). The Meth‐A cells proliferated with a doubling time of 96 h till 3, 9 and 13 days after the treatment with paclitaxel, K‐252a/staurosporine and demecolcine, respectively. Then the population grew with a doubling time of about 24 h.
Figure 2.
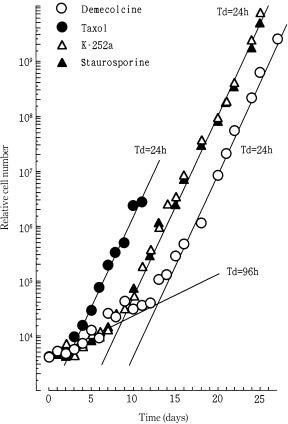
Changes in relative cell number (growth curves) of Meth‐A cells after the removal of demecolcine (○), K‐252a (▵), staurosporine (▴) and paclitaxel (●). Exponentially growing Meth‐A cells were exposed to demecolcine (270 nm), K‐252a (800 nm), staurosporine (100 nm) and paclitaxel (117 nm) for 3 days. The cells were released from the drugs and cultured again with a 3‐day‐interval subculture. The x‐axis represents the time (days) after the drug removal. Solid lines were drawn to facilitate understanding.
To examine the difference in the cell‐cycle response of polyploidized Meth‐A cells, the DNA histograms were examined by FCM to determine the cell populations after the release from the four drugs (3, 4). Figure 3 shows the DNA histograms after the removal of demecolcine (left panel) and paclitaxel (right panel). The ploidy of the Meth‐A cell population increased just after the demecolcine release and was maintained for 8 days. The highly polyploid fraction decreased and tetraploidy having from 4c to 8c DNA content became the major population. Paclitaxel‐induced polyploid Meth‐A cells increased in ploidy just after the drug release, as was the case for demecolcine. In contrast to demecolcine, the ploidy was maintained only for 3 days. Then the fraction of polyploid cells disappeared rapidly and became diploid.
Figure 3.
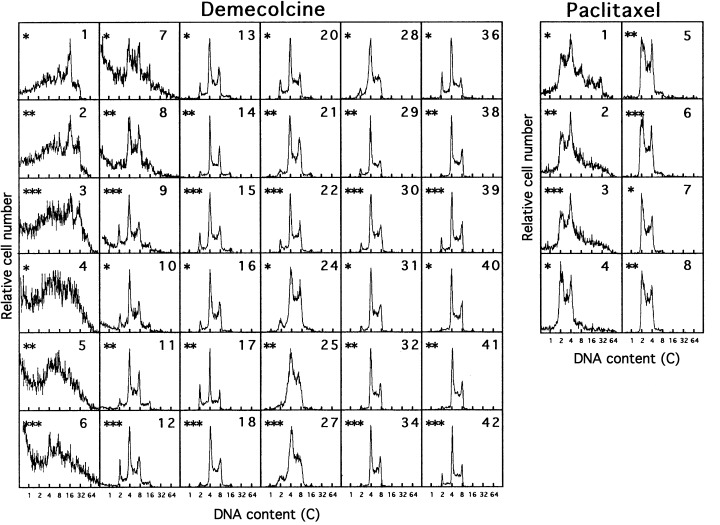
Changes in DNA fluorescence histograms of Meth‐A cells after the removal of demecolcine (left panel) and paclitaxel (right panel). Exponentially growing Meth‐A cells were exposed to demecolcine (270 nm) and paclitaxel (117 nm) for 3 days. The cells were released from the drugs and cultured again with a 3‐day‐interval subculture. The numerals in the histograms represent the time (days) after the drug removal. *Culture dishes of independent experiments. The x‐axis represents the relative DNA content (C).
Figure 4.
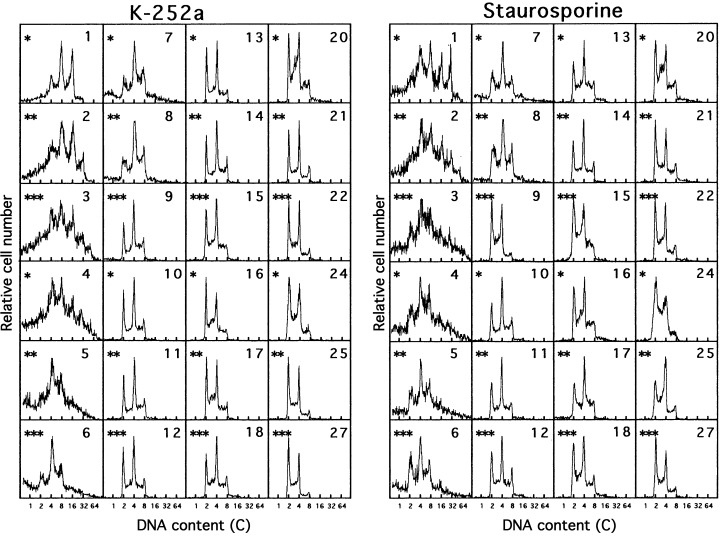
Changes in DNA fluorescence histograms of Meth‐A cells after the removal of K‐252a (left panel) and staurosporine (right panel). Exponentially growing Meth‐A cells were exposed to K‐252a (800 nm) and staurosporine (100 nm) for 3 days. The cells were released from the drugs and cultured again with a 3‐day‐subculture interval. The numerals in the histograms represent the time (days) after the drug removal. *Culture dishes of independent experiments. The x‐axis represents the relative DNA content (C).
After K‐252a removal, the Meth‐A cell population increased in ploidy for 4 days, and became a mixture of diploid and tetraploid cells for 8–20 days. Then the fraction of diploid cells increased gradually (Fig. 4). An analogous response was observed in the Meth‐A cell population after staurosporine release. Note that the DNA histograms were obtained from three independent experiments and the data for 3 days interval belong to a series. We attributed the cell growth from 3, 9 and 13 days after the paclitaxel, K‐252a/staurosporine and demecolcine removal to diploid, diploid/tetraploid and tetraploid Meth‐A cells, respectively.
The tetraploid cells were subcultured for 17 months, meaning for greater than 500 cell‐divisions. The DNA histograms showed tetraploidy. The photographs of tetraploid cells are shown in Fig. 5. To ascertain that the tetraploid Meth‐A cells had been established as a cell line, the tetraploid cells were stored at −135 °C for few weeks and then replated in culture. The diploid (parent) and tetraploid Meth‐A cells in a steady state of growth grew with a doubling time of 24.0 and 25.6 h, respectively (Fig. 6).
Figure 5.
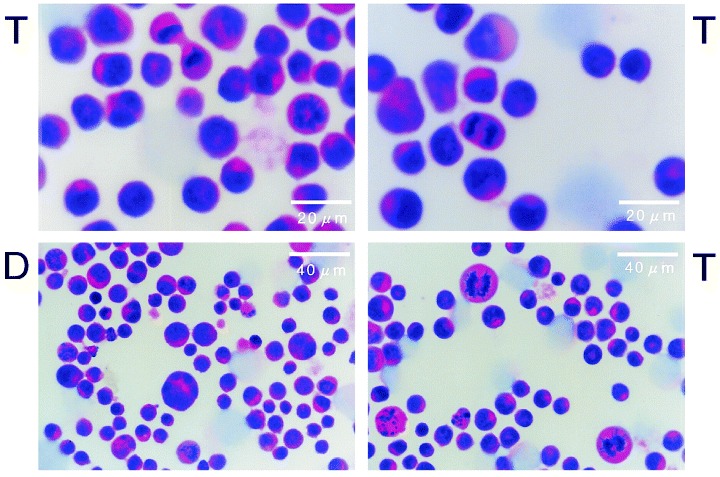
Photomicrographs of diploid and tetraploid Meth‐A cells in exponential growth. Exponentially growing cells were fixed with methanol and stained by a haematoxylin/eosine method. D and T represent photographs of diploid and tetraploid Meth‐A cells, respectively.
Figure 6.
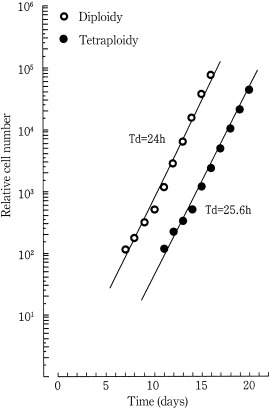
Changes in relative cell number (growth curves) of diploid (○) and tetraploid (●) Meth‐A cells. Diploid and tetraploid Meth‐A cells stored at −135 °C were replated in culture. The cells were subcultured everyday by one/half or one/fourth, and the residual cells were enumerated. The doubling times of diploid (parent) and tetraploid Meth‐A cells in a steady state of growth were 24.0 and 25.6 h, respectively. Solid lines were drawn to facilitate understanding.
The DNA histograms of diploid and tetraploid cells are shown in Fig. 7. Figure 7 is representative of the output from the cell cycle analysis software, ‘CASL’. The cell‐cycle parameters are listed in 1, 2. In Table 2, the duration of G1, S and G2/M phases were calculated using the doubling time instead of cycle time (Watanabe & Okada 1967). A remarkable difference was observed in the G2/M phase duration: it was about 1.5 h longer in tetraploids than in diploids.
Figure 7.
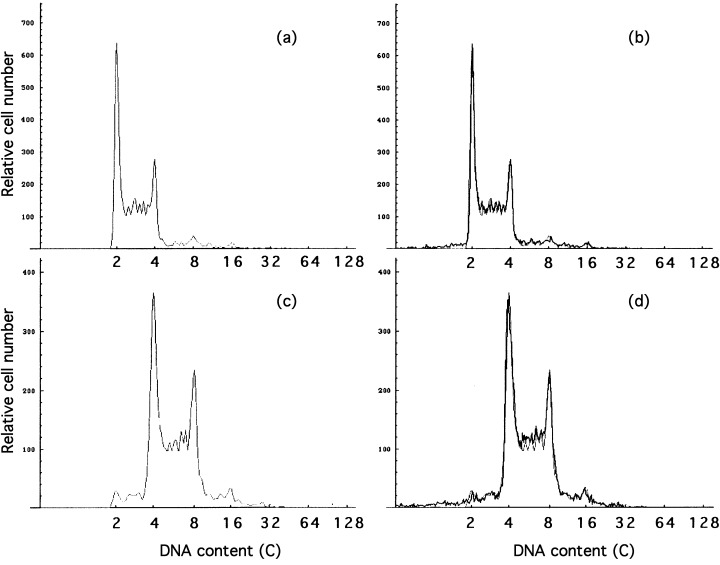
Representative outputs of CASL (Cell‐cycle analysis on a scale of log) for DNA histograms of diploid (A and B) and tetraploid (C and D) Meth‐A cells. Panels A and C represent synthesized histograms of Meth‐A cells, and panels B and D the synthesized histograms superposed upon the experimental one.
Table 1.
Cell‐cycle parameters of diploid and tetraploid Meth‐A cell lines. Fractions in the total cell population
| Phase | 2C | 2S | 4C | 4S | 8C | 8S | 16C | 16S | > 32C |
|---|---|---|---|---|---|---|---|---|---|
| Diploidy | 0.28 | 0.45 | 0.12 | 0.07 | 0.02 | 0.04 | 0.01 | 0.01 | 0.00 |
| Tetraploidy | 0.02 | 0.07 | 0.23 | 0.39 | 0.15 | 0.08 | 0.02 | 0.03 | 0.00 |
Table 2.
Cell‐cycle parameters of diploid and tetraploid Meth‐A cell lines. Fractions and duration of diploid and tetraploid Meth‐A cells
| G1 | S | G2/M | |
|---|---|---|---|
| Diploidy fraction* | 0.33 | 0.53 | 0.14 |
| Tetraploidy fraction* | 0.30 | 0.51 | 0.19 |
| Diploidy duration (h)† | 6.2 | 13.2 | 4.5 |
| Tetraploidy duration (h)† | 6.0 | 13.1 | 6.4 |
*2C, 2S and 4C were regarded as the G 1, S and G2/M of diploid cells, and 4C, 4S and 8C, as the G1, S and G2/M of tetraploidy. †Duration was calculated using the doubling time instead of cycle time (28).
To confirm the integrity of tetraploid Meth‐A cells, the chromosomes of diploid and tetraploid Meth‐A cells were examined (Fig. 8). Figure 8 shows the karyotyping charts and chromosome number distribution of diploid and tetraploid Meth‐A cells. Though the number of chromosomes is distributed widely and the karyotyping of Meth‐A cells is much different from that of mouse lymphocyte, the chromosome number of tetraploid Meth‐A cells was about twice that of the diploids, suggesting the integrity of chromosome number in tetraploid Meth‐A cells.
Figure 8.
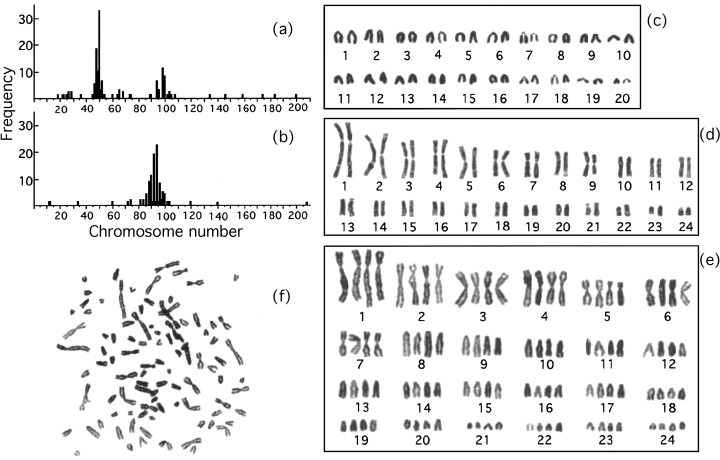
Histograms of chromosome number and karyotyping charts for diploid and tetraploid Meth‐A cells. Exponentially growing diploid and tetraploid Meth‐A cells were exposed to demecolcine (270 nm) for 1 h. The chromosomes were stained with Giemsa solution. Panels A and B represent histograms of chromosome number for diploid and tetraploid Meth‐A cells, respectively. Panels D and E represent karyotyping charts of a cell from panels A and B, respectively. Panel F is the original photograph of panel E. Panel C is obtained from lymphocytes of a male mouse.
DISCUSSION
Polyploid cells are made by DNA reduplication without cell division, however, it is not so easy to establish polyploid mammalian cell lines. Usui et al. (1991) failed to establish polyploid clones using K‐252a and suggested that the cells of tetraploid or higher DNA content lose their reproducible integrity. Ishida et al. (1994) showed that polyploidized cells obtained by topoisomerase exposure lost their viability. Here, we established a tetraploid Meth‐A cell line from cells highly polyploidized by demecolcine, but not by K‐252a, staurosporine or paclitaxel.
Though Meth‐A cells were polyploidized by all of the agents, demecolcine, K‐252a, staurosporine and paclitaxel, the cell cycle responses were different after the removal of the drugs. K‐252‐ and staurosporine‐induced polyploidized Meth‐A cells showed similar responses. They became a diploid/tetraploid mixture from 8 to 25 days after the drug release, and then gradually a diploidy population. Though such a ploidy mixture after polyploidization by K‐252a was observed in V79 cells, V79 cells would not become tetraploid by demecolcine treatments as in this experiment (Fujikawa‐Yamamoto et al. 2000). Paclitaxel‐induced highly polyploidized cells disappeared within 4 days of release. Though it was not clear whether the polyploid cells changed back to diploid cells or died, the sub2C fraction which indicated apoptotic or dead cells was small, suggesting the former. By contrast, the sub2c fraction was large after the demecolcine release, suggesting the apoptosis of highly polyploidized Meth‐A cells (Zong et al. 1998). We were able to establish a tetraploid Meth‐A cell line in three independent experiments, suggesting that the results are reproducible.
At this point, we can not explain the different responses of Meth‐A cells after the polyploidization by different drugs. It has been suggested that K‐252a and staurosporine polyploidize cells through the bypass of G2 to G1 (Abe et al. 1991), resulting in the multilobed‐mononuclear morphology of polyploid cells (Fujikawa‐Yamamoto et al. 1999b). Demecolcine and paclitaxel polyploidize cells through arrest before and after the formation of spindle fibers in the M phase, resulting in a complex mini/multi and simple multi/mono nuclear morphology, respectively (Fujikawa‐Yamamoto et al. 1999b). In spite of the difference in nuclear morphology of polyploid cells that has been reported, whether highly polyploid cells become diploid or die is unknown.
It is of interest that the cell cycle parameters were almost the same for the diploid and tetraploid Meth‐A cell lines, except that the G2/M phase was 1.5 h longer in the latter. Though constant and double‐increase rates of DNA synthesis have been reported for polyploid cells, the cycle time increased with the ploidy in both cases (Graves & McMillan 1984; Fujikawa‐Yamamoto et al. 1997b). The equivalence in cell cycle parameters suggests that the tetraploid cells have double the content of all the elements of diploid Meth‐A cells. If the intracellular content increases with ploidy in Meth‐A cells, a spatial increase would cause a delay in the transport of materials in highly polyploid cells, resulting in a gradual loss of highly polyploid cells.
That the duration of the S phase is the same between diploid and tetraploid cell lines means that the rate of DNA synthesis is double in the tetraploid cells. We have reported a constant rate of DNA synthesis in polyploidizing Meth‐A cells under continuous exposure to demecolcine (Fujikawa‐Yamamoto et al. 1997b). The mechanism of DNA synthesis may differ between Meth‐A cells in the process of polyploidization and in the steady state of growth.
Acknowledgements
This study was supported in part by a grant for High‐Technology Research Center Project by the Ministry of Education of Japan and Kanazawa Medical University (H1). The author wish to thank Dr Mamoru Ozaki who helped with karyotyping of mice.
References
- Abe K, Yoshida M, Usui T, Horinouchi S, Beppu T (1991) Highly synchronous culture of fibroblasts from G2 brock caused by staurosporine, a potent inhibitor of protein kinases. Exp. Cell Res. 192, 122–127. [DOI] [PubMed] [Google Scholar]
- Brenneisen P, Gogol J, Bayreuther K (1994) DNA synthesis and Fos and Jun protein expression in mitotic and postmitotic WI‐38 fibroblasts in vitro. Exp. Cell Res. 211, 219–230.DOI: 10.1006/excr.1994.1081 [DOI] [PubMed] [Google Scholar]
- Fogt F & Nanji AA (1996) Alterations in nuclear ploidy and cell phase distribution of rat liver cells in experimental alcoholic liver disease: relationship to antioxidant enzyme gene expression. Toxicol. Appl. Pharmacol. 136, 87–93.DOI: 10.1006/taap.1996.0010 [DOI] [PubMed] [Google Scholar]
- Fried J (1977) Analysis of deoxyribonucleic acid histograms from flowcytofluorometry. Estimation of distribution of cells within S phase. J. Histochem. Cytochem. 25, 942–951. [DOI] [PubMed] [Google Scholar]
- Fried J, Perez AG, Clarkson BD (1976) Flowcytofluorometric analysis of cell cycle distribution using propidium iodide. Properties of the method and mathematical analysis of the data. J. Cell Biol. 71, 172–181. [DOI] [PMC free article] [PubMed] [Google Scholar]
- Fujikawa‐Yamamoto K (1999a) Cell cycle analysis of DNA histograms in logarithmic scale. Cytometry Res. 9, 73–84. [Google Scholar]
- Fujikawa‐Yamamoto K, Ohdoi C, Yamagishi H, Zong Z, Murakami M, Yamaguchi N (1999b) Lack of synchrony among multiple nuclei induces partial DNA fragmentation in V79 cells polyploidized by demecolcine. Cell Prolifer. 32, 337–349. [DOI] [PMC free article] [PubMed] [Google Scholar]
- Fujikawa‐Yamamoto K, Teraoka K, Odashima S (1993) Hyperploidization of V79 cells by K‐252a in comparison with demecolcine. Cell Struct. Funct. 18, 449–455. [DOI] [PubMed] [Google Scholar]
- Fujikawa‐Yamamoto K, Yamagishi H, Zong Z, Ohdoi C, Murakami M, Wang S (2000) Different responses of polyploidized V79 cells after removal of two drugs, demecolcine and K‐252a. Cell Struct. Funct. 25, 41–46. [DOI] [PubMed] [Google Scholar]
- Fujikawa‐Yamamoto K, Zong Z, Murakami M, Odashima S (1997b) Different manner of DNA synthesis in polyploidizations of Meth‐A and B16F10 cell lines. Cell Struct. Funct. 22, 527–532. [DOI] [PubMed] [Google Scholar]
- Fujikawa‐Yamamoto K, Zong Z, Murakami M, Odashima S, Ikeda T, Yoshitake Y (1997a) Spontaneous polyploidization results in apoptosis in a Meth‐A tumor cell line. Cell Struct. Funct. 22, 399–405. [DOI] [PubMed] [Google Scholar]
- Fujikawa‐Yamamoto K, Zong Z, Teraoka K, Yamagishi H, Odashima S (1994) Hyperploidization of Meth‐A and B16F10 cells by K‐252a and staurosporine. Cytometry Res. 4, 29–33. [Google Scholar]
- Gong J, Traganos F, Darzynkiewicz Z (1993) Simultaneous analysis of cell cycle kinetics at two different DNA ploidy level based on DNA content and cyclin B measurements. Cancer Res. 53, 5096–5099. [PubMed] [Google Scholar]
- Graves JA & McMillan J (1984) Control of DNA synthesis in polyploid mammalian cells. J. Cell. Physiol. 121, 409–414. [DOI] [PubMed] [Google Scholar]
- Inoue S (1981) Cell division and the mitotic spindle. J. Cell Biol. 91, 131–147. [DOI] [PMC free article] [PubMed] [Google Scholar]
- Ishida R, Sato M, Narita T et al. (1994) Inhibition of DNA topoisomerase by ICRF‐193 induces polyploidization by uncoupling chromosome dynamics from other cell cycle events. J. Cell Biol. 126, 1341–1351. [DOI] [PMC free article] [PubMed] [Google Scholar]
- Jordan MA, Toso RJ, Thrower D, Wilson L (1993) Mechanism of mitotic block and inhibition of cell proliferation by taxol at low concentrations. Proc. Natl. Acad. Sci. USA 90, 9552–9556. [DOI] [PMC free article] [PubMed] [Google Scholar]
- Kase H, Iwahashi K, Nakanishi S et al. (1987) K‐252 compounds, novel and potent inhibitors of protein kinase C and cyclic nucleotide‐dependent protein kinases. Biochem. Biophys. Res. Commun. 142, 436–440. [DOI] [PubMed] [Google Scholar]
- Krishan A (1975) Rapid flow cytofluorometric analysis of mammalian cell cycle by propidium iodide staining. J. Cell Biol. 66, 188–193. [DOI] [PMC free article] [PubMed] [Google Scholar]
- Lieu CH, Chang YN, Lai YK (1997) Dual cytotoxic mechanism of submicromolar taxol on human leukemia HL‐60 cells. Biochem. Pharmacol. 53, 1587–1596. [DOI] [PubMed] [Google Scholar]
- Long BH & Fairchild CR (1994) Paclitaxel inhibits progression of mitotic cells to G1 phase by interference with spindle formation without affecting other microtubule functions during anaphase and telophase. Cancer Res. 54, 4355–4361. [PubMed] [Google Scholar]
- Mossin L, Blankson H, Huitfeldt H, Seglen PO (1994) Ploidy‐dependent growth and binucleation in cultured rat hepatocytes. Exp. Cell Res. 214, 551–560.DOI: 10.1006/excr.1994.1293 [DOI] [PubMed] [Google Scholar]
- Roberts JR, Allison DC, Donehower RC, Rowinsky EK (1990) Development of polyploidization in taxol‐resistant human leukemia cells in vitro. Cancer Res. 50, 710–716. [PubMed] [Google Scholar]
- Schiff PB & Horwitz SB (1981) Taxol assembles tubulin in the absence of exogenous guanosine 5′‐triphosphate or microtubule‐associated proteins. Biochem. 20, 3247–3252. [DOI] [PubMed] [Google Scholar]
- Seglen PO (1997) DNA ploidy and autophagic protein degradation as determinants of hepatocellular growth and survival. Cell Biol. Toxicol. 13, 301–315. [DOI] [PubMed] [Google Scholar]
- Tamaoki T, Nomoto H, Takahashi I, Kato Y, Morimoto M, Tomita F (1986) Staurosporine, a potent inhibitor of phospholipid / Ca++ dependent protein kinase. Biophys. Biochem. Res. Commun. 135, 397–402. [DOI] [PubMed] [Google Scholar]
- Usui T, Yoshida M, Abe K, Osada M, Isono K, Beppu T (1991) Uncoupled cell cycle without mitosis induced by a protein kinase inhibitor, K‐252a. J. Cell Biol. 115, 1275–1282. [DOI] [PMC free article] [PubMed] [Google Scholar]
- Wani MC, Taylor HL, Wall ME, Coggon P, McPhail AT (1971) Plant antitumor agents. VI. The isolation and structure of taxol, a novel antileukemic and antitumor agent from Taxus brevifolia. J. Am. Chem. Soc. 93, 2325–2327. [DOI] [PubMed] [Google Scholar]
- Watanabe I & Okada S (1967) Effects of temperature on growth rate of cultured mammalian cells (L1578Y). J. Cell Biol. 32, 309–323. [DOI] [PMC free article] [PubMed] [Google Scholar]
- Zollner H (1993) In: Handbook of Enzyme Inhibitors. 2nd Edn pp. 813–963. Weinheim, VCH Verlagsgesellschaft Mbh. [Google Scholar]
- Zong Z, Fujikawa‐Yamamoto K, Ota T et al. (1998) Apoptotic cell death of high‐polyploid cells in a cultured sarcoma cell line. Cell Struct. Funct. 23, 231–237. [DOI] [PubMed] [Google Scholar]
- Zong Z, Fujikawa‐Yamamoto K, Teraoka K, Yamagishi H, Tanino M, Odashima S (1994) Potentiation of K‐252a, a protein kinase inhibitor‐induced polyploidization, by cAMP in cultured fibrosarcoma cell line. Biochem. Biophys. Res. Commun. 205, 746–750.DOI: 10.1006/bbrc.1994.2728 [DOI] [PubMed] [Google Scholar]


