

Whole-genome sequencing allows rapid detection of drug-resistant Mycobacterium tuberculosis isolates. However, the availability of high-quality data linking quantitative phenotypic drug susceptibility testing (DST) and genomic data have thus far been limited.
KEYWORDS: drug resistance, drug resistance level prediction, Mycobacterium tuberculosis, quantitative phenotypic drug susceptibility testing, whole-genome sequencing
ABSTRACT
Whole-genome sequencing allows rapid detection of drug-resistant Mycobacterium tuberculosis isolates. However, the availability of high-quality data linking quantitative phenotypic drug susceptibility testing (DST) and genomic data have thus far been limited. We determined drug resistance profiles of 176 genetically diverse clinical M. tuberculosis isolates from the Democratic Republic of the Congo, Ivory Coast, Peru, Thailand, and Switzerland by quantitative phenotypic DST for 11 antituberculous drugs using the BD Bactec MGIT 960 system and 7H10 agar dilution to generate a cross-validated phenotypic DST readout. We compared DST results with predicted drug resistance profiles inferred by whole-genome sequencing. Classification of strains by the two phenotypic DST methods into resistotype/wild-type populations was concordant in 73 to 99% of cases, depending on the drug. Our data suggest that the established critical concentration (5 mg/liter) for ethambutol resistance (MGIT 960 system) is too high and misclassifies strains as susceptible, unlike 7H10 agar dilution. Increased minimal inhibitory concentrations were explained by mutations identified by whole-genome sequencing. Using whole-genome sequences, we were able to predict quantitative drug resistance levels for the majority of drug resistance mutations. Predicting quantitative levels of drug resistance by whole-genome sequencing was partially limited due to incompletely understood drug resistance mechanisms. The overall sensitivity and specificity of whole-genome-based DST were 86.8% and 94.5%, respectively. Despite some limitations, whole-genome sequencing has the potential to infer resistance profiles without the need for time-consuming phenotypic methods.
INTRODUCTION
Timely and accurate drug susceptibility testing (DST) of M. tuberculosis isolates is vital to prevent the transmission of multidrug-resistant strains (MDR; resistance to rifampin and isoniazid) (1). The slow growth and stringent biosafety requirements of M. tuberculosis make obtaining a full DST profile by culture-based techniques a matter of weeks or months. In addition, culture-based DST is notoriously challenging for several drugs, e.g., pyrazinamide and ethionamide, due to poor drug solubility in commonly used culture media (2).
Drug resistance in M. tuberculosis is mainly conferred by chromosomal mutations in a few genes (3), making it possible to detect drug resistance by sequencing these genes or probing them by molecular hybridization (4). Several commercial tests for the detection of resistance-associated mutations are available, e.g., the GenoType MTBDRplus V2 (Hain Lifescience GmbH, Nehren, Germany) (5) and the AID TB Resistance line probe assay (AID GmbH, Strassberg, Germany) (6). The World Health Organization (WHO) endorses line probe assays and the Xpert MTB/RIF assay (Cepheid, Sunnyvale, CA, USA) for the detection of rifampin resistance as a surrogate marker for multidrug resistance (7, 8). These molecular tests have high sensitivities for drugs with an established target(s) of resistance and for which only a few mutations are responsible for most resistance in clinico (e.g., rifampin and isoniazid) (4). However, these molecular tests show low sensitivity for heteroresistant strains (concomitant presence of the wild type [wt] and mutant or multiple different resistance variants in patient isolates) when frequencies of mutant variants drop below 5 to 50% (9, 10). Furthermore, there are no commercially available rapid tests for many currently used or prospective drugs (e.g., bedaquiline, delamanid, linezolid, and p-aminosalicylic acid), and the WHO only recently defined ad interim critical concentrations for bedaquiline and delamanid for use with the Bactec MGIT 960 system (11, 12).
A wealth of genomic data on drug-resistant M. tuberculosis has become available in recent years (13, 14). Unfortunately, quantitative phenotypic DST data are lacking for most of the genetic data sets, which are necessary to infer phenotypes from genotypes. In addition, DST data are often limited, as the strains were classified as susceptible or resistant using the WHO-defined critical concentration (15). There is an urgent need to link genotypic and phenotypic drug resistance readouts to obtain a better understanding of the mechanisms influencing the evolution and spread of drug resistance in M. tuberculosis (3, 16).
Whole-genome sequencing (WGS) of clinical isolates allows for accurate identification of established chromosomal mutations increasing the MIC (13, 17, 18) and may ensure adequate treatment in days instead of months. We compared whole-genome-based drug resistance profiles with two culture-based quantitative DST methods for a total of 11 drugs, including rifampin, rifabutin, isoniazid, all WHO group B drugs (streptomycin, kanamycin A, amikacin, and capreomycin), and selected group A (moxifloxacin), group C (ethionamide), and group D (ethambutol and pyrazinamide) drugs (11).
RESULTS
Agreement between MGIT 960 and 7H10 agar dilution phenotypic DST.
Table 1 and Fig. 1 summarize the agreement between the semiquantitative/quantitative MIC determination by MGIT 960 and 7H10 agar dilution in terms of classifying strains as belonging to the resistotype or wt populations, as inferred by growth/no growth at the epidemiological cutoffs (ECOFF) (Table 2). Agreement was high for all drugs except ethambutol (see below). For most drugs, the MGIT 960-based MICs were higher than the 7H10 agar dilution-based MICs. MICs obtained using the two methods were within 1 to 2 2-fold dilution steps of each other. The classifications into resistotype/wt populations demonstrated high rank correlations for most drugs (Table 1 and Fig. 1), except for capreomycin (see Fig. S4 in the supplemental material), due to few strains demonstrating increased capreomycin MICs included in the study.
TABLE 1.
Summary statistics of the method agreement between 7H10 agar dilution and MGIT 960-based phenotypic DST for all drugs assayed in this study
| Antibiotic | n | Categorical agreement (%) | SD of log2(MIC MGIT 960/MIC agar dilution) | γ |
|---|---|---|---|---|
| Ethionamide | 56 | 95 | 1.9 ± 0.3 | 0.91 |
| Ethambutol | 171 | 73 | 1.9 ± 0.5 | 0.94 |
| Capreomycin | 56 | 98 | 1.5 ± 0.5 | 0.65 |
| Streptomycin | 56 | 93 | 1.5 ± 0.3 | 0.98 |
| Kanamycin A | 56 | 98 | 1.2 ± 0.2 | 0.8 |
| Amikacin | 174 | 98 | 1.4 ± 0.6 | 1 |
| Moxifloxacin | 173 | 99 | 1 ± 0.2 | 1 |
| Isoniazid | 173 | 96 | 1.2 ± 0.1 | 1 |
| Rifampin | 174 | 99 | NA | 1 |
| Rifabutin | 56 | 96 | 0.8 ± 0.1 | 0.98 |
FIG 1.

Method agreement between phenotypic DST performed with MGIT 960 and 7H10 agar dilution (agardil.), represented as Bland-Altman plots for all drugs tested in this study.
TABLE 2.
ECOFF used for 7H10 agar dilution and MGIT 960 phenotypic DST, derived from wt MIC distributions determined in this study
| Antibiotic | ECOFFa (mg/liter) |
|
|---|---|---|
| Agar dilution | MGIT 960 | |
| Ethionamide | 1 (5) | 5 |
| Ethambutol | 2 (5) | 5 |
| Capreomycin | 4 | 2.5 |
| Streptomycin | 0.5 (2) | 1 |
| Kanamycin A | 2 (5) | 2 (2.5) |
| Amikacin | 1 (4) | 1 |
| Moxifloxacin | 0.25 (0.5) | 0.25 (0.5) |
| Isoniazid | 0.125 (0.2) | 0.1 |
| Rifampin | 0.5 (1) | 1 |
| Rifabutin | 0.0625 | 0.1 |
| Pyrazinamide | NA | 100 |
The values given in parentheses are the critical concentrations recommended by the WHO in 2014 (43). NA, not applicable.
WGS and in silico resistance profile prediction.
A total of 176 whole-genome sequences with a median coverage of 67.6× (interquartile range [IQR], 37.48) were obtained. Median mapping percentage and percentage of genome covered were 98.7% (IQR, 0.94) and 99.4% (IQR, 0.4), respectively. Genes involved in drug resistance demonstrated high coverages, with only 0.8% of all positions suffering from coverages below 7× (see the supplemental material). All major M. tuberculosis lineages, except lineage 7, were represented in the study (L1 = 6, L2 = 36, L3 = 11, L4 = 123, L5 = 1, and L6 = 1). The strains showed a range of drug resistance profiles (Fig. 2). Based on the set of analyzed genes (Table 3), 25 strains were predicted to be fully susceptible against all assayed drugs, 59 strains were mono-/polyresistant, 91 strains were MDR, and two strains were predicted to be extensively drug resistant (XDR; isoniazid, rifampin, fluoroquinolone, and aminoglycoside resistant).
FIG 2.

Maximum likelihood phylogeny of 176 M. tuberculosis strains based on 20,510 variable positions. Reference strains are labeled with green. Main lineages are highlighted with the following color scheme: red, L4; purple, L3; blue, L2; pink, L1; green, L6; brown, L5. Scale bar indicates the number of substitutions per site. Phylogeny is rooted on M. canettii. Colored bars indicate resistance mutations per gene, and within a distinct column (gene) each colored bar represents a distinct mutation. Black bars indicate no mutation, i.e., wt.
TABLE 3.
List of genes implicated in drug resistance in M. tuberculosis that were screened for polymorphisms by WGSa
| Drug | Target gene(s) |
|---|---|
| Ethionamide | ethA, inhA, inhA promoter |
| Ethambutol | embB |
| Capreomycin | rrs, eis promoter, tlyA |
| Streptomycin | rrs, gidB, rpsL |
| Kanamycin A | rrs, eis promoter |
| Amikacin | rrs, eis promoter |
| Moxifloxacin | gyrA |
| Isoniazid | katG, inhA promoter |
| Rifampin/rifabutin | rpoB |
| Pyrazinamide | pncA, pncA promoter |
Drug resistance profile prediction by WGS versus phenotypic DST.
After exclusion of known phylogenetic markers not involved in resistance, WGS-based resistotype prediction using a defined set of target genes (Table 3) was highly congruent with the categorical classification based on the phenotypic DST for most drugs (Tables 1 and 4 and Fig. 1). Based on the in silico resistotype prediction, the MICs of mutant and wt strains frequently followed a Gaussian distribution. However, the same resistance marker may confer different MICs in different strains (Fig. S1C, S2C, S3C, S8C, S9C, and S10C). In some cases, the increase in the MIC conferred by a certain resistance mutation fell within the distribution of the wt MIC (e.g., for gidB and eis promoter mutations; Fig. S3C and S6C).
Distinct wt and mutant MIC distributions.
MIC distributions of wt and mutant strains were well separated for rifampin, rifabutin, isoniazid, kanamycin A, amikacin, capreomycin, streptomycin, and pyrazinamide, indicating that the resistance markers used had a high positive predictive power (88.9% overall positive predictive power of association with MIC increases). For streptomycin, two strains harbored no mutations in the target genes, yet they demonstrated high-level phenotypic resistance (Fig. S3C).
Overlapping wt and mutant MIC distributions.
MIC distributions of wt and mutant strains overlapped for ethambutol, moxifloxacin, and ethionamide (Fig. 3). For ethambutol and ethionamide, overlapping MIC distributions of wt and mutant strains were associated with a large number of polymorphisms in resistance-conferring genes (ethambutol resistance, 22 polymorphisms in embB; ethionamide resistance, 28 in ethA, 3 in inhA, and 6 in the inhA promoter). Solubility issues with ethionamide led to quantitative differences in MGIT 960 versus 7H10 agar dilution-based DST (Table 1 and Fig. 1). The overlap in MIC distributions between the wt and strains carrying an embB mutation was reduced by adjusting the critical concentration for ethambutol resistance from 5 mg/liter to 2.5 mg/liter (MGIT 960). However, there was variability in the MICs for the same mutation (e.g., MIC EmbB M306I/V in 7H10 agar dilution, 4 to 16 mg/liter; Fig. S2C). Moxifloxacin resistance was rare (n = 9, MGIT 960, critical concentration of 0.25 mg/liter), and MIC distributions of mutant strains partially overlapped those of the wt. Sensitivity of the genome-based moxifloxacin resistance prediction was 80.0% (Table 4).
FIG 3.

Histograms of MICs (7H10 agar dilution) for all drugs assayed in this study.
TABLE 4.
Sensitivity and specificity of the genome-based drug resistance profile predictiona
| Drug | Sensitivity (%) | Specificity (%) |
|---|---|---|
| Ethionamide | 75.0 | 92.9 |
| Ethambutol | 89.6 | 94.2 |
| Capreomycin | 75.0 | 94 |
| Streptomycin | 68.0 | 92.1 |
| Kanamycin A | 83.3 | 98.8 |
| Amikacin | 63.6 | 96.9 |
| Moxifloxacin | 80.0 | 90.2 |
| Isoniazid | 93.6 | 96.8 |
| Rifampin | 100 | 94.0 |
| Rifabutin | 98.9 | 94.0 |
| Pyrazinamide | 80.8 | 88.9 |
Sensitivity and specificity were determined using the 7H10 agar dilution-based categorical classification as the gold standard for all drugs except pyrazinamide, for which the MGIT 960 categorical classification was used.
Defining cutoffs for high- and low-level MICs.
(i) Isoniazid. Mutations in the promoter of inhA caused low-level MICs of <1 mg/liter (7H10 agar dilution) compared to strains harboring mutations in katG or combinations of inhA promoter and katG mutations, which demonstrated MIC levels ranging from ≥1 mg/liter to >32 mg/liter in 7H10 agar dilution (Fig. S8C). Defining cutoffs for low-level (≤1 mg/liter for MGIT 960/7H10 agar dilution) and high-level (>1 mg/liter MGIT 960/7H10 agar dilution) isoniazid MICs is warranted.
(ii) Rifampin/rifabutin. Most mutations in rpoB increased the MIC for rifamycins beyond the therapeutic window (peak serum concentration, 10 mg/liter [19, 20]). However, some rare rpoB mutations (e.g., RpoB L452P, H445L; Fig. S9C) demonstrated MICs within the therapeutic window. Thus, defining cutoffs for low- and high-level MICs may be justified.
For rifampin, cutoffs for low- and high-level MICs were ≤4 and 2 mg/liter for MGIT 960/7H10 agar dilution and >4 and 2 mg/liter for MGIT 960/7H10 agar dilution.
For rifabutin, our data suggest a cutoff for low- and high-level MICs of ≤0.4 and 0.25 or 0.5 mg/liter for MGIT 960/7H10 agar dilution and >0.4 and 0.25 or 0.5 mg/liter for MGIT 960/7H10 agar dilution.
Mutations in rpoB conferring resistance to rifampin and rifabutin showed highly correlated increases (Fig. 4) of MICs beyond the therapeutic window for most rpoB mutations (Fig. 3 and Fig. S9C and S10C), indicating that both drugs are rendered clinically ineffective by the mutations identified in the data set (21) and cannot substitute for each other.
FIG 4.
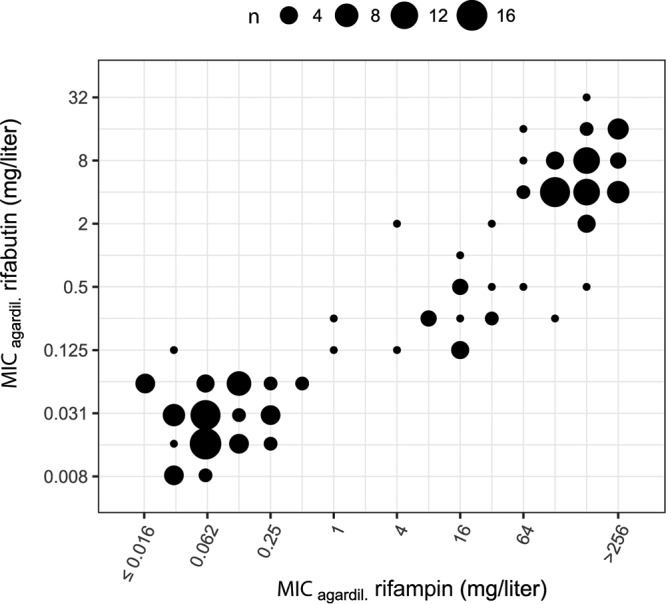
Correlation between 7H10 agar dilution MICs for rifampin and rifabutin.
(iii) Amikacin. Few strains had mutations in the regions of rrs relevant for amikacin resistance or the eis promoter (n = 12). Mutations in rrs were associated with high-level MICs (>128 mg/liter in 7H10 agar dilution). With regard to the eis promoter, only the C-14T mutation increased the MIC and led to low-level MICs (2 to 4 mg/liter in 7H10 agar dilution). The definition of a cutoff for low-level (≤4 mg/liter for MGIT 960/7H10 agar dilution) and high-level (4 mg/liter for MGIT 960/7H10 agar dilution) amikacin MICs may be warranted.
(iv) Streptomycin. Certain mutations lead to MICs well beyond the therapeutic window (19) of streptomycin (e.g., RpsL K43R, MIC 7H10 agar dilution of >128 mg/liter; Fig. S3C). On the other hand, gidB mutations increase the MIC only moderately (MIC 7H10 agar dilution, 1 to 4 mg/liter; Fig. S3C). Mutational combinations in gidB, rrs, and rpsL were common and produced a range of different MICs. Despite the distribution of MICs conferred by combinations of mutations, there were distinct mutations that systematically led to MICs beyond the therapeutic window, e.g., RpsL K43R. Defining a cutoff for low-level (MGIT 960, ≤4 mg/liter; 7H10 agar dilution, ≤4 to 8 mg/liter) and high-level streptomycin MICs (MGIT 960, >4 mg/liter; 7H10 agar dilution, >4 to 8 mg/liter) is warranted.
DISCUSSION
The results of MGIT 960 and 7H10 agar dilution-based phenotypic DST methods were highly correlated and suitable to separate the resistotype from the wt populations. Based on phenotypic DST results and WGS, we were able to define cutoffs for high- and low-level MICs for isoniazid, rifampin, streptomycin, and amikacin. Defining such cutoffs may serve as starting points for correlating mutational, DST, and pharmacokinetic/dynamic data to gain more insight into the influence of individual mutations on treatment outcomes, especially in the light of, e.g., increased drug dosing.
Our data suggest that the current WHO-defined critical concentration for phenotypic DST of ethambutol by MGIT 960 (5 mg/liter) is too high and may misclassify strains as belonging to the wt population compared to the 7H10 agar dilution-based classification. Given the narrow therapeutic window for ethambutol, this may lead to mistreatment due to presumed ethambutol susceptibility. After adjusting the ECOFF to 2.5 mg/liter for MGIT 960, we observed a strong improvement of the categorical agreement between MGIT 960- and 7H10 agar dilution-based classification into resistotype/wt populations.
The mutations identified by WGS had a high predictive power to classify strains as belonging to the resistotype population. However, the predictive power depends on a number of factors. For instance, the increase in MIC conferred by an identical mutation can vary greatly in different strains (e.g., EmbB M306I/V and RpsL K88R) (22). Such variation may be clinically relevant if there is a significant overlap between the MICs of mutant and wt strains (23), as was the case for strains harboring mutations in genes associated with ethionamide, ethambutol, and streptomycin (e.g., gidB) resistance. Furthermore, it is difficult to classify strains as part of resistotype or wt populations if the MIC increase lies within the therapeutic window of a drug. The overlap between MICs of mutant and wt strains is confounded by the fact that we only screened for mutations in genes which had previously been associated with drug resistance. Thus, we might have missed possible resistance-conferring mutations in other genes. Additionally, WGS will always produce distributions of coverages, which in turn will inevitably lead to certain regions in the genome suffering from low coverage, preventing the detection of mutations. However, in cases where we observed elevated MICs without any mutations detected in the target genes, coverage issues could not explain the absence of any mutations. Furthermore, the strain genetic background (24), nonmutational mechanisms (e.g., modulation of gene expression) (25), and drug efflux mechanisms (26) may contribute to the variability in increase of the MIC conferred by resistance mutations.
The predictive power of mutations in target genes also depends on removing phylogenetic markers not involved in increasing MICs. Separating phylogenetic from resistance-associated markers works well for essential (highly conserved) genes such as rpoB, rpsL, and rrs but is problematic in nonessential genes involved in the conversion of prodrugs into their active forms, like pncA (pyrazinamide) and ethA (ethionamide), or in genes that generally exhibit higher numbers of polymorphisms, e.g., embB. Of note, the embABC operon is highly polymorphic, harboring more polymorphisms than expected by chance (mutations in embABC operon, 81; expected, 44.8; P = 9.174e−07, binomial test). Mutations conferring increased ethambutol MICs (27) will therefore inevitably evolve in the presence of phylogenetic single-nucleotide polymorphisms (SNPs) and may interact epistatically to produce the variability in MICs we observed for wt strains and for the most common marker associated with increased ethambutol resistance MICs, embB M306I/V. The embABC operon is involved in the biosynthesis of decaprenylphosphoryl-β-d-arabinose, which is an integral component of the mycobacterial cell wall. The cell envelope interacts with the host immune system, and the high levels of diversity of these genes might be the product of diversifying selection due to host immune pressure. The influence of polymorphisms in the embABC operon on MICs in general is supported by the observation that subinhibitory concentrations of ethambutol lower the MICs for isoniazid, rifampin, and streptomycin (28). Thus, even small changes in activity of the decaprenylphosphoryl-β-d-arabinose biosynthetic and utilization pathway might alter cell wall permeability and influence MICs of several drugs.
Similarly, in the case of increased streptomycin MICs, the RpsL substitution K88R exhibited a wide range of MIC increases, partially within the therapeutic window of the drug. Streptomycin was the first effective antituberculous drug discovered (29) and has been used for decades. The long-term use has produced complex resistance profiles with multiple mutations known to increase streptomycin MICs on their own (e.g., in gidB, rpsL, and rrs) occurring concomitantly, producing wide ranges of MICs. Furthermore, many strains with increased streptomycin MICs displayed MDR/XDR phenotypes. Mutations conferring increased streptomycin MICs are frequently found in backgrounds which have mutations in genes affecting the information pathway (DNA→RNA→proteins), e.g., gyrA (DNA gyrase), rpoB (DNA-dependent RNA polymerase), and rrs (rRNA). The simultaneous presence of multiple MIC-increasing mutations may alter the adaptive landscape (30, 31). In addition, nonmutational processes (e.g., alteration of gene expression) may compensate for fitness costs of drug resistance and at the same time alter the MIC for the drug (25). This has not been demonstrated for streptomycin resistance in M. tuberculosis, but it seems possible that compensation of fitness costs in MDR phenotypes alter the MIC for streptomycin (30), considering that streptomycin is not part of the current standard treatment regimen and selection for high-level streptomycin MICs is relaxed.
Concerning eis promoter mutations and aminoglycoside resistance, there is mounting evidence that the eis C-14T promoter mutation confers clinically relevant increases in amikacin MICs, especially in the light of the revised critical concentrations for amikacin (2 mg/liter for 7H10 agar dilution) (11).
We observed an overrepresentation of lineage 2 and 4 strains in our sample set. The strain set used to establish the methodology was collated with a specific aim to include drug-resistant strains. Given the frequent association of lineages 2 and 4 with drug resistance (32, 33), the observed skew is not surprising. Furthermore, lineage 2 and 4 strains are also frequently isolated at the collection sites of the strain set used to apply the methodology (Ivory Coast, Peru, and Democratic Republic of the Congo). Similarly, increased MICs for a number of drugs (amikacin, capreomycin, kanamycin, and moxifloxacin) were rare, reflecting the scarcity of pre-XDR/XDR phenotypes in Switzerland and at the sites of prospective sampling.
At 63.6% to 80.8%, sensitivities were low (34) for a number of drugs (i.e., amikacin, moxifloxacin, and pyrazinamide) (Table 4) but were comparable to those of other studies not employing a database of predefined resistance mutations (14, 17, 35). The observed low sensitivities for some drugs were due to few strains belonging to the resistotype population included in the data set, the presence of additional resistance mutations in genes not assessed, or to unknown resistance mechanisms and not due to low coverages prohibiting the detection of mutations. The use of a curated SNP database containing high-confidence drug resistance mutations would improve sensitivity for some drugs where additional targets, less well associated with MIC increases, are known (34, 36). However, reliance on a predefined resistance mutation database comes at the cost of reduced sensitivity. After known phylogenetic mutations have been removed, it is important to treat any mutation in known target genes as potentially being involved in drug resistance. In cases where previously unknown mutations (i.e., not known to increase MICs and not a known phylogenetic SNP) in resistance-related genes are detected, genetic engineering and targeted DST are necessary to confirm or reject the drug resistance-conferring nature of a novel mutation to achieve high sensitivities and specificities for whole-genome sequencing-based DST.
Generating high-quality quantitative DST data using diverse M. tuberculosis strains is important to accurately define the ECOFF and subsequently guide treatment decisions. The two quantitative DST methods employed are difficult to standardize across laboratories, technically demanding, and at best challenging to scale up. Microtiter plate-based quantitative DST methods (37, 38) have the potential to aid in the generation of more high-quality DST data due to their standardized formulation and relative ease of application compared to established methods.
In conclusion, we demonstrate that MGIT 960 and 7H10 agar dilution-based phenotypic DST provide highly congruent classifications of strains into resistotype or wt populations. WGS has high predictive power to infer resistance profiles without the need for time-consuming phenotypic methods. Limitations due to overlapping distributions of wt and resistotype MICs, various MICs for the same mutations in different strains, presence of phylogenetic markers in resistance-associated genes, and rare resistance markers with low frequencies will likely be resolved by on-going large-scale projects (e.g., ReSeqTB and others [15, 39]), combining phenotypic DST with WGS of thousands of M. tuberculosis isolates. Our findings, together with those of on-going studies, will pave the way for the replacement of phenotypic DST with drug resistance profile prediction based on WGS in the coming years.
MATERIALS AND METHODS
M. tuberculosis isolates.
The initial data set consisted of 189 M. tuberculosis isolates. A subset of 61 strains was used to establish the phenotypic DST methodology. These 61 strains were collected by the Swiss National Center for Mycobacteria between 2004 and 2015 and represent a broad spectrum in geographic origin and drug resistance profiles (40–42). We then applied the quantitative DST methodology to 125 prospectively collected clinical isolates from clinics participating in the International Epidemiology Databases to Evaluate AIDS (IeDEA) (43) in Peru, Thailand, Ivory Coast, and the Democratic Republic of the Congo (see Table S3 in the supplemental material). Thirteen strains had to be excluded due to failed WGS (n = 4; failed library preparation due to low DNA quality), irreproducible DST results (n = 1), no growth in the 7H10 agar dilution assay (n = 3), duplication (n = 1), mixed cultures (n = 2; cross-contamination or patient infected with multiple strains), or transmission clusters (n = 2). The final set consisted of 176 strains.
Phenotypic DST.
MGIT 960- and 7H10 agar dilution-based phenotypic DST were performed as described previously (40). Critical concentrations used for the classification of strains into resistant/susceptible aim to predict clinical outcome, i.e., treatment failure if a given strain is resistant at the critical concentration. However, critical concentrations should ideally be defined on the basis of the epidemiological cutoff (ECOFF; the highest wt MIC observed in the absence of any detectable resistance mechanism [23]), treatment outcomes, and pharmacokinetic and -dynamic data. As M. tuberculosis infections are treated with combination therapy, outcome data for single drugs are difficult to obtain (44). This calls for definition of critical concentrations solely based on the ECOFF (11). We therefore classified strains as belonging to the resistotype/wt populations on the basis of the detection of growth/no growth at the ECOFF derived from our data (45). Table 2 lists the ECOFFs used, Table S2 the drug concentrations tested with the MGIT 960 and 7H10 agar-dilution assays, and Table 3 the genes screened for mutations with WGS. Further details on how the phenotypic DST assays were performed are available in the supplemental material.
Data analysis.
The categorical agreement between classification of strains into resistotype/wt populations using MGIT 960 and 7H10 agar dilution was based on detectable growth at the ECOFF (Table 2). The numerical variation between the two methods was quantified as the geometric standard deviation (SD; given with its standard error) of the ratio of MGIT 960 MIC to the agar dilution MIC, expressed as a number of 2-fold dilutions and denoted by σ. The geometric SD was computed by fitting a log-normal distribution to the MGIT 960 MIC/agar dilution MIC ratio as implemented in the R package fitdistrplus (v.1.0-9) (46). If the data were compatible with σ = 0, the geometric standard deviation could not be estimated and was defined as not applicable. The approach is a generalization of the Bland and Altman method (47), taking censoring of the data into account. Strains for which the MGIT 960 MIC and 7H10 agar dilution MIC were both left censored or both right censored were excluded, since no information on the ratio could be derived.
Goodman and Kruskal’s gamma was used to quantify the rank correlation between the two methods. No correlation could be calculated if the variance for either method was 0 and denoted not applicable.
Distributions of wt and mutant MICs were analyzed qualitatively based on the results of 7H10 agar dilution. We divided the data set into two groups: drugs for which the MIC distributions of wt and mutant strains did not overlap and those for which MIC distributions overlapped.
Sensitivities and specificities of WGS-based resistance profile inference were calculated based on the 7H10 agar dilution results for all drugs except pyrazinamide, for which the MGIT 960 results were used, based on growth/no growth at the ECOFF, derived from our data and the presence or absence of a putative resistance-associated mutation.
Defining cutoffs for high- and low-level MICs.
The therapeutic window of a drug is defined as the concentration range within which a drug is considered to be effective and safe to use (19). Mutations can increase the MIC beyond the therapeutic window and render the drug clinically ineffective. Drugs may have large therapeutic windows beyond the ECOFF. For these, MIC increases caused by mutations may still be within the therapeutic window of a drug: these strains might still be treatable by increasing the drug dose. We analyzed the distribution of MICs of mutant strains and assessed if cutoffs for low-level (within the therapeutic window) and high-level (beyond the therapeutic window) MICs were definable. There were sufficient data available to define distinct cutoffs for low- and high-level MICs for isoniazid, rifampin, streptomycin, and amikacin. For mutations conferring resistance to other drugs assayed in this study, no distinct separation into resistotype populations with high- and low-level MICs was possible due to wide ranges of MICs conferred by the individual mutations or because the mutations conferred MICs beyond the therapeutic window.
WGS and SNP calling.
WGS and data analysis were performed as previously described (48) and are summarized in the supplemental material. The performance of WGS-based DST greatly depends on the availability of robust markers of resistance. We therefore focused on a set of high-confidence resistance-associated genes (3, 14, 19) (Table 3). We additionally assessed the impact of eis promoter mutations on amikacin and capreomycin resistance, as the association of mutations in the eis promoter with resistance to the aforementioned drugs has been reported but is not well established (11, 49).
Ethics.
Local institutional review board or ethics committee approval was obtained at all local study sites. Informed consent was obtained where requested per local regulations. This project was also approved by the Cantonal Ethics Committee in Bern, Switzerland.
Supplementary Material
ACKNOWLEDGMENTS
We thank Alexandra Mushegian for critically reading the manuscript and improving the writing. Whole-genome analysis was performed at the sciCORE (http://scicore.unibas.ch/) scientific computing core facility at the University of Basel. This work was supported by the European Research Council (grant number 309540-EVODRTB), the Swiss National Science Foundation (IZRJZ3_164171, 310030-166687, IZLSZ3_170834, CRSII5_177163, 31003A_153349, 320030_153442/1, and special project funding 174281), and SystemsX.ch. The International Epidemiology Databases to Evaluate AIDS (IeDEA) is supported by the U.S. National Institutes of Health’s National Institute of Allergy and Infectious Diseases, the Eunice Kennedy Shriver National Institute of Child Health and Human Development, the National Cancer Institute, the National Institute of Mental Health, and the National Institute on Drug Abuse: Asia-Pacific, U01AI069907; CCASAnet, U01AI069923; Central Africa, U01AI096299; Southern Africa, U01AI069924; West Africa, U01AI069919. The content of this publication is solely the responsibility of the authors and does not necessarily represent the official views of any of the funding agencies mentioned above. P.M.K. reports travel grants from Copan Italia SpA outside the submitted work. E.C.B. is a consultant for AID Diagnostics.
Footnotes
Supplemental material for this article may be found at https://doi.org/10.1128/AAC.02175-18.
REFERENCES
- 1.World Health Organization. 2010. Treatment of tuberculosis: guidelines, 4th ed World Health Organization, Geneva, Switzerland. [Google Scholar]
- 2.Domínguez J, Boettger EC, Cirillo D, Cobelens F, Eisenach KD, Gagneux S, Hillemann D, Horsburgh R, Molina-Moya B, Niemann S, Tortoli E, Whitelaw A, Lange C, TBNET, RESIST-TB Networks. 2016. Clinical implications of molecular drug resistance testing for Mycobacterium tuberculosis: a TBNET/RESIST-TB consensus statement. Int J Tuber Lung Dis 20:24–42. doi: 10.5588/ijtld.15.0221. [DOI] [PubMed] [Google Scholar]
- 3.Gygli SM, Borrell S, Trauner A, Gagneux S. 2017. Antimicrobial resistance in Mycobacterium tuberculosis: mechanistic and evolutionary perspectives. FEMS Microbiol Rev 41:354–373. doi: 10.1093/femsre/fux011. [DOI] [PubMed] [Google Scholar]
- 4.Deggim-Messmer V, Bloemberg GV, Ritter C, Voit A, Hömke R, Keller PM, Böttger EC. 2016. Diagnostic molecular mycobacteriology in regions with low tuberculosis endemicity: combining real-time PCR assays for detection of multiple mycobacterial pathogens with line probe assays for identification of resistance mutations. EBioMedicine 9:228–237. doi: 10.1016/j.ebiom.2016.06.016. [DOI] [PMC free article] [PubMed] [Google Scholar]
- 5.Nathavitharana RR, Hillemann D, Schumacher SG, Schlueter B, Ismail N, Omar SV, Sikhondze W, Havumaki J, Valli E, Boehme C, Denkinger CM. 2016. Multicenter noninferiority evaluation of Hain GenoType MTBDR plus version 2 and Nipro NTM+MDRTB line probe assays for detection of rifampin and isoniazid resistance. J Clin Microbiol 54:1624–1630. doi: 10.1128/JCM.00251-16. [DOI] [PMC free article] [PubMed] [Google Scholar]
- 6.Ritter C, Lucke K, Sirgel FA, Warren RW, van Helden PD, Bottger EC, Bloemberg GV. 2014. Evaluation of the AID TB resistance line probe assay for rapid detection of genetic alterations associated with drug resistance in Mycobacterium tuberculosis strains. J Clin Microbiol 52:940–946. doi: 10.1128/JCM.02597-13. [DOI] [PMC free article] [PubMed] [Google Scholar]
- 7.World Health Organization. 2016. WHO guideline: the use of molecular line probe assays for the detection of resistance to isoniazid and rifampicin. World Health Organization, Geneva, Switzerland. [Google Scholar]
- 8.World Health Organization. 2013. Automated real-time nucleic acid amplification technology for rapid and simultaneous detection of tuberculosis and rifampicin resistance: Xpert MTB/RIF assay for the diagnosis of pulmonary and extrapulmonary TB in adults and children: policy update. World Health Organization, Geneva, Switzerland. [PubMed] [Google Scholar]
- 9.Engström A. 2016. Fighting an old disease with modern tools: characteristics and molecular detection methods of drug-resistant Mycobacterium tuberculosis. Infect Dis (Auckl) 48:1–17. doi: 10.3109/23744235.2015.1061205. [DOI] [PubMed] [Google Scholar]
- 10.Streicher EM, Bergval I, Dheda K, Böttger EC, Gey van Pittius NC, Bosman M, Coetzee G, Anthony RM, van Helden PD, Victor TC, Warren RM. 2012. Mycobacterium tuberculosis population structure determines the outcome of genetics-based second-line drug resistance testing. Antimicrob Agents Chemother 56:2420–2427. doi: 10.1128/AAC.05905-11. [DOI] [PMC free article] [PubMed] [Google Scholar]
- 11.World Health Organization. 2018. Technical report on critical concentrations for drug susceptibility testing of medicines used in the treatment of drug-resistant tuberculosis. World Health Organization, Geneva, Switzerland. [Google Scholar]
- 12.World Health Organization. 2018. Technical manual for drug susceptibility testing of medicines used in the treatment of tuberculosis. World Health Organization, Geneva, Switzerland. [Google Scholar]
- 13.Coll F, McNerney R, Preston MD, Guerra-Assunção JA, Warry A, Hill-Cawthorne G, Mallard K, Nair M, Miranda A, Alves A, Perdigão J, Viveiros M, Portugal I, Hasan Z, Hasan R, Glynn JR, Martin N, Pain A, Clark TG. 2015. Rapid determination of anti-tuberculosis drug resistance from whole-genome sequences. Genome Med 7:51. doi: 10.1186/s13073-015-0164-0. [DOI] [PMC free article] [PubMed] [Google Scholar]
- 14.Walker TM, Kohl TA, Omar SV, Hedge J, Del Ojo Elias C, Bradley P, Iqbal Z, Feuerriegel S, Niehaus KE, Wilson DJ, Clifton DA, Kapatai G, Ip CLC, Bowden R, Drobniewski FA, Allix-Béguec C, Gaudin C, Parkhill J, Diel R, Supply P, Crook DW, Smith EG, Walker AS, Ismail N, Niemann S, Peto TEA. 2015. Whole-genome sequencing for prediction of Mycobacterium tuberculosis drug susceptibility and resistance: a retrospective cohort study. Lancet Infect Dis 15:1193–1202. doi: 10.1016/S1473-3099(15)00062-6. [DOI] [PMC free article] [PubMed] [Google Scholar]
- 15.The CRyPTIC Consortium and the 100000 Genomes Project, Allix-Béguec C, Arandjelovic I, Bi L, Beckert P, Bonnet M, Bradley P, Cabibbe AM, Cancino-Muñoz I, Caulfield MJ, Chaiprasert A, Cirillo DM, Clifton DA, Comas I, Crook DW, De Filippo MR, de Neeling H, Diel R, Drobniewski FA, Faksri K, Farhat MR, Fleming J, Fowler P, Fowler TA, Gao Q, Gardy J, Gascoyne-Binzi D, Gibertoni-Cruz AL, Gil-Brusola A, Golubchik T, Gonzalo X, Grandjean L, He G, Guthrie JL, Hoosdally S, Hunt M, Iqbal Z, Ismail N, Johnston J, Khanzada FM, Khor CC, Kohl TA, Kong C, Lipworth S, Liu Q, Maphalala G, Martinez E, Mathys V, Merker M, Miotto P, Mistry N, Moore DAJ, Murray M, Niemann S, Omar SV, Ong RT, Peto TEA, Posey JE, Prammananan T, Pym A, Rodrigues C, Rodrigues M, Rodwell T, Rossolini GM, Sánchez Padilla E, Schito M, Shen X, Shendure J, Sintchenko V, Sloutsky A, Smith EG, Snyder M, Soetaert K, Starks AM, Supply P, Suriyapol P, Tahseen S, Tang P, Teo YY, Thuong TNT, Thwaites G, Tortoli E, van Soolingen D, Walker AS, Walker TM, Wilcox M, Wilson DJ, Wyllie D, Yang Y, Zhang H, Zhao Y, Zhu B. 2018. Prediction of susceptibility to first-line tuberculosis drugs by DNA sequencing. N Engl J Med 379:1403–1415. doi: 10.1056/NEJMoa1800474. [DOI] [PMC free article] [PubMed] [Google Scholar]
- 16.Dookie N, Rambaran S, Padayatchi N, Mahomed S, Naidoo K. 2018. Evolution of drug resistance in Mycobacterium tuberculosis: a review on the molecular determinants of resistance and implications for personalized care. J Antimicrob Chemother 73:1138–1151. doi: 10.1093/jac/dkx506. [DOI] [PMC free article] [PubMed] [Google Scholar]
- 17.Shea J, Halse TA, Lapierre P, Shudt M, Kohlerschmidt D, Van Roey P, Limberger R, Taylor J, Escuyer V, Musser KA. 2017. Comprehensive whole-genome sequencing and reporting of drug resistance profiles on clinical cases of Mycobacterium tuberculosis in New York state. J Clin Microbiol 55:1871–1882. doi: 10.1128/JCM.00298-17. [DOI] [PMC free article] [PubMed] [Google Scholar]
- 18.Colman RE, Anderson J, Lemmer D, Lehmkuhl E, Georghiou SB, Heaton H, Wiggins K, Gillece JD, Schupp JM, Catanzaro DG, Crudu V, Cohen T, Rodwell TC, Engelthaler DM. 2016. Rapid drug susceptibility testing of drug resistant Mycobacterium tuberculosis directly from clinical samples using amplicon sequencing: a proof of concept study. J Clin Microbiol 54:2058–2067. doi: 10.1128/JCM.00535-16. [DOI] [PMC free article] [PubMed] [Google Scholar]
- 19.Böttger EC. 2011. The ins and outs of Mycobacterium tuberculosis drug susceptibility testing. Clin Microbiol Infect 17:1128–1134. doi: 10.1111/j.1469-0691.2011.03551.x. [DOI] [PubMed] [Google Scholar]
- 20.Sekaggya-Wiltshire C, von Braun A, Lamorde M, Ledergerber B, Buzibye A, Henning L, Musaazi J, Gutteck U, Denti P, de Kock M, Jetter A, Byakika-Kibwika P, Eberhard N, Matovu J, Joloba M, Muller D, Manabe YC, Kamya MR, Corti N, Kambugu A, Castelnuovo B, Fehr JS. 2018. Delayed sputum culture conversion in tuberculosis-human immunodeficiency virus-coinfected patients with low isoniazid and rifampicin concentrations. Clin Infect Dis 67:708–716. doi: 10.1093/cid/ciy179. [DOI] [PMC free article] [PubMed] [Google Scholar]
- 21.Berrada ZL, Lin S-YG, Rodwell TC, Nguyen D, Schecter GF, Pham L, Janda JM, Elmaraachli W, Catanzaro A, Desmond E. 2016. Rifabutin and rifampin resistance levels and associated rpoB mutations in clinical isolates of Mycobacterium tuberculosis complex. Diagn Microbiol Infect Dis 85:177–181. doi: 10.1016/j.diagmicrobio.2016.01.019. [DOI] [PMC free article] [PubMed] [Google Scholar]
- 22.Ruesen C, Riza AL, Florescu A, Chaidir L, Editoiu C, Aalders N, Nicolosu D, Grecu V, Ioana M, van Crevel R, van Ingen J. 2018. Linking minimum inhibitory concentrations to whole genome sequence-predicted drug resistance in Mycobacterium tuberculosis strains from Romania. Sci Rep 8:9676. doi: 10.1038/s41598-018-27962-5. [DOI] [PMC free article] [PubMed] [Google Scholar]
- 23.Schön T, Miotto P, Köser CU, Viveiros M, Böttger E, Cambau E. 2017. Mycobacterium tuberculosis drug-resistance testing: challenges, recent developments and perspectives. Clin Microbiol Infect 23:154–160. doi: 10.1016/j.cmi.2016.10.022. [DOI] [PubMed] [Google Scholar]
- 24.Fenner L, Egger M, Bodmer T, Altpeter E, Zwahlen M, Jaton K, Pfyffer GE, Borrell S, Dubuis O, Bruderer T, Siegrist HH, Furrer H, Calmy A, Fehr J, Stalder JM, Ninet B, Böttger EC, Gagneux S. 2012. Effect of mutation and genetic background on drug resistance in Mycobacterium tuberculosis. Antimicrob Agents Chemother 56:3047–3053. doi: 10.1128/AAC.06460-11. [DOI] [PMC free article] [PubMed] [Google Scholar]
- 25.Freihofer P, Akbergenov R, Teo Y, Juskeviciene R, Andersson DI, Böttger EC. 2016. Nonmutational compensation of the fitness cost of antibiotic resistance in mycobacteria by overexpression of tlyA rRNA methylase. RNA 22:1836–1843. doi: 10.1261/rna.057257.116. [DOI] [PMC free article] [PubMed] [Google Scholar]
- 26.Pea DS, Machado D, Ramos D, Couto I, Von Groll A, Viveiros M. 2016. Efflux pumps in mycobacteria: antimicrobial resistance, physiological functions, and role in pathogenicity, p 527–559. In Li X-Z, Elkins CA, Zgurskaya HI (ed), Efflux-mediated antimicrobial resistance in bacteria. Springer International Publishing, Cham, Switzerland. [Google Scholar]
- 27.Safi H, Lingaraju S, Amin A, Kim S, Jones M, Holmes M, McNeil M, Peterson SN, Chatterjee D, Fleischmann R, Alland D. 2013. Evolution of high-level ethambutol-resistant tuberculosis through interacting mutations in decaprenylphosphoryl-β-D-arabinose biosynthetic and utilization pathway genes. Nat Genet 45:1190–1197. doi: 10.1038/ng.2743. [DOI] [PMC free article] [PubMed] [Google Scholar]
- 28.Jagannath C, Reddy VM, Gangadharam PRJ. 1995. Enhancement of drug susceptibility of multi-drug resistant strains of Mycobacterium tuberculosis by ethambutol and dimethyl sulphoxide. J Antimicrob Chemother 35:381–390. doi: 10.1093/jac/35.3.381. [DOI] [PubMed] [Google Scholar]
- 29.Schatz A, Bugle E, Waksman SA. 1944. Streptomycin, a substance exhibiting antibiotic activity against gram-positive and gram-negative bacteria. Exp Biol Med 55:66–69. doi: 10.3181/00379727-55-14461. [DOI] [PubMed] [Google Scholar]
- 30.Moura de Sousa J, Balbontín R, Durão P, Gordo I. 2017. Multidrug-resistant bacteria compensate for the epistasis between resistances. PLoS Biol 15:e2001741. doi: 10.1371/journal.pbio.2001741. [DOI] [PMC free article] [PubMed] [Google Scholar]
- 31.Borrell S, Teo Y, Giardina F, Streicher EM, Klopper M, Feldmann J, Müller B, Victor TC, Gagneux S. 2013. Epistasis between antibiotic resistance mutations drives the evolution of extensively drug-resistant tuberculosis. Evol Med Public Heal 2013:65–74. doi: 10.1093/emph/eot003. [DOI] [PMC free article] [PubMed] [Google Scholar]
- 32.Casali N, Nikolayevskyy V, Balabanova Y, Harris SR, Ignatyeva O, Kontsevaya I, Corander J, Bryant J, Parkhill J, Nejentsev S, Horstmann RD, Brown T, Drobniewski F. 2014. Evolution and transmission of drug-resistant tuberculosis in a Russian population. Nat Genet 46:279–286. doi: 10.1038/ng.2878. [DOI] [PMC free article] [PubMed] [Google Scholar]
- 33.Cohen KA, Abeel T, Manson McGuire A, Desjardins CA, Munsamy V, Shea TP, Walker BJ, Bantubani N, Almeida DV, Alvarado L, Chapman SB, Mvelase NR, Duffy EY, Fitzgerald MG, Govender P, Gujja S, Hamilton S, Howarth C, Larimer JD, Maharaj K, Pearson MD, Priest ME, Zeng Q, Padayatchi N, Grosset J, Young SK, Wortman J, Mlisana KP, O'Donnell MR, Birren BW, Bishai WR, Pym AS, Earl AM. 2015. Evolution of extensively drug-resistant tuberculosis over four decades: whole genome sequencing and dating analysis of Mycobacterium tuberculosis isolates from KwaZulu-Natal. PLoS Med 12:e1001880. doi: 10.1371/journal.pmed.1001880. [DOI] [PMC free article] [PubMed] [Google Scholar]
- 34.World Health Organization. 2018. The use of next-generation sequencing technologies for the detection of mutations associated with drug resistance in Mycobacterium tuberculosis complex: technical guide. World Health Organization, Geneva, Switzerland. [Google Scholar]
- 35.Farhat MR, Sultana R, Iartchouk O, Bozeman S, Galagan J, Sisk P, Stolte C, Nebenzahl-Guimaraes H, Jacobson K, Sloutsky A, Kaur D, Posey J, Kreiswirth BN, Kurepina N, Rigouts L, Streicher EM, Victor TC, Warren RM, van Soolingen D, Murray M. 2016. Genetic determinants of drug resistance in Mycobacterium tuberculosis and their diagnostic value. Am J Respir Crit Care Med 194:621–630. doi: 10.1164/rccm.201510-2091OC. [DOI] [PMC free article] [PubMed] [Google Scholar]
- 36.Miotto P, Tessema B, Tagliani E, Chindelevitch L, Starks AM, Emerson C, Hanna D, Kim PS, Liwski R, Zignol M, Gilpin C, Niemann S, Denkinger CM, Fleming J, Warren RM, Crook D, Posey J, Gagneux S, Hoffner S, Rodrigues C, Comas I, Engelthaler DM, Murray M, Alland D, Rigouts L, Lange C, Dheda K, Hasan R, Ranganathan UDK, McNerney R, Ezewudo M, Cirillo DM, Schito M, Köser CU, Rodwell TC. 2017. A standardised method for interpreting the association between mutations and phenotypic drug resistance in Mycobacterium tuberculosis. Eur Respir J 50:1701354. doi: 10.1183/13993003.01354-2017. [DOI] [PMC free article] [PubMed] [Google Scholar]
- 37.Lee J, Armstrong DT, Ssengooba W, Park J-A, Yu Y, Mumbowa F, Namaganda C, Mboowa G, Nakayita G, Armakovitch S, Chien G, Cho S-N, Via LE, Barry CE, Ellner JJ, Alland D, Dorman SE, Joloba ML. 2014. Sensititre MYCOTB MIC plate for testing Mycobacterium tuberculosis susceptibility to first- and second-line drugs. Antimicrob Agents Chemother 58:11–18. doi: 10.1128/AAC.01209-13. [DOI] [PMC free article] [PubMed] [Google Scholar]
- 38.Rancoita PMV, Cugnata F, Gibertoni Cruz AL, Borroni E, Hoosdally SJ, Walker TM, Grazian C, Davies TJ, Peto TEA, Crook DW, Fowler PW, Cirillo DM, Crook DW, Peto TEA, Walker AS, Hoosdally SJ, Gibertoni Cruz AL, Grazian C, Walker TM, Fowler PW, Wilson D, Clifton D, Iqbal Z, Hunt M, Smith EG, Rathod P, Jarrett L, Matias D, Cirillo DM, Borroni E, Battaglia S, Chiacchiaretta M, De Filippo M, Cabibbe A, Tahseen S, Mistry N, Nilgiriwala K, Chitalia V, Ganesan N, Papewar A, Rodrigues C, Kambli P, Surve U, Khot R, Niemann S, Kohl T, Merker M, Hoffmann H, Lehmann S, Plesnik S, Ismail N, Omar SV, Joseph L, Marubini E, Thwaites G, Thuy Thuong TN, Ngoc NH, Srinivasan V, Moore D, Coronel J, Solano W, He G, Zhu B, Zhou Y, Ma A, Yu P, Schito M, Claxton P, Laurenson I. 2018. Validating a 14-drug microtiter plate containing bedaquiline and delamanid for large-scale research susceptibility testing of Mycobacterium tuberculosis. Antimicrob Agents Chemother 62:1–15. [DOI] [PMC free article] [PubMed] [Google Scholar]
- 39.Starks AM, Avilés E, Cirillo DM, Denkinger CM, Dolinger DL, Emerson C, Gallarda J, Hanna D, Kim PS, Liwski R, Miotto P, Schito M, Zignol M. 2015. Collaborative effort for a centralized worldwide tuberculosis relational sequencing data platform. Clin Infect Dis 61:S141–S146. doi: 10.1093/cid/civ610. [DOI] [PMC free article] [PubMed] [Google Scholar]
- 40.Springer B, Lucke K, Calligaris-Maibach R, Ritter C, Böttger EC. 2009. Quantitative drug susceptibility testing of Mycobacterium tuberculosis by use of MGIT 960 and EpiCenter instrumentation. J Clin Microbiol 47:1773–1780. doi: 10.1128/JCM.02501-08. [DOI] [PMC free article] [PubMed] [Google Scholar]
- 41.Stucki D, Ballif M, Egger M, Furrer H, Altpeter E, Battegay M, Droz S, Bruderer T, Coscolla M, Borrell S, Zürcher K, Janssens J-P, Calmy A, Mazza Stalder J, Jaton K, Rieder HL, Pfyffer GE, Siegrist HH, Hoffmann M, Fehr J, Dolina M, Frei R, Schrenzel J, Böttger EC, Gagneux S, Fenner L. 2016. Standard genotyping overestimates transmission of Mycobacterium tuberculosis among immigrants in a low-incidence country. J Clin Microbiol 54:1862–1870. doi: 10.1128/JCM.00126-16. [DOI] [PMC free article] [PubMed] [Google Scholar]
- 42.Bloemberg GV, Keller PM, Stucki D, Stuckia D, Trauner A, Borrell S, Latshang T, Coscolla M, Rothe T, Hömke R, Ritter C, Feldmann J, Schulthess B, Gagneux S, Böttger EC. 2015. Acquired resistance to bedaquiline and delamanid in therapy for tuberculosis. N Engl J Med 373:1986–1988. doi: 10.1056/NEJMc1505196. [DOI] [PMC free article] [PubMed] [Google Scholar]
- 43.Egger M, Ekouevi DK, Williams C, Lyamuya RE, Mukumbi H, Braitstein P, Hartwell T, Graber C, Chi BH, Boulle A, Dabis F, Wools-Kaloustian K. 2012. Cohort profile: the International Epidemiological Databases to Evaluate AIDS (IeDEA) in sub-Saharan Africa. Int J Epidemiol 41:1256–1264. doi: 10.1093/ije/dyr080. [DOI] [PMC free article] [PubMed] [Google Scholar]
- 44.Ängeby K, Juréen P, Kahlmeter G, Hoffner S, Schön T. 2012. Challenging a dogma: antimicrobial susceptibility testing breakpoints for Mycobacterium tuberculosis. Bull World Health Organ 90:693–698. doi: 10.2471/BLT.11.096644. [DOI] [PMC free article] [PubMed] [Google Scholar]
- 45.World Health Organization. 2014. Companion handbook to the WHO guidelines for the programmatic management of drug-resistant tuberculosis. World Health Organization, Geneva, Switzerland. [PubMed] [Google Scholar]
- 46.Delignette-Muller ML, Dutang C. 2015. fitdistrplus: an R package for fitting distributions. J Stat Softw 64:1–34. [Google Scholar]
- 47.Martin Bland J, Altman D. 1986. Statistical methods for assessing agreement between two methods of clinical measurement. Lancet 327:307–310. doi: 10.1016/S0140-6736(86)90837-8. [DOI] [PubMed] [Google Scholar]
- 48.Ghielmetti G, Coscolla M, Ruetten M, Friedel U, Loiseau C, Feldmann J, Steinmetz HW, Stucki D, Gagneux S. 2017. Tuberculosis in Swiss captive Asian elephants: microevolution of Mycobacterium tuberculosis characterized by multilocus variable-number tandem-repeat analysis and whole-genome sequencing. Sci Rep 7:14647. doi: 10.1038/s41598-017-15278-9. [DOI] [PMC free article] [PubMed] [Google Scholar]
- 49.Kambli P, Ajbani K, Nikam C, Sadani M, Shetty A, Udwadia Z, Georghiou SB, Rodwell TC, Catanzaro A, Rodrigues C. 2016. Correlating rrs and eis promoter mutations in clinical isolates of Mycobacterium tuberculosis with phenotypic susceptibility levels to the second-line injectables. Int J Mycobacteriology 5:1–6. doi: 10.1016/j.ijmyco.2015.09.001. [DOI] [PMC free article] [PubMed] [Google Scholar]
Associated Data
This section collects any data citations, data availability statements, or supplementary materials included in this article.