

Abstract
Objectives: Desmoglein 3 (Dsg3) is a desmosomal adhesion protein expressed in basal and immediate suprabasal layers of skin. Importance of Dsg3 in cell–cell adhesion and maintenance of tissue integrity is illustrated by findings of keratinocyte dissociation in the autoimmune disease, pemphigus vulgaris, where autoantibodies target Dsg3 on keratinocyte surfaces and cause Dsg3 depletion from desmosomes. However, recognition of possible participation of involvement of Dsg3 in cell proliferation remains controversial. Currently, available evidence suggests that Dsg3 may have both anti‐ and pro‐proliferative roles in keratinocytes. The aim of this study was to use RNA interference (RNAi) strategy to investigate effects of silencing Dsg3 in cell–cell adhesion and cell proliferation in two cell lines, HaCaT and MDCK.
Materials and methods: Cells were transfected with siRNA, and knockdown of Dsg3 was assessed by western blotting, fluorescence‐activated cell sorting and confocal microscopy. Cell–cell adhesion was analysed using the hanging drop/fragmentation assay, and cell proliferation by colony forming efficiency, BrdU incorporation, cell counts and organotypic culture.
Results: Silencing Dsg3 caused defects in cell–cell adhesion and concomitant reduction in cell proliferation in both HaCaT and MDCK cells.
Conclusion: These findings suggest that Dsg3 depletion by RNAi reduces cell proliferation, which is likely to be secondary to a defect in cell–cell adhesion, an essential function required for cell differentiation and morphogenesis.
Introduction
Increasing evidence suggests that desmosomal proteins not only function to ‘hold’ epithelial cells together but also serve as signalling molecules that are involved in a wide range of cellular activities, including proliferation, differentiation, morphogenesis, cell motility, apoptosis and survival (1, 2, 3).
Desmosomes are crucial intercellular junctions in epithelia and consist essentially of trans‐membrane desmosomal cadherins, [desmogleins (Dsg) and desmocollins (Dsc)], and cytoplasmic plaque proteins (armadillo and plakin family members) (4). Passing through plasma‐membranes, desmosomes link directly to the intermediate filament network via a collection of plaque proteins. Although the importance of desmosome junctions in cell–cell adhesion is well established, their involvement in cell growth and differentiation remains unclear. Evidence supporting the possibility of both anti‐ and pro‐proliferative roles for desmosomal proteins has been described in the literature and can be demonstrated with the desmosomal cadherin, Dsg3. While compelling evidence based on genetic studies has suggested that Dsg3 has pro‐proliferative activity in mouse skin (5, 6), recent studies, based on the autoimmune blistering disease pemphigus vulgaris, have indicated that it may also have an anti‐proliferative role, as depletion of Dsg3 and upregulation of c‐Myc have been found in skin of both humans and dogs with the disease (7, 8, 9).
In human squamous cell carcinomas of the head and neck, stomach and lungs, loss of desmoglein isoforms 1–3 has been associated with poor prognosis (10, 11), yet up‐regulation of Dsg2 or 3 in these tumour types has also been reported in other studies (12, 13, 14). An RNA interference (RNAi) study, in various head and neck cancer cell lines has shown inhibition of tumour cell population growth, cell migration and invasion following knockdown of Dsg3 (13).
In hereditary human skin diseases, mutations in genes encoding DSG1, DSP (desmoplakin), JUP (plakoglobin) and plakophilin 1 cause disruptions in intercellular junctions and skin fragility, all frequently accompanied by effects on cell proliferation and differentiation, manifest by skin thickening, hyperkeratosis and disturbed cell differentiation (15, 16, 17, 18, 19). Our previous in vitro study demonstrated that inhibition of desmoplakin by RNAi‐mediated knockdown in keratinocytes, resulted in altered cell proliferation and differentiation (20). However, it remains unclear whether these alterations were direct consequences of defects in desmosomal adhesion or were secondary events following disruption of cell–cell junctions.
Based on FACS sorting of human keratinocytes into those with Dsg3‐low or Dsg3‐high expression, we were able to demonstrate differential proliferative capacity in these two separate sub‐populations (21, 22). Both primary and immortalized keratinocyte lines that had limited Dsg3 expression exhibited increased proliferative potential and colony forming efficiency compared to their high Dsg3‐expressing counterparts (21, 22). These findings led us to hypothesize that Dsg3 may have an anti‐proliferative role in epithelial cells.
To investigate possible roles of Dsg3 in aspects of cell proliferation, we carried out an in vitro study, based on RNAi strategy, in two non‐transformed epithelial systems, stratifying HaCaT keratinocytes and MDCK simple epithelial cells. Both systems are frequently used as models for epithelial cell differentiation in vitro (23, 24, 25, 26, 27). Our results support the notion that Dsg3 may participate in regulation of cell proliferation in these immortalized cell lines by a mechanism that controls cell–cell attachment and desmosomal adhesion.
Materials and methods
Antibodies
Mouse monoclonal and rabbit polyclonal antibodies (Abs) used were as follows: 5H10, mouse Ab to extracellular domain of Dsg3 (gift from Professor M. Amagai); AHP319, rabbit Ab to Dsg3 (AbD Serotec); 33‐3D, mouse IgM to Dsg2 and 115F, mouse Ab to Dp (gifts from Profssor D Garrod); AHP320, rabbit Ab to Dp (AbD Serotec, Oxford, UK); rabbit polyclonal Ab to Myc tag (Cell Signaling Technology, Inc., Danvers, MA, USA); β‐actin Ab ab6276 (Abcam, Cambridge, UK) as loading controls. Secondary Abs used were Alexa Fluor 488/568 conjugated goat anti‐mouse or ‐rabbit IgG or IgM (Invitrogen Ltd, Paisley, UK).
SiRNA transfection in HaCaT cells
Two siRNA sequences specific for human Dsg3 mRNA (Accession: NM_001944.1), corresponding to nucleotides 329–349 or 620–640 of the respective coding region, were designed (aatcacctaccgaatctctgg: RNAi‐1; aaatgccacagatgcagatga: RNAi‐2) and subjected to a BLAST database search prior to being synthesized by Dharmacon Research (Dharmacon, Inc., Chicago, IL, USA). The scrambled control, randomized Dsg3 based on the sequence of RNAi‐2 (aacgatgatacatgacacgag), was synthesized by the same company. Transfection procedure followed the protocol provided by Oligofectamine Reagent (Invitrogen, Carlsbad, CA, USA) as described previously (20). HuSHTM shRNA plasmids (29‐mer) used for transduction in MDCK cells were purchased from OriGene Technologies Inc (Rockville, MD, USA).
Immunoblotting
Protein extraction and western blotting were carried out as described previously (28).
Immunofluorescence labelling and flow cytometry
As Dsg3 is a cell surface, calcium‐dependent desmosmal cadherin, a modified procedure was followed when harvesting keratinocytes for cell surface fluorescence labelling of this protein, to protect extracellular cadherin domains from enzymatic proteolysis (21, 22). Thus, HaCaT cells were dissociated in 0.25% trypsin in presence of 0.5–1 mm calcium (21, 22). Approximately 2 × 10⁵ cells were fixed and permeabilized following the protocol supplied, with Caltag Fix & Perm Cell Reagent (Caltag Lab, Caltag‐Medsystems Ltd, Buckingham, UK). Briefly, cell pellets were fixed in 100 μl of fixation reagent for 15 min at RT, washed in FACS buffer, then re‐suspended in 100 μl of permeabilization reagent together with primary antibody, for 20 min at RT. Cells were washed before secondary Alexa Fluor 488 IgG conjugates were added and incubated for 20 min. After final washing, cells were re‐suspended in FACS buffer and analysed on a FACScan.
Hanging drop assay
A quantity of 30 μl drops of cells at 3 × 10⁵/ml was plated on to lids of 24‐well plate. Each lid was then inverted over wells of multiwell plates containing PBS, to prevent evaporation of the hanging drops. Cell aggregates were photographed after overnight culture. For each experiment, six drops were plated for each group. All images were analysed using Imagej software and two parameters, number and average size of aggregates, were recorded and presented as mean ± SD. P < 0.05 was considered statistically significant.
Cell proliferation and colony‐forming assay
HaCaT cells were grown routinely in DMEM (CRUK) supplemented with 10% FBS (Bio West, Nuaille, France). For generation of growth curves, cells were trypsinized the day after siRNA transfection (on Day 1) and plated at 5000 cells/well in triplicate in six‐well plates, and then harvested with trypsin/versene, (CRUK) and counted using the CASY (CASY Technology, Reutlingen, Germany) at indicated time points. For colony‐forming assays, cells were plated at 500, 1000 and 2000 cells/well, respectively, in six‐well plates on day 2 following siRNA transfection. On day 7, cells were transfected with siRNA for the second time at the same concentration. Colonies were grown for 12–14 days before fixation in 4% formaldehyde for 10–20 min. After washing in PBS (CRUK), colonies were stained with 1% rhodamine (Sigma, St. Louis, MO, USA) and 1% Nile blue (Sigma) before air drying.
Growth recovery assay
Cells were harvested with trypsin/versene the day after siRNA transfection and plated in six‐well plates in triplicate at density of 5000 cells/well, and allowed to grow for 10 days. After this period, cells in each well were harvested with trypsin and counted using the CASY apparatus; this cell number was scored as passage 1 and the same procedure was repeated twice until passage 3. Finally, data are presented as the means ± SD of the triplicates.
BrdU incorporation assay
Cells were transfected for two successive days with siRNA transfections. After this period they were then re‐plated at colony densities (5–10 × 103 cells in six‐well plates), either as replicates of three or six, for a series of time points. At each time, cells were labelled with 10 μm BrdU in normal medium for 2.5 h before being harvested with trypsin/versene for BrdU staining. Dissociated cells were fixed initially in 1 ml formal saline (CRUK) for 5 min and then in 1 ml of ice‐cold 70% ethanol for 10 min. After centrifugation, cells were washed in PBS and re‐suspended in 1 ml of the 0.2 mg/ml pepsin solution (Sigma) containing 0.15 m hydrochloric acid and incubated at 37 °C in a water bath for 12 min. Reactions were neutralized by addition of 3 ml PBS prior to centrifugation. After two washes in PBS, cells were incubated in anti‐BrdU Ab (Becton Dickinson, BD, Oxford, England) 1:5 in PBS/0.5% Tween 20/1% FCS for 1 h at room temperature. They were then washed in PBS and incubated in FITC‐conjugated rabbit anti‐mouse F(ab′)2 fragments (Dako, Dako UK Ltd, Cambridgeshire, UK) 1:10 for 30 min in the dark. After final washes, cells were re‐suspended in 50 μg/ml propidium iodide solution and left at room temperature in the dark for 15 min before analysis by FACScan. Data presented are means ± SD of at least triplicate samples.
Organotypic culture on de‐epidermalised dermis
Glycerol‐preserved skin [Euro Skin Bank (ESB), AJ Beverwijk, The Netherlands] was washed and stored in PBS (Ca++/Mg++ free), containing an antibiotic mix, at 37 °C for up to 10 days. Then epidermis was removed mechanically (so called de‐epidermalized dermis or DED) and dermis cut into 1.5 × 1.5 cm squares. A 1‐cm diameter stainless steel ring was placed on the reticular side of each dermal square and suspensions of normal primary human fibroblasts were seeded at 5 × 10⁵ cells per ring and grown for 1 day. Then, RNAi‐treated HaCaT cells were plated at 2 × 10⁵ cell per ring on the papillary side and grown in normal keratinocyte culture medium (21) for 1 day. Grafts were then lifted on to grids and cultured at the air–liquid interface for 2 weeks before fixation. Tissue sections were obtained at two different levels (approximately 1 mm intervals) and stained with haematoxylin and eosin. A series of photomicrographs was taken from each section and subjected to image processing. Parameters such as area and depth of epidermis formed by HaCaT cells were acquired using OPTILAB PRO 2.6.1 software (Graftek, Villanterio, Italy) and subjected to statistical analysis. Sample size in each group was 12 regions and data presented are means ± SD.
Results
Dsg3 knockdown by transient siRNA transfection in HaCaTs
Two double‐stranded siRNAs (RNAi‐1 and ‐2) targeting the human Dsg3 gene were designed following the principles recommended by the company producing them (Dharmacon). The homologous sequence of RNAi‐2 is further downstream than that of RNAi‐1 in Dsg3 mRNA (Accession: NM_001944.1). These sequences are specific to Dsg3 mRNA and there is no match to the NCBI nucleotide database, in particular to Dsg1 and Dsg2, by BLAST searching. Western blotting revealed that RNAi‐ 2, but not RNAi‐1, consistently produced good down‐regulation of Dsg3 with protein levels achieving only 20% of that of scrambled control cells (Fig. 1a). Confocal analysis in cells dual labelled for Dsg3 and Dp revealed significant reduction of Dsg3 and disruption of desmosomal junctions as shown by Dp staining in cells treated with RNAi‐2 (Fig. 1b arrows). Percentage reduction with 200 nm RNAi‐2, relative to scrambled control, as assessed by mean fluorescence intensities acquired by FACS, was 51.77 ± 16.50% (mean ± SD), but to much lesser extent for RNAi‐1 with reduction of only 5.84 ± 17.97% (n = 3–5) (Fig. 1c). No evident dose‐dependent responses for RNAi‐2 were seen by either western blotting or FACS techniques; thus, for example, the latter procedure showed percentage of protein reduction at 100 nm was 48.02 ± 13.26%, at 200 nm was 51.77 ± 16.50%, and at 300 nm, was 40.57 ± 28.97% (n = 3) (Fig. 1a,c). Time course studies indicated that Dsg3 reduction persisted for between 2 and 4 days (Fig. 1c). By about 5 days, protein recovery appeared to occur and after 7 days, expression of Dsg3 had returned to almost control levels (Fig. 1c).
Figure 1.
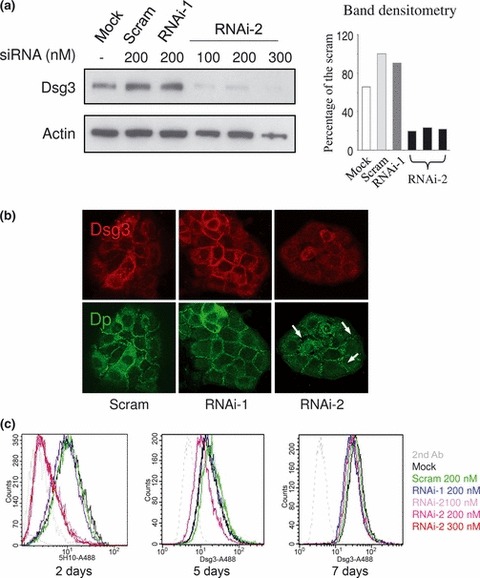
Dsg3 knockdown in HaCaTs. (a) Western blotting of Dsg3 in HaCaT cells transfected either with or without scrambled (Scram), RNAi‐1 and RNAi‐2 siRNAs at different concentrations, for 2 days; loading control –β‐actin. Densitometry of Dsg3 blot is shown on the right. Note that Dsg3 levels in RNAi‐2 treated cells were ∼20% of that of scrambled control regardless of different siRNA concentrations. (b) Confocal microscope images of HaCaT cells dual labelled for Dsg3 (AHP319) and Dp (115F) following transfection of scrambled siRNA, RNAi‐1 and RNAi‐2 for 3 days. Disruption of desmosomal junctions was seen in RNAi‐2‐treated cells for Dp staining (arrows). (c) FACS analysis of Dsg3 expression, labelled with mouse Dsg3 Ab 5H10, in HaCaTs transfected similarly (a) for a period of up to 7 days. Again, significant knockdown of Dsg3 was seen after 2 days regardless of siRNA concentration for RNAi‐2. RNAi‐1 showed very subtle effect on Dsg3 expression (blue line). After 7 days, expression of Dsg3 in RNAi treated cells recovered to almost that of normal control levels.
Dsg3 silencing in HaCaTs caused disruption of desmosome junctions and compromised cell–cell adhesion
To assess effects of RNAi mediated Dsg3 silencing on desmosome junctions, we performed fluorescence confocal microscopy on cells treated with either scrambled or Dsg3‐specific siRNA, to examine impact on desmosomal junction formation. As Fig. 2 shows, strong staining for both Dsg3 and Dsg2 and their colocalization at the cell periphery were seen in control cells, whereas silencing Dsg3 had a dramatic effect on expression of these desmosomal cadherins and on desmosomal junction formation (Fig. 2a arrows). To assess effects of such disruption on cell–cell junction formation, we performed the hanging drop assay (as described in Materials and methods) on these cells, following siRNA transfection for 2 days. Cells with Dsg3 knockdown were less cohesive and formed smaller aggregates compared to control cells in hanging drops (Fig. 2b).
Figure 2.
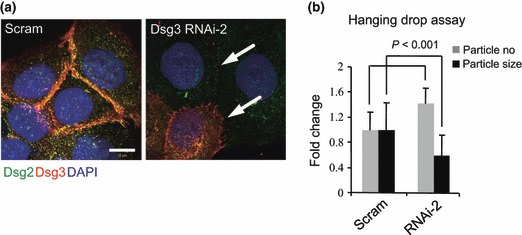
Dsg3 silencing in HaCaTs caused reduction in Dsg2 and disruption of desmosome junctions. (a) Confocal images of HaCaT cells transfected with either scrambled siRNA (Scram) or Dsg3 RNAi‐2 and dual labelled for Dsg2 (green, with 33‐3D Ab) and Dsg3 (red, with 5H10 Ab) counterstained with DAPI. Note significant reduction in and disruption of desmosomal junctions (indicated by arrows) was evident in cells with both Dsg3 and Dsg2 depletion. Bar = 10 μm. (b) Hanging drop assay indicated significantly increased particle number and reduced particle size in cells with Dsg3 depletion. Data (mean ± SD) pooled from two independent experiments (sample size = 12).
Dsg3 depletion in HaCaTs resulted in reduced colony growth, impaired epithelial cell proliferation and BrdU incorporation
To assess colony forming capacity of HaCaT cells following Dsg3 suppression, we ensured that knockdown was sufficient throughout the 2‐week experimental period, by performing siRNA transfection again after 7 days colony growth (Fig. 3a,b). There was significant reduction in colony density and colony size with RNAi‐2‐treated cells (P < 0.05; n = 7), but to a lower degree with RNAi‐1‐treated cells (Fig. 2a,b). Using trypan blue exclusion, we ruled out that this was due to cytotoxicity in RNAi‐treated cells relative to controls (data not shown). Furthermore, BrdU incorporation assays on these transfected cells, at different time points for a period of up to 7 days (n = 5), revealed slight, but consistent, reduction in G1‐to‐S phase transition (∼3–12%) and increase in G1 (∼2–7%) with Dsg3 RNAi (Fig. 3c,d). After 3 days, relative percentages of G1 phase cells in scrambled controls and Dsg3 RNAi‐2 populations were 27.15 ± 3.06% and 29.88 ± 5.36%, respectively; S phase cells were 54.93 ± 5.81% and 42.41 ± 4.56%, respectively; and G2/M phase cells were 4.82 ± 1.91% and 3.33 ± 0.35%, respectively (Fig. 3c). Reduction in BrdU incorporation was most obvious after 3 days siRNA transfection and this effect gradually attenuated after 7 days (Fig. 3d).
Figure 3.
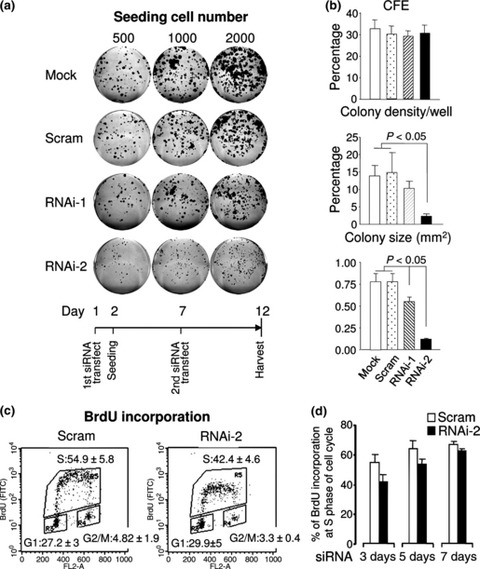
Dsg3 silencing in HaCaTs resulted in restricted colony growth, but no changes in CFE. (a) Colony‐forming assay of HaCaT cells transfected with either scrambled (Scram) or Dsg3 siRNAs. Cells seeded at 500, 1000 and 2000 cells/well in six‐well plates 1 day after first siRNA transfection. After 7 days, cells were subjected to second siRNA transfection and colonies were fixed and stained after 12 days. (b) Quantification of colonies from six wells of two representative experiments (mean ± SEM). (c) BrdU incorporation assay indicated that cells treated with RNAi‐2 had reduced cell entry into S phase (54.9 ± 5.8 in control versus 42.4 ± 4.6 in RNAi‐2). (d) Time course analysis of BrdU incorporation following Dsg3 knockdown by RNAi. Decreased BrdU incorporation was seen in RNAi‐2‐treated cells after 3–5 days after siRNA transfection compared to scrambled control cells.
To confirm that silencing Dsg3 resulted in cell population growth inhibition, we conducted a standard growth curve assay, by direct cell counting, for a period of 9 days. As shown in Fig. 4a, cells transfected with RNAi‐1 and ‐2 displayed reduced cell proliferation, but to a lower extent in the former (n = 3). In support of trypan blue data, we demonstrated that such decreased cell proliferation was reversible as continued culture of these cells for further two passages (P2 and P3) over the next month indicated that the differences in population growth rates were transient (Fig. 4b).
Figure 4.
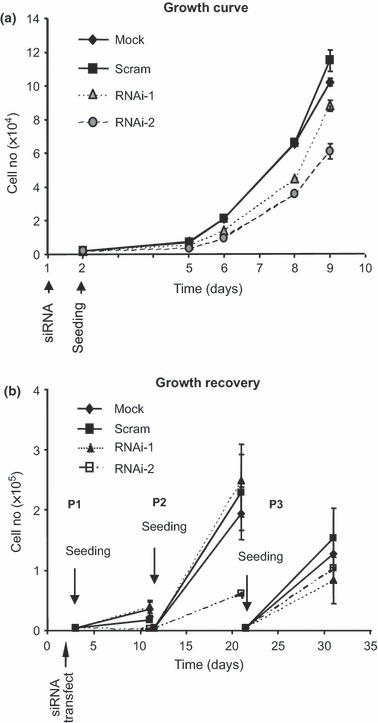
Transiently suppressed cell growth after Dsg3 knockdown. (a) Growth curve of HaCaT cells after transfection with or without scrambled (Scram), RNAi‐1 and RNAi‐2 siRNAs. Note that cells transiently transfected with Dsg3 siRNAs exhibited lower growth rate compared to controls, particularly, RNAi‐2‐treated cells. (b) Cell growth recovery over three passages after transient siRNA transfection in HaCaTs. Cells were seeded at the same density the following day after transfection and allowed to grow for 10 days (P1). Then, all cells were harvested and cell number for each population was determined by direct cell counting before seeding an aliquot of cells for culture again (P2). The same procedure was repeated for P3. Note that population growth rate of cells with Dsg3 knockdown appeared to be recovering gradually over time at P2 and P3.
To assess skin regenerative capacity of HaCaT cells with Dsg3 silencing, we carried out organotypic culture on de‐epidermalized dermis (DED), using a protocol established previously (22). After 1–2 weeks of air–liquid culture, we showed that over several independent experiments, HaCaT cells with Dsg3 silencing produced little or much thinner reconstituted epithelium compared to control cells (Fig. 5a,b). Ki67 staining showed reduced number of Ki67‐positive cells in RNAi‐2‐treated cells compared to controls (Fig. 5a arrows).
Figure 5.
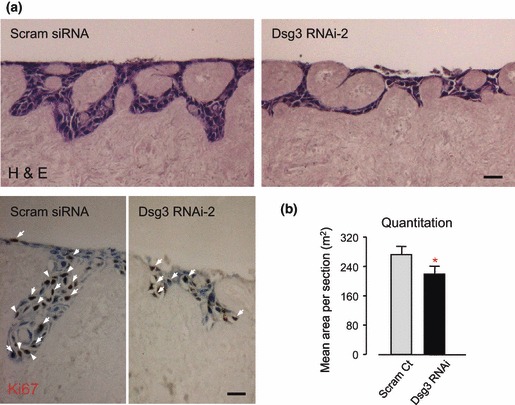
Cells with Dsg3 silencing displayed poor quality of skin regeneration. (a) One week organotypic culture of cells with or without Dsg3 knockdown (n > 3). Top: H&E staining; Bottom: Ki67 staining, positive cells marked with white arrows. Bars, 50 μm. (b) Quantification of epithelial areas in organotypic culture sections (n = 12). Note that cells treated with RNAi produced significantly lower cellular mass (*P < 0.05) and less Ki67 positive cells.
Modulation of Dsg3 protein levels in the MDCK cell line affects cell proliferation
MDCK cells are a representative simple epithelial cell line and are often used as a model system to study cell polarization and differentiation (25, 29). To confirm that findings described above were representative of all types of epithelial cells, we carried out a parallel study on MDCK cells. Thus, we have obtained two matched cell lines, with either overexpression (pBABE‐V and ‐hDsg3.myc) or suppression of Dsg3 expression (pRS‐V and ‐shRNAi), following standard procedures (30). As demonstrated in Fig. 6a,b, by western blotting and confocal microscopy, expression levels of Dsg3 in both knock‐in (KI) and knockdown (KD) cells were altered following transduction of hDsg3.myc or shRNAi. To analyse effects of silencing Dsg3 on cell–cell adhesion, we performed dispase fragmentation assay (31). Figure 6c shows the result of this assay with higher numbers of fragments in both shRNAi‐treated cells compared to vector control cells. In support of above, the hanging drop assay also showed trends to reduction in size of aggregates following silencing Dsg3 (not shown).
Figure 6.
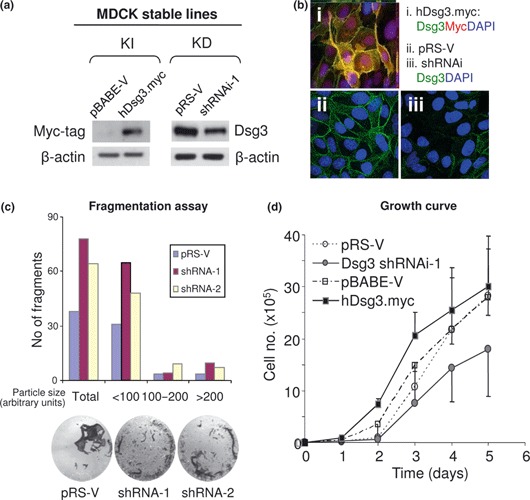
Modulation of Dsg3 expression affected cell proliferation in MDCK cells. (a) Western blotting of cell lysates extracted from cells with either overexpression (knock‐in: KI) or knockdown (KD) of Dsg3. (b) Confocal microscopy of MDCK cells with ectopic Dsg3 expression [myc‐tag in (i)] or with Dsg3 knockdown (iii). Images in (ii) were vector control cells. (c) Dispase fragmentation assay of MDCK cells with either vector or Dsg3 shRNAi transduction. Cells were grown to confluence before being treated with 2.4 units/ml dispase for about 30 min to detach epithelial sheets. These sheets were subjected to mechanical stress by pipetting five times with 1 ml tips. Epithelial fragments were quantified by ImageJ and increased fragments (up to 2‐fold) were seen in cells with Dsg3 silencing by shRNAi‐1 or shRNAi‐2, respectively. Data are averages of duplicates in each group. (d) Growth curve of matched MDCK cells with up‐ or down‐regulation of Dsg3. Cells with overexpression had higher proliferation, but those with Dsg3 knockdown exhibited lower growth rate compared to matched control cells.
Finally, matched MDCK cell lines, with either overexpression or down‐regulation of Dsg3, were analysed for their proliferation by plating cells at the same density in triplicate (2000 cells/well in six‐well plates), and their growth curves were determined by direct cell counting every day for a period of 5 days (n = 3). Again, we showed that increased expression levels of Dsg3 appeared to promote cell proliferation, whereas silencing Dsg3 diminished cell proliferation accordingly (Fig. 6d).
Discussion
In the present study, we adopted an RNAi strategy to investigate whether Dsg3 has a role in regulation of cell proliferation and differentiation in two epithelial model systems, HaCaT keratinocytes and MDCK cell line. Using various approaches, we demonstrated that knockdown of Dsg3 in these cell lines caused defects in cell–cell adhesion, accompanied by reduced cell proliferation and impaired skin regenerative capacity, on de‐epidermalized dermis. This suggests that Dsg3 regulates cell proliferation by controlling characteristic cell–cell adhesion and desmosome function.
Traditionally, desmosomes have been viewed simply as ‘anchoring’ intercellular junctional structures, providing mechanical resilience by maintaining tissue integrity through direct coupling to the intermediate filament network. However, it has become increasingly clear that, like adherens junctions, desmosome functions extend beyond mere structural and mechanical properties (32, 33, 34, 35). Desmosomal cadherins exist as multiple isoforms and exhibit coordinated, yet distinctive, expression patterns throughout the epidermis. Thus, it has been proposed that these patterns may directly correlate with intracellular signal transduction and an epidermal adhesion gradient, which in turn regulates cellular proliferation, differentiation and tissue morphogenesis (36, 37). Strong evidence based on both in vitro and in vivo studies supports this view. In vivo transgenic studies have shown that mis‐expression of basal cell‐specific desmosomal cadherins Dsg2/3 or Dsc3 in suprabasal layers of the skin (driven by the involucrin or K1 promoter, respectively) results in increased keratinocyte proliferation and altered terminal differentiation (6, 38, 39). While multiple signalling pathways associated with increased population growth rate are found to be deregulated in mouse skin with overexpression of Dsg2 (38), elevated β‐catenin activity and cyclin D1 levels have been shown be coupled to mis‐expression of Dsc3 (39). In vitro morphogenesis studies, based on mammary alveolar and skin organotypic cultures, have revealed the important role of adhesion mediated by extracellular domains of desmosomal cadherins, including control of cell positioning and tissue morphogenesis (40). These studies also showed involvement of intracellular domains in signal transduction, independent of extracellular adhesion (41). An example of the latter function is highlighted in a recent report showing that Dsg1 lacking N‐terminal ectodomain residues required for adhesion, remained capable of promoting keratinocyte differentiation by suppression of EGFR signalling (41). Recently, we have shown that a small pool of Dsg3 functions outside desmosomes, being associated with classical cadherin, E‐cadherin, and involved in regulation of E‐cadherin‐Src signalling (30). However, it remains unknown whether this function is dependent on extracellular adhesion functions. Taken together, these results suggest that both extracellular adhesion and intracellular signalling of desmosomal cadherins are directly involved in the epidermal differentiation program which, in turn, is required for tissue morphogenesis and normal function of skin.
As our previous study showing that keratinocytes expressing low levels of Dsg3 exhibited increased colony‐forming efficiency and heightened proliferative potential relative to cells with high Dsg3 expression (21, 22), the current study has aimed to address the hypothesis of whether Dsg3 has any anti‐proliferation activity, by using the RNAi strategy, in HaCaT keratinocytes and simplified MDCK epithelial line. Contrary to our expectation, our results indicated that Dsg3 seemed to have a pro‐proliferative role in these epithelial cells as depletion of the gene by RNAi in both cell lines resulted in some degree of inhibition of cell proliferation and disruption of cell–cell adhesion. Our data suggest that this is likely to be due to disruption/loss of cell–cell adhesion and Dsg3‐mediated signalling pathway caused by RNAi (Wan, unpublished data). We demonstrated here that the effect of RNAi‐mediated Dsg3 knockdown on cell proliferation occurred in a dose‐dependent manner in HaCaT cells. Thus RNAi‐1, which caused Dsg3 reduction to a lower degree, had much less effect on cell proliferation compared to that of RNAi‐2 (1, 3, 4). Accordingly, overexpression of Dsg3 in the simplified MDCK cell line showed accelerated cell proliferation (Fig. 6d). However, this observation was unexpected, as evidence from our previous studies that showed FACS sorted cells with low levels of Dsg3 (Dsg3dim) exhibited relatively high proliferative activity compared to sorted cells with high levels of Dsg3 (Dsg3bri) (21, 22). We reasoned that protein levels of Dsg3, particularly in the case of stratified keratinocytes, may be a critical factor in determining behaviour of cell proliferation. If cell–cell adhesion of epithelial cells is markedly disrupted by RNAi‐mediated Dsg3 depletion (∼80% reduction, 1, 2), signalling pathways that govern cell population growth and proliferation mediated through Dsg3 (30) may be largely affected, the consequence of which is demonstrated in this study (3, 4, 5). On the other hand, we found that levels of Dsg3 expression in the FACS sorted Dsg3dim population remained relatively high (approximately 80% of their Dsg3bri counterparts) after overnight culture following FACS sorting (data not shown). This indicates that cells with an intermediate level of Dsg3 are more likely to be proliferative, whereas cells with either very limited or abundant expression of this protein exhibit reduced proliferation, a response consistent with the characteristics of the bell‐shaped curve.
Our study also suggests that Dsg3 has a role in morphogenesis, as, in a functional assay of skin organotypic culture, we consistently demonstrated that Dsg3 RNAi‐treated cells lost the ability to stratify and regenerate full thickness skin. Again, this is in marked contrast to FACS‐sorted Dsg3dim cells, which consistently exhibited enhanced skin re‐capitulation and the ability to regenerate full thickness skin when compared to their Dsg3bri counterparts (21, 22). Consistent with this result, we observed that silencing Dsg3 in simple MDCK cells affected expression and junction assembly of ZO‐1, a cytoplasmic protein of tight junctions that is required for cell polarization and differentiation of simple epithelial cells (data not shown).
These changes may be partly related to attendant alterations/reduction in other desmosomal proteins, in particular, desmoglein isoform Dsg2 (Fig. 2a). This is because this desmosomal cadherin is the major Dsg in all proliferatively active cells, including basal cell layers of all stratified squamous epithelia (10, 12). We have demonstrated that most other desmosomal cadherins and armadillo family proteins, as well as differentiation‐associated proteins such as involucrin, were affected in cells treated with Dsg3 RNAi (Wan, unpublished data). In contrast, changes in Dsg2 expression level were not detected in FACS‐based selection of cells with lower levels of Dsg3, in immortalized cell lines (22). It is worth noting that alteration of Dsg2 levels in Dsg3 RNAi‐treated cells appeared not to be a consequence of off‐target effects of RNAi at the transcriptional level (10). Taken together, our data suggest that Dsg3 plays an important role in regulation of cell proliferation through controlling cell–cell adhesion and intracellular signalling, thus depletion of the gene leads to defects of these functions essential for epithelial cell proliferation, polarization, differentiation and morphogenesis.
Acknowledgements
We thank Masayuki Amagai and David Garrod for providing the antibody reagents, Ian Hart and Ken Parkinson for critical reading of the manuscript. This work was supported by an MRC Career Development Fellowship to HW, Barts and The London School of Medicine and Dentistry for a vocation scholarship to TM, and the Institute of Dentistry.
References
- 1. Bass‐Zubek AE, Godsel LM, Delmar M, Green KJ (2009) Plakophilins: multifunctional scaffolds for adhesion and signaling. Curr. Opin. Cell Biol. 21, 708–716. [DOI] [PMC free article] [PubMed] [Google Scholar]
- 2. Garrod D, Kimura TE (2008) Hyper‐adhesion: a new concept in cell‐cell adhesion. Biochem. Soc. Trans. 36, 195–201. [DOI] [PubMed] [Google Scholar]
- 3. Sharma P, Mao X, Payne AS (2007) Beyond steric hindrance: the role of adhesion signaling pathways in the pathogenesis of pemphigus. J. Dermatol. Sci. 48, 1–14. [DOI] [PubMed] [Google Scholar]
- 4. Garrod D, Chidgey M (2008) Desmosome structure, composition and function. Biochim. Biophys. Acta 1778, 572–587. [DOI] [PubMed] [Google Scholar]
- 5. Allen E, Yu QC, Fuchs E (1996) Mice expressing a mutant desmosomal cadherin exhibit abnormalities in desmosomes, proliferation, and epidermal differentiation. J. Cell Biol. 133, 1367–1382. [DOI] [PMC free article] [PubMed] [Google Scholar]
- 6. Merritt AJ, Berika MY, Zhai W, Kirk SE, Ji B, Hardman MJ et al. (2002) Suprabasal desmoglein 3 expression in the epidermis of transgenic mice results in hyperproliferation and abnormal differentiation. Mol. Cell. Biol. 22, 5846–5858. [DOI] [PMC free article] [PubMed] [Google Scholar]
- 7. Muller EJ, Williamson L, Kolly C, Suter MM (2008) Outside‐in signaling through integrins and cadherins: a central mechanism to control epidermal growth and differentiation? J. Invest. Dermatol. 128, 501–516. [DOI] [PubMed] [Google Scholar]
- 8. Williamson L, Raess NA, Caldelari R, Zakher A, de Bruin A, Posthaus H et al. (2006) Pemphigus vulgaris identifies plakoglobin as key suppressor of c‐Myc in the skin. EMBO J. 25, 3298–3309. [DOI] [PMC free article] [PubMed] [Google Scholar]
- 9. Williamson L, Suter MM, Olivry T, Wyder M, Muller EJ (2007) Upregulation of c‐Myc may contribute to the pathogenesis of canine pemphigus vulgaris. Vet. Dermatol. 18, 12–17. [DOI] [PubMed] [Google Scholar]
- 10. Teh MT, Parkinson EK, Thurlow JK, Liu F, Fortune F, Wan H (2011) A molecular study of desmosomes identifies a desmoglein isoform switch in head and neck squamous cell carcinoma. J. Oral Pathol. Med. 40, 67–76. [DOI] [PubMed] [Google Scholar]
- 11. Yashiro M, Nishioka N, Hirakawa K (2006) Decreased expression of the adhesion molecule desmoglein‐2 is associated with diffuse‐type gastric carcinoma. Eur. J. Cancer 42, 2397–2403. [DOI] [PubMed] [Google Scholar]
- 12. Brennan D, Mahoney MG (2009) Increased expression of Dsg2 in malignant skin carcinomas: a tissue‐microarray based study. Cell Adh. Migr. 3, 148–154. [DOI] [PMC free article] [PubMed] [Google Scholar]
- 13. Chen YJ, Chang JT, Lee L, Wang HM, Liao CT, Chiu CC et al. (2007) DSG3 is overexpressed in head neck cancer and is a potential molecular target for inhibition of oncogenesis. Oncogene 26, 467–476. [DOI] [PubMed] [Google Scholar]
- 14. Savci‐Heijink CD, Kosari F, Aubry MC, Caron BL, Sun Z, Yang P et al. (2009) The role of desmoglein‐3 in the diagnosis of squamous cell carcinoma of the lung. Am. J. Pathol. 174, 1629–1637. [DOI] [PMC free article] [PubMed] [Google Scholar]
- 15. Armstrong DK, McKenna KE, Purkis PE, Green KJ, Eady RA, Leigh IM et al. (1999) Haploinsufficiency of desmoplakin causes a striate subtype of palmoplantar keratoderma [published erratum appears in Hum Mol Genet 1999 May;8(5):943]. Hum. Mol. Genet. 8, 143–148. [DOI] [PubMed] [Google Scholar]
- 16. Barber AG, Wajid M, Columbo M, Lubetkin J, Christiano AM (2007) Striate palmoplantar keratoderma resulting from a frameshift mutation in the desmoglein 1 gene. J. Dermatol. Sci. 45, 161–166. [DOI] [PMC free article] [PubMed] [Google Scholar]
- 17. Cabral RM, Liu L, Hogan C, Dopping‐Hepenstal PJ, Winik BC, Asial RA et al. (2010) Homozygous mutations in the 5′ region of the JUP gene result in cutaneous disease but normal heart development in children. J. Invest. Dermatol. 130, 1543–1550. [DOI] [PubMed] [Google Scholar]
- 18. Hunt DM, Rickman L, Whittock NV, Eady RA, Simrak D, Dopping‐Hepenstal PJ et al. (2001) Spectrum of dominant mutations in the desmosomal cadherin desmoglein 1, causing the skin disease striate palmoplantar keratoderma. Eur. J. Hum. Genet. 9, 197–203. [DOI] [PubMed] [Google Scholar]
- 19. McGrath JA, McMillan JR, Shemanko CS, Runswick SK, Leigh IM, Lane EB et al. (1997) Mutations in the plakophilin 1 gene result in ectodermal dysplasia/skin fragility syndrome. Nat. Genet. 17, 240–244. [DOI] [PubMed] [Google Scholar]
- 20. Wan H, South AP, Hart IR (2007) Increased keratinocyte proliferation initiated through downregulation of desmoplakin by RNA interference. Exp. Cell Res. 313, 2336–2344. [DOI] [PubMed] [Google Scholar]
- 21. Wan H, Stone MG, Simpson C, Reynolds LE, Marshall JF, Hart IR et al. (2003) Desmosomal proteins, including desmoglein 3, serve as novel negative markers for epidermal stem cell‐containing population of keratinocytes. J. Cell Sci. 116, 4239–4248. [DOI] [PubMed] [Google Scholar]
- 22. Wan H, Yuan M, Simpson C, Allen K, Gavins FN, Ikram MS et al. (2007) Stem/progenitor cell‐like properties of desmoglein 3dim cells in primary and immortalized keratinocyte lines. Stem Cells 25, 1286–1297. [DOI] [PubMed] [Google Scholar]
- 23. Boukamp P, Petrussevska RT, Breitkreutz D, Hornung J, Markham A, Fusenig NE (1988) Normal keratinization in a spontaneously immortalized aneuploid human keratinocyte cell line. J. Cell Biol. 106, 761–771. [DOI] [PMC free article] [PubMed] [Google Scholar]
- 24. Denning MF, Guy SG, Ellerbroek SM, Norvell SM, Kowalczyk AP, Green KJ (1998) The expression of desmoglein isoforms in cultured human keratinocytes is regulated by calcium, serum, and protein kinase C. Exp. Cell Res. 239, 50–59. [DOI] [PubMed] [Google Scholar]
- 25. Karst W, Merker HJ (1988) The differentiation behaviour of MDCK cells grown on matrix components and in collagen gels. Cell Differ. 22, 211–224. [DOI] [PubMed] [Google Scholar]
- 26. Schoop VM, Mirancea N, Fusenig NE (1999) Epidermal organization and differentiation of HaCaT keratinocytes in organotypic coculture with human dermal fibroblasts. J. Invest. Dermatol. 112, 343–353. [DOI] [PubMed] [Google Scholar]
- 27. Yamada S, Nelson WJ (2007) Localized zones of Rho and Rac activities drive initiation and expansion of epithelial cell‐cell adhesion. J. Cell Biol. 178, 517–527. [DOI] [PMC free article] [PubMed] [Google Scholar]
- 28. Wan H, Dopping‐Hepenstal PJ, Gratian MJ, Stone MG, McGrath JA, Eady RA (2003) Desmosomes exhibit site‐specific features in human palm skin. Exp. Dermatol. 12, 378–388. [DOI] [PubMed] [Google Scholar]
- 29. Aijaz S, Sanchez‐Heras E, Balda MS, Matter K (2007) Regulation of tight junction assembly and epithelial morphogenesis by the heat shock protein Apg‐2. BMC. Cell Biol. 8, 49. [DOI] [PMC free article] [PubMed] [Google Scholar]
- 30. Tsang SM, Liu L, Teh MT, Wheeler A, Grose R, Hart IR et al. (2010) Desmoglein 3, via an interaction with E‐cadherin, is associated with activation of Src. PLoS One 5, e14211. [DOI] [PMC free article] [PubMed] [Google Scholar]
- 31. Kimura TE, Merritt AJ, Garrod DR (2007) Calcium‐independent desmosomes of keratinocytes are hyper‐adhesive. J. Invest. Dermatol. 127, 775–781. [DOI] [PubMed] [Google Scholar]
- 32. Getsios S, Amargo EV, Dusek RL, Ishii K, Sheu L, Godsel LM et al. (2004) Coordinated expression of desmoglein 1 and desmocollin 1 regulates intercellular adhesion. Differentiation 72, 419–433. [DOI] [PubMed] [Google Scholar]
- 33. Getsios S, Huen AC, Green KJ (2004) Working out the strength and flexibility of desmosomes. Nat. Rev. Mol. Cell Biol. 5, 271–281. [DOI] [PubMed] [Google Scholar]
- 34. Jamora C, Fuchs E (2002) Intercellular adhesion, signalling and the cytoskeleton. Nat. Cell Biol. 4, E101–E108. [DOI] [PubMed] [Google Scholar]
- 35. Yin T, Green KJ (2004) Regulation of desmosome assembly and adhesion. Semin. Cell Dev. Biol. 15, 665–677. [DOI] [PubMed] [Google Scholar]
- 36. Garrod DR, Merritt AJ, Nie Z (2002) Desmosomal adhesion: structural basis, molecular mechanism and regulation (Review). Mol. Membr. Biol. 19, 81–94. [DOI] [PubMed] [Google Scholar]
- 37. Garrod DR, Merritt AJ, Nie Z (2002) Desmosomal cadherins. Curr. Opin. Cell Biol. 14, 537–545. [DOI] [PubMed] [Google Scholar]
- 38. Brennan D, Hu Y, Joubeh S, Choi YW, Whitaker‐Menezes D, O’Brien T et al. (2007) Suprabasal Dsg2 expression in transgenic mouse skin confers a hyperproliferative and apoptosis‐resistant phenotype to keratinocytes. J. Cell Sci. 120, 758–771. [DOI] [PubMed] [Google Scholar]
- 39. Hardman MJ, Liu K, Avilion AA, Merritt A, Brennan K, Garrod DR et al. (2005) Desmosomal cadherin misexpression alters {beta}‐catenin stability and epidermal differentiation. Mol. Cell. Biol. 25, 969–978. [DOI] [PMC free article] [PubMed] [Google Scholar]
- 40. Runswick SK, O’Hare MJ, Jones L, Streuli CH, Garrod DR (2001) Desmosomal adhesion regulates epithelial morphogenesis and cell positioning. Nat. Cell Biol. 3, 823–830. [DOI] [PubMed] [Google Scholar]
- 41. Getsios S, Simpson CL, Kojima S, Harmon R, Sheu LJ, Dusek RL et al. (2009) Desmoglein 1‐dependent suppression of EGFR signaling promotes epidermal differentiation and morphogenesis. J. Cell Biol. 185, 1243–1258. [DOI] [PMC free article] [PubMed] [Google Scholar]