

Abstract
Objectives: Recombinant human granulocyte colony‐stimulating factor (rhG‐CSF) is widely used as treatment for granulocytopaenia during cytotoxic chemotherapy; however, optimal scheduling of this pharmaceutical is unknown. Biomathematical models can help to pre‐select optimal application schedules but precise pharmacokinetic properties of the pharmaceuticals are required at first. In this study, we have aimed to construct a pharmacokinetic model of G‐CSF derivatives filgrastim and pegfilgrastim in mice.
Methods: Healthy CD‐1 mice and those with cyclophosphamide‐induced granulocytopaenia were studied after administration of filgrastim and pegfilgrastim in different dosing and timing schedules. Close meshed time series of granulocytes and G‐CSF plasma concentrations were determined. An ordinary differential equations model of pharmacokinetics was constructed on the basis of known mechanisms of drug distribution and degradation.
Results: Predictions of the model fit well with all experimental data for both filgrastim and pegfilgrastim. We obtained a unique parameter setting for all experimental scenarios. Differences in pharmacokinetics between filgrastim and pegfilgrastim can be explained by different estimates of model parameters rather than by different model mechanisms. Parameter estimates with respect to distribution and clearance of the drug derivatives are in agreement with qualitative experimental results.
Conclusion: Dynamics of filgrastim and pegfilgrastim plasma levels can be explained by the same pharmacokinetic model but different model parameters. Beause of a strong clearance mechanism mediated by granulocytes, granulocytotic and granulocytopaenic conditions must be studied simultaneously to construct a reliable model. The pharmacokinetic model will be extended to a murine model of granulopoiesis under chemotherapy and G‐CSF application.
Introduction
Cytotoxic chemotherapies can lead to several cytopenic side effects. Severe neutropenia is a specially serious clinical issue because it is associated with increased incidence of infections, hospitalization, antibiotic treatment, reduction of therapy intensity, therapy dropouts and therapy‐associated deaths (1, 2, 3, 4, 5, 6). Recombinant human granulocyte colony‐stimulating factor (rhG‐CSF) is routinely applied to ameliorate or prevent neutropenia (1, 2, 3, 4, 5, 6, 7); it acts by mitotic activation of granulopoietic progenitors and precursors, accelerating maturation of cells and improving release of mature granulocytes from the bone marrow (8, 9, 10, 11, 12, 13, 14).
Filgrastim was the first pharmaceutical rhG‐CSF; it has a short half‐life in vivo because of strong renal elimination and specific degradation mediated by G‐CSF receptors or neutrophil elastase (15, 16, 17, 18, 19, 20, 21, 22). Therefore, filgrastim must be applied multiple times during one cycle of chemotherapy. Pegylated filgrastim (pegfilgrastim) is the next generation of rhG‐CSF; it shows prolonged half‐life in vivo due to reduced renal clearance (23, 24, 25). In clinical practice, it is believed that a single injection of pegfilgrastim is at least as effective as multiple injections of filgrastim with respect to treating neutropenia and preventing infection (2, 26, 27, 28, 29).
However, the effectiveness of G‐CSF treatment depends on many variable therapy parameters, such as applied chemotherapy, individual factors and, especially, dosing and timing of G‐CSF itself (30). Because of this large set of variable therapy parameters, optimal G‐CSF treatment is not obvious and cannot be developed only on the basis of clinical trials.
Previously, we have shown that a biomathematical model of human granulopoiesis, including a preliminary pharmacokinetic model of filgrastim application, is a valuable tool to pre‐select optimal filgrastim schedules in various therapy situations (31, 32, 33). We aim to include the new drug pegfilgrastim in our model in order to optimize corresponding dosing and timing schedules. However, differences in pharmacokinetics (PK) and pharmacodynamics (PD) between filgrastim and pegfilgrastim have not been analysed well enough.
An important PK characteristic of both derivatives is the strong interaction between G‐CSF‐induced granulocytosis and specific degradation of G‐CSF mediated by granulocytes themselves. Therefore, close meshed time series data of both G‐CSF plasma concentrations and granulocytes under various therapy conditions are required to construct a PK model of filgrastim and pegfilgrastim.
On the basis of the time series data of experiments specifically performed for modelling purposes, we have constructed such a model in the murine situation first. Experiments comprise measuring G‐CSF plasma concentrations under various G‐CSF schedules and with or without chemotherapy. We used the same PK model structure for both filgrastim and pegfilgrastim. Hence, differences between the drugs can be reduced to differences in model parameters, which allow comparisons of the PK properties between the two drugs.
The resulting model is the first one that explains PK properties of filgrastim and pegfilgrastim under granulocytotic and granulocytopaenic conditions in the framework of one comprehensive model. The model can be used to predict G‐CSF plasma concentration given the application schedule of the drug and the resulting granulocyte dynamics. Later, this model will be extended to a fully data‐independent PK and PD model of granulopoiesis under chemotherapy and G‐CSF application.
Materials and Methods
Experimental interventions
We used 8‐week–old, female, outbred Hsd:ICR mice (CD‐1®, Harlan Sprague Dawley Inc., Indianapolis, IN, USA, obtained from a breeding stock from Charles River Breeding Laboratories Wilmington, MA, USA) for this study; they were maintained in a defined flora animal facility.
Multiple doses of filgrastim (10 or 20 μg; Neupogen) or single doses of pegfilgrastim (40 μg; Neulasta, both from Amgen, Thousand Oaks, CA, USA) were injected subcutaneously between the scapulae. All mass data regarding rhG‐CSF applications are given as protein mass. Cyclophosphamide (450 mg/kg body weight, 12 mg per animal; Endoxan, Baxter Deutschland GmbH, Unterschleissheim, Germany) was injected intraperitoneally at an injection volume of 200 μl.
Peripheral blood of the mice was taken from the tail vein at specified time points. Blood was collected through heparinized capillaries (Rolf Greiner Biochemica GmbH, Flacht, Germany) and transferred to heparinized tubes (Heparin‐Natrium‐25 000, Ratiopharm GmbH, Ulm, Germany). Counts of circulating granulocytes were determined using an animal blood counter (scil Vet abc, SCIL animal care company GmbH, Viernheim, Germany), which had been calibrated for mouse blood.
G‐CSF plasma levels were measured using the human G‐CSF Cytometric Bead Array kit (CBA, BD Biosciences, San Diego, CA, USA). Data were acquired on FACS Calibur instrumentation (Becton Dickinson, Franklin Lakes, NJ, USA) and was analysed using FCAP Array software (BD Biosciences).
All measurements were taken from at least five mice.
Study design
In order to construct the PK model of G‐CSF, including high dependence of degradation on circulating granulocyte dynamics, it is necessary to study the time series of drug plasma concentrations of different G‐CSF schedules under granulocytopaenic and granulocytotic conditions.
Thus, we applied three doses of 10 and 20 μg of filgrastim on consecutive days to healthy mice, in order to study PK of G‐CSF under elevated granulocyte counts. Alternatively, we applied a fixed single dose of either 20 or 40 μg pegfilgrastim into healthy mice. For experiments with pegfilgrastim, we used two groups of animals comprising five individuals each. For the experiments with filgrastim, we used four groups of animals. Taking of blood samples was time‐shifted between the groups, resulting in a total of two or four measurements per day, respectively.
Additionally, we performed experiments with combined application of cyclophosphamide and G‐CSF. After a fixed dose of cyclophosphamide (12 mg), we applied two doses of 20 μg filgrastim (2 × 20 μg) or four doses of 10 μg filgrastim (4 × 10 μg) on consecutive days after cyclophosphamide application. Treatment was started directly (1 h later), 1 or 2 days after cyclophosphamide. Alternatively, we applied a fixed single dose of 40 μg pegfilgrastim directly (1 h later), 1 or 2 days after cyclophosphamide.
Modelling work
We constructed a PK model of both filgrastim and pegfilgrastim. For this purpose, physiological knowledge about absorption, distribution and elimination kinetics of the G‐CSF derivatives has been transformed into ordinary differential equations. Basic structure of the model is based on a preliminary PK model of filgrastim application in humans (32).
We used the same model equations but different parameters for each drug derivative. Unknown parameters were determined by fitting the model to measured time courses of G‐CSF plasma concentrations, using evolutionary strategies (34). We have aimed to minimize the absolute difference between model and geometric mean of the data. In order to assess identifiability of parameters and precision of parameter estimates, we calculated a kind of univariate confidence interval for all parameter estimates. This interval is determined by the range of values that would result in a fitness deterioration of at most 10% compared to optimal fitness.
Since elimination of drugs is mainly determined by numbers of circulating granulocytes (for example, 15, 17, 18, 19, 35, 36, 37, among others), measured granulocyte counts have been linearly interpolated and imprinted into the PK model. This approach lead to a model that predicts G‐CSF plasma concentrations when G‐CSF scheduling and granulocyte time course is known.
Differential equations and simulations have been implemented in the mathematical software package MATLAB 7.5.0.342 with SIMULINK toolbox (The MathWorks Inc., Natick, MA, USA).
Results
Experimental data
Time series data for healthy mice can be found in Fig. 1. Application of both derivatives resulted in strong granulocytosis, which quickly diminished 24 h after the last filgrastim application but continued with pegfilgrastim until day 5, where cell counts had been normalized. Over‐compensation of granulocytosis could be recognized for filgrastim but not for pegfilgrastim. Filgrastim plasma concentration fluctuated quickly between applications, while pegfilgrastim plasma concentration remained high for a plateau phase of approximately 2 days then dropped quickly afterwards.
Figure 1.
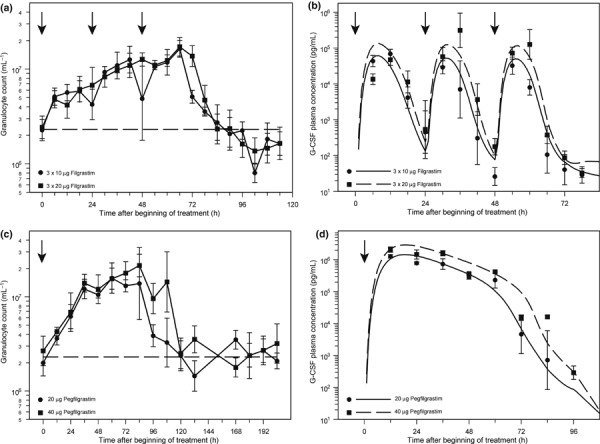
Application of granulocyte colony‐stimulating factor (G‐CSF, arrows) into healthy mice. Data are presented as geometric mean and standard deviation, dotted line for granulocyte counts marks the normal value. Note that time scales are different between the figures: (a) granulocyte dynamics after application of 3 × 10 μg and 3 × 20 μg filgrastim on consecutive days; (b) comparison of corresponding plasma concentrations of filgrastim (data points) with predictions of the pharmacokinetic model (lines); (c) granulocyte dynamics after application of a single dose of 20 or 40 μg of pegfilgrastim; and (d) comparison of plasma concentrations of pegfilgrastim (data points) with predictions of the pharmacokinetic model (lines).
Data of G‐CSF plasma concentration and granulocyte counts in mice with cyclophosphamide‐induced granulocytopaenia are presented in Fig. 2. Depth and duration of the granulocytopaenic phase depended heavily on G‐CSF scheduling used. Schedules 4 × 10 μg filgrastim at day 1 or 40 μg pegfilgrastim at day 1 showed lowest granulotoxicity. Over‐compensation of granulocytopaenia was found for all pegfilgrastim schedules and for filgrastim day 2, but not for the other filgrastim schedules. Detailed analysis of haematotoxicity of all schedules can be found elsewhere (38).
Figure 2.
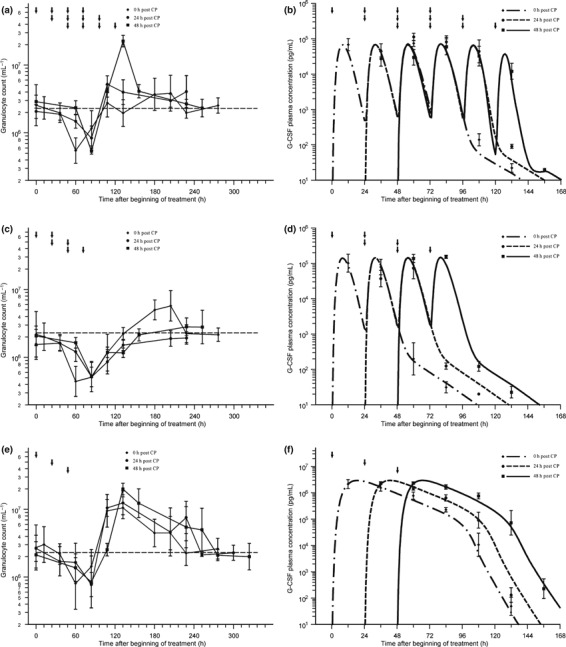
Application of granulocyte colony‐stimulating factor (G‐CSF) into mice with cyclophosphamide‐induced granulocytopaenia (12 mg cyclophosphamide at day 0). Data are presented as geometric mean and standard deviation; dotted line for granulocyte counts marks the normal value; arrows indicate G‐CSF injections: (a,b) granulocyte data (a), filgrastim plasma concentrations (data points) and corresponding pharmacokinetic (PK) model predictions (lines) for scheduling 4 × 10 μg on consecutive days starting directly, 1 day or 2 days after cyclophosphamide application (b); (c,d) granulocyte data (c), filgrastim plasma concentrations (data points) and corresponding PK model predictions (lines) for scheduling 2 × 20 μg on consecutive days starting directly, 1 or 2 days after cyclophosphamide application (d); (e,f) granulocyte data (e), pegfilgrastim plasma concentrations (data points) and corresponding PK model predictions (lines) for a single dose of 40 μg directly, 1 or 2 days after cyclophosphamide application (f).
PK model
The following compartments were considered in the model: subcutaneous tissue in which drugs were injected, the central compartment representing blood plasma in which drugs are detectable, and a peripheral compartment where drugs are temporarily removed from the central compartment (for example, due to protein binding) (39). Dynamics of G‐CSF plasma concentrations can be modelled by fluxes between these compartments and degradation processes also. The basic structure of the model can be found in Fig. 3.
Figure 3.

Schematic structure of the pharmacokinetic model for filgrastim and pegfilgrastim. Compartments and model equations are explained in the text.
Major features of the model are delayed influx from subcutaneous tissue to the central compartment, which is modelled by a gamma‐distributed absorption kinetics, represented by a fixed number of delay compartments (see Scholz et al. for further details (32)), non‐specific elimination from the central compartment (renal clearance) modelled by a first‐order elimination, specific elimination from the central compartment which is proportional to both, absolut granulocyte count and a Michaelis‐Menten term as well and exchange between central and peripheral compartments modelled by a first‐order transition (reversible protein binding). More specifically, these properties have been transformed into an ordinary differential equation system describing the change of compartment contains over time. The system has the following form, starting with the subcutaneous tissue:
| (1) |
| (2) |
The subcutaneous compartment is divided into N identical sub‐compartments to model lag of influx of drugs into the central compartment, resulting in a gamma‐distributed lag time with expectation N/k sc and variance N/k 2 sc (compare Scholz et al. (32)). We chose N = 5 but changing k sc adequately; a number of sub‐compartments between 2 and 10 would also result in good model fits (not shown). G‐CSF is injected in the first sub‐compartment, which can be modelled by an injection function Rate, which is positive and constant during injection time t inj and zero elsewhere.
The equation for the central compartment has the form:
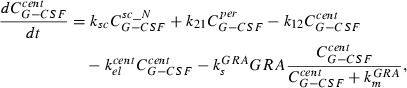 |
(3) |
where the first summand on the right‐hand side is influx from the subcutaneous compartment. The second and the third summands describe exchange of drugs between central and peripheral compartments modelled by a first‐order transition ( influx from peripheral to central,
  efflux from central to peripheral compartment). The fourth summand is the model for first‐order non‐specific (renal) elimination of the drugs and the fifth term is specific degradation mediated by granulocyte count GRA. This mechanism is modelled by Michaelis‐Menten elimination kinetics. Content of the central compartment
  is divided by distribution volume (vol) in order to compare model predictions with measured G‐CSF plasma concentrations.
The equation for the peripheral compartment has the simple form:
| (4) |
which only describes a first‐order transition between central and peripheral compartments.
Initial values of all equations are zero.
Model fitting resulted in an excellent fit of all scenarios with granulocytopaenic mice and also the data set of healthy mice (1, 2).
An overview of all model parameters and quantities can be found in Table 1. All fitted parameters showed good identifiability indicated by narrow confidence intervals. Hence, there are no redundant parameters in the model and precision of all parameters is high.
Table 1.
Quantities of the pharmacokinetic (PK) model for both filgrastim and pegfilgrastim, type, unit and explanation of all quantities. Furthermore, PK parameter estimates are presented for both filgrastim and pegfilgrastim based on fitting the PK model to data. In parentheses are confidence intervals for all fitted parameters (see materials and methods section). Parameter estimates were compared between the drugs
| Symbol | Type | Unit | Explanation | Fitted value for filgrastim | Fitted value for pegfilgrastim | Relation between parameter estimates |
|---|---|---|---|---|---|---|

|
Function of time to be calculated | μg | Contains of the sub‐compartments of the subcutaneous tissue | – | – | – |

|
Function of time to be calculated | μg | Contain of the central compartment (plasma concentration) | – | – | – |

|
Function of time to be calculated | μg | Contain of the peripheral compartment | – | – | – |
| Rate | Given function of time | μg/h | Applied dose per hour, the area of this function equals the total dose applied | – | – | – |
| t inj | Constant | h | Injection time (not fitted) | 1/6 | 1/6 | – |
| N | Constant | – | Number of sub‐compartments in subcutaneous tissue (not fitted) | 5 | 5 | – |
| k sc | Parameter | 1/h | Transition between subcutaneous sub‐compartments | 0.74 (0.68, 0.79) | 0.32 (0.29, 0.35) | Greater for filgrastim |
| vol | Parameter | ml | Volume of distribution | 44 (35, 51) | 1.5 (1.3, 1.8) | Greater for Filgrastim |
| k 12 | Parameter | 1/h | Transition from central to peripheral compartment | 2.3e‐3 (1.6e‐3, 3.1e‐3) | 0.85 (0.82, 0.90) | Less important for filgrastim than for pegfilgrastim |
| k 21 | Parameter | 1/h | Transition from peripheral to central compartment | 0.057 (0.046, 0.077) | 0.25 (0.24, 0.26) | |
| k el cent | Parameter | 1/h | Unspecific (renal) elimination | 0.33 (0.29,0.36) | 0.25 (0.24,0.26) | Greater for filgrastim |
| k s GRA | Parameter | μg/h | Specific elimination via granulocytes (G‐CSF receptors or neutrophil elastase) | 6.2e‐5 (4.6e‐5, 7.6e‐5) | 6.0e‐6 (5.5e‐6, 6.5e‐6) | See Fig. 4 |
| k m GRA | Parameter | μg | Michaelis‐Menten constant of specific elimination | 0.82 (0.60, 1.24) | 0.016 (0.013, 0.020) | |
| GRA | Given function of time | – | Number of circulating granulocytes in 106/L | – | – | – |
In comparison to filgrastim, we estimated that pegfilgrastim has an approximately double transition time through subcutaneous tissue. Furthermore, distribution volume and the non‐specific elimination are lower for pegfilgrastim; estimated maximum specific elimination is also lower for pegfilgrastim. Additionally, specific elimination of pegfilgrastim appeared to be saturated much more quickly than elimination of filgrastim. Corresponding Michaelis‐Menten kinetics are displayed in Fig. 4. Finally, protein binding was estimated to be less important for filgrastim than for pegfilgrastim (lower transition coefficients for filgrastim).
Figure 4.

Comparison of estimated specific elimination between filgrastim and pegfilgrastim. Absolute amount of granulocyte colony‐stimulating factor (G‐CSF) eliminated by granulocytes. True elimination rate is obtained after multiplying specific elimination with the actual number of granulocytes in 106/L. Elimination of pegfilgrastim is saturated for small amounts of G‐CSF while filgrastim elimination is saturated later and is higher.
Discussion
Here, we have constructed a biomathematical PK model for two pharmaceutical G‐CSF derivatives (filgrastim and pegfilgrastim) in healthy and in granulocytopaenic mice. The model fits well to data obtained by a series of mouse experiments with close meshed time series of G‐CSF plasma concentration. Since the same model structure is used for both derivatives, differences in model parameters allow comparisons of important PK properties between the two drug derivatives. Additionally, the model allows prediction of the time course of the G‐CSF derivatives when G‐CSF scheduling, and the resulting granulocyte time courses are available. Thus, it is not fully data independent at this stage, but it is a first step towards a fully data independent combined PK and PD model, which is under development.
Understanding of PK properties of G‐CSF and its derivatives is crucial in order to guarantee optimal G‐CSF prophylaxis, in several chemotherapy situations. Because of the strong relationship between G‐CSF‐induced granulocytosis and chemotherapy‐induced granulocytopaenia, and the relationship between number of granulocytes and degradation of G‐CSF, it is difficult to optimize G‐CSF treatment empirically. Therefore, we aim to provide biomathematical models of granulopoiesis under G‐CSF and chemotherapy in order to allow predictions about optimal G‐CSF schedules.
The most frequently used pharmaceutical G‐CSF derivatives are filgrastim and pegfilgrastim. In the last few years, there has been a clear clinical trend towards replacement of multiple filgrastim injections by a single pegfilgrastim injection. Nevertheless, we believe that filgrastim will not disappear completely from clinical practice as it can be applied more individually and flexibly, which can be specially important in the case of dose‐dense chemotherapies with cycle duration of 14 days (40).
A first step of our modelling approach has been to construct this PK model of the derivatives filgrastim and pegfilgrastim in mice. The model is based on physiologically plausible assumptions that were translated into ordinary differential equations. It consists of three compartments that represent subcutaneous tissue in which the drugs were injected, the central compartment in which plasma concentration of the drug is measured, and a peripheral compartment of drugs characterizing reversible processes of temporary elimination of G‐CSF from the central compartment (for example by protein binding; see Kuwabara et al. (39)). Occurrence of maximum drug concentration in the blood is clearly delayed after subcutaneous injection, which could be caused, for example, by lymphatic absorption (41). Hence, transition between subcutaneous tissue and the central compartment has been modelled by five identical sub‐compartments of the subcutaneous compartment, resulting in a gamma‐like distribution of transit time (32). Transition between central and peripheral compartments is a two‐way first‐order kinetic representing reversibility of this process (42). The drug is irreversibly eliminated from the central compartment by two independent processes, non‐specific elimination of the drug via renal clearance, modelled by a first‐order kinetic (16, 22, 42, 43) and specific degradation of the drug saturated by Michaelis‐Menten kinetics and proportional to the number of circulating granulocytes (18, 21, 42, 44, 45, 46, 47). Other authors (for example Stute et al. (43)) proposed a pure first‐order elimination kinetic of (non‐glycosylated) G‐CSF, which is a special case of Michaelis‐Menten kinetics. However, confidence intervals of our model parameter estimates revealed a clearly saturated specific elimination kinetic. Specific degradation is mediated by G‐CSF receptor binding and internalization (15, 18, 21, 37, 48, 49) or neutrophil elastase (17, 19, 35, 36). We assumed proportionality with respect to granulocytes since neutrophil elastase is mainly produced by neutrophils (17). Implicitly, we also assumed proportionality of G‐CSF receptor‐mediated clearance with the number of granulocytes, which might be only roughly correct because of a large number of G‐CSF receptors in bone marrow and spleen (9, 50), and different dynamic behaviour of bone marrow and circulating granulocytes during the course of therapy (31, 32). Since time course of bone marrow is not available to that extent, this limitation of the model can only be resolved later by a full PK/PD model of granulopoiesis under G‐CSF and chemotherapy, including the bone marrow dynamics. However, we will need additional experimental data, especially with respect to the effect of chemotherapy to bone marrow dynamics for such a model. As a consequence, we have to imprint the time course of granulocytes and can only predict the time course of G‐CSF plasma concentrations at this stage of modelling.
Since the parameters of the model are unknown, we estimated them by fitting the model to experimental data. To obtain reliable estimates, especially with respect to the specific degradation kinetic, it is necessary to have close meshed time series data of granulocytes and G‐CSF plasma concentrations under both granulocytotic and granulocytopenic conditions and under various G‐CSF dosing and timing schedules as well. Although the application of G‐CSF and its derivatives has been investigated extensively in the literature (e.g. 51, 52, 53, 54, 55, 56, among others), we were unable to find appropriate published data that fulfil all of the requirements above. Therefore, it was necessary to perform our own experiments designed under the viewpoint of model requirements.
We obtained a good agreement between model and data for all experimental results. We were able to characterize PK properties of filgrastim and pegfilgrastim on the basis of a small set of different model parameters. We estimated that filgrastim would be absorbed more quickly by the central compartment than pegfilgrastim, according to experimental results (23, 57, 58). Additionally, we estimated that filgrastim has a higher distribution volume and accordingly has lower protein binding affinity than pegfilgrastim. Elimination kinetics of filgrastim and pegfilgrastim has been analysed in detail. In agreement with results from the literature, we estimated that filgrastim has both higher non‐specific elimination and higher specific degradation (25). The latter includes both higher saturation of pegfilgrastim elimination and higher maximum elimination of filgrastim as well. This might be due to reduced receptor binding affinity of pegylated G‐CSF or hydrophilic properties of pegylation (58, 59, 60, 61). Additional evidence for this mechanism has been collected by experiments with newly developed G‐CSF derivative, Maxy‐G34 (Maxygen Inc., Redwood City, CA, USA). Maxy‐G34 has more pegylation groups compared to pegfilgrastim. With the same model approach presented in this paper, we were able to show that Maxy‐G34 has specific degradation even lower than that for pegfilgrastim (62).
Our model as presented is not the first attempt to construct a PK model of filgrastim, pegfilgrastim or other G‐CSF derivatives. Kuwabara et al. (42) proposed a PK model of lenograstim with the same degradation mechanisms, in order to estimate bioavailability. Sarkar and Lauffenburger (47) proposed a PK/PD model of G‐CSF derivatives, including a model of G‐CSF action at the cellular level. Wang et al. (63) developed a PK/PD model of filgrastim in healthy volunteers and Roskos et al. (64) constructed a similar PK/PD model of pegfilgrastim again for healthy volunteers. Yang et al. (25) constructed a PK model of filgrastim and pegfilgrastim application in healthy and nephrectomized rats without modelling the direct influence of granulocyte‐mediated clearance and Vainstein et al. (65) proposed a PK/PD model of filgrastim application in healthy humans. Foley and Mackey (66) developed a theory for delay differential equations models of granulopoiesis under chemotherapy and G‐CSF treatment. In an earlier study, we have constructed a PK/PD model of filgrastim in healthy and chemotherapy‐treated humans (32), but so far, there is no PK model of both filgrastim and pegfilgrastim studied under granulocytotic and granulocytopaenic conditions. In our opinion, the study of PK properties of filgrastim and pegfilgrastim under granulocytopaenic conditions is crucial in order to construct future models that can be used for therapy optimization. Additionally, in comparison to other models (25, 63), our model is based on unique parameter setting which is constant for all doses and therapy schedules considered. In our opinion, this property is important in order to make predictions about schedules not yet tested.
Although physiologically plausible, concrete PK parameter estimates of our model would require validation by further experiments. As proof of principle we have been able to show that the preliminary human PK model of filgrastim proposed in Scholz et al. (32) could be translated to data of normal and cyclophosphamide‐induced neutropenic mice, treated with either filgrastim or pegfilgrastim, in different schedules. Further validation of this translational approach will be provided by modelling data from rats treated with pegfilgrastim or Maxy‐G34 (62). Therefore, the model structure presented here was not derived by formal mathematical optimization criteria but by both physiological assumptions and former or ongoing modelling work, in other species or other applications as well.
In the next step of our work, we plan to develop a full PK and PD model in the murine situation, which specially accounts for bone marrow effects of combined G‐CSF and chemotherapy treatment. Therefore, a series of experiments will be performed to generate the data required for modelling (especially time series of bone marrow changes during chemotherapy, with or without G‐CSF stimulation). In our opinion, it is necessary to construct a rigorous PK/PD model in the mouse situation first, for which bone marrow data are experimentally available and to translate the model later to the human situation for which only clinical data of peripheral cell counts are available. We aim to translate the murine model to the human situation later by keeping identified model mechanisms constant but changing model parameters for which the present paper is the proof of principle.
The resulting models will allow quantitative predictions about time course of bone marrow cell stages, circulating blood cells and cytokine concentrations for chemotherapeutic regimens not yet tested. Systematic model simulations of variable therapy parameters can lead to predictions concerning, for example, optimal application schedules of haematopoietic growth factors. Thus, the present paper is only a step in our systems‐biology approach to construct a rigorous model of granulopoiesis under chemotherapy and G‐CSF application, which allows optimization of G‐CSF therapy, by systematic model simulations.
Acknowledgements
We would like to thank Ms Silke Lehnert very much for technical assistance. This research has been funded by a junior research grant of the Medical Faculty of the University of Leipzig (formel‐1 project).
M.K. and M.S. designed the study. M.A. and M.K. performed the experiments. M.S. and C.E. constructed the pharmacokinetic model. M.S. wrote the paper. F.E. and M.L. contributed to the paper writing. All authors read and approved the final version of the manuscript.
References
- 1. Blayney DW, McGuire BW, Cruickshank SE, Johnson DH (2005) Increasing chemotherapy dose density and intensity: phase I trials in non‐small cell lung cancer and non‐Hodgkin’s lymphoma. Oncologist 10, 138–149. [DOI] [PubMed] [Google Scholar]
- 2. Dale D (2003) Current management of chemotherapy‐induced neutropenia: the role of colony‐stimulating factors. Semin. Oncol. 30, 3–9. [DOI] [PubMed] [Google Scholar]
- 3. Kuderer NM, Dale DC, Crawford J, Cosler LE, Lyman GH (2006) Mortality, morbidity, and cost associated with febrile neutropenia in adult cancer patients. Cancer 106, 2258–2266. [DOI] [PubMed] [Google Scholar]
- 4. Schwenkglenks M, Jackisch C, Constenla M, Kerger JN, Paridaens R, Auerbach L, Bosly A, Pettengell R, Szucs TD, Leonard R (2006) Neutropenic event risk and impaired chemotherapy delivery in six European audits of breast cancer treatment. Support Care Cancer 14, 901–909. [DOI] [PubMed] [Google Scholar]
- 5. Siena S, Secondino S, Giannetta L, Carminati O, Pedrazzoli P (2003) Optimising management of neutropenia and anaemia in cancer chemotherapy‐advances in cytokine therapy. Crit. Rev. Oncol. Hematol. 48, S39–S47. [DOI] [PubMed] [Google Scholar]
- 6. Wunderlich A, Kloess M, Reiser M, Rudolph C, Truemper L, Bittner S, Schmalenberg H, Schmits R, Pfreundschuh M, Loeffler M, German High‐Grade Non‐Hodgkin’s Lymphoma Study Group (DSHNHL) (2003) Practicability and acute haematological toxicity of 2‐ and 3‐weekly CHOP and CHOEP chemotherapy for aggressive non‐Hodgkin’s lymphoma: results from the NHL‐B trial of the German High‐Grade Non‐Hodgkin’s Lymphoma Study Group (DSHNHL). Ann. Oncol. 14, 881–893. [DOI] [PubMed] [Google Scholar]
- 7. Crawford J (2002) Pegfilgrastim administered once per cycle reduces incidence of chemotherapy‐induced neutropenia. Drugs 62(Suppl. 1), 89–98. [DOI] [PubMed] [Google Scholar]
- 8. Begley CG, Nicola NA, Metcalf D (1988) Proliferation of normal human promyelocytes and myelocytes after a single pulse stimulation by purified GM‐CSF or G‐CSF. Blood 71, 640–645. [PubMed] [Google Scholar]
- 9. Christopher MJ, Link DC (2007) Regulation of neutrophil homeostasis. Curr. Opin. Hematol. 14, 3–8. [DOI] [PubMed] [Google Scholar]
- 10. Colotta F, Re F, Polentarutti N, Sozzani S, Mantovani A (1992) Modulation of granulocyte survival and programmed cell death by cytokines and bacterial products. Blood 80, 2012–2020. [PubMed] [Google Scholar]
- 11. Kim HK, De La Luz Sierra M, Williams CK, Gulino AV, Tosato G (2006) G‐CSF down‐regulation of CXCR4 expression identified as a mechanism for mobilization of myeloid cells. Blood 108, 812–820. [DOI] [PMC free article] [PubMed] [Google Scholar]
- 12. Lord BI, Bronchud MH, Owens S, Chang J, Howell A, Souza L, Dexter TM (1989) The kinetics of human granulopoiesis following treatment with granulocyte colony‐stimulating factor in vivo . Proc. Natl. Acad. Sci. USA 86, 9499–9503. [DOI] [PMC free article] [PubMed] [Google Scholar]
- 13. Mackey MC, Aprikyan AA, Dale DC (2003) The rate of apoptosis in post mitotic neutrophil precursors of normal and neutropenic humans. Cell Prolif. 36, 27–34. [DOI] [PMC free article] [PubMed] [Google Scholar]
- 14. Souza LM, Boone TC, Gabrilove J, Lai PH, Zsebo KM, Murdock DC, Chazin VR, Bruszewski J, Lu H, Chen KK, Barendt J, Platzer E, Moore MAS, Mertelsmann R, Welte K. (1986) Recombinant human granulocyte colony‐stimulating factor: effects on normal and leukemic myeloid cells. Science 232, 61–65. [DOI] [PubMed] [Google Scholar]
- 15. Borleffs JC, Bosschaert M, Vrehen HM, Schneider MM, Van Strijp J, Small MK, Borkett KM (1998) Effect of escalating doses of recombinant human granulocyte colony‐stimulating factor (filgrastim) on circulating neutrophils in healthy subjects. Clin. Ther. 20, 722–736. [DOI] [PubMed] [Google Scholar]
- 16. Bronchud MH, Potter MR, Morgenstern G, Blasco MJ, Scarffe JH, Thatcher N, Crowther D, Souza LM, Alton NK, Testa NG, Dexter TM (1988) In vitro and in vivo analysis of the effects of recombinant human granulocyte colony‐stimulating factor in patients. Br. J. Cancer 58, 64–69. [DOI] [PMC free article] [PubMed] [Google Scholar]
- 17. El Ouriaghli F, Fujiwara H, Melenhorst JJ, Sconocchia G, Hensel N, Barrett AJ (2003) Neutrophil elastase enzymatically antagonizes the in vitro action of G‐CSF: implications for the regulation of granulopoiesis. Blood 101, 1752–1758. [DOI] [PubMed] [Google Scholar]
- 18. Ericson SG, Gao H, Gericke GH, Lewis LD (1997) The role of polymorphonuclear neutrophils (PMNs) in clearance of granulocyte colony‐stimulating factor (G‐CSF) in vivo and in vitro . Exp. Hematol. 25, 1313–1325. [PubMed] [Google Scholar]
- 19. Hunter MG, Druhan LJ, Massullo PR, Avalos BR (2003) Proteolytic cleavage of granulocyte colony‐stimulating factor and its receptor by neutrophil elastase induces growth inhibition and decreased cell surface expression of the granulocyte colony‐stimulating factor receptor. Am. J. Hematol. 74, 149–155. [DOI] [PubMed] [Google Scholar]
- 20. Khwaja A, Carver J, Jones HM, Paterson D, Linch DC (1993) Expression and dynamic modulation of the human granulocyte colony‐stimulating factor receptor in immature and differentiated myeloid cells. Br. J. Haematol. 85, 254–259. [DOI] [PubMed] [Google Scholar]
- 21. Kotto‐Kome AC, Fox SE, Lu W, Yang BB, Christensen RD, Calhoun DA (2004) Evidence that the granulocyte colony‐stimulating factor (G‐CSF) receptor plays a role in the pharmacokinetics of G‐CSF and PegG‐CSF using a G‐CSF‐R KO model. Pharmacol. Res. 50, 55–58. [DOI] [PubMed] [Google Scholar]
- 22. Tanaka H, Tokiwa T (1990) Influence of renal and hepatic failure on the pharmacokinetics of recombinant human granulocyte colony‐stimulating factor (KRN8601) in the rat. Cancer Res. 50, 6615–6619. [PubMed] [Google Scholar]
- 23. Crawford J (2002a) Clinical uses of pegylated pharmaceuticals in oncology. Cancer Treat. Rev. 28(Suppl. A), 7–11. [DOI] [PubMed] [Google Scholar]
- 24. Tanaka H, Satake‐Ishikawa R, Ishikawa M, Matsuki S, Asano K (1991) Pharmacokinetics of recombinant human granulocyte colony‐stimulating factor conjugated to polyethylene glycol in rats. Cancer Res. 51, 3710–3714. [PubMed] [Google Scholar]
- 25. Yang BB, Lum PK, Hayashi MM, Roskos LK (2004) Polyethylene glycol modification of filgrastim results in decreased renal clearance of the protein in rats. J. Pharm. Sci. 93, 1367–1373. [DOI] [PubMed] [Google Scholar]
- 26. Grigg A, Solal‐Celigny P, Hoskin P, Taylor K, McMillan A, Forstpointner R, Bacon P, Renwick J, Hiddemann W (2003) Open‐label, randomized study of pegfilgrastim vs. daily filgrastim as an adjunct to chemotherapy in elderly patients with non‐Hodgkin’s lymphoma. Leuk. Lymphoma 44, 1503–1508. [DOI] [PubMed] [Google Scholar]
- 27. Holmes FA, Jones SE, O’Shaughnessy J, Vukelja S, George T, Savin M, Richards D, Glaspy J, Meza L, Cohen G, Dhami M, Budman DR, Hackett J, Brassard M, Yang BB, Liang BC (2002) Comparable efficacy and safety profiles of once‐per‐cycle pegfilgrastim and daily injection filgrastim in chemotherapy‐induced neutropenia: a multicenter dose‐finding study in women with breast cancer. Ann. Oncol. 13, 903–909. [DOI] [PubMed] [Google Scholar]
- 28. Pinto L, Liu Z, Doan Q, Bernal M, Dubois R, Lyman G (2007) Comparison of pegfilgrastim with filgrastim on febrile neutropenia, grade IV neutropenia and bone pain: a meta‐analysis of randomized controlled trials. Curr. Med. Res. Opin. 23, 2283–2295. [DOI] [PubMed] [Google Scholar]
- 29. Schippinger W, Holub R, Dandachi N, Bauernhofer T, Samonigg H (2006) Frequency of febrile neutropenia in breast cancer patients receiving epirubicin and docetaxel/paclitaxel with colony‐stimulating growth factors: a comparison of filgrastim or lenograstim with pegfilgrastim. Oncology 70, 290–293. [DOI] [PubMed] [Google Scholar]
- 30. Ziepert M, Schmits R, Trumper L, Pfreundschuh M, Loeffler M (2008) Prognostic factors for hematotoxicity of chemotherapy in aggressive non‐Hodgkin’s lymphoma. Ann. Oncol. 19, 752–762. [DOI] [PubMed] [Google Scholar]
- 31. Engel C, Scholz M, Loeffler M (2004) A computational model of human granulopoiesis to simulate the hematotoxic effects of multicycle polychemotherapy. Blood 104, 2323–2331. [DOI] [PubMed] [Google Scholar]
- 32. Scholz M, Engel C, Loeffler M (2005) Modelling human granulopoiesis under poly‐chemotherapy with G‐CSF support. J. Math. Biol. 50, 397–439. [DOI] [PubMed] [Google Scholar]
- 33. Scholz M, Engel C, Loeffler M (2006) Model‐based design of chemotherapeutic regimens that account for heterogeneity in leucopoenia. Br. J. Haematol. 132, 723–735. [DOI] [PubMed] [Google Scholar]
- 34. Schwefel HP (1984) Evolution strategies: a family of nonlinear optimization techniques based on imitating some principles of organic evolution. Ann. Oper. Res. 1, 65–167. [Google Scholar]
- 35. Falanga A, Marchetti M, Evangelista V, Manarini S, Oldani E, Giovanelli S, Galbusera M, Cerletti C, Barbui T (1999) Neutrophil activation and hemostatic changes in healthy donors receiving granulocyte colony‐stimulating factor. Blood 93, 2506–2514. [PubMed] [Google Scholar]
- 36. Levesque JP, Takamatsu Y, Nilsson SK, Haylock DN, Simmons PJ (2001) Vascular cell adhesion molecule‐1 (CD106) is cleaved by neutrophil proteases in the bone marrow following hematopoietic progenitor cell mobilization by granulocyte colony‐stimulating factor. Blood 98, 1289–1297. [DOI] [PubMed] [Google Scholar]
- 37. Shimazaki C, Uchiyama H, Fujita N, Araki S, Sudo Y, Yamagata N, Ashihara E, Goto H, Inaba T, Haruyama H. (1995) Serum levels of endogenous and exogenous granulocyte colony‐stimulating factor after autologous blood stem cell transplantation. Exp. Hematol. 23, 1497–1502. [PubMed] [Google Scholar]
- 38. Scholz M, Ackermann M, Emmrich F, Loeffler M, Kamprad M (2009) Effectiveness of cytopenia prophylaxis for different Filgrastim and Pegfilgrastim schedules in a chemotherapy mouse model. Biologics 3, 27–37. [PMC free article] [PubMed] [Google Scholar]
- 39. Kuwabara T, Uchimura T, Takai K, Kobayashi H, Kobayashi S, Sugiyama Y (1995) Saturable uptake of a recombinant human granulocyte colony‐stimulating factor derivative, nartograstim, by the bone marrow and spleen of rats in vivo . J. Pharmacol. Exp. Ther. 273, 1114–1122. [PubMed] [Google Scholar]
- 40. Ishiguro H, Kitano T, Yoshibayashi H, Toi M, Ueno T, Yasuda H, Yanagihara K, Garbo CL, Fukushima M (2008) Prolonged neutropenia after dose‐dense chemotherapy with pegfilgrastim. Ann. Oncol. 19, 1019; author reply 1019–1020. [DOI] [PubMed] [Google Scholar]
- 41. Kota J, Machavaram KK, McLennan DN, Edwards GA, Porter CJ, Charman SA (2007) Lymphatic absorption of subcutaneously administered proteins: influence of different injection sites on the absorption of darbepoetin alfa using a sheep model. Drug Metab. Dispos. 35, 2211–2217. [DOI] [PubMed] [Google Scholar]
- 42. Kuwabara T, Kobayashi S, Sugiyama Y (1996) Pharmacokinetics and pharmacodynamics of a recombinant human granulocyte colony‐stimulating factor. Drug Metab. Rev. 28, 625–658. [DOI] [PubMed] [Google Scholar]
- 43. Stute N, Santana VM, Rodman JH, Schell MJ, Ihle JN, Evans WE (1992) Pharmacokinetics of subcutaneous recombinant human granulocyte colony‐stimulating factor in children. Blood 79, 2849–2854. [PubMed] [Google Scholar]
- 44. Kuwabara T, Kato Y, Kobayashi S, Suzuki H, Sugiyama Y (1994) Nonlinear pharmacokinetics of a recombinant human granulocyte colony‐stimulating factor derivative (nartograstim): species differences among rats, monkeys and humans. J. Pharmacol. Exp. Ther. 271, 1535–1543. [PubMed] [Google Scholar]
- 45. Kuwabara T, Uchimura T, Kobayashi H, Kobayashi S, Sugiyama Y (1995) Receptor‐mediated clearance of G‐CSF derivative nartograstim in bone marrow of rats. Am. J. Physiol. 269, E1–E9. [DOI] [PubMed] [Google Scholar]
- 46. Layton JE, Hockman H, Sheridan WP, Morstyn G (1989) Evidence for a novel in vivo control mechanism of granulopoiesis: mature cell‐related control of a regulatory growth factor. Blood 74, 1303–1307. [PubMed] [Google Scholar]
- 47. Sarkar CA, Lauffenburger DA (2003) Cell‐level pharmacokinetic model of granulocyte colony‐stimulating factor: implications for ligand lifetime and potency in vivo . Mol. Pharmacol. 63, 147–158. [DOI] [PubMed] [Google Scholar]
- 48. Steinman RA, Tweardy DJ (1994) Granulocyte colony‐stimulating factor receptor mRNA upregulation is an immediate early marker of myeloid differentiation and exhibits dysfunctional regulation in leukemic cells. Blood 83, 119–127. [PubMed] [Google Scholar]
- 49. Tkatch LS, Rubin KA, Ziegler SF, Tweardy DJ (1995) Modulation of human G‐CSF receptor mRNA and protein in normal and leukemic myeloid cells by G‐CSF and retinoic acid. J. Leukoc. Biol. 57, 964–971. [DOI] [PubMed] [Google Scholar]
- 50. Demetri GD, Griffin JD (1991) Granulocyte colony‐stimulating factor and its receptor. Blood 78, 2791–2808. [PubMed] [Google Scholar]
- 51. Barrios L, Poletti OH (2005) Effects of filgrastim on granulopoietic cells of mice pretreated with methotrexate. Biocell 29, 7–14. [PubMed] [Google Scholar]
- 52. Bauhofer A, Celik I, Plaul U, Wulf H, Torossian A (2004) Effects of G‐CSF and antibiotic prophylaxis in a 2 × 2 factorial design on outcome in septic rats. Inflamm. Res. 53(Suppl. 2), S126–S129. [DOI] [PubMed] [Google Scholar]
- 53. Lord BI, Woolford LB, Molineux G (2001) Kinetics of neutrophil production in normal and neutropenic animals during the response to filgrastim (r‐metHu G‐CSF) or filgrastim SD/01 (PEG‐r‐metHu G‐CSF). Clin. Cancer Res. 7, 2085–2090. [PubMed] [Google Scholar]
- 54. Misaki M, Ueyama Y, Tsukamoto G, Matsumura T (1998) Timing of recombinant human granulocyte colony‐stimulating factor administration on neutropenia induced by cyclophosphamide in normal mice. Br. J. Cancer 77, 884–889. [DOI] [PMC free article] [PubMed] [Google Scholar]
- 55. Molineux G, Kinstler O, Briddell B, Hartley C, McElroy P, Kerzic P, Sutherland W, Stoney G, Kern B, Fletcher FA, Cohen A, Korach E, Ulich T, McNiece I, Lockbaum P, Miller‐Messana MA, Gardner S, Hunt T, Schwab G (1999) A new form of filgrastim with sustained duration in vivo and enhanced ability to mobilize PBPC in both mice and humans. Exp. Hematol. 27, 1724–1734. [DOI] [PubMed] [Google Scholar]
- 56. Yankelevich M, Goodell MA, Kaplan J (2008) Efficacy of delayed administration of post‐chemotherapy granulocyte colony‐stimulating factor: evidence from murine studies of bone marrow cell kinetics. Exp. Hematol. 36, 9–16. [DOI] [PMC free article] [PubMed] [Google Scholar]
- 57. Molineux G (2003) Pegfilgrastim: using pegylation technology to improve neutropenia support in cancer patients. Anticancer Drugs 14, 259–264. [DOI] [PubMed] [Google Scholar]
- 58. Waladkhani AR (2004) Pegfilgrastim: a recent advance in the prophylaxis of chemotherapy‐induced neutropenia. Eur. J. Cancer Care (Engl.) 13, 371–379. [DOI] [PubMed] [Google Scholar]
- 59. Harris JM, Chess RB (2003) Effect of pegylation on pharmaceuticals. Nat. Rev. Drug Discov. 2, 214–221. [DOI] [PubMed] [Google Scholar]
- 60. Sarkar CA, Lowenhaupt K, Wang PJ, Horan T, Lauffenburger DA (2003) Parsing the effects of binding, signaling, and trafficking on the mitogenic potencies of granulocyte colony‐stimulating factor analogues. Biotechnol. Prog. 19, 955–964. [DOI] [PubMed] [Google Scholar]
- 61. Veronese FM, Mero A (2008) The impact of PEGylation on biological therapies. BioDrugs 22, 315–329. [DOI] [PubMed] [Google Scholar]
- 62. Scholz M, Engel C, Apt D, Sankar SL, Goldstein E, Loeffler M. Pharmacokinetic and Pharmacodynamic modelling of the novel human G‐CSF derivative Maxy‐G34 and Pegfilgrastim in the rat. Cell Proliferation (in press) [DOI] [PMC free article] [PubMed] [Google Scholar]
- 63. Wang B, Ludden TM, Cheung EN, Schwab GG, Roskos LK (2001) Population pharmacokinetic‐pharmacodynamic modeling of filgrastim (r‐metHuG‐CSF) in healthy volunteers. J. Pharmacokinet Pharmacodyn. 28, 321–342. [DOI] [PubMed] [Google Scholar]
- 64. Roskos LK, Lum P, Lockbaum P, Schwab G, Yang BB (2006) Pharmacokinetic/pharmacodynamic modeling of pegfilgrastim in healthy subjects. J. Clin. Pharmacol. 46, 747–757. [DOI] [PubMed] [Google Scholar]
- 65. Vainstein V, Ginosar Y, Shoham M, Ranmar DO, Ianovski A, Agur Z (2005) The complex effect of granulocyte colony‐stimulating factor on human granulopoiesis analyzed by a new physiologically‐based mathematical model. J. Theor. Biol. 234, 311–327. [DOI] [PubMed] [Google Scholar]
- 66. Foley C, Mackey MC (2008) Mathematical model for G‐CSF administration after chemotherapy. J. Theor. Biol. 257, 27–44. [DOI] [PubMed] [Google Scholar]